80
2018

2018

Table of Contents Executive Summary ....................................................................................................................................... 3
Efficiency Goals ................................................................................................................................. 4
Evaluation and Selection of Efficiency Measures and Programs ...................................................... 5
Implementation Plan, Monitoring, Evaluation, and Revision ........................................................... 5
Introduction and Background ....................................................................................................................... 6
Service Area Characteristics .............................................................................................................. 6
Water Efficiency Planning ............................................................................................................... 10
Chapter 1: Profile of Thornton Water Supply System ................................................................................ 15
1.1 Overview of Existing Water Supply System .............................................................................. 15
1.2 Water Supply Reliability, System Limitations, and Future Needs ............................................. 18
1.3 Water Costs and Pricing ............................................................................................................ 29
Chapter 2: Profile of Water Demands and Historical Demand Management ............................................ 30
2.1 Historical Water Demands ........................................................................................................ 30
2.2 Past and Current Demand Management Activities and Impact to Demands ........................... 35
2.3 Demand Forecasts ..................................................................................................................... 40
Chapter 3: Water Efficiency Goals and Activities........................................................................................ 43
3.1 Water Efficiency Goals .............................................................................................................. 43
3.2 Summary of Selection Process .................................................................................................. 44
3.3 Demand Management Activities .............................................................................................. 48
3.4 Water Efficiency Impacts on Demand Forecasts and Supply Planning ..................................... 63
Chapter 4: Implementation and Monitoring Plan ...................................................................................... 66
4.1 Implementation Plan................................................................................................................. 66
4.1 Water Wise Landscaping Task Force ......................................................................................... 70
4.2 Plan Review, Monitoring, Evaluation, and Update ................................................................... 71
Appendix A: Raw Water Map ...................................................................................................................... 75
Appendix B: Thornton Water Service Area ................................................................................................. 76
Appendix C: 2016 WaterWise Landscape Task Force Implementation Plan .............................................. 77

3 T h o r n t o n W a t e r E f f i c i e n c y P l a n
Executive Summary
The city of Thornton has historically maintained one of the lowest residential daily per capita water consumption rates among cities in the Front Range. This is a result of numerous efforts that Thornton has pursued to create and instill solid water conservation ethic throughout the community. The Water Efficiency Plan outlined in this document builds upon the successes of the past by pursuing strategies to promote water efficient technologies and help change customer water use behaviors over the long-term. In addition, this Water Efficiency Plan will provide assistance to customers in the form of education and incentives designed to promote increased water use efficiencies.
This Water Efficiency Plan establishes long-term water efficiency goals that encourage efficient use of available water resources and reduce the amount of additional water needed to serve existing and future customers, while maintaining a high-quality urban environment. The Water Efficiency Plan provides guidance in planning water efficiency programs consistent with the City’s water resources management strategy and with community values. This plan replaces the 2009 Water Conservation Plan that was approved by the Colorado Water Conservation Board (CWCB) and fulfills the requirements of the State of Colorado Water Conservation Act of 2004 (HB 1365) by following the guidance provided by the CWCB.
Keys to Success The Water Efficiency Plan establishes a vision of how Thornton will achieve greater water use efficiency. As such, high expectations are placed on each department, division, and employee to help implement the plan and achieve greater water savings. One key to the success of this plan is cross-departmental cooperation, which is necessary to make improved water use efficiency a priority and a reality. The second key to the success of this plan is the continued support of the community to embrace the city’s water use efficiency program as they have historically done.
Sustainability Connections with Water Efficiency While the focus of this plan is on water efficiency, it is important to point out the larger connection that water demand management in the city of Thornton has with sustainability and climate change that will help make our planet a better place for future generations. Saving water saves energy. Conserving water leads to less energy being used to treat water at the treatment plant and pump water through the distribution system. In addition, saving energy saves water. Most of the nation’s electric power plans use water for cooling purposes in the power generation process. Increasing energy efficiency reduces the amount of water needed for energy production. Therefore, for every gallon of water that is saved, the benefits are leveraged into other areas that ultimately help reduce our community’s greenhouse gas emissions and combat climate change.
Sustainable Development Water efficiency measures play an important role in sustainable development. Installation of ultra-efficient plumbing fixtures and low-water use landscapes during the construction phase is a cost-effective way to achieve water savings in commercial and residential developments. The Water Efficiency Plan
proposes programs to encourage sustainable development.

4 T h o r n t o n W a t e r E f f i c i e n c y P l a n
Foster Partnerships Developing partnerships is, and will continue to be, a very valuable component of the city’s water efficiency programs. After all, the success of this program ultimately hinges on the partnerships the city cultivates with the citizens of our community to help achieve the goals set out in this plan. In addition to partnering with our individual citizens, exploring partnerships with corporate, non-profit, governmental and community organizations to help leverage awareness of water use efficiency can assist with the effectiveness of the water efficiency programs.
Efficiency Goals Thornton recognizes that water efficiency is an essential component of the city’s long-term water supply planning strategy. Through investment in water efficiency programs, Thornton can reduce the amount of water that the city must ultimately acquire or develop in order to meet its build-out demand. The water efficiency goals were established with this in mind and are intended to benefit both the city and its customers.
New programs will be brought on-line at an aggressive pace with one new program being implemented each year through 2024. These initiatives will target all customer classes. This plan will achieve over 1,000 AF of savings annually by 2024 in addition to the estimated 1,500 AF saved annually by existing programs for a total of 2,500 AF of annual savings. To put these water savings in perspective, the City can supply 5,000 typical single-family residences, respectively, with 2,500 AF of water
The 2009 Water Conservation Plan set a goal of establishing residential water use at 85 gallons per capita day (gpcd) or less, based upon a five-year rolling average, by 2016. This goal was met, demonstrating a 20% decrease when compared to 106 gpcd usage during the pre-drought year of 2001 and prior to the enactment of water use restrictions. Most of the programs that helped achieve this goal will continue to be implemented through 2024. New programs that focus on landscape, irrigation and commercial water efficiency will be implemented 2017 through 2024.
Current Water Efficiency Activities The City of Thornton has had efficiency measures and programs in place for many years. The following list includes Thornton’s current water efficiency activities. Currently Implemented:
Residential, Commercial and Multi-Family Toilet Rebates
Residential Washing Machine Rebates
Residential and Commercial Smart Irrigation Controller Rebates
Residential and Commercial Rain Sensor Rebates
Residential and Commercial Sprinkler System Consultations
Residential Home Water Consultations
Public Outreach, Festivals, Presentations, Youth Education, etc.
Thornton Water Efficiency Outreach Initiative
Water Restrictions (as needed)
City Code, includes Conservation of Water Resources (Water waste is always prohibited)
Tiered Rate Billing Structure
Landscape Codes Incorporating Water Wise Principles
Automatic Irrigation System Inspections
Colorado Water Wise Council Participation
5 T h o r n t o n W a t e r E f f i c i e n c y P l a n
Leak Repair on Distribution System
Reusable Water Rights Operations
Water Line Replacement Program
City Property Water Efficiency Programs
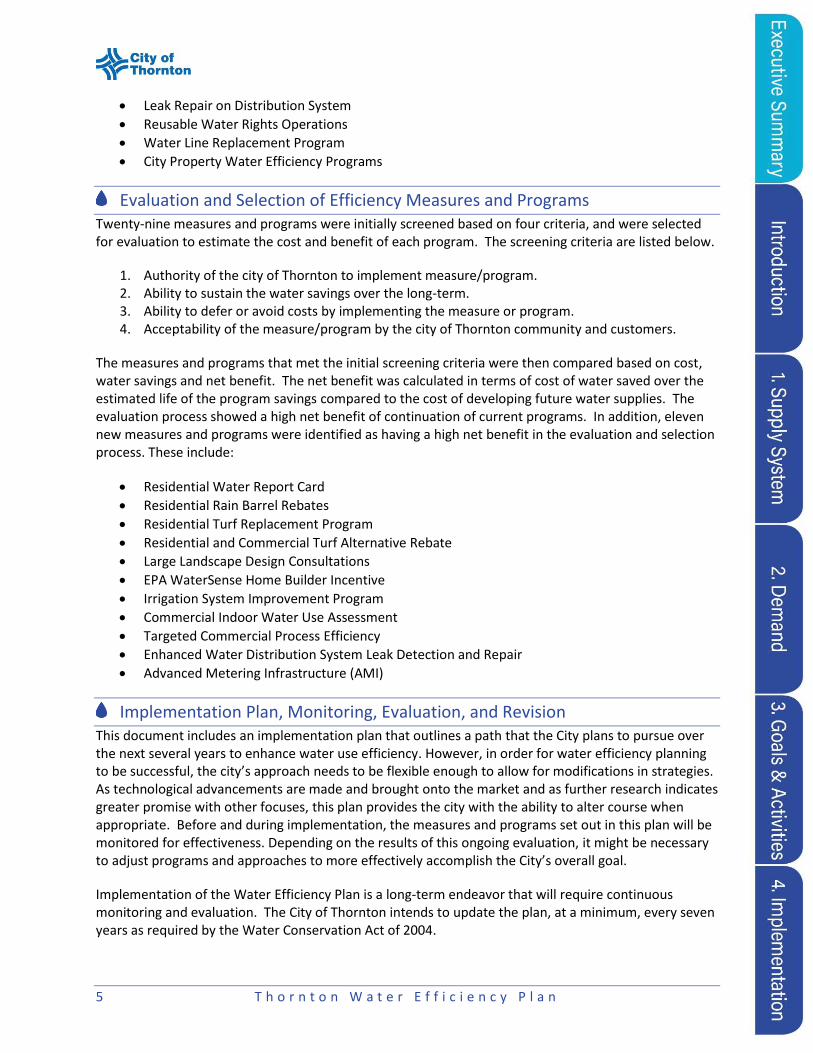
Evaluation and Selection of Efficiency Measures and Programs Twenty-nine measures and programs were initially screened based on four criteria, and were selected for evaluation to estimate the cost and benefit of each program. The screening criteria are listed below.
1. Authority of the city of Thornton to implement measure/program. 2. Ability to sustain the water savings over the long-term. 3. Ability to defer or avoid costs by implementing the measure or program. 4. Acceptability of the measure/program by the city of Thornton community and customers.
The measures and programs that met the initial screening criteria were then compared based on cost, water savings and net benefit. The net benefit was calculated in terms of cost of water saved over the estimated life of the program savings compared to the cost of developing future water supplies. The evaluation process showed a high net benefit of continuation of current programs. In addition, eleven new measures and programs were identified as having a high net benefit in the evaluation and selection process. These include:
Residential Water Report Card
Residential Rain Barrel Rebates
Residential Turf Replacement Program
Residential and Commercial Turf Alternative Rebate
Large Landscape Design Consultations
EPA WaterSense Home Builder Incentive
Irrigation System Improvement Program
Commercial Indoor Water Use Assessment
Targeted Commercial Process Efficiency
Enhanced Water Distribution System Leak Detection and Repair
Advanced Metering Infrastructure (AMI)
Implementation Plan, Monitoring, Evaluation, and Revision This document includes an implementation plan that outlines a path that the City plans to pursue over the next several years to enhance water use efficiency. However, in order for water efficiency planning to be successful, the city’s approach needs to be flexible enough to allow for modifications in strategies. As technological advancements are made and brought onto the market and as further research indicates greater promise with other focuses, this plan provides the city with the ability to alter course when appropriate. Before and during implementation, the measures and programs set out in this plan will be monitored for effectiveness. Depending on the results of this ongoing evaluation, it might be necessary to adjust programs and approaches to more effectively accomplish the City’s overall goal.
Implementation of the Water Efficiency Plan is a long-term endeavor that will require continuous monitoring and evaluation. The City of Thornton intends to update the plan, at a minimum, every seven years as required by the Water Conservation Act of 2004.

6 T h o r n t o n W a t e r E f f i c i e n c y P l a n
Introduction and Background
This section summarizes the key characteristics of the city of Thornton relevant to the water system including: the geographic area served, demographic information, and other key characteristics of the service area. This section also outlines the importance of water efficiency planning, some of the key trends in integrated planning, and the role of this Water Efficiency Plan in other planning initiatives currently taking place in the city of Thornton.
Service Area Characteristics
Boundaries The city of Thornton water and wastewater service area is approximately 39 square miles and extends from the Boulder Turnpike on the south to 168th Avenue on the north, from roughly Zuni Street on the west to Yosemite Street on the east. The service area includes portions of unincorporated Adams County consisting of the Western Hills, Sherrelwood, Welby, Holly Crossing, and Wright Farms neighborhoods. A map of Thornton in relation to the greater metropolitan area is provided in Figure 1. A map of Thornton’s 2016 water service area is included in Appendix B.
Demographics According to the U.S. Census, the city of Thornton’s population was estimated to be 133,451 in 2015. Thornton’s existing water supply system serves a population of 148,591 – an estimated 131,761 people residing within the city’s corporate boundaries and 16,830 people in the extended service area. In addition, the city provides water service to 763 commercial, industrial, and institutional customers, as well as 681 irrigation accounts, including treated and raw water. Thornton further provides bulk treated water deliveries to the city of Westminster.
Figure 1. Location of Thornton, Colorado

7 T h o r n t o n W a t e r E f f i c i e n c y P l a n
At buildout, the city currently estimates it will provide water service to 258,830 people. This represents an increase of 63% over the 2015 population served. This efficiency plan covers the period from 2015 – 2024. As Thornton continues to grow, it is estimated that the service area population could approach 168,434 by the end of this planning period with an average annual growth rate of 1.57%. However, over recent years, Thornton’s average annual growth rate, as shown in Table 1, has slowed. From 2008 through 2014, the annual growth rate was slightly less than 1% when compared to the previous five-year period, 2002 through 2007, which experienced 3.3% growth. Note, the 6.56% growth rate in 2015 is artificially high due to the city aligning population counts with third party population estimates produced by the U.S. Census and the Colorado State Demographers office. However, improving economic conditions also played a role.
As of 2015, there were 38,220 metered connections to Thornton’s treated water system. Residential customers, including single- and multi-family, are the largest customer class connected to the city’s treated water system, making up 96% of total water connections. Figure 2 shows the city’s service connections by service type in 2015.
Figure 2. Service Connections by Service Type, 2015
Of the city’s total service connections, 86% are within Thornton’s municipal corporate boundary (Figure 3). From 2010 to 2015 the number of accounts served by the city of Thornton increased 3.4% from 36,959 to 38,205. The number of connections in Thornton’s extended service area is static, with no changes since 2009.
Residential, single-family
87%
Residential, multi-family
9%
Commercial2%
Irrigation2%
Table 1. Yearly Rate of Growth, 2002-2015
Year Growth Rate
2002-2007 3.29%
2008 1.54%
2009 0.97%
2010 0.65%
2011 0.64%
2012 0.89%
2013 1.18%
2014 0.82%
2015 6.56% Source: City of Thornton, City Development Department

8 T h o r n t o n W a t e r E f f i c i e n c y P l a n
Figure 3. Service Connections, Inside vs. Outside City, 2015
Thornton’s service area includes residences, businesses, schools, parks, and open space. Most of the existing service area consists of residential development. As Thornton continues to grow, development projections are an integral part of planning for the future needs of the community. Projected growth spans as far south as 120th Avenue and north to State Highway 7, along Quebec Street. The focus of the growth will be single family and multifamily housing located along the Quebec Street corridor and North Metro Rail Line. In terms of commercial development, it is projected to occur along the I-25 corridor and E-470 in the northwest portion of the service area. There are significant areas within the service area that remain undeveloped.
Housing Most of the existing service area consists of residential development. In 2015, there were 46,443 housing units in Thornton, of which single-family dwellings (detached and attached) made up the largest portion at 76% (Figure 4). Since 2008, residential unit growth has continued, although not at the unconstrained rate of the early 2000s. Of the available housing stock, 67% of housing were built prior 2000.
Future growth trends indicate single-family housing outpacing multifamily and manufactured housing. In the near term, single-family detached is likely to see the highest number of new units. Longer term, Thornton’s housing mix is projected to shift to a more balanced housing stock of single-family and multifamily dwellings. Factors influencing growth include regional migratory patterns, the future RTD North Metro line, and housing market growth indicators.
Inside City86%
Outside City14%

9 T h o r n t o n W a t e r E f f i c i e n c y P l a n
Figure 4. Thornton’s Housing Distribution, 2015
Business and Economy The city of Thornton has over 186,236 jobs1 across all industry sectors. The major employment sectors include Life Sciences, Built Environment, and Professional Business Services. Table 2 displays the top 10 employers2 in Thornton. Industries that have seen growth since 2010 are agriculture and resources, education and health, and the arts and entertainment. These areas are anticipated to continue to grow as Thornton develops over the coming years. In many cases, residents are employed outside of Thornton. Comparatively, resident median household income in Thornton is 3% higher than the Denver metro area at $66,1603.
Table 2. Top 10 Employers in the City of Thornton
Employer Product/ Service # of Employees
Adams 12 Five Star Schools K-12 Education 3,203 City of Thornton City Government 1,123 North Suburban Medical Center Hospital 767 American Furniture Warehouse Retail Trade 538 Dish Network Call Center 500 King Soopers Grocery Stores 450 Wal-Mart Stores Retail Trade 411 The Home Depot Retail Trade 361 Avaya Telecommunications Technology 300 AMI Mechanical Commercial Mechanical Contractor 250
1 http://www.businessinthornton.com/Data-Demographics/Employment-Wage.aspx 2 http://www.businessinthornton.com/Data-Demographics/Major-Employers.aspx 3 https://factfinder.census.gov/faces/nav/jsf/pages/community_facts.xhtml
Single-family (detached)
62%
Multi-family17%
Single-family (attached)
14%
Manufactured 7%
Year End 2015 Thornton Housing & Population Report

10 T h o r n t o n W a t e r E f f i c i e n c y P l a n
Water Efficiency Planning
Why a Water Efficiency Plan? This Water Efficiency Plan is an update to the city of Thornton’s Water Conservation Plan adopted in 2009. The Colorado Water Conservation Board (CWCB) requires that a water utility provider develop or update their plan every 7 years in accordance with the latest guidelines. Thornton recognizes that water efficiency is an essential component of the city’s long-term water supply planning strategy. Projected demands without water efficiency savings exceed the projected firm yield of the water system in 2022-2025. Through water efficiency, Thornton can reduce the amount of water that the city must ultimately acquire or develop to meet its build-out demand while maintaining quality of life standards. The current and proposed water efficiency programs in this Plan will be crucial in balancing water supply and demand during those years and will create a buffer for unknown factors that could affect water supply in the future. Water efficiency can also lead to significant cost savings and reduce overall resource use (e.g., energy, water). The water efficiency goals in this Plan were developed with this in mind, and are intended to benefit both the city and its customers. A continued desire of the city of Thornton is to create a legacy of strong water efficiency and conservation ethics for the benefit of current and future generations.
Colorado’s Water Plan Colorado’s Water Plan was adopted by the Colorado Water Conservation Board on November 16, 2016. The plan took almost three years to draft and included over 30,000 public comments. The final plan serves as a roadmap for the collaborative and sustainable management of the State’s water supply. A key objective of the state plan is to reduce the projected 2050 municipal and industrial water supply gap from 560,000 acre-feet to zero acre-feet by 2030. Municipal water efficiency strategies are an important element of the plan as municipal and industrial water efficiency goals aim to reduce water use 400,000 acre-feet by 2050.
Thornton recognizes its role in responsibly managing its water supply and is invested in long-term water efficiency strategies that align with the State’s goals. This Water Efficiency Plan illustrates Thornton’s ongoing commitment to be good community steward of a precious natural resource.
Integrated Planning and Water Efficiency Land Use and Water Efficiency Nexus Amidst limited water supplies, changing climatic conditions, and growing community support for more sustainable water management, the traditionally siloed approach to land use and water planning is being re-evaluated. In many cases, the water sector is not involved in land use planning or development processes, resulting in pressures on existing water resources.
Image 1. Commercial Efficiency Image 2. Water-Wise Landscaping

11 T h o r n t o n W a t e r E f f i c i e n c y P l a n
Alternatively, when water utilities are involved in land use planning and development decision making, the best approach to water supply management can be implemented. Development and redevelopment offer an opportunity for the water sector, regulatory agencies, and the land use and development community to better coordinate efforts and achieve mutually beneficial goals. Thus, land use planning can encourage water efficient land use patterns through urban growth boundaries, infill development parameters and densities, housing type requirements, open space preservation, and green infrastructure. These greater water efficiencies then translate to efficiency and diversification of supply. Thornton recognizes the importance of linking land use to water efficiency by aligning this water efficiency plan with the objectives and goals outlined in the city’s Comprehensive Plan.
Water and Energy Efficiency Nexus The connections and interdependencies of water and energy systems are often referred to as the “water energy nexus”. Water is used in all phases of energy production and electricity generation. In Colorado, power plants consume approximately 64,000 acre-feet annually.4 Most of the water consumed is used to cool and condense steam in a thermoelectric power plant. Likewise, energy is used in the pumping, heating, and treating of water for diverse uses. An estimated 13% of the United States’ energy use is embedded in water use.5 Therefore, a synergistic relationship exists between water and energy resources, particularly around efficiency. One approach already capitalizing on this relationship is energy policy. New, clean energy policies in Colorado are reducing the energy generation sector’s water needs. Another approach is the integration of water and energy into joint efficiency programs. As the need for more efficiency is growing, utilities are implementing joint water and energy efficiency programs to curb demand at a reduced cost. For example, Xcel Energy offers an energy-efficient showerheads demand side management program, reducing both water use and the amount of energy to heat the water, which translates to co-benefits for the consumer and Xcel Energy. As part of the implementation of this Plan, Thornton plans to develop a stronger relationship with Xcel Energy and identify opportunities for collaboration and alignment of program offerings.
4 Nuding, A. 2013. “Conservation Synergy: The Case for Integrating Water and Energy Efficiency Programs.” Western Resource Advocates. http://westernresourceadvocates.org/publications/conservation-synergy/. 5 Sanders, K. and M. Webber. 2012. “Evaluating the Energy Consumed for Water Use in the United States.” Environmental Research Letters 7(3):1-11. https://utexas.influuent.utsystem.edu/en/publications/evaluating-the-energy-consumed-for-water-use-in-the-united-states.
12 T h o r n t o n W a t e r E f f i c i e n c y P l a n
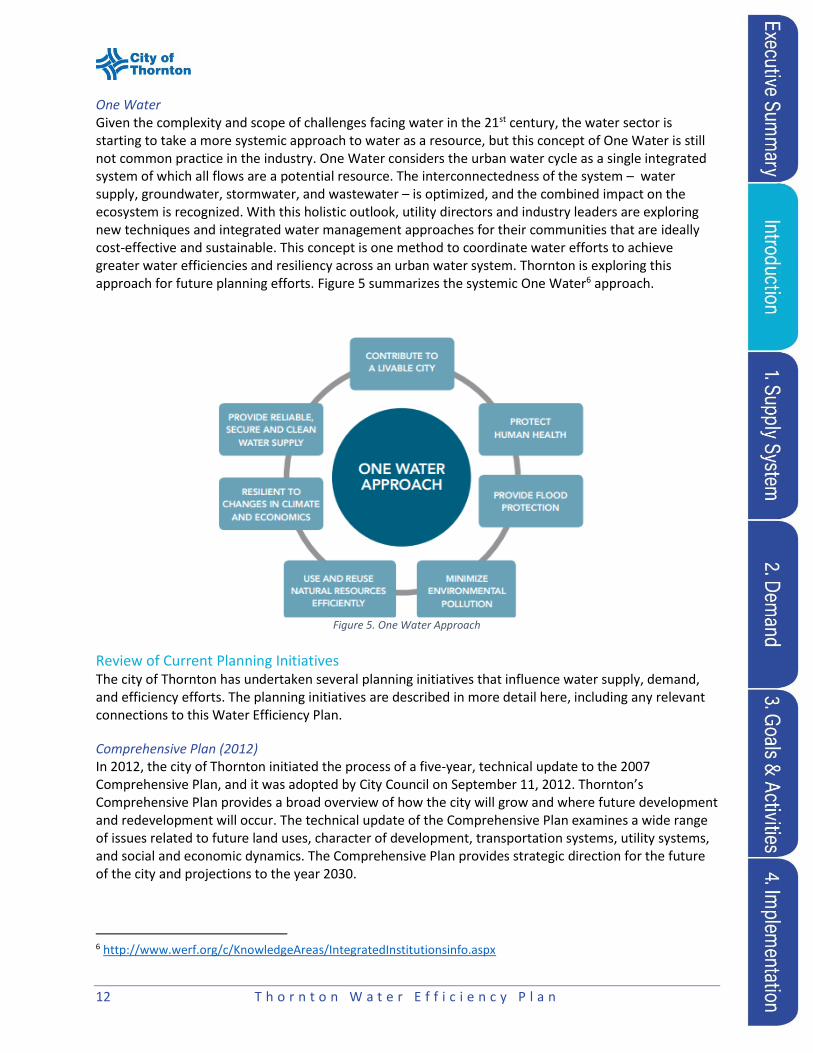
One Water Given the complexity and scope of challenges facing water in the 21st century, the water sector is starting to take a more systemic approach to water as a resource, but this concept of One Water is still not common practice in the industry. One Water considers the urban water cycle as a single integrated system of which all flows are a potential resource. The interconnectedness of the system – water supply, groundwater, stormwater, and wastewater – is optimized, and the combined impact on the ecosystem is recognized. With this holistic outlook, utility directors and industry leaders are exploring new techniques and integrated water management approaches for their communities that are ideally cost-effective and sustainable. This concept is one method to coordinate water efforts to achieve greater water efficiencies and resiliency across an urban water system. Thornton is exploring this approach for future planning efforts. Figure 5 summarizes the systemic One Water6 approach.
Review of Current Planning Initiatives The city of Thornton has undertaken several planning initiatives that influence water supply, demand, and efficiency efforts. The planning initiatives are described in more detail here, including any relevant connections to this Water Efficiency Plan.
Comprehensive Plan (2012) In 2012, the city of Thornton initiated the process of a five-year, technical update to the 2007 Comprehensive Plan, and it was adopted by City Council on September 11, 2012. Thornton’s Comprehensive Plan provides a broad overview of how the city will grow and where future development and redevelopment will occur. The technical update of the Comprehensive Plan examines a wide range of issues related to future land uses, character of development, transportation systems, utility systems, and social and economic dynamics. The Comprehensive Plan provides strategic direction for the future of the city and projections to the year 2030.
6 http://www.werf.org/c/KnowledgeAreas/IntegratedInstitutionsinfo.aspx
Figure 5. One Water Approach

13 T h o r n t o n W a t e r E f f i c i e n c y P l a n
Different components of Thornton’s water system are addressed within the Comprehensive Plan. Section 4, Transportation and Utilities, discusses the city’s water and wastewater utilities focused on key infrastructure challenges, such as water efficiency, as Thornton continues to grow and develop. Appendix A in the Plan provides an overview of the hazards and other concerns known to exist within and near Thornton to ensure the safety of the community and the preservation of the environment, many of which are water-related. The most recent Comprehensive Plan can be obtained from the city Development Department.
Capital Improvement Plan The Capital Improvements Plan is an implementation document of Thornton’s Comprehensive Plan with the city budget. The Plan is informed by the Capital Improvement Program that provides for cost-effective design and construction of capital projects. The city maintains a five-year plan, updated annually. Projects include improvements to transportation, water, storm, and sanitary sewer systems.
Drought Management Plan The city of Thornton Drought Management Plan, adopted and last amended in 2002, helps the city prepare for the onset and severity of drought and respond aptly to ensure that basic health and safety needs of customers are met during a drought. The Drought Management Plan complements this Water Efficiency Plan, helping the city to achieve overall efficient and prudent use of the city’s water resources over the short- and long-terms. To achieve this goal, drought management actions, drought mitigation strategies, public information strategies, and relevant background information is provided.
Parks and Open Space Master Plan The city of Thornton is currently in the process of updating the 2012 Parks and Open Space Master Plan. The Plan establishes goals, objectives, and recommendations and implementation strategies for citywide and regional parks, trails, and open space planning. The Plan also serves as a supplemental document to the Thornton Comprehensive Plan. Water is integrated into many of the goals and policies to enhance Thornton’s environmental and natural resources, recreation, and visual appeal.
Development Applications All work completed in the city must be performed in accordance with the most recent version of Thornton’s Standards and Specifications for the design and construction of public and private improvements. Standards and Specifications provide a certain minimum of materials and methods that must be met for the design of a given project. Those relating to the many facets of water include: Section 200: Water System Standards; Section 300: Sanitary Sewer System Standards; Section 400: Storm Drainage Design; Grading; and Water Quality Technical Criteria; and Section 800: Landscape Improvement.
Water and Wastewater Systems Master Plan Updated in 2010, the Water and Wastewater Systems Master Plan for the city of Thornton examines the city’s existing water and wastewater utilities, projected water and wastewater flows, and proposes strategies to help the city meet future demand for its water and wastewater utility infrastructure. It also provides direction to achieve the goals and objectives outlined in the Comprehensive Plan for the city’s water and wastewater utilities.
South Platte Basin Implementation Plan The city of Thornton is a part of the South Platte River Basin. The South Platte Basin Implementation Plan identifies the needs, challenges, and potential solutions for water issues facings the South Platte

14 T h o r n t o n W a t e r E f f i c i e n c y P l a n
River Basin in Colorado. The Plan was developed to meet the projected water supply needs of all within the basin. It is also a contributing document of Colorado’s Water Plan7, the state’s first water plan.
Thornton Water Climate Vulnerability Assessment Two reports were released in 2015 on the topic of climate change in Colorado. These reports prompted Thornton to further investigate the vulnerability of its water supply to climate change and global warming. Many conclusions and recommendations came out of this investigation, outlined in the Thornton Water Climate Vulnerability Assessment 2015. This is the first document which prompts greater consideration for planning to account for climate change and the potential vulnerabilities and resiliency of Thornton’s water system.
7 For more information, visit: https://www.colorado.gov/cowaterplan
Image 3. Standley Lake Drought

15 T h o r n t o n W a t e r E f f i c i e n c y P l a n
Chapter 1:
Profile of Thornton Water Supply System
This section summarizes the key characteristics of the city of Thornton’s water system as it existed in 2015. Included are descriptions of key facilities and water sources, water supply reliability and limitations, and water costs and pricing.
1.1 Overview of Existing Water Supply System
Raw Water Supplies – Surface Water The city maintains a significant portfolio of water rights associated with its ownership of stock in several ditch and reservoir companies. The city also owns several water rights it has developed since the 1970’s. The priorities of the water rights that Thornton relies upon for its water supplies range from the early 1860’s to 2000’s. The water associated with these water rights is delivered into storage at several reservoirs owned by the city and into reservoirs where the city shares ownership with other entities. Thornton’s raw water supply originates primarily in the form of melting snow high in the mountains of the South Platte River and Clear Creek basins.
Thornton has acquired and developed substantial reservoir storage capacity to store water diverted from its water rights. As of September 2016, Thornton has 41,826 acre-feet of storage capacity on-line within its system. A summary of Thornton reservoir storage capacity can be found in Table 3.
Cooley East Reservoir is an additional reservoir that is near completion and will ultimately be used as an exchange reservoir. This reservoir, and the necessary infrastructure to deliver water into it, are expected to be completed in 2018. The estimated storage capacity of the reservoir is 2,800 acre-feet.
For Thornton’s operational purposes, the Clear Creek basin is divided into upper and lower systems. Water from the upper system is delivered into storage at Standley Lake from the Farmers’ High Line Canal and the Croke Canal. The water stored in Standley Lake is conveyed to the Thornton Water Treatment Plant through an eleven-mile pipeline.
Table 3. Thornton Reservoir Storage Capacity
Reservoir Storage Capacity (acre-feet)
Standley Lake 11,832
West Gravel Lake No. 1 503
West Gravel Lake No. 2 1,723
West Gravel Lake No. 3 614
Brannan West 168
Brannan East 340
South Tani 7,241
East Gravel Lake No. 4 2,807
South Dahlia 1,777
North Dahlia 2,568
East Sprat Platte 1,526
West Cooley 4,282
Hammer 2,116
Rogers 2,212
Duck Lake 378
Wellington 1,739
Total 41,826

16 T h o r n t o n W a t e r E f f i c i e n c y P l a n
Water from the lower system is delivered into storage at Brannan Lakes and at the West Gravel Lakes from the Lower Clear Creek Canal and the Colorado Agricultural Canal. The water stored in Brannan Lakes can be pumped back into the Lower Clear Creek Canal and conveyed to the West Gravel Lakes for storage. The water stored in the West Gravel Lakes is pumped to the Wes Brown Water Treatment Plant.
Thornton’s South Platte River basin system consists of a series of interconnected reservoirs located along the South Platte River which store water delivered primarily from the Burlington Canal. Thornton’s reservoirs that take delivery of water conveyed through the Burlington Canal are South Tani Reservoir, East Gravel Lake No. 4, South Dahlia Reservoir, North Dahlia Reservoir, East Sprat Platte Reservoir. These reservoirs are all connected through a series of pipes. The water stored in these reservoirs is pumped to the Wes Brown Water Treatment Plant from East Gravel Lake No. 4. Improvements to the Cooley West
Reservoir Complex and the West Sprat Platte Reservoir are currently under development, which will interconnect these reservoirs with Thornton’s reservoirs supplied by the Burlington Canal. The Cooley West Reservoir complex can also be filled with water delivered from the Lower Clear Creek Canal. A pump station at Cooley West Reservoir can return water to the South Platte River to operate exchanges. Water stored in Cooley West Reservoir can also be pumped back up to East Gravel Lake No. 4 where it can be pumped to the Wes Brown Water Treatment Plant.
Additional components of the South Platte River basin system are Duck Lake and Wellington Reservoir, both of which are located high in the mountains. Duck Lake is on Geneva Creek and Wellington
Image 4. Headgate

17 T h o r n t o n W a t e r E f f i c i e n c y P l a n
Reservoir is on Buffalo Creek. Water stored in these reservoirs is then released and conveyed down the South Platte River where Thornton recaptures it at the Burlington Canal. A map of Thornton’s raw water system can be found in Appendix A.
Water stored in Standley Lake can be delivered to the East Gravel Lake No. 4 through a pipeline from the Thornton Water Treatment Plant. Water stored in East Gravel Lake No. 4 can be pumped through a pipeline to the Thornton Water Treatment Plant. Thornton also provides the city-owned Thorncreek Golf Course with raw water delivered from Big Dry Creek.
Raw Water Supplies – Groundwater Thornton has developed a series of alluvial wells adjacent to the South Platte River. There are a total of fifteen wells that pump groundwater into the city’s reservoirs. There eleven wells at South Dahlia Reservoir, and one well at East Gravel Lake No. 4.
Thornton has constructed six non-tributary groundwater wells that supply water for park irrigation at Community Park, Grange Creek Park, and the city’s sports fields at the Margaret W. Carpenter Recreation Center.
Treated Water Facilities Thornton operates two water treatment plants that have a combined capacity of 70 million gallons per day (mgd). The Wes Brown Water Treatment Plant, located at 3651 East 86th Avenue, has a capacity of 50 mgd. The Thornton Water Treatment Plant, located at 9420 Ellen Court, has a capacity of 20 mgd. The service area contains approximately 530 miles of water lines that distribute treated water to customers. Thornton shares interconnections with the treated water systems of Denver Water, City of Northglenn, and the City of Westminster. The interconnections with Denver Water and the City of Northglenn are for emergency situations. The City of Westminster is a wholesale treated water customer for the city of Thornton and the interconnection serves as the single delivery point to Westminster.
Image 5. Water Treatment Staff Image 6. Water Quality Analyst

18 T h o r n t o n W a t e r E f f i c i e n c y P l a n
1.2 Water Supply Reliability, System Limitations, and Future Needs
Risks to the city’s water supply reliability lie more in the areas of infrastructure and water quality than in securing adequate water sources. Thornton owns adequate supply to meet projected demands while reliably meeting present needs and potential vulnerabilities. Water rights have been acquired to meet projected demands through the estimated build-out of the city in 2065. However, the infrastructure to deliver this water supply still needs to be built and remains a risk. The city has conducted extensive planning for short- and long-term strategies to deal with adverse conditions caused by droughts. Climate change implications are beginning to be incorporated into planning efforts. Water quality of the supply also is a concern. Each of these three risks, as well as steps being taken by the city to address them, are described in more detail in the following sections. Table 4, below, summarizes Thornton’s water supply system reliability, limitations, and future needs.
Table 4. Summary Table of System Reliability, Limitations, and Future Needs
Water Supply Focus Area
Description Means of Addressing Limitation or Need
Designated Critical Water Supply Shortage
The city’s water supplies come from the South Platte Basin which has been identified as a gap area in the Statewide Water Supply Initiative.
The city has acquired sufficient reliable water rights to meet anticipated demands at full build-out.
Aging Infrastructure An aging distribution system contributes to non-account water due to leaks.
The city has a leak detection and pipeline replacement program that is systematically replacing distribution pipes.
Drought Planning and Response
Thornton is in a geographic area that experiences periods of drought that must be planned for and mitigated when they do occur.
Long term planning, including climate change vulnerability assessments, allows Thornton to ensure that enough reliable water supplies are available to meet demands even in stress years. The city’s Drought Management Plan is used to mitigate the impacts drought has on the city’s water supplies.
Image 7. Denver Skyline from Clarifiers
19 T h o r n t o n W a t e r E f f i c i e n c y P l a n
System Infrastructure Improvements & Additions
New infrastructure will be needed to connect existing parts of the Thornton Water Project supply to the city’s system. Infrastructure was damaged in the 2013 floods.
The Thornton Water Project delivery infrastructure additions will meet this need. Flood damage repairs are ongoing.
Water Quality Water quality in the South Platte Basin fluctuates, causing water treatment challenges.
Thornton has invested in state-of-the-art water treatment technologies. Meeting water quality requirements is an ongoing task that requires constantly adapting to changing inputs from source water bodies.
Water Supplies Through a combination of long-term planning, drought planning, and proactive acquisition of adequate water rights, the city of Thornton does not anticipate substantial risks associated with available water supplies.
Designated Critical Water Supply Area The South Platte basin, where Thornton’s water supplies originate, has been identified as a “gap” area by the 2010 Statewide Water Supply Initiative (SWSI), meaning that even with all the water supply projects identified there will still be a significant shortage of regional water supplies by the year 2030. However, the city of Thornton has acquired sufficient and reliable water rights to supply anticipated demands through build-out. The city still needs to construct the infrastructure to deliver the water to treatment facilities, and until the projects are completed, this continues to be a risk for the city’s water supply. Thornton will continue its development efforts to meet future demands by 2030 and beyond.
Long-Term Planning To estimate the firm yield that is needed from the city’s water supply to meet demand during times of extreme drought, the city planning process involves the use of a drought of record from the 1950s that is assumed to last three years. Thornton has developed a computer model to estimate the minimum firm yield required from of its raw water system over time. As Thornton’s infrastructure expands, the firm yield of the system will continue to increase.
Drought Restrictions During supply shortages brought on by drought, Thornton’s Drought Management Plan provides guidance to achieve short-term water savings, and complements this Plan which promotes long-term water use efficiency. The goals of the Drought Management Plan are to aid the city in:
(1) determining the onset and severity of drought,
(2) reducing water demands, and Image 8. Irrigation Savings Tip

20 T h o r n t o n W a t e r E f f i c i e n c y P l a n
(3) increasing water supplies sufficiently to ensure that the basic health and safety needs of all customers are met.
Drought response is divided into three levels (Stages 1, 2, and 3) according to drought severity, which is assessed based on factors including projected demand, reservoir storage levels, projected stream flows and water rights yields, availability of alternative supplies, water quality, and drought indices. Depending on the severity, the plan outlines demand-side management and supply-side management strategies, in addition to public information strategies, to mitigate drought effects. Demand-side management strategies aim to reduce customer water use while supply-side management strategies aim to maximize opportunities to obtain water supplies for the city. Public information strategies are utilized to raise awareness and foster willingness to comply with water restrictions.
The city’s Drought Management Plan was adopted in 2002 due to a severe drought experienced throughout the State. Thornton followed the steps and options outlined in its Drought Management Plan to efficiently and wisely manage its water supplies. A mix of voluntary and mandatory water restrictions were enacted between 2003 and 2006 to ensure an adequate amount of water remained in storage to meet the critical needs of the city in subsequent years.
Similar restrictions were put in place from May 2012 through June 2013. During the periods when water restrictions were in effect Thornton water customers responded well and reduced their water usage, thereby avoiding the need to enact a stricter program. From 2012 to 2013 the city saw a 17% reduction in total water use. Water uses have increased only slightly since then, even though restrictions are no longer in place. This fact is attributed to water efficiency behaviors and average weather conditions that occurred in 2014-2015, maintaining stable demands. A Drought Management Plan update will be developed in 2018.
Drought Emergencies In the case of emergency conditions, the Drought Management Plan includes two recommendations for augmenting supplies. The first recommendation is to lease water in the short-term from farmers. This approach requires negotiating agreements with farmers ahead of an actual drought emergency. The second recommendation is to temporarily terminate the water lease with the City of Westminster. This approach would save Thornton about 2,240 acre-feet of water per year, but would have a negative financial impact on the city.
Climate Change Impacts The city of Thornton recently completed a climate vulnerability assessment in support of a more comprehensive approach to water resources management and adaptation. Climate change experts project that heat waves, drought, and wildfires will increase in frequency and severity in Colorado by the mid-21st century.8 Flood events could become more frequent and precipitation more variable with temperature. The city is looking at these long-term effects along the Front Range and on its water system and how they will impact future demand. The safety factor used in demand projections provides ample reserves for climate variability in the near term.
8 “Climate Change in Colorado: A Synthesis to Support Water Resources Management and Adaptation,” CU-NOAA Western Water Assessment. 2008. http://cwcb.state.co.us/public-information/publications/documents/reportsstudies/climatechangereportfull.pdf.

21 T h o r n t o n W a t e r E f f i c i e n c y P l a n
Emergency Connections The city of Thornton’s distribution system includes two interconnections to the city of Northglenn and Denver Water, which add to the operational flexibility that the city of Thornton could exercise under extreme conditions.
System Infrastructure The city of Thornton continues to plan and invest in infrastructure repairs and expansions. These efforts must continue for the city to deliver adequate water supplies to their customers.
Improvement Projects The city of Thornton has identified several major infrastructure projects that are required to adequately deliver and treat water supplies to the city’s customers:
The city is currently constructing a new water treatment plant to replace the Thornton Treatment Plant. The new treatment plant, which will have a treatment capacity of 20 mgd, is anticipated to be completed by the year 2020.
The city intends to construct the Thornton Water Project, including a pipeline and associated infrastructure to utilize its water rights from the Cache la Poudre watershed. Thanks to successful water efficiency efforts to date, the timeline for this project is 2025.
The city also has ongoing improvement projects to storage reservoirs and the distribution system.
Flood Damages The city continues to repair infrastructure that was damaged in the September 2013 and September 2015 floods. Flood recovery and flood protection will continue to be an important consideration when assessing the resiliency of Thornton’s water system. Repairs to streets, parks, trails, drainages, water resources facilities, power lines, and public buildings can strain existing resources, and present future vulnerabilities. Thornton has critical water supply reservoirs that are adjacent to the South Platte River and adequately protecting these facilities is a priority for the city.
Image 9. Water Supply, Treatment and Quality Staff

22 T h o r n t o n W a t e r E f f i c i e n c y P l a n
Water Quality Source water quality plays an integral role in water treatment costs and strategies. These costs are reflected in the rates that customers pay for the drinking water service they receive. Better source water quality can lead to lower treatment costs as less chemicals are needed. Some of the challenges that may increase costs include lake treatment for algae, removal of metals, and pH control. Thornton has a diverse water portfolio with varying water quality amongst its sources of the South Platte River, Clear Creek, and the Poudre River. Water quality is an ever-present concern and the city is committed to providing high quality drinking water to residents and businesses. A Water Quality Consumer Confidence report is distributed to water customers annually.9
Capital Projects and Facility Improvements To plan for the future costs associated with developing the city’s raw water, treated water, and wastewater systems, city staff developed an itemized list of capital projects and operations and maintenance items necessary to accommodate Thornton’s projected growth over the next 20 years. These projects include new raw water storage facilities, upgrades to existing water treatment plants, installation of new pipelines, replacement of existing pipelines, and non-potable irrigation projects, as well as new facilities, staffing requirements, fuel costs, and vehicle needs. A general summary of the projected costs through 2021 associated with these potential facilities are shown in Table 5.
9 More information about city of Thornton water quality can be found here:
www.cityofthornton.net/government/infrastructure/water/Pages/water-quality.aspx.
Image 10. Thorntonfest Image 11. Water Quality Testing

23 T h o r n t o n W a t e r E f f i c i e n c y P l a n
Table 5. City of Thornton Summary of Planned System Improvements Through 2021
Category 2017-2021
Source of Supply $230,684,915
Water Treatment Facilities $76,405,198
Treated Water Storage $1,650,000
Major Transmission Lines $7,535,000
Wastewater System $24,847,677
Water System Facilities N/A
Wastewater System Facilities N/A
Water System O&M $145,761,952
Wastewater System O&M $62,369,715
Grand Total $549,254,458
The major projects and facility improvements forecasted through 2035 are described below.
The Thornton Water Project The Thornton Water Project is the primary source of water supply for the city’s future needs. After investigating numerous possible future water supply systems along the Front Range from Pueblo to Fort Collins, Thornton decided that the best option was to acquire shares in the Water Supply and Storage Company (WSSC), a ditch company that diverts its water rights from the Poudre River north of Fort Collins. Enough WSSC water was available, including significant amounts of storage, was very high quality, and was relatively inexpensive when compared to sources such as the Upper Clear Creek. To gain access to the WSSC water, it was necessary to acquire farms irrigated by WSSC water. The city allocated over $51 million ($110 million in 2017 $), and in 1985 and 1986 purchased the water and farms.
Thornton investigated numerous options for delivery of the WSSC water to Thornton. Delivering WSSC water by operating a water rights exchange up the South Platte River wouldn’t provide the amount of water Thornton needed, and would eliminate any of the water quality benefits WSSC water provides.
Image 12. South Tani Lakes

24 T h o r n t o n W a t e r E f f i c i e n c y P l a n
Pipeline delivery is the only alternative that provides the full yield of the WSSC shares and maintains the high quality of the WSSC water. The infrastructure required to deliver the WSSC water to Thornton would be extensive, but not out of the ordinary when compared to the infrastructure put in place by other large water suppliers. Even at its currently estimated price of $435 million, it is still a cost-effective option for providing long-term water supplies for the city’s water customers.
The need for the Thornton Water Project (TWP) is two-fold: use high quality water to help manage the city’s poorer quality water supplies; and, provide additional water to enhance the reliability of supplies to meet the demands of existing and future water customers.
Thornton’s combination of senior water rights, junior water rights, and storage create a robust water system that is capable of meeting the city’s current needs, even in times of drought. Furthermore, while drought conditions and below average snowpack can affect the entire state, it is much more common for shortages to be localized. For example, the South Platte River basin may experience below average snowpack in one season resulting in below average river flows, while the Poudre River basin collects above average snowpack in the same season, resulting in higher than normal river flows for most of the diversion season. Extending Thornton’s water system to include water rights from the Poudre River provides much needed protection from localized droughts.
Water Share Acquisition Additional local senior water rights in the Lower Clear Creek Canal and the Colorado Agricultural Canal will be pursued when available to increase the drought reliability of the city’s lower Clear Creek water supply system.
Raw Water Storage There are three reservoir projects underway or planned that will increase the city’s raw water storage capacity. One project that is anticipated to be completed in 2018 is the West Sprat Platte Reservoir that will connect to a series of existing reservoirs and will provide additional operational storage that supplies raw water directly to the water treatment plants. The other projects that will be pursued in the future are the development of a new pump station at Cooley East Reservoir, and completion of the Zadel Reservoir and pump station. Development of the Cooley East and Zadel Reservoir facilities will provide the city with the ability to use additional storage for regulation and exchange of reusable effluent.
Treatment Facilities and Water Quality Treatment plant operations and maintenance (O&M) costs include chemicals and power required to deliver the treated water from the plant and throughout the distribution system. Thornton’s source water quality challenges require an investment in advanced water treatment technologies.
The Thornton Water Treatment Plant (TWTP) currently treats raw water using conventional treatment methods. Due to the age of the TWTP, the plant will be replaced with a new plant by the end of 2020. The new 20 million gallon per day (MGD) plant will be an advanced conventional treatment plant with flocculation/sedimentation basins, ozone, and deep-bed biofilters. The new plant will treat water from Standley Lake and East Gravel Lakes.

25 T h o r n t o n W a t e r E f f i c i e n c y P l a n
The Wes Brown Water Treatment Plant (WBTP) was expanded in 2005 and converted to a 50 MGD ultra-filtration treatment technology. No additional expansions are planned for this facility; however, it is anticipated that additional processes, such as ozone and improved solids handling facilities may be added in the future. The ozone facilities will improve WBTP ability to remove taste and odor compounds that are frequently generated in the gravel lakes.
A major source of Thornton’s water supply comes from the South Platte River, which is more challenging to treat than the city’s water sources in the Clear Creek River basin. The nutrient levels in the South Platte River are typically two to three times higher than in the Lower Clear Creek River. Phosphorus levels are of particular concern as they can support the rapid growth of algae in water storage reservoirs during summer months, resulting in taste and odor issues in the drinking water. While taste and odor from algae is not a health concern, the issue is a priority to mitigate for improved customer satisfaction.
Adopted in 2012 by the Water Quality Control Commission, Regulation 85 is a pending regulation that sets nutrient limits for wastewater treatment plants with discharges greater than 1 MGD. The regulation was designed to help lower nutrient loading (nitrogen and phosphorus) in state waterbodies by targeting wastewater treatment discharges. The pending regulation has a 10 year timeframe for compliance to allow for planning, funding, and implementation of technologies needed to meet the Regulation 85 nutrient limits. Although Regulation 85 should help improve the nutrient levels in the South Platte River, it will take several years to see the results.
Waterline Over-Sizing All future treated water distribution pipelines greater than 16-inches in diameter were identified based on the projected build-out of the extended service area. For the purposes of this study it was assumed that developers would be responsible for installing all pipelines and be reimbursed by Thornton for the difference in costs of installing any pipelines greater than 16-inch diameter.
Treated Water Storage Tanks The following new treated water storage tanks will be required due to increased demand, and emergency and fire flow needs:
1) Zone 1, 5-million-gallon storage tank was constructed in 2007 and has been placed into service. 2) Zone 1, 5-million-gallon storage tank, estimated construction date of 2024.
3) Zone 1, 5-million-gallon storage tank, estimated construction date of 2035.
Image 13. High Service Pump Station

26 T h o r n t o n W a t e r E f f i c i e n c y P l a n
Treated Water Pipeline Replacement Program The pipeline replacement program will focus on asbestos cement (AC), ductile iron (DI), and cast iron (CI) pipe. AC and CI pipe are typically the oldest pipelines in the distribution system and have contributed to the majority of the pipeline breaks occurring over the past ten years. The criteria for the pipeline replacement program was developed to minimize the overall costs required to replace aging AC, DI, and CI pipe in the distribution system while also ensuring reliable service and minimizing the costs associated with emergency repairs. For 2017 through 2021, replacement criteria have been developed which prioritizes the pipes needing repairs and ensures that pipes in fair condition are not needlessly replaced.
Standley Lake Pipeline Replacement Thornton and the City of Northglenn share approximately 40,000 lineal feet of a 48-inch diameter pipeline that conveys water from Standley Lake to each of the cities. Costs have been estimated for the replacement of Thornton’s portion of the pipeline. Thornton is the sole owner of the 36-inch diameter pipeline extending approximately 21,100 lineal feet from the bifurcation at the 48-inch pipeline to the Thornton Water Treatment Plant. The replacement costs in the plan assume that portions of the pipeline will be replaced from 2020 through 2022 for the 48-inch section of the pipeline.
Non-potable Irrigation Analysis for Future Parks The city’s Community Services Department identified proposed park sites planned over the next 20 years. It might be feasible to implement additional non-potable irrigation systems by utilizing existing raw water conveyance facilities already in place throughout the city. The parks identified include the following:
1) Phase II - 136th Avenue and Holly Street Sports Complex - multi-purpose fields at the southwest corner;
2) Carpenter Park – potential expanses of bluegrass likely to be served by the existing non-potable irrigation system;
3) Riverdale Ballfields at 98th Avenue and Riverdale Road - evaluating non-potable alternatives.
4) Potential Thornton Sports Complex expansion at 104th Avenue and McKay Road. 5) Community Level Park with multi-purpose fields - location and amenities not yet determined;
Image 14. Water Efficiency Campaign Slogan

27 T h o r n t o n W a t e r E f f i c i e n c y P l a n
Sewer Fund Capital Projects The capital projects identified in the sewer fund portion include all facilities and upgrades that will be required to support a build-out extended service area. The major facilities include the Big Dry Creek parallel interceptor, the Todd Creek Interceptor, and the Big Dry Creek lift station and force main replacement.
Yearly capital improvement projects include the Wastewater O&M projects which consists of the rehabilitation and/or replacement of deteriorating 50-year-old sanitary sewer lines on a priority basis. This is a maintenance project to rehabilitate concrete sewer mains throughout the system, but primarily in Original Thornton and the Western Hills Subdivision. The Wastewater O&M project also consists of rehabilitating deteriorated concrete manholes with a spray-on concrete lining application and then finishing each manhole with a waterproofing epoxy coating.
Operations and Maintenance Costs Operations and maintenance costs were determined and itemized by year based on equipment and staffing needs, fuel costs, and vehicles. The items identified in the operations and maintenance needs include only additional items required based on the expected population growth and the associated growth of the utilities system.
Incremental Cost Analysis An incremental cost analysis was performed to estimate the cost of each additional gallon of new capacity associated with the anticipated water supply facilities and wastewater facilities necessary through 2024 to accommodate the city’s projected demands. Incremental costs were separated into six categories: source of supply, water treatment facilities, treated water storage, major transmission lines, water purchases, and wastewater facilities. These six categories include anticipated projects such as:
Source of supply: costs for raw water operational facilities such as pipelines and pump stations, reservoirs, and canal conveyance improvements
Water treatment facilities: chemical storage tanks, biological pre-treatment processes, and ultra-violet treatment equipment
Treated water storage: treated water storage tanks throughout the service area
Major transmission lines: waterlines for the treated water system, booster pump stations, and non-potable systems
Water purchases: costs for water rights acquisitions, water rights transfers and water rights protection
Wastewater system: lift station improvements and sanitary sewer lines
Image 15. Irrigation Analyst

28 T h o r n t o n W a t e r E f f i c i e n c y P l a n
The estimated incremental costs are in 2016 dollars and annualized over the useful life of the anticipated projects. A summary of the incremental cost per gallon for these five categories through 2021 can be found in Table 6.
Table 6. Incremental Supply Costs
Category Incremental Costs
(per gallon)
Source of Supply $0.00520
Water Treatment Facilities $0.00425
Treated Water Storage $0.00810
Major Transmission Lines $0.00188
Water Purchases $0.01359
Wastewater System $0.01007
Total Simple Incremental Supply Cost $0.04309
Preliminary Capacity Forecasts The city of Thornton has acquired sufficient water supplies to serve anticipated service area demands beyond 2035 however, there are substantial infrastructure requirements that are necessary to allow delivery of this water to Thornton. Figure 6 illustrates the anticipated volumes of water supply additions and associated timing of these additions.
Figure 6. Preliminary Annual Supply-Capacity Forecast through 2035
0
1,000
2,000
3,000
4,000
5,000
6,000
7,000
8,000
9,000
10,000
0
5,000
10,000
15,000
20,000
25,000
30,000
35,000
40,000
45,000
20
16
20
17
20
18
20
19
20
20
20
21
20
22
20
23
20
24
20
25
20
26
20
27
20
28
20
29
20
30
20
31
20
32
20
33
20
34
20
35
Sup
ply
Ad
dit
ion
s (A
F)
Cap
acit
y (A
F)
Supply Additions Total Supply Capacity of the System

29 T h o r n t o n W a t e r E f f i c i e n c y P l a n
1.3 Water Costs and Pricing
The city of Thornton has just completed a series of water rate increases over the past three-years. The rate increases were necessary to fund a new water treatment plant and the Thornton Water Project, which will secure high quality water for Thornton in the future. The city utilizes an increasing block rate structure paired with an estimated indoor water budget. The first block is tied to indoor water consumption which is approximated with the Average Winter Consumption (AWC). The remaining tiers are based on the customer’s Monthly Outdoor Allowance (MOA) which is determined by customer class and meter size. The size of the allowance may be adjusted administratively when necessary based on water supply projections and to support the water efficiency goals of the city. Customers that stay within their water budget, represented by the AWC plus the MOA pay significantly lower prices than the customers in tiers three and four. A full description of the domestic rate structure can be found in Table 7.
Table 7. Inside City Domestic Water Rates, 2015-2017
Rate Effective
May 1, 2015 Effective
Jan. 1, 2016 Effective
Jan. 1, 2017
Tier 1 – Price per 1,000 gallons up to AWC $4.06 $4.64 $5.22
Tier 2 – Price per 1,000 gallons up to AWC + MOA $4.06 $4.64 $5.22
Tier 3 – Price per 1,000 gallons up to AWC + 2x MOA $6.09 $6.96 $7.83
Tier 4 – Price per 1,000 gallons over AWC + 2x MOA $12.18 $13.92 $15.66

30 T h o r n t o n W a t e r E f f i c i e n c y P l a n
Chapter 2:
Profile of Water Demands and Historical
Demand Management This section summarizes historical water demand trends and demand management activities as well as future demand forecasts within the city of Thornton service area.
2.1 Historical Water Demands
Potable Demands Potable water demand in Thornton is driven primarily by residential consumption, making up 60% of the 21,764 acre-feet of total demand in 2015 (Figure 7), this amount was significantly lower than the 25,861 acre-feet projection for 2015 due to efficiency and wet weather that reduced the need for irrigation. Over 90% of that demand occurs within the city’s boundary (Figure 8).
Figure 7. Treated Water Demand by Service Type, 2015
Residential, single-family
47%
Residential, multi-family
13%
Commercial9%
Irrigation12%
Westminster Lease
9%
Non-account9%
Non-billed, Accounted For
1%

31 T h o r n t o n W a t e r E f f i c i e n c y P l a n
Figure 8. Treated Water Demand, Inside vs. Outside City, 2015
The city’s 2015 potable water demand was 7.5% below its 2008 potable water demand. However, there have been fluctuations in that period with 2008 and 2012 seeing the highest use (Figure 9). These fluctuations have generally followed weather patterns with drier years seeing increases in water demand due to increased irrigation. Over this same timeframe, per capita consumption decreased 15%, as shown in Figure 10 and Figure 11.
Figure 9. Potable Water Demand, 2008-2015
Inside City92%
Outside City8%
6,226
5,632
5,997 6,055
6,618
5,503 5,5355,757
0
1,000
2,000
3,000
4,000
5,000
6,000
7,000
2008 2009 2010 2011 2012 2013 2014 2015
An
nu
al D
em
and
(m
illio
n g
allo
ns)

32 T h o r n t o n W a t e r E f f i c i e n c y P l a n
Figure 10. Residential Annual per Capita Demand, 2001-2015
Figure 11. Annual per Capita Demand – Residential, Commercial, and Irrigation, 2002-2015
Non-potable Demands Thornton has provided non-potable water to the city’s Thorncreek Golf Course, select parks, and one commercial customer for more than a decade. In recent years, the amount of irrigation done with non-potable water has been increasing. The non-potable water is drawn from a number of different sources.
106103
88
79
89
9692 93
8588 90
97
82 81 79
0
20
40
60
80
100
120
2001 2002 2003 2004 2005 2006 2007 2008 2009 2010 2011 2012 2013 2014 2015
Pe
r C
apit
a D
em
and
(gp
cd)
133
113109
119
127122
125
112119 121
131
108108 106
0
20
40
60
80
100
120
140
2002 2003 2004 2005 2006 2007 2008 2009 2010 2011 2012 2013 2014 2015
Pe
r C
apit
a D
em
and
(gp
cd)

33 T h o r n t o n W a t e r E f f i c i e n c y P l a n
Thorncreek Golf Course is provided with non-potable water diverted from Big Dry Creek. In 2006, the city started using non-potable surface water to irrigate Civic Center Park This lake is filled with water diverted from Clear Creek. Also in 2006, the city started using non-tributary groundwater to irrigate Community Park and Grange Creek Park. In 2007 and 2008 the city began irrigating Cherry Park and Woodglenn/Brookshire Park respectively with non-potable surface water. Also in 2008, the city began irrigating the multi-purpose fields at the Margaret W. Carpenter Recreation Center with a combination of non-potable surface water and non-tributary groundwater. After these additions to the non-potable irrigation system, total consumption has risen approximately 53% from 260 acre-feet in 2005. Much of this increase has occurred over the last three years, in 2013 consumption stood at 296 acre-feet, in 2014 it rose to 373 acre-feet, and in 2015 it rose again to 402 acre feet.
System Water Losses The city follows procedures outlined by the American Water Works Association M36 Water Audits and Loss Control Program to monitor distribution system water loss. Distribution system loss is a measure of the percentage of produced water that fails to reach customers and cannot otherwise be accounted for through authorized usage so it does not fully equate to non-account water as it doesn’t include water used for fire hydrant flushing or new line disinfection.
Prior to 2005 Thornton’s system loss historically averaged approximately 5%, with loss in 2005 at 9.5%. System loss under 10% is generally considered acceptable although Thornton continues to look for opportunities to reduce loss. Due to the increasing trend in water line breaks being experienced, primarily in the older sections of Thornton’s distribution system, the city developed and implemented a Maintenance Improvement Program (MIP) in 2008 to replace aging pipelines. Under the MIP the city has replaced approximately 2,400 linear feet of old pipe each year.
Figure 12 illustrates fluctuations in non-revenue water between 2012 and 2015. Since 2012, non-account water has fluctuated between 7.2% and 9.8% with no discernable trend. In 2015, the city’s unaccounted non-revenue water had remained relatively steady indicating that the MIP had been successful in stopping the increase in system loss. The long-term investment in MIP is expected to keep system water losses under 10% as older pipe is systematically replaced with new sections of pipe. In Table 8 below unbilled water is broken out into two categories, accounted for unbilled water and estimated water loss. The accounted for unbilled water is used for activities such as pipe flushing and is not considered a loss. Together these amounts equal the percentages of distributed water that are shown.

34 T h o r n t o n W a t e r E f f i c i e n c y P l a n
Figure 12. Non-Revenue Water
Table 8. Non-Revenue Water (acre-feet)
Year Unbilled
Accounted For (acre-feet)
Estimated Water Loss
(acre-feet)
Percent of Total Distributed Water
2012 169 1,984 9% 2013 160 1,419 8% 2014 197 1,730 9% 2015 170 1,826 9%
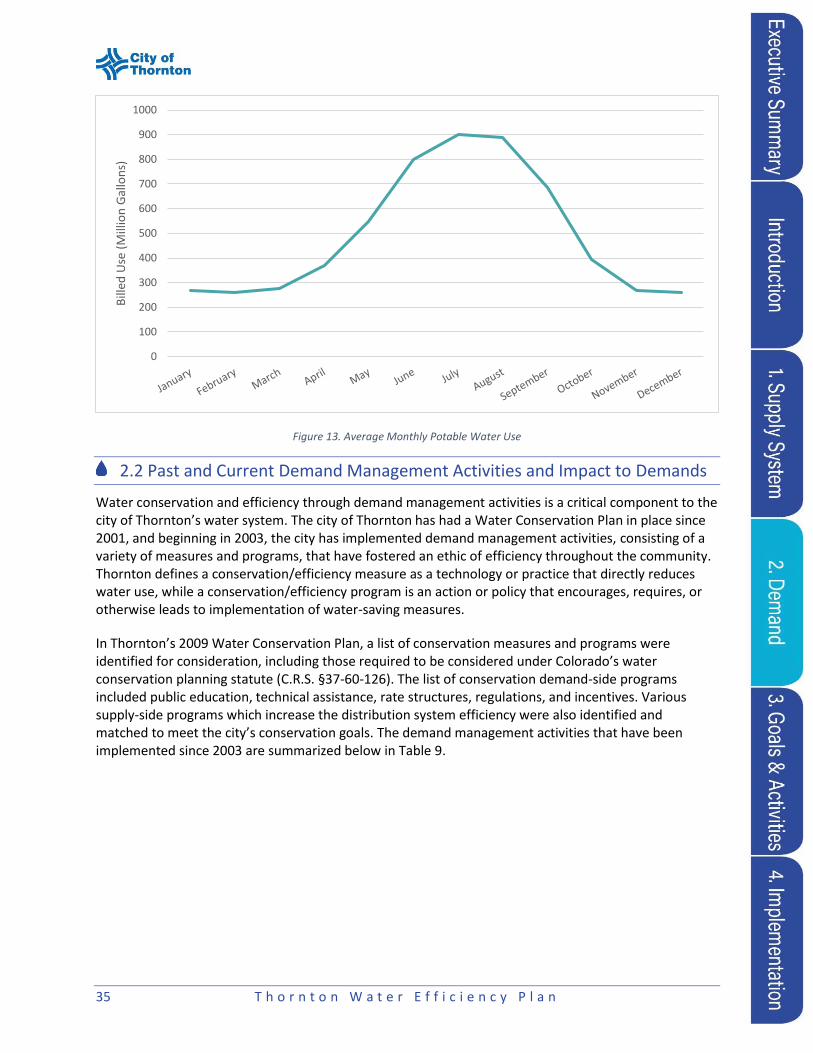
Annual and Peak Day Demands Seasonal demand leads to variation between average daily demand and peak daily demand. Peak days are during irrigation season which typically runs May through October (Figure 13). In drought years, the city experiences these increased volume days earlier in the year. In 2015, Thornton’s peak daily demand for treated water was 40 mgd and there was an hourly peak of 68.1 mgd – both values are below the total system capacity of 70 mgd.
8.90%
7.75%
9.24% 9.37%
10.51%
9.26%
11.21% 11.19%
0%
2%
4%
6%
8%
10%
12%
2012 2013 2014 2015
Unaccounted Non-Revenue Water Total Non-Revenue Water
35 T h o r n t o n W a t e r E f f i c i e n c y P l a n
Figure 13. Average Monthly Potable Water Use
2.2 Past and Current Demand Management Activities and Impact to Demands
Water conservation and efficiency through demand management activities is a critical component to the city of Thornton’s water system. The city of Thornton has had a Water Conservation Plan in place since 2001, and beginning in 2003, the city has implemented demand management activities, consisting of a variety of measures and programs, that have fostered an ethic of efficiency throughout the community. Thornton defines a conservation/efficiency measure as a technology or practice that directly reduces water use, while a conservation/efficiency program is an action or policy that encourages, requires, or otherwise leads to implementation of water-saving measures.
In Thornton’s 2009 Water Conservation Plan, a list of conservation measures and programs were identified for consideration, including those required to be considered under Colorado’s water conservation planning statute (C.R.S. §37-60-126). The list of conservation demand-side programs included public education, technical assistance, rate structures, regulations, and incentives. Various supply-side programs which increase the distribution system efficiency were also identified and matched to meet the city’s conservation goals. The demand management activities that have been implemented since 2003 are summarized below in Table 9.
0
100
200
300
400
500
600
700
800
900
1000B
illed
Use
(M
illio
n G
allo
ns)

36 T h o r n t o n W a t e r E f f i c i e n c y P l a n
Table 9. City of Thornton Historic Demand Management Activities
Measure/ Program Description Year Implemented
Showerhead Exchanges Free showerhead exchange program for residential customers.
2003
Clothes Washer Rebates Rebate program for residential customers purchasing water-efficient clothes washers.
2003
Residential WaterSense Toilet Rebates
Rebate program for residential customers replacing toilets with higher efficiency models (1.6 gpf through 2008, 1.28 gpf currently).
2003
Public Outreach and Education
Youth Water Festival, Earth Day presentations, Imagine a Day without Water.
2004
Sprinkler Consultations Technical assistance program for residential customers that provides consultation for efficiently operating their irrigation systems.
2005
Efficient Landscape Irrigation Campaign
Voluntary no watering 10 am to 6 pm. 2008
Social Marketing Campaign Public engagement campaign to promote water efficient behaviors in the community.
2008
Pipeline Replacement Program
A systematic pipeline replacement program focused primarily on the oldest pipelines in the distribution system in an effort to improve water distribution system performance and control costs.
2008
Residential Outdoor Water Use Consultation
Technical assistance program for residential customers that provides information about potential outdoor water savings.
2008
Water-Wise Landscaping Classes/Tours
Educational program that provides residents with information and examples of implementing Water-Wise landscaping that replaces turf.
2009
Residential Audit Kits Provide free indoor residential audit kits upon request to customers within the city’s service area.
2009
Multi-Family Toilet Replacement
Rebate program for multi-family customers replacing toilets with WaterSense models.
2010
Residential Indoor Water Use Consultation
Technical assistance program for residential customers that provides information about potential indoor water savings.
2010
Aerator Retrofits Program that provides replacement aerators for residential customers’ faucets.
2010
City Building Efficiency This program targets city buildings for water efficiency upgrades to help the city lead by example in meeting water efficiency goals.
2010
Commercial Urinal Rebates Incentive program for the replacement of water wasting 1.5 gpf or greater urinals with ultra-low flow urinals (0.5 gpf).
2011

37 T h o r n t o n W a t e r E f f i c i e n c y P l a n
Measure/ Program Description Year Implemented
Commercial Toilet Rebates Rebate program for commercial customers replacing toilets with more efficient models.
2011
Nozzle Retrofits Rebate program for customers who install more efficient nozzles for their irrigation systems.
2011
City Parks Irrigation Management Program
Targeted efficiency program for city parks. This program will help the city to lead by example with the goal of reducing water use at city parks.
2013
Smart Irrigation Controller Rebates
Rebate program for customers who install irrigation controllers.
2013
Commercial Audits
Technical assistance program for commercial customers that provides customers information about the ways that they could operate in a more water efficient manner.
2013
Direct Toilet Install Residential Program
Direct install program of high efficiency toilets for income-qualified residential customers.
2014
Rain Sensor Rebates Rebate program for customers who install rain sensors for their irrigation systems.
2014
Commercial Kitchen Spray Valve Retrofit
Install program for pre-rinse spray valves for commercial customers.
2015
Garden-in-a-Box Discount Professionally designed water-wise gardens offered at a discount.
2016
The 2009 Water Conservation Plan set a goal to reduce residential water demand to 85 gallons per capita per day (gpcd) by 2016. A 5-year rolling average is used for calculating the gpcd metric to consider the annual fluctuation in residential outdoor demand due to weather variability. The combined effectiveness of the variety of programs listed in Table 9 and Thornton’s water rate structure assisted the city in achieving its 85 gpcd goal in 2016.

38 T h o r n t o n W a t e r E f f i c i e n c y P l a n
Figure 14. Distribution of Water Conservation Program Savings by Program Since 2003
Figure 15. Indoor Rebates – Residential, Commercial, and Multi-Family
Clothes Washers49%
Toilets34%
Res. Sprinkler Consultations
15%
Indoor Use Consultations
1.3%
Showerheads1%
Rain Sensors & Irrigation Controllers0.1%
Other2%
222
442374
458
614 630
759 784
656
426 421
198
90
213
307278
243
149184
248
912
570
307
765
486438
0
100
200
300
400
500
600
700
800
900
1000
2003 2004 2005 2006 2007 2008 2009 2010 2011 2012 2013 2014 2015
Nu
mb
er
of
Par
tici
pan
ts
Year
Clothes Washers All Toilet Rebate Programs

39 T h o r n t o n W a t e r E f f i c i e n c y P l a n
Figure 16. Outdoor Rebates
Figure 17. Residential Conservation Free Service Participation
This 2016 Water Efficiency Plan builds upon the successes to-date by pursuing strategies to help continue long-term water savings for the city. Chapters 3 and 4 detail Thornton’s new water efficiency goals and strategies.
5 5
70
05
21
0
10
20
30
40
50
60
70
80
2013 2014 2015
Nu
mb
er
of
Re
bat
es
Year
Irrigation Controllers Rain Sensors
97
118
93
36
98
230
138 146163
176
144
0 0 0 0 0
149158 164
106
47
91
0 0 0 0 0 0 0 0 0 7
80
0
50
100
150
200
250
2005 2006 2007 2008 2009 2010 2011 2012 2013 2014 2015
Nu
mb
er
of
Par
tici
pan
ts
Year
Res. Sprinkler Consultations Indoor Use Consultations Toilet Installation Program

40 T h o r n t o n W a t e r E f f i c i e n c y P l a n
Image 16. Water-Wise Landscaping Tip
2.3 Demand Forecasts
As a result of meeting and exceeding its water conservation goals, the city has been able to adapt its long-term water supply planning strategy that will ultimately continue to reduce the amount of water the city must develop in order to meet build-out demand. Other factors that have impacted demand include rate changes as well as environmental and economic conditions. From 2008 to 2015, demand was largely driven by the presence or absence of drought conditions, with 2008 and 2012 being particularly high demand years as there was significant drought in the region at that time. In 2013 the early part of the year faced drought conditions as well but in September of that year demands were
sharply depressed due to heavy rains that led to significant flooding and removed the need for irrigation.
In the 2009 Water Conservation Plan, 2005 was used as the baseline year for future demand projections through 2027. This year was chosen for analysis since it was considered a relatively average year in precipitation and water use. Land use, climate change, and economic factors were not accounted for in this demand forecast. Population estimates were provided by the city’s Policy Planning Division, and 2005 water use was broken
down by customer class to calculate an annual per Image 17. Fire Station 5 Water Wise Garden

41 T h o r n t o n W a t e r E f f i c i e n c y P l a n
capita water use value (Figure 11). These per capita water use values were then applied to the population projections to develop baseline demand forecasts for 5-, 10-, and 20-year time horizons. To note, baseline treated water demand forecasts did not include Thornton’s raw water system demands, which are a relatively small component of the overall system demand. The baseline demand forecast was adjusted for future water conservation activities following evaluation and selection of conservation measures and programs.
Figure 18 compares actual potable demands with the 2009 demand forecast for residential, commercial, and irrigation customer types. Actual demands are the solid lines while projected demands are the dashed lines. Variation in actual demand is attributed primarily to weather variations (i.e., demand is less in wet, cool years with lower evapotranspiration demands, while demand is higher in warm, dry years with higher evapotranspiration demands). Analysis of the data shows that 2008 and 2012 were outlying years when actual demand was greater than the forecasted demand. Note that in 2013 there was a decrease in actual demand attributable to wet weather and other environmental factors. Actual demands have remained relatively low since 2013 due to average weather conditions. Overall, the city of Thornton considers this a successful forecast, because the intention is to produce sufficient water to meet demands in the extreme, higher demand years such as 2008 and 2012. Non-potable demands and the City of Westminster demands were not included in the forecast since both are static water demands, and are, as such, predictable.
Figure 18. Actual versus Projected Annual Potable Demands
11200
12800
14400
16000
0
500
1000
1500
2000
2500
3000
3500
2008 2009 2010 2011 2012 2013 2014 2015
Re
sid
en
tial
De
man
d (
AF)
CII
an
d Ir
riga
tio
n D
em
and
(A
F)
Commercial - Actual Commercial - Projected Irrigation - Actual
Irrigation - Projected Residential - Actual Residential - Projected

42 T h o r n t o n W a t e r E f f i c i e n c y P l a n
Future water demands, through full build-out in 2065, were forecasted using the same methodology as in 2009, though the baseline year was updated to 2015 and non-potable demands are being included to represent total system demands. The forecasts include a 10% safety factor applied to residential, commercial and irrigation demand (City of Westminster and non-account water not included). The city is interested in integrating weather, land use, and economic factors into future forecasting efforts, though none of these factors are considered in the forecasts presented here.
The population projections used in this Plan are based on the projections provided by the city’s Policy Planning Division. The current extended service area is essentially fully developed and the city expects the population in these areas to remain relatively constant. The city’s anticipated water service area population, including areas outside the city’s corporate boundaries, is projected to be 168,434 in 2024.
The total system baseline demand forecast indicates 36,630 acre-feet of water will be needed to meet customer demand in 2024, this Water Efficiency Plan planning horizon, and 53,945 acre-feet total at buildout, in 2065. It is important to note that this baseline total system demand forecast includes Thornton’s raw water demands. The baseline demand forecasts have not included adjustments for future water conservation activities considered in this Plan, addressed in Chapter 3. Table 10 shows Thornton’s projected water demands from 2017-2024.
Table 10. Projected Demands for Thornton 2017-2024
Year Treated Totals
(acre-feet) Safety Factor
(acre-feet) Raw Water (acre-feet)
Total (acre-feet)
2017 28,024 2,387 3,000 33,411 2018 28,444 2,426 3,000 33,871 2019 28,865 2,465 3,000 34,331 2020 29,286 2,504 3,000 34,790 2021 29,707 2,543 3,000 35,250 2022 30,128 2,582 3,000 35,710 2023 30,549 2,621 3,000 36,170 2024 30,970 2,660 3,000 36,630
Treated totals include residential, commercial, and irrigation customer demand, in addition to the City of Westminster’s full contract value of 2,240 acre-feet, and non-account water. Between 2015 and 2024 Thornton anticipates 3,788 acre-feet of new potable demand and 4,139 acre-feet of new total demand. The residential customer class will continue to be the single largest group of water users in Thornton with a projected annual demand of 19,810 acre-feet in 2024. The 2024 annual demands for the commercial and irrigation sectors are projected to be 3,434 acre-feet and 3,358 acre-feet, respectively. For planning purposes an additional safety factor is applied to projections.
Image 18. Water and Energy Efficient Home

43 T h o r n t o n W a t e r E f f i c i e n c y P l a n
Chapter 3:
Water Efficiency Goals and Activities
This section identifies water efficiency goals for the city of Thornton along with potential water efficiency activities to achieve those goals. Water efficiency activities were identified through a two-step screening and evaluation process and are divided into four broad categories: Foundational Activities, Targeted Technical Assistance and Incentives, Ordinances and Regulations, and Educational Activities.
3.1 Water Efficiency Goals
The city of Thornton recognizes water efficiency as an essential component to its long-term water supply planning strategy. Both the South Platte Basin Implementation Plan and the Colorado Water Plan recognize innovative ways that Thornton is helping to meet projected gaps in state water needs. Through water efficiency and related conservation measures the city will reduce the amount of water that it must acquire, or develop, to meet its build-out demand. The water efficiency goals included in this plan are intended to benefit both the city and its customers.
Since the residential class is the single largest customer class within the city’s water service area, it was the main area of focus in the 2009 Water Conservation Plan, with a goal of establishing the service area’s residential water use at 85 gallons per capita per day (gpcd) or less, based upon a five-year rolling average, by 2016. As of 2016, average residential water use reached the 85 gpcd target, which is 20% below the 106 gpcd recorded in 2001, pre-drought and prior to the enactment of water use restrictions. To achieve this goal, the 2009 Plan initiatives were estimated to achieve up to 900 acre-feet of savings annually by 2012, and up to 1,500 acre-feet annually by 2017.
In the 2009 Water Conservation Plan, customer classes other than residential were not considered when setting water efficiency goals for Thornton. Due to the conservation success achieved in the residential class, efficiency goals for these other customer classes are being considered as part of this Plan update.
Image 19. Water Tank

44 T h o r n t o n W a t e r E f f i c i e n c y P l a n
Within this Plan, new programs, outlined in detail in section 3.3, will be brought on-line at the pace of at least one new program being implemented each year through 2024. These initiatives target each customer class to achieve savings from all of Thornton’s water customers. The initiatives included in this Plan will aim to realize 1,071 acre-feet annually by 2024, approximately equal to the amount of water used by 9,000 Thornton residents in a year (assuming 106 gallons per capita per day).
Table 11. Estimated Efficiency Program Savings
Year Expected Annual Savings (AF) Cumulative Total (AF) 2017 3621 362 2018 62 424 2019 64 489 2020 65 553 2021 67 620 2022 67 687 2023 68 755 2024 316 1,071 1 Includes current/ongoing programs
To aid in monitoring progress towards these newly established goals, the city will begin tracking additional data, including:
Irrigated areas for the irrigation customer class;
Types of businesses, square footage of commercial space, and number of employees for the commercial customer class; and
The number of multi-family units and population estimates for the multi-family customer class.
3.2 Summary of Selection Process The water efficiency activity selection process has four major steps:
1. Potential Activity Identification – The goal of this introductory step is to cast a wide net in
identifying the many possible efficiency activities available for all customer classes.
2. Development of Screening Criteria – There are two sets of criteria which are used for the
screening and evaluation of conservation activities: qualitative activity screening and
quantitative activity evaluation.
3. Activity Screening – This step takes a high-level view of the potential activities and removes
from consideration those that are either infeasible or otherwise not of interest to the city.
4. Activity Evaluation – The final step in the selection process uses quantitative criteria to
thoroughly vet potential activities to determine which align with the desired course of action for
the city. The chosen activities then move on to the implementation phase.

45 T h o r n t o n W a t e r E f f i c i e n c y P l a n
Activity Identification A comprehensive list of efficiency activities was identified for consideration, including those required to be considered under Colorado’s water conservation planning statute (C.R.S. §37-60-126). Other activities were drawn from known best practices and knowledge of other activities that have been implemented elsewhere. Many of the activities listed are currently implemented at the city of Thornton.
The activities examined include both demand and supply side programs. The list of demand side measures includes public education, technical assistance, rate structures, regulations, and incentives. Various supply-side programs were identified and include programs which increase distribution system efficiency. In general, all activities are organized into one of four categories with additional sub-categorization as described in the sections below.
Foundational Activities When planning for demand management, certain activities are considered foundational. These activities are directly under the control of the utility and can be crucial to the success of other programs. The foundational activities ensure that the utility is operating efficiently, provide information necessary for the implementation of other programs, and provide the incentive for customers to participate in many of the activities in which they are targeted. Foundational activities can be grouped into the following general categories:
Metering – Activities in this category increase the accuracy of the usage information available to
the customer and the utility.
Demand Data Collection and Billing Systems – Activities in this category help the utility
compare data between customers of the same type and can be used to show customers where
their usage stands in comparison to established benchmarks.
Water Efficiency Oriented Rates and Tap Fees – Actions in this category are focused on
incentivizing water efficiency for customers using financial means.
System Water Loss Management and Control – These activities aim to make the utility more
efficient in its delivery of water to the customer.
Planning – Planning activities can have far reaching effects on the use of water by guiding
general trends.
Staffing – Proper staffing and support is necessary for the success of the activities discussed
throughout this chapter.
Image 20. Bus Shelter Water Saving Tip

46 T h o r n t o n W a t e r E f f i c i e n c y P l a n
Targeted Technical Assistance and Incentives Targeted Technical Assistance and Incentive activities are first categorized by the focus area of the activity, and then further organized into (Statewide Water Supply Initiative) SWSI framework levels.
The general focus area categories include:
Installation of Water Efficient Fixtures and
Appliances
Low Water Use Landscapes
Water Efficient Industrial and Commercial Water-
Using Processes
Incentives
The SWSI Framework Levels include:
Level 1 Utility/Municipal Facility Water Efficiency
– Activities that affect water operations that are
directly under the control of the city or utility.
Level 2 Management of Largest Customer
Demands – Activities that specifically target high-
use customers. The tracking of such high-use
customers is a foundational activity that is
necessary for these activities to be successful.
Level 3 Management of Remaining Customer
Demands – Activities that cover all remaining
customers.
Ordinances and Regulations Perhaps the most direct method of enforcing water conservation, city ordinances and regulations can have significant impact on water use across customer classes. For the purposes of this plan, ordinances and regulations were grouped into three categories depending on the type of regulation and further categorized by the city based on which customers would be impacted.
The regulation categories include:
General Water Use Regulations
Landscape Design/Installation Rules and Regulations
Indoor and Commercial Regulations
The customer impact categories include:
Level 1 Existing Service Area – Ordinances and regulations in this category may apply to the
whole service area (100% penetration rate) or specific categories of customers, such as single-
family homes or commercial. Most regulations and ordinances in Colorado currently fall into this
category.
Level 2 New Construction Regulations – Ordinances and regulations in this category are most
effective for communities experiencing large growth rates. These regulations would not apply to
currently developed areas unless high levels of redevelopment occur.
Image 21. Turf Removal

47 T h o r n t o n W a t e r E f f i c i e n c y P l a n
Level 3 Point of Sales Ordinances on Existing Building Stock – Ordinances and regulations in this
category apply at the time of sale for existing premises. They are most effective in communities
that experience high rates of turnover. They require that water efficiency upgrades be made at
the time of sale for the property.
Education Activities Education activities are designed to increase customer awareness of their water use, the need for conservation and their abilities to conserve. The activities are divided into two categories and then a level of communication is identified within the SWSI Framework Levels. The inclusion of the varying levels of communication represents a good opportunity for the city to ensure that they are fully engaging water customers.
The program categories include:
Customer Education
Technical Assistance
The SWSI Framework Levels of communication are:
Level 1 One-Way Education Activities – This method of communication is the most common
mode of communication among water providers in Colorado. It is used to convey water
efficiency messages and can be very effective in advertising and informing the public on other
water efficiency activities (e.g. rebate program). The information is sent out without any
tracking or follow-up.
Level 2 One-Way Education with Feedback – At this level, water providers convey information to
the public and receive feedback on the
effectiveness and applicability of its water
efficiency activities. Tracking of public
responses can also provide information on
who is receiving and reacting to the
information. This enables providers to
adjust a message based on feedback.
Level 3 Two-Way Education – This is the
most active method of communication. At
this level, customers are actively engaged in
developing and implementing the water
efficiency plan. This can involve the
development of stakeholder advisory
boards or focus groups to address specific
water efficiency issues.
Screening Criteria The identified measures and programs were screened based on the degree to which the measures and programs match the city’s efficiency goals. The screening criteria developed and used to determine whether to move forward to a more thorough evaluation are:
Authority of the city of Thornton to implement measure/program. If the city does not have the
legal authority to implement the measure/program it was excluded from consideration.
Image 22. Clear Creek

48 T h o r n t o n W a t e r E f f i c i e n c y P l a n
Ability to sustain the water savings over the long-term. If a measure or program could not
provide sustainable water savings over the long-term it was excluded from consideration.
Ability to defer or avoid costs by implementing the measure or program. If implementing a
measure or program demonstrated an increased potential for deferring or avoiding additional
water purchases it was granted additional weight for consideration.
Acceptability of the measure/program by city of Thornton community and customers. Some
programs and measures naturally are better received than others by customers and community
members. For example, incentives are typically preferred to mandates.
Activity Screening & Evaluation The screening and evaluation process first pares the list of potential activities down to those that are of interest to the city and the evaluation process further pares the list to those that will be included in the implementation stage of this Plan. Thirty-two activities made it through the initial qualitative screening process and on to quantitative evaluation, of which twenty-two demand management activities have been selected for implementation as part of this Plan. Note that some evaluated activities were re-evaluated from the 2009 Water Conservation Plan while others are new, adding to the portfolio of demand management activities to be implemented by the city.
3.3 Demand Management Activities Through the activity screening and evaluation steps outlined above, twenty-two demand management activities were identified for implementation as part of this Water Efficiency Plan. In total, the identified activities estimate a total projected cost of just over $4.6 million over the 7-year planning horizon (2017-2024) and 1,071 acre-feet in water savings, for an average cost of $1,700 per acre-foot, compared to the $14,000 per acre-foot incremental supply cost for the city. Table 12 lists the activities to be implemented, existing and new, through the city of Thornton Water Efficiency Program.
Table 12. Implementation Schedule for Measures and Programs
Program Beginning Date
Clothes Washer Rebates 2003
Residential WaterSense Toilet Rebate 2003
Public Outreach and Education 2004
Pipeline Replacement Program 2008
Residential and HOA Outdoor Water Use Consultation 2008
Residential Indoor Water Use Consultation 2010
Demonstration Garden Maintenance 2010
Commercial Toilet and Urinal Rebates 2011
City Parks Irrigation Management Program 2013
Smart Irrigation Controller and Rain Sensor Rebates 2013
Direct Toilet Install Residential Program 2014
Commercial Kitchen Spray Valve Retrofit 2015
Residential Water-Wise Garden Discount 2016
Residential Turf Replacement 2017
Residential Water Report Card 2017
Rain Barrel Rebate 2018
Residential and Commercial Turf Alternative Rebate 2018

49 T h o r n t o n W a t e r E f f i c i e n c y P l a n
Pilot Large Landscape Design Consultation 2018
Large Landscape Design Consultation 2019
EPA WaterSense Home Builder Incentive 2019
Irrigation System Improvements Program 2020
Upgraded Billing + Commercial and HOA Water Budget 2021
Commercial Indoor Water Use Assessment 2022
High Water Use Commercial Process Efficiency Incentives 2023
Advanced Metering Infrastructure 2024
The following summarizes the program details, benefits, challenges, and projected impacts and targets for each demand management activity identified for implementation. For each activity, the following metrics are calculated and reported (whenever applicable):
Typical water savings per participant per year (in gallons)
Targeted number of participants per year
Estimated total savings per year (in acre-feet)
Cost per acre-foot saved10
Cost per participant11
Audience
Clothes Washer Rebates The Clothes Washer program offers a $100 rebate incentive for the purchase and install of a qualifying clothes washer. Limit of one rebate per household every 10 years. If approved, a rebate credit of $100 will be applied to the customer’s water bill approximately two months after the application is received. This rebate program began in 2003 and will continue to be offered to qualifying residential customers through 2018. Thornton’s washer rebate program uses the Consortium for Energy Efficiency (CEE) list of qualifying washers.
Benefits and Challenges In March 2015, new federal efficiency standards for clothes washers became mandatory, increasing the required energy efficiency of all residential clothes washers. On the same date, new ENERGY STAR, ENERGY STAR Most Efficient, and CEE specifications became effective. Higher standards translate to greater potential savings by the customer and utility. However, rebates are subject to available funds.
Typical water savings per participant per year 7,026 gallons
Targeted number of participants per year 100
Estimated total savings per year 2.16 AF
Cost per acre-foot saved $748/AF
Cost per participant $161
Target Audience Residential
10 Cost per acre-foot saved was calculated as the total cost over the life of the program divided by the projected savings over an assumed life span of the savings 11 Cost per participant was calculated as the annual cost of the program divided by the estimated number of annual program participants

50 T h o r n t o n W a t e r E f f i c i e n c y P l a n
Residential WaterSense Toilet Rebates The WaterSense Toilet Rebate program offers a $75 rebate incentive for the replacement of a 1.6 gallon per flush (gpf) or greater toilet with the WaterSense labeled toilet. Starting in 2018, the rebate amount will be increased to $100 to encourage higher levels of participation. This rebate program began in 2003 and will continue to be offered to qualifying residential customers.
The replacement toilet must be new and for use in a residence located within the city of Thornton water service area. Sewer only customers are not eligible. This program is for the replacement of previously installed toilets only, not for new construction.
Benefits and Challenges The city of Thornton has been in partnership with the EPA on the WaterSense program since 2009. The mission of the program is to protect the future of our nation’s water supply by enhancing the market for water-efficient products and services. Certified products are labeled with the WaterSense logo to enable customers to identify water efficient fixtures. WaterSense labeled toilets are certified by the EPA for performance and efficiency. These toilets use 1.28 gpf or less, and therefore, are more water efficient than the standard 1.6 gpf toilet. To date, there have been a total of 1,663 participants in this rebate program. Given data collected since the 2009 Water Conservation Plan, there remains a large need and opportunity to upgrade toilets in this area. Moreover, Colorado legislation (Sentate Bill 14-103) requires that manufacturers of applicable indoor plumbing fixtures sell only WaterSense labeled products as of September 1, 2016.
Typical water savings per participant per year 10,995 gallons
Targeted number of participants per year 220
Estimated total savings per year 7.42 AF
Cost per acre-foot saved $217/AF
Cost per participant $147
Target Audience Residential
Image 23. Old Toilets Removed from Multifamily Building Image 24. New Water-Efficient Toilet

51 T h o r n t o n W a t e r E f f i c i e n c y P l a n
Public Outreach and Education Public outreach and education is the foundation of Thornton’s water efficiency programs. This program is implemented using a comprehensive strategy for promoting public awareness and water-efficient behaviors. A results-driven social marketing campaign with a target audience and consistent messaging has proven to be an effective way to reach residential water customers over the past 10 years. The success of the other programs listed in the Water Efficiency Plan is reliant on this program, which motivates customers to move from awareness and into action. The promotion of behavior change will be increasingly important as programs such as Turf Replacement are offered. The customer will need to overcome knowledge, resource and financial barriers to participate, and then learn how to maintain a water-wise landscape.
Benefits and Challenges Investment in this program has helped the city reach its 2016 residential 85 gpcd goal and promote participation in water-efficiency program. A high level of customer awareness of campaign messages has been documented using an annual survey. Challenges are addressed during annual strategy review and revision.
Estimated total savings per year 53 AF
Cost per acre-foot saved $2,688/AF
Target Audience Residential, Commercial
Pipeline Replacement and Leak Detection/Repair Program Thornton has implemented a systematic pipeline replacement program to improve water distribution system performance and control costs. The program uses historic break and repair data to develop a replacement plan that is primarily focused on the oldest pipes in the distribution system. The program is funded through Thornton’s CIP and is managed by the Engineering Division of the Infrastructure Department.
The pipeline replacement budget is $500,000 annually. Leak detection has historically been conducted by a contractor. Thornton has investigated the resources necessary to create a proactive, in-house leak detection program. One FTE Equipment operator and one FTE Field Maintenance staff would be needed. A one-time investment of $145,000 in equipment would also be needed.
Benefits and Challenges The program prevents a significant amount water loss in underground pipes and by reducing its waste the city can show that it is making water conservation a priority for itself and not just its customers. A commitment to funding pipeline replacement through the Capital Improvement Project (CIP) budget helps keep overall system water loss at an acceptable level. The challenge is in balancing other infrastructure needs within the CIP budget.
Estimated total savings per year 18.8 AF
Target Audience Utility

52 T h o r n t o n W a t e r E f f i c i e n c y P l a n
Residential, Commercial and HOA Outdoor Water Use Consultations This program provides free irrigation system evaluations for existing households, businesses and HOAs. Customers are provided with recommendations to improve their systems and a customized watering schedule.
Benefits and Challenges This program is voluntary and offered at no cost to qualifying residents, businesses and HOAs. The consultations leave the customer with a customized list of recommendations for increasing efficient water use outdoors. Given that this program is voluntary, only a portion of participating customers implement the recommendations.
Typical water savings per residential participant per year 6,000 gallons
Typical water savings per commercial/HOA participant per year 46,302 gallons
Targeted number of participants per year 105
Estimated total savings per year 2.55 AF
Cost per acre-foot saved (combined) $/AF
Cost per participant (combined) $191
Target Audience Residential, Commercial, HOA
Residential Indoor Water Use Consultation Homeowners in the Thornton water service area can take advantage of a free home water use consultation in partnership with a contractor. The consultation consists of:
1. An explanation of water bills and water use
2. Water fixture inventory and assessment
3. Shower head and faucet aerator retrofits
upon request
4. Recommendations for saving water indoors
Appointments are scheduled on a first come, first served basis. Appointments are approximately one-hour long.
Benefits and Challenges This program is offered at no cost to qualifying residents and is voluntary. The consultations leave the homeowner with a customized list of recommendations for increasing efficient water use in the home. The program provides valuable one-on-one education that improves homeowner awareness about water efficient practices. Given that this program is voluntary, there is no guarantee that all participating homeowners will implement the recommendations in their home. The program will
Image 25. Irrigation Controller
Image 26. Water Use Consultation

53 T h o r n t o n W a t e r E f f i c i e n c y P l a n
provide instant savings if participants elect for the water-efficient shower head and aerator installation at the time of the appointment.
Typical water savings per participant per year 3,000 gallons
Targeted number of participants per year 120
Estimated total savings per year 1.10 AF
Cost per acre-foot saved $3,457/AF
Cost per participant $159
Target Audience Residential
Commercial Toilet Rebates Similar to the WaterSense Toilet Rebate program, this program offers a $75 rebate incentive for the replacement of a 1.6 gallon per flush (gpf) or greater toilet with the WaterSense labeled toilet. An increased rebate of $300 will offered starting in 2018 for the installation of a flushometer valve toilets. The replacement toilet must be new and for use in a commercial establishment located within the city of Thornton water service area. Sewer only customers are not eligible. This program is for the replacement of previously installed toilets only, not for new construction.
Benefits and Challenges The city of Thornton has been in partnership with the EPA on the WaterSense program since 2009. The mission of the program is to protect the future of our nation’s water supply by enhancing the market for water-efficient products and services. Certified products are labeled with the WaterSense logo to enable customers to identify water efficient fixtures. WaterSense labeled toilets are certified by the EPA for performance and efficiency. These toilets do not exceed 1.28 gpf, and therefore, are more water efficient than the standard 1.6 gpf toilet. The cost of replacing flushometer-valve toilets is even higher than standard tank toilets as the bowls must be purchased separately when flush valves are replaced.
Typical water savings per toilet per year 10,835 gallons
Targeted number of planned installations per year 50
Estimated total savings per year 1.66 AF
Cost per acre-foot saved $500/AF
Cost per participant $332
Target Audience Commercial
Commercial Urinal Rebates Starting in 2018, the Commercial Urinal program will offer a $400 rebate incentive for the replacement of a 1.5 gpf or greater urinal with an ultra-efficient (0.5 gpf) or waterless urinal. A $75 per urinal rebate started in 2015 and will be continued through 2017.
Rebate requirements will be as follows:
The ultra-low flow urinal must replace a 1.5 gpf or greater urinal
Rebates are subject to the availability of funding
Urinal installations must be inspected by a city of Thornton representative

54 T h o r n t o n W a t e r E f f i c i e n c y P l a n
Benefits and Challenges This was the first incentive program offered to water customers in the commercial sector. The commercial sector offers a significant opportunity for water savings through new efficiency opportunities. The urinal rebate program and the benefits of ultra-low flow and waterless urinals will need to be marketed to business owners and managers. The amount of the rebate might have to be re-evaluated to ensure the incentive is adequate to encourage replacement of old urinals.
It may not be feasible to track actual water savings of rebate participants that share a master meter with other businesses. Water savings attributed to this program will need to be estimated through other means, such as data collections on the rebate application (i.e., number of employees, number of customers, type of urinal that was replaced, etc.).
Typical water savings per installation per year 4,680 gallons
Targeted number of installations per year 20
Estimated total savings per year 0.29 AF
Cost per acre-foot saved $1,993/AF
Cost per participant $572
Target Audience Commercial
City Parks Water Efficiency Program Thornton is committed to water efficiency on city-owned properties. An Irrigation Analyst oversees water management for the city’s 284 park irrigation meters and performs irrigation system audits to assess efficiency. Audits help document necessary improvements and justify the budget needed to make the irrigations systems as efficient as possible. An advanced meter analytics system was installed on 76 meters early in 2017 to provide real-time water usage data to Parks staff and to assist with early leak detection.
Benefits and Challenges With over 500 irrigated acres, city parks are the largest water customer in Thornton. An irrigation management plan is being developed and will be an essential tool for improving water efficiency on city-owned properties.
Estimated total savings per year 17.2 AF
Cost Staff time (1 FTE)
Target Audience Municipal
Image 27. Park Water-Wise Landscaping

55 T h o r n t o n W a t e r E f f i c i e n c y P l a n
Smart Irrigation Controller Rebates
Called “smart” controllers in the industry, weather and soil moisture-based irrigation controllers estimate lawn water requirements and automatically regulate irrigation based on local weather factors. This program began in 2013 and will continue to provide a rebate for the cost of smart irrigation controllers for residential, commercial, and HOA water customers.
Benefits and Challenges Smart irrigation controller technology simplifies irrigation management for the end user and can improve landscape water efficiency by up to 30%. The challenge is for the user to properly set up and maintain the controller. Homeowners that were under-watering their lawn prior to the installation of a smart controller may see an increase in water use until they learn to adjust the settings appropriately. The city will provide educational resources to smart controller rebate participants to assist with optimizing landscape water efficiency.
Typical water savings per residential participant per year 6,779 gallons
Typical water savings per commercial participant per year 46,302 gallons
Targeted number of residential installations per year 100
Targeted number of commercial installations per year 20
Estimated total savings per year 4.92 AF
Cost per acre-foot saved (combined) $1,115/AF
Cost per participant (combined) $306
Target Audience Residential, Commercial, HOA
Rain Sensor Rebates This program offers a $25 rebate for rain sensor devices purchased and installed into automatic sprinkler systems. Rebates are for residential, commercial, and HOA water customers.
Benefits and Challenges A rain sensor is an inexpensive device that can be easily installed with most automatic irrigation systems. The sensor is designed to interrupt the normal irrigation cycle when natural rainfall is detected. Therefore, rain sensor shut-off devices limit irrigation system over-watering during natural rainfall events, thereby reducing water waste. Because rain sensors are inexpensive and easy to install, this has been a well-received program for the community.
Typical water savings per participant per year 2,260 gallons
Targeted number of residential installations per year 25
Estimated total savings per year 0.17 AF
Cost per acre-foot saved $1,044/AF
Cost per participant $72
Target Audience Residential, Commercial, HOA
Direct Toilet Install Residential Program This program installs WaterSense labeled toilets for income-qualified water customers, replacing 1.6 gpf or greater toilets at no cost to the resident. Customers must be approved by the Thornton Cares Water

56 T h o r n t o n W a t e r E f f i c i e n c y P l a n
Assistance Program to qualify. To ensure that the existing toilet is not reused, replaced toilets will be hauled away as a part of the installation process.
The replacement toilet must be new and for use in a residence located within the city of Thornton water service area. Sewer only customers are not eligible. This program is for the replacement of previously installed toilets only, not for new construction.
Benefits and Challenges The city of Thornton has been in partnership with the EPA on the WaterSense program since 2009. The mission of the program is to protect the future of our nation’s water supply by enhancing the market for water-efficient products and services. Certified products are labeled with the WaterSense logo to enable customers to identify water efficient fixtures. WaterSense labeled toilets are certified by the EPA for performance and efficiency. These toilets do not exceed 1.28 gpf, and therefore, are more water efficient than the standard 1.6 gpf toilet.
Providing installation services and fixtures assists customers who may not have the resources to purchase and install toilets in their homes.
Typical water savings per participant per year 10,995 gallons
Targeted number of participants per year 80
Estimated total savings per year 2.70 AF
Cost per acre-foot saved $552/AF
Cost per participant $373
Target Audience Residential
Commercial Kitchen Spray Valve Retrofit Commercial pre-rinse spray valves (PRSV) are handheld spraying devices with a normally-closed valve that can be squeezed open by pressing a lever. Pre-rinsing involves manual spraying with hot water under pressure to remove food residue from food service items, such as, plates, dishes, utensils, and so on, before final cleaning in a commercial-grade dishwasher. The program provides free PRSVs to commercial kitchens.

57 T h o r n t o n W a t e r E f f i c i e n c y P l a n
Benefits and Challenges Upgrading to an EPA WaterSense labeled PRSV can increase commercial kitchen water efficiency by 20% and provide the added benefit of energy savings through reduced hot water usage. However, kitchen managers are hard to reach and it can be a challenge to promote the program.
Typical water savings per participant per year 10,000 gallons
Targeted number of participants per year 20
Estimated total savings per year 0.61 AF
Cost per acre-foot saved $4,918/AF
Cost per participant $150
Target Audience Commercial
Residential Water-Wise Garden Discount This program offers a $25 discount for a pre-planned water-wise garden. Water customers can remove a portion of their lawn and replace it with a water-wise garden that, once established, has one-third the
water requirement of the same square footage of turf.
Benefits and Challenges The benefit of this program is that it provides a simple first step toward water-wise landscaping. It encourages customers to try a small water-wise garden and learn how to maintain it. The challenge is that water savings are difficult to measure.
Typical water savings per participant per year 2,000 gallons
Targeted number of participants per year 80
Estimated total savings per year 0.49 AF
Cost per acre-foot saved $11,428/AF
Image 28. Water-Wise Landscape

58 T h o r n t o n W a t e r E f f i c i e n c y P l a n
Cost per participant $70
Target Audience Residential
Residential Turf Replacement This is a contracted program that offers free education and materials for residential customers to remove a portion of their lawn and replace with less water intensive landscapes. Participants receive free plants for a 200-sq. ft. garden and a spray-to-drip conversion kit.
Benefits and Challenges Landscaping, especially lawns, consumes a significant proportion of a customer’s outdoor water use. This program offers a simple approach to water-wise gardening to replace turf, reducing watering requirements and saving money. The program specifies a timeline for garden installation, which can be a barrier to participation.
Typical water savings per participant per year 2,000 gallons
Targeted number of participants per year 50
Estimated total savings per year 0.31 AF
Cost per acre-foot saved $6,539/AF
Cost per participant $401
Targeted Audience Residential
Residential Water Report Card As part of this program, all Tier 3 and 4 residential customers will receive a ‘report card’ of their water use in an attempt to educate customers about opportunities to reduce their consumption. These report cards will provide comparisons to their neighbors as a motivator. This program is assumed to reduce water use 5%, on average, amongst the 6,000 highest use customers in the city’s service area that will be targeted.
Benefits and Challenges This will prevent water waste by alerting customers about high volume use and give customers an overall awareness of the water that they use in their homes and businesses. The main challenge to this type of program is savings persistence.
Typical Water savings per participant per year 1,309 gallons
Targeted number of participants per year 6,000
Estimated total savings per year 5.26 AF
Cost per acre-foot saved $2,853/AF
Cost per participant $13
Target Audience Residential
Rain Barrel Rebate This program provides a $50 rebate to customers who purchase and install rain barrels to reduce their outdoor water use consumption.

59 T h o r n t o n W a t e r E f f i c i e n c y P l a n
Benefits and Challenges Rain barrel rebate programs have been shown to be successful in other states. Colorado recently changed legislation to allow up to 2 – 55 gallon barrels per household to store rainwater for outdoor use. Public interest in rain barrels is high and providing a rebate promotes this simple water-saving technique.
Typical water savings per barrel 660 gallons
Targeted number of participants per year 50
Estimated total savings per year 0.20 AF
Cost per acre-foot saved $3,396/AF
Cost per participant $69
Targeted Audience Residential
Residential and Commercial Turf Alternative Rebate This is a rebate program designed to incentivize the installation of low to no-water landscapes including permeable hardscapes, such as paver patios, and water-wise gardens. Artificial turf can be used to reduce landscape water demand if desired. City landscaping code allows artificial turf in the back and side yards not visible from the street. This program will apply to new installations or turf replacement. The rebate is proposed to be $1 per sq. ft. with a maximum of $1,000 for residential and commercial customers while HOAs have a maximum of $X .
Benefits and Challenges
Typical water savings per participant per year 10,000 gallons
Targeted number of participants per year 100
Estimated total savings per year 3.07 AF
Cost per acre-foot saved $3,483/AF
Cost per participant $1,069
Targeted Audience Residential, Commercial
Large Landscape Design Consultation This program provides landscape design consultations to eligible residential and commercial customers for a $50 fee. Participating customers are then eligible to participate in the Turf Alternative Rebate Program.
Benefits and Challenges Participating customers have the opportunity to work one-on-one with a certified landscape architect on a water-wise landscape design that will save both water, money, and improve the natural local ecosystem.
Targeted number of participants per year 50
Targeted Audience Residential, Commercial

60 T h o r n t o n W a t e r E f f i c i e n c y P l a n
EPA WaterSense Home Builder Incentive This is a voluntary program that incentivizes home builders to meet EPA WaterSense New Home specifications. Both indoor and outdoor water efficiency specifications are listed, including water-wise landscaping and smart irrigation controllers. Incentives could be in the form of a reduced tap fee or a $1,000 rebate.
Benefits and Challenges The program is designed to encourage new homes to be constructed with water-efficient features so that no retrofits are required. The homeowner is set up to use 20% less water than older homes on the market. The challenge is to convince builders of the benefit to participating in the program.
Typical water savings per participant per year 26,000 gallons
Targeted number of participants per year 25
Estimated total savings per year 1.99 AF
Cost per acre-foot saved $1,443/AF
Cost per participant $1,152
Targeted Audience Residential
Irrigation System Improvements Program Targeted efficiency program for residential customers who save at least 2,000 gallons of water per year and commercial customers who save at least 5% of their annual irrigation water use. Requires an irrigation system audit to first identify the best opportunities for savings and to qualify for a $100 per 2,000 gallon savings rebate. To participate in the Irrigation System Improvement rebate program, customers must first receive a city of Thornton Irrigation System Audit. During the irrigation audit, products may be suggested to help customers increase water use efficiency. These recommendations are customized to the individual property. Products that are frequently recommended include: smart controllers, pressure reducing valves, and rotary nozzles.
Benefits and Challenges This program will require an audit to be eligible for the offered rebate, after which not all customers will implement the recommendations. However, many of the recommended measures for water customers to implement are inexpensive and easy to install.
Typical water savings per residential participant per year 2,000 gallons
Typical water savings per commercial participant per year 39,881 gallons
Targeted number of total participants per year 80
Estimated total savings per year 1.07 AF
Image 29. Rotary Spray Nozzle
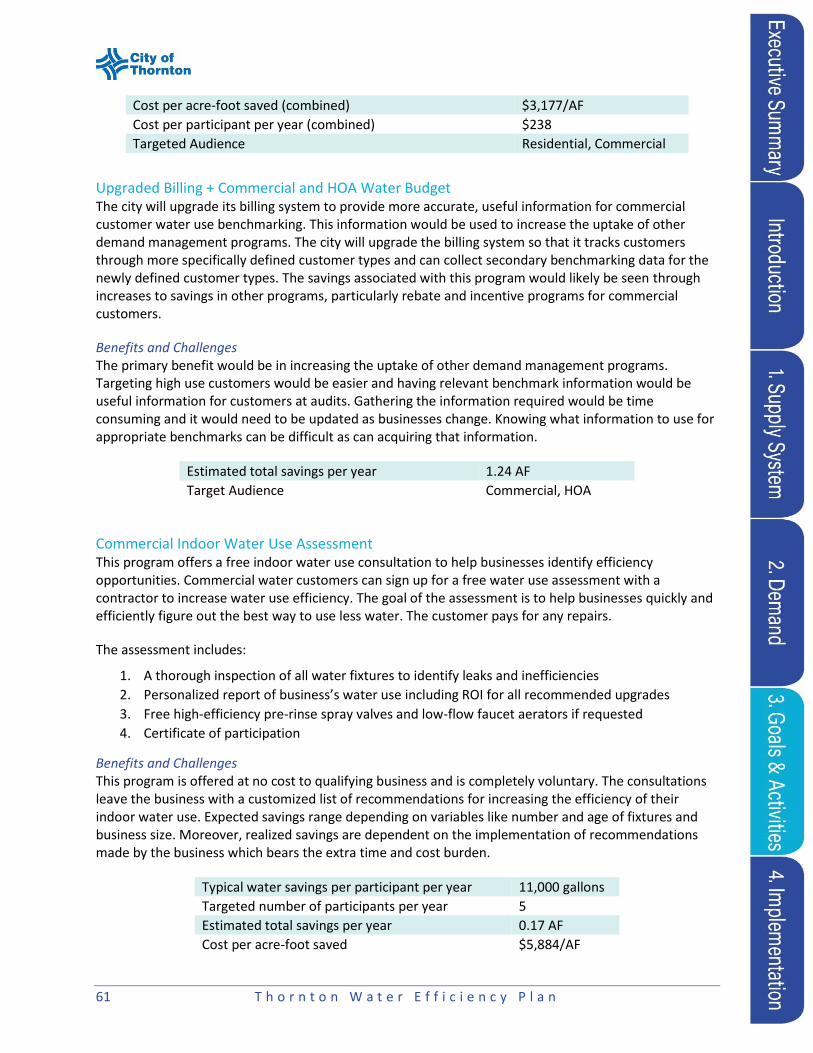
61 T h o r n t o n W a t e r E f f i c i e n c y P l a n
Cost per acre-foot saved (combined) $3,177/AF
Cost per participant per year (combined) $238
Targeted Audience Residential, Commercial
Upgraded Billing + Commercial and HOA Water Budget The city will upgrade its billing system to provide more accurate, useful information for commercial customer water use benchmarking. This information would be used to increase the uptake of other demand management programs. The city will upgrade the billing system so that it tracks customers through more specifically defined customer types and can collect secondary benchmarking data for the newly defined customer types. The savings associated with this program would likely be seen through increases to savings in other programs, particularly rebate and incentive programs for commercial customers.
Benefits and Challenges The primary benefit would be in increasing the uptake of other demand management programs. Targeting high use customers would be easier and having relevant benchmark information would be useful information for customers at audits. Gathering the information required would be time consuming and it would need to be updated as businesses change. Knowing what information to use for appropriate benchmarks can be difficult as can acquiring that information.
Estimated total savings per year 1.24 AF
Target Audience Commercial, HOA
Commercial Indoor Water Use Assessment This program offers a free indoor water use consultation to help businesses identify efficiency opportunities. Commercial water customers can sign up for a free water use assessment with a contractor to increase water use efficiency. The goal of the assessment is to help businesses quickly and efficiently figure out the best way to use less water. The customer pays for any repairs.
The assessment includes:
1. A thorough inspection of all water fixtures to identify leaks and inefficiencies
2. Personalized report of business’s water use including ROI for all recommended upgrades
3. Free high-efficiency pre-rinse spray valves and low-flow faucet aerators if requested
4. Certificate of participation
Benefits and Challenges This program is offered at no cost to qualifying business and is completely voluntary. The consultations leave the business with a customized list of recommendations for increasing the efficiency of their indoor water use. Expected savings range depending on variables like number and age of fixtures and business size. Moreover, realized savings are dependent on the implementation of recommendations made by the business which bears the extra time and cost burden.
Typical water savings per participant per year 11,000 gallons
Targeted number of participants per year 5
Estimated total savings per year 0.17 AF
Cost per acre-foot saved $5,884/AF

62 T h o r n t o n W a t e r E f f i c i e n c y P l a n
Cost per participant $993
Target Audience Commercial
High Water Use Commercial Process Efficiency Incentives This program is broad in scope, allowing large commercial customers to be rewarded for water savings from a variety of indoor efficiency improvements. The program would include an upfront audit to determine current indoor water use and installation of a smart meter in replace of a conventional meter, if not already converted, which the customer can then use to inform how best they can reduce their water consumption. After the improvements are made the customer would receive a rebate based on the total volume saved if that amount is over 100,000 gallons per year.
Benefits and Challenges This program gives customers a great deal of agency in their water use and billing. It is flexible enough to allow for innovative water saving practices that may not be widely enough adopted to warrant a specific program. The integration of smart meter technology further enables participating customers to understand the patterns and trends of one’s water usage to help better manage their consumption.
The potential for water savings is high without needing to work with many customers. Because of the size of the savings requirements uptake in the program may be limited. Also, customers that may be able to meet the requirement may not be interested in participating.
Typical water savings per participant per year 100,000 gallons
Targeted number of participants per year 5
Estimated total savings per year 1.53 AF
Cost per acre-foot saved $2,340/AF
Cost per participant $7,182
Targeted Audience Commercial
Advanced Metering Infrastructure (AMI) Advanced metering infrastructure (AMI) is an integrated system of smart water meters, communications networks, and data management systems that enables two-way communication between utilities and customers. The system allows real-time access to water usage information at each water meter, and allows customers and the city to better manage water usage, detect water leaks, and operate the water distribution system. Currently, water usage is measured and recorded monthly. AMI is particularly beneficial in conservation efforts and during a drought. Usage restrictions or conservation efforts can be instantly measured, and quick actions can be taken to modify water usage.
Benefits and Challenges The implementation of AMI is being planned by the Utilities Division. The Water Resources Division will need to coordinate with Utilities staff to ensure the technology includes the analytics needed for water conservation efforts.
Typical water savings per meter 8,197 gallons
Targeted number of participants per year 9,848
Estimated total savings per year 248 AF

63 T h o r n t o n W a t e r E f f i c i e n c y P l a n
Cost per acre-foot saved $4868/AF
Cost per meter converted $612
Targeted Audience All
3.4 Water Efficiency Impacts on Demand Forecasts and Supply Planning
Revised Demand Forecast The demand forecasts shown in Chapter 2 were modified by incorporating the water efficiency measures and programs selected for implementation. As previously mentioned, the city of Thornton possesses adequate water supplies and capacity within its existing system to meet demand over the planning horizon used in this plan. Table 13 shows the projected daily demands with and without water efficiency measures and conservation.
Table 13. Modified Demand Forecast
Item Baseline Year
(2015) 2017 2024
Average-day demand before conservation (AF/day)
74.5 76.8 84.8
Average-day demand after conservation (AF/day)
n/a 75.8 81.9
Reduction in average-day demand (AF/day)
n/a 0.99 2.94
Maximum-day demand before conservation (AF/day)
171.4 177 195
Maximum day demand after conservation (AF/day)
n/a 174 188
Reduction in maximum day demand (AF/day)
n/a 3 7
Identification of Project Specific Water Savings While the most accurate water savings estimates were used in the development of this Plan, achieving these results for the measures and programs identified are highly dependent on the level of public participation. The measures and programs identified with this planning effort will not enable the elimination of future capital improvement projects necessary to meet the city’s projected demands. The water efficiency savings contemplated with this planning effort are envisioned to help reduce the amount of water that the city must ultimately acquire or develop in order to meet demands at build-out. Water savings have been estimated based on the data available and the use of prudent assumptions, there is not enough certainty in the data to support water capacity design decisions. As additional data becomes available, the estimated water savings in this Water Efficiency Plan may need to be revised.
Revised Supply Capacity Forecast Table 14 summarizes projected annual treated water system demands, and compares potential reductions in system demand due to efficiency savings.
Table 14. Revised Annual Supply-Capacity Forecast
Year Projected Demand w/o
Efficiency Savings Planned Firm Yield
of System Projected Water
Efficiency Savings Projected Demand w/
Efficiency Savings

64 T h o r n t o n W a t e r E f f i c i e n c y P l a n
(annual AF) (annual AF) (annual AF) (annual AF)
2017 28,024 28,700 362 27,662
2024 30,970 30,000 1,071 29,898
Forecast Modification and Benefits of Efficiency Water supply planning and development requires years of planning to ensure adequate water supplies are available when they are needed. Due to the uncertainty of efficiency savings it would not be prudent on the city’s part to rely on estimated water savings as a justification for delaying or eliminating planned and needed system development. In the future, as efficiency savings become evident, the savings may well reduce the amount of water that the city must ultimately acquire or develop in order to meet demand at build-out. Figure 19 illustrates Thornton’s projected demands and the estimated effects of water efficiency.
Figure 19. Supply & Projected Demands With and Without Efficiency Savings
26,000
27,000
28,000
29,000
30,000
31,000
32,000
2017 2018 2019 2020 2021 2022 2023 2024
Acr
e-Fe
et
Supply and Projected Demand With and Without Efficiency Savings
Projected Demand w/o Efficiency Savings Planned Firm Yield of System

65 T h o r n t o n W a t e r E f f i c i e n c y P l a n
Revenue Effects The City of Thornton regularly updates its Water Rate and Connection Fee Report, with the most recent update occurring in 2015. Among other things, this report establishes cost of service, annual revenue requirements, tap fees and water user charges need to recover costs. The impact of water efficiency programs on projected demands was factored into the revenue analysis.
The selected water efficiency measures and programs will potentially have an impact on revenue, should the assumptions used to estimate water savings associated with the identified measures and programs prove to be on target. Conservation and efficiency effects on revenue will be addressed by the city as necessary.
Anticipated modifications to capital improvement projects and water acquisitions are due to postponement of two projects, Cooley East Reservoir and Zadel Reservoir. Both projects have been delayed until after 2030 with a potential cost savings of $10,000,000 each.
Image 30. Marshall Lake Park

66 T h o r n t o n W a t e r E f f i c i e n c y P l a n
Chapter 4:
Implementation and Monitoring Plan
This section provides a summary of all the actions for the selected measures and programs to be implemented. It also defines when the Plan is to be updated to reflect ongoing efforts and to incorporate new approaches for the city’s overall water efficiency strategy.
4.1 Implementation Plan
The implementation plan is intended to help the city achieve its efficiency goals outlined in this Plan. Details of this effort are described in Table 15 outlining the associated steps and timeline, resources, and key indicators for each program identified for implementation. However, other factors including changes in development, water use intensity, or budget could cause a delay in implementation or an indefinite cancelation in an of the programs identified for implementation.
Image 31. Thorntonfest Information Booth

67 T h o r n t o n W a t e r E f f i c i e n c y P l a n
Table 15. 2017-2024 Implementation Plan Summary
Program Description Implementation Timeline
Key Players & Partners
Metrics*
Clothes Washer Rebate
The Clothes Washer Rebate program offers a $100 rebate incentive for the purchase and install of a qualifying clothes washer.
Currently Implemented City staff Number of participating households
Residential WaterSense Toilet Rebate
The WaterSense Toilet Rebate program offers arebate incentive for the installation of WaterSense labeled toilets.
Currently Implemented City staff Number of rebates
Pipeline Replacement Program
Thornton has implemented a systematic pipeline replacement program in order to improve water distribution system performance and control costs.
Currently Implemented City staff, Contractor Length of pipeline replaced/ reduction in distribution losses
Direct Toilet Install Program
Multi-family toilet rebates older toilets with new high-efficiency WaterSense models.
Currently Implemented City staff Number of rebates
Residential Indoor Water Use Consultation
Free home water use consultation in partnership with a contractor.
Currently Implemented City staff, Contractor Number of consultations
Demonstration Garden Maintenance Program
Thornton maintains three water-wise demonstration gardens for the public.
Currently Implemented City staff Number of garden tour attendees
Commercial Toilet Program
This program provides a $75 rebate to CII customers who install high efficiency WaterSense toilets. Consider increasing rebate to $300 for flushometer valve toilets.
Currently Implemented City staff Number of rebates
Commercial Urinal Rebate
This program offers a $100 rebate incentive for the replacement of a 1.5 gpf or greater urinal with an ultra-low flow (0.5 gpf) or waterless urinal. Consider increasing rebate $ amount.
Currently Implemented City staff Number of rebates
Smart Irrigation Controller and Rain Sensor Rebates
A rebate is provided to residential, commercial and HOA customers that covers the cost of weather or soil moisture-based controllers.
Currently Implemented City staff Number of rebates
Commercial Kitchen Spray Valve Retrofit
Free spray valves are provided to commercial kitchens.
Currently Implemented City staff, Contractor Number of spray valves provided
Residential Water-Wise Garden Discount
This is a $25 discount off of qualifying plants offered to customers for a garden that covers 100 sq. ft.
Currently Implemented City staff, Contractor Number of gardens

68 T h o r n t o n W a t e r E f f i c i e n c y P l a n
Program Description Implementation Timeline
Key Players & Partners
Metrics*
Residential, Commercial, and HOA Sprinkler Consultation
This program provides free outdoor audits for households and HOAs which includes automatic irrigation system evaluations and landscape evaluations. Customers are provided with recommendations to improve their systems and a customized watering schedule.
Currently Implemented City staff, Contractor Number of consultations
City Parks Water Efficiency
Targeted efficiency program for city parks. This program will help the city to lead by example with the goal of reducing water use at city parks.
Currently Implemented Facilities Manager(s), City staff
Number of parks audited. Water savings achieved in audited parks.
Public Outreach and Education
Social marketing campaign. Currently Implemented City staff, contractor Survey results
Residential Water Report Card
This program will provide report cards to users in the third and fourth consumption tiers. These report cards will provide comparisons to their neighbors as a motivator.
2017 City staff, Contractor Water use reduction compared to control group; individual participating household water savings
Residential Turf Replacement
This is a contracted program that offers a workshop and materials for the removal of turf in replacement with less water intensive landscapes.
2017 City staff, Contractor Number of participants, water savings
Rain Barrel Rebate This program provides a rebate to customers who purchase and install rain barrels to reduce their outdoor water consumption.
2018 City staff Number of participants
Residential and Commercial Turf Alternative Rebate
This program provides a rebate to residential and commercial customers for the replacement of high water demand landscaping with low-water demand, permeable landscaping.
2018 City staff Sq. ft. converted, Number of participants, water savings
Pilot Large Landscape Design Consultation
This program provides landscape design consultations to eligible residential and commercial customers.
2018 – Pilot City staff, Landscape design consultant
Sq. ft. converted, Number of participants, water savings
Large Landscape Design Consultation
If pilot program is successful, continue to implement
2019 City staff, Landscape design consultant
Sq. ft. converted, Number of participants, water savings
EPA WaterSense Home Builder Incentive
Voluntary program that incentivizes home builders to meet EPA WaterSense New Home specifications. Incentive could be in the form of a reduced tap fee or rebate.
2019 City staff
Number of homes built with EPA WaterSense specifications, water savings compared to homes built without specifications.

69 T h o r n t o n W a t e r E f f i c i e n c y P l a n
Program Description Implementation Timeline
Key Players & Partners
Metrics*
Irrigation System Improvements Program
Targeted efficiency program for residential customers who save at least 2,000 gallons of water per year and commercial customers who save 5% of their annual water use. Requires an outdoor audit to first identify the best opportunities for savings and to qualify for a rebate.
2020 City staff Number of audits conducted, water savings
Upgraded Billing + HOA Water Budget
The city will upgrade its billing system to provide more accurate, useful information for commercial customer water use benchmarking.
2021 Contractor, Staff to administer key accounts program
Completion of upgraded billing structure and customer roll-out
Commercial Indoor Water Use Assessment
This program offers a free water use assessment to help businesses identify efficiency opportunities. Commercial water customers can sign up for a free water use assessment to increase water use efficiency.
2022 City staff, Contractor; Potential partnership with Xcel Energy
Number of assessments, potential water savings
Targeted Commercial Process Efficiency Incentives
This program is broad in scope, allowing large CII customers to be rewarded for water savings from a variety of indoor efficiency improvements.
2023 City staff Number of participants, water savings
Advanced Metering Infrastructure (AMI)
Advanced metering infrastructure (AMI) is an integrated system of smart water meters, communications networks, and data management systems that enables two-way communication between utilities and customers. The system allows real-time access to water usage information at each water meter, and allows customers and Thornton to better manage water usage, detect water leaks, and operate the water distribution system. Currently, water usage is measured and recorded monthly. AMI is particularly beneficial in conservation efforts and during a drought. Usage restrictions or conservation efforts can be instantly measured, and quick actions can be taken to modify water usage.
2024 City staff, Contractor Water savings, customer behavior change metrics
*Note: All metrics are tracked on an annual basis.
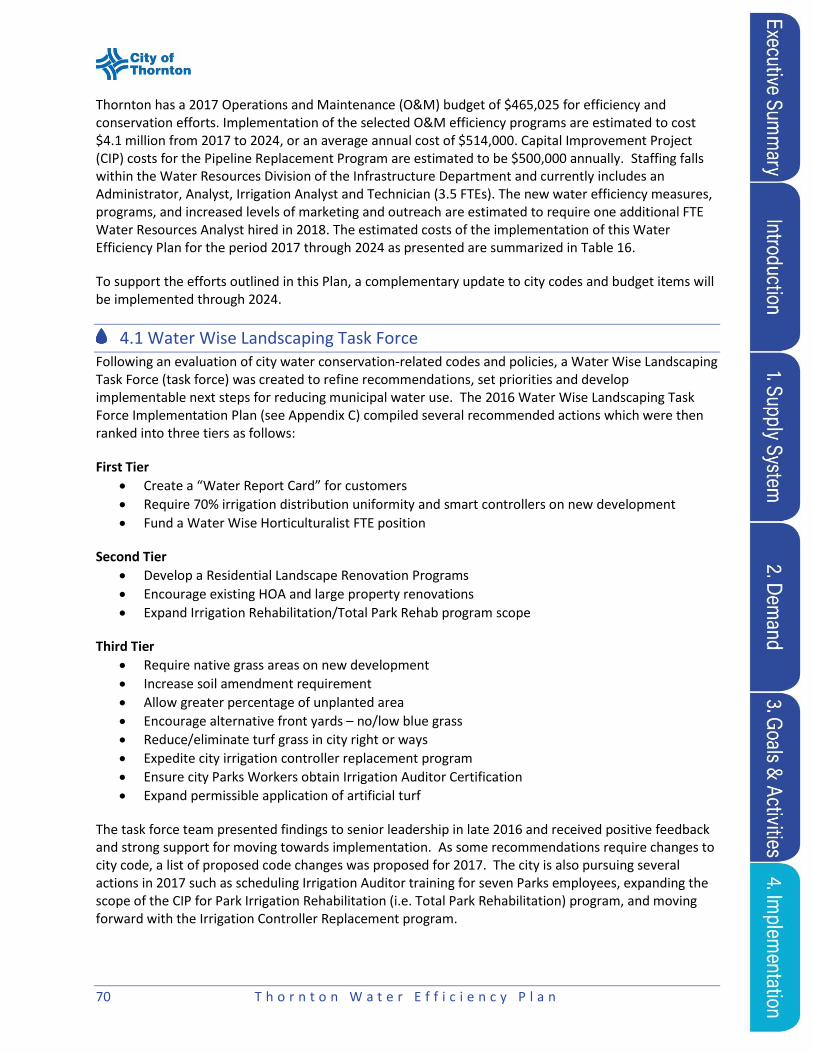
70 T h o r n t o n W a t e r E f f i c i e n c y P l a n
Thornton has a 2017 Operations and Maintenance (O&M) budget of $465,025 for efficiency and conservation efforts. Implementation of the selected O&M efficiency programs are estimated to cost $4.1 million from 2017 to 2024, or an average annual cost of $514,000. Capital Improvement Project (CIP) costs for the Pipeline Replacement Program are estimated to be $500,000 annually. Staffing falls within the Water Resources Division of the Infrastructure Department and currently includes an Administrator, Analyst, Irrigation Analyst and Technician (3.5 FTEs). The new water efficiency measures, programs, and increased levels of marketing and outreach are estimated to require one additional FTE Water Resources Analyst hired in 2018. The estimated costs of the implementation of this Water Efficiency Plan for the period 2017 through 2024 as presented are summarized in Table 16.
To support the efforts outlined in this Plan, a complementary update to city codes and budget items will be implemented through 2024.
4.1 Water Wise Landscaping Task Force Following an evaluation of city water conservation-related codes and policies, a Water Wise Landscaping Task Force (task force) was created to refine recommendations, set priorities and develop implementable next steps for reducing municipal water use. The 2016 Water Wise Landscaping Task Force Implementation Plan (see Appendix C) compiled several recommended actions which were then ranked into three tiers as follows:
First Tier
Create a “Water Report Card” for customers
Require 70% irrigation distribution uniformity and smart controllers on new development
Fund a Water Wise Horticulturalist FTE position
Second Tier
Develop a Residential Landscape Renovation Programs
Encourage existing HOA and large property renovations
Expand Irrigation Rehabilitation/Total Park Rehab program scope
Third Tier
Require native grass areas on new development
Increase soil amendment requirement
Allow greater percentage of unplanted area
Encourage alternative front yards – no/low blue grass
Reduce/eliminate turf grass in city right or ways
Expedite city irrigation controller replacement program
Ensure city Parks Workers obtain Irrigation Auditor Certification
Expand permissible application of artificial turf
The task force team presented findings to senior leadership in late 2016 and received positive feedback and strong support for moving towards implementation. As some recommendations require changes to city code, a list of proposed code changes was proposed for 2017. The city is also pursuing several actions in 2017 such as scheduling Irrigation Auditor training for seven Parks employees, expanding the scope of the CIP for Park Irrigation Rehabilitation (i.e. Total Park Rehabilitation) program, and moving forward with the Irrigation Controller Replacement program.

71 T h o r n t o n W a t e r E f f i c i e n c y P l a n
As plans are refined in the future, factors including ease of implementation, return on investment, phasing and measure of success will be further detailed. Additionally, staff are working to not only make sure customers are better informed about their water use but to also ensure that other city departments such as Parks have increased access to water usage information.
The 2016 Water Wise Landscape Task Force Implementation Plan compiled several recommended actions (see Appendix C) including city code changes. Code changes proposed for 2017 that were taken from these recommendations include:
70% Irrigation Distribution Uniformity Standard for new development
WaterSense Irrigation Controllers required for new residential development
Native Grass Areas requires for all new development and large landscaped areas
Allow a higher percentage of unplanted area for all new development and large landscaped areas
Additionally, the city is pursuing Irrigation Auditor training for seven Parks employees in the 2017 and the expansion to the scope of the CIP for Park Irrigation rehabilitation, total Park Rehabilitation, and Irrigation Controller Replacement program.
4.2 Plan Review, Monitoring, Evaluation, and Update
The Water Conservation Act of 2004 requires that the Draft Water Efficiency Plan be made available to the public for review and comment. The city of Thornton will comply with this requirement by placing the Draft Water Efficiency Plan on the City Council meeting agenda, providing public notice of the plan as an agenda item, allowing time for public review and comment, and adoption of the plan after it is approved by the Colorado Water Conservation Board. This process complies with city of Thornton Charter requirements which include provisions for public advertisement, review, comment, and adoption by the City Council.
The measures and programs outlined in this Plan will be monitored to determine their effectiveness in achieving the long-term water savings goals of the city. Measures and programs determined not to be significantly effective will be discontinued.
The city of Thornton intends to update the Plan, at minimum every seven-years, as required by Colorado’s water conservation planning statute. The city will continue to collect and analyze data on a regular basis. Future revisions of the Plan will incorporate updated and new data sources.

72 T h o r n t o n W a t e r E f f i c i e n c y P l a n
72 T h o r n t o n W a t e r E f f i c i e n c y P l a n
Table 16. Estimated Costs of the 2017-2014 Implementation Plan.
Program Existing/New Year O&M/CIP 2017 2018 2019 2020 2021 2022 2023 2024 Total
Clothes Washer Rebate
Existing 2003 O&M $10,000 $10,000 $20,000
Residential WaterSense Toilet Rebate
Existing 2003 O&M $9,375 $9,375 $9,375 $9,375 $9,375 $9,375 $9,375 $9,375 $75,000
Pipeline Replacement Program
Existing 2008 CIP $500,000 $500,000 $500,000 $500,000 $500,000 $500,000 $500,000 $500,000 $4.00
million
Direct Toilet Install Program
Existing 2014 O&M $24,000 $24,000 $24,000 $24,000 $24,000 $24,000 $24,000 $24,000 $192,000
Residential Indoor Water Use Consultation
Existing 2010 O&M $12,600 $12,600 $12,600 $12,600 $12,600 $12,600 $12,600 $12,600 $100,800
Demonstration Garden Maintenance
Existing 2010 O&M $30,000 $30,000 $30,000 $30,000 $30,000 $30,000 $30,000 $30,000 $310,000
Commercial Toilet and Urinal Program
Existing 2011 O&M $15,000 $15,000 $15,000 $15,000 $15,000 $15,000 $15,000 $15,000 $120,000
Smart Irrigation Controller and Rain Sensor Rebates
Existing 2013 O&M $16,250 $16,250 $16,250 $16,250 $16,250 $16,250 $16,250 $16,250 $130,000
Commercial Kitchen Spray Valve Retrofit
Existing 2015 O&M $2,500 $2,500 $2,500 $2,500 $2,500 $2,500 $2,500 $2,500 $20,000
Residential Water-Wise Garden Discount
Existing 2016 O&M $5,600 $5,600 $5,600 $5,600 $5,600 $5,600 $5,600 $5,600 $44,800
Residential, Commercial and HOA Sprinkler Consultation
Existing 2008 O&M $57,080 $57,080 $57,080 $57,080 $57,080 $57,080 $57,080 $57,080 $456,640
City Parks Water Efficiency
Existing 2010 O&M $5,000 $5,000 $5,000 $5,000 $5,000 $5,000 $5,000 $5,000 $40,000

73 T h o r n t o n W a t e r E f f i c i e n c y P l a n
73 T h o r n t o n W a t e r E f f i c i e n c y P l a n
Program Existing/New Year O&M/CIP 2017 2018 2019 2020 2021 2022 2023 2024 Total
Public Outreach and Education
Existing 2007 O&M $176,633 $176,633 $176,633 $176,633 $176,633 $176,633 $176,633 $176,633 $1.41
million
Residential Water Report Card
New 2017 O&M $75,000 $65,000 $65,000 $65,000 $65,000 $65,000 $65,000 $465,000
Residential Turf Replacement
New 2017 O&M $15,250 $15,250 $15,250 $15,250 $15,250 $15,250 $15,250 $15,250 $122,000
Rain Barrel Rebate
New 2018 O&M $1,250 $1,250 $1,250 $1,250 $1,250 $1,250 $1,250 $8,750
Residential and Commercial Turf Alternative
New 2018 O&M $20,000 $20,000 $20,000 $20,000 $20,000 $20,000 $20,000 $140,000
Pilot Large Landscape Design Consultation
New 2018 O&M $25,000 $25,000
Large Landscape Design Consultation
New 2019 O&M $25,000 $25,000 $25,000 $25,000 $25,000 $25,000 $150,000
EPA WaterSense Home Builder Incentive
New 2019 O&M $25,000 $25,000 $25,000 $25,000 $25,000 $25,000 $150,000
Irrigation System Improvements Program
New 2020 O&M $5,000 $5,000 $5,000 $5,000 $5,000 $25,000
Upgraded Billing + HOA Water Budget
New 2021 O&M $20,000 $20,000
Commercial Indoor Water Use Assessment
New 2022 O&M $10,000 $10,000 $10,000 $30,000

74 T h o r n t o n W a t e r E f f i c i e n c y P l a n
74 T h o r n t o n W a t e r E f f i c i e n c y P l a n
Program Existing/New Year O&M/CIP 2017 2018 2019 2020 2021 2022 2023 2024 Total
Targeted Commercial Process Efficiency Incentives
New 2023 O&M $20,000 $20,000 $40,000
AMI Existing/New 2024 CIP $2,000,000 $2.00
million
Total O&M $465,025 $500,538 $515,538 $520,538 $540,538 $530,538 $550,538 $485,538 $4.10
million
Total CIP $500,000 $500,000 $500,000 $500,000 $500,000 $500,000 $500,000 $6,500,000 $10.0
million
Total $965,025 $1,000,538 $1,015,538 $1,020,538 $1,040,538 $1,030,538 $1,030,538 $6,985,538 $14.1
million

75 T h o r n t o n W a t e r E f f i c i e n c y P l a n
Ap
pen
dix
A: R
aw W
ater
Map

76 T h o r n t o n W a t e r E f f i c i e n c y P l a n
Ap
pen
dix
B: T
ho
rnto
n W
ater
Ser
vice
Are
a

77 T h o r n t o n W a t e r E f f i c i e n c y P l a n
Appendix C: 2016 WaterWise Landscape Task
Force Implementation Plan
Program Department/Division Implementation Plan
Customer Water Report ID/Water Resources Propose in 2017 O&M Budget;
estimated cost $100,000
Residential Landscape Renovation
Programs ID/Water Resources
Provide one-on-one consultations to
customers regarding landscape re-
design, plant health, and irrigation
systems
ID/Water Resources
Propose Contract Water Wise
Landscape Liaison FTE in 2017
O&M Budget
Offer free or subsidized workshops
with local landscape architects that
offer design services
ID/Water Resources Propose in 2017 O&M Budget
Provide rebates or matching funds for
design services, installation services ID/Water Resources
Evaluate in 2017 Water
Conservation Plan Update
Provide turf replacement and soil
amendment incentive ID/Water Resources
Evaluate in 2017 Water
Conservation Plan Update
Provide professional resources for
landscape re-design (list of certified
contractors)
ID/Water Resources
Publish list on
Thorntonwater.com and other
sites by Q4 2016; continuous
updates
Stage an “Extreme Makeover”
demonstration ID/Water Resources
Propose in 2017 CIP Budget:
one renovation in each Ward
to be completed over four
years. Estimated cost $40,000
Continue/expand education and
outreach focusing on planning and
growing healthy, water-wise landscapes
(expand existing free class offerings,
expand demonstration gardens)
ID/Water Resources Ongoing
Irrigation system installation permits
and/or audits n/a Do not implement

78 T h o r n t o n W a t e r E f f i c i e n c y P l a n
Certification program for landscape
professionals n/a Do not implement
Continue free irrigation system audits,
free nozzle replacement, irrigation
controller rebates, rain sensor rebates
(existing programs)
ID/Water Resources Propose in 2017 O&M Budget
Parks Smart Metering ID/Water Resources Propose in 2017 CIP Budget.
Estimated cost $30,000
Commercial/HOA Landscape
Renovation CD
Outreach to high water users
(ongoing)
Develop info packets on
cost/benefit
Develop incentives (2017)
70% Irrigation Distribution Uniformity
Standard CD
Immediate policy
implementation
Include in next Standards and
Specifications Update
Smart Irrigation Controllers required for
new development CD
Immediate policy
implementation for
commercial
Vet with Homebuilders
Association for Residential
Implementation
Include in next Standards and
Specifications Update
Require Native Grass Areas on new
development (HOA & Large Properties) CD
Immediate encouragement
during design phase
Code change Q4 2016
Increase the Soil Amendment
Requirement to 5 cu. Yards per 1,000 sq
ft
CD
Immediate encouragement
during design phase
Vet with Homebuilders
Association
Code change Q4 2016
Encourage Alternative Front Yards CD

79 T h o r n t o n W a t e r E f f i c i e n c y P l a n
Higher Percentage of Unplanted Area
on new development projects CD
Immediate policy
implementation
Code change
Artificial Turf CMO Consultant study
Expand Irrigation Rehabilitation CIP
Scope CS/Parks & Open Space Propose in 2017 CIP Budget
Right of Way Landscape Rehabilitation -
reduce/eliminate bluegrass CS/Parks & Open Space
Expand Total Park Rehabilitation CIP
Scope CS/Parks & Open Space Propose in 2017 CIP Budget
Expand Irrigation Controller
Replacement Program CS/Parks & Open Space Propose in 2017 CIP Budget
Irrigation Auditor Certification for Parks
Employees CS/Parks & Open Space Propose in 2017 O&M Budget
Dry-out Non-sport field areas n/a Do not implement
City-wide coordination All Ongoing via quarterly Task
Force meetings
80 T h o r n t o n W a t e r E f f i c i e n c y P l a n
Back Cover


