56
2018 Hotel Chain Development Pipelines in Africa

2018Hotel Chain
Development Pipelines in Africa

2Hotel Chain Development Pipelines in Africa 2018
Corinthia Hotel Khartoum
Front Page:Marriott
Cape Town
It is with great pleasure that we present the 2018 edition of our annual Hotel Chain Development Pipelines in Africa. This is our 10th edition, and we present it with a sense of achievement and pride, as we have been instrumental in documenting with some accuracy the development activity of the hotel chains, hotel owners and investors in Africa over the past decade, at least that activity which is associated with one of the chains.
It has been a positive story, and we are proud to be closely involved with it – in addition to the research work carried out for this report, we have provided professional advice to several of the projects that are included in the data.
For ten years, we have been quantifying the hotel development activity in Africa at country, regional and city levels, and our detailed analyses provide useful information for investors, governments, hospitality and real estate professionals, students and other interested parties.
This 10th edition of our annual survey has a record 41 international and regional contributors, reporting pipeline activity of just over 76,000 rooms in 418 hotels, a 14 per cent increase on the 2017 pipeline. Hotel development activity in Africa has come a long way in ten years, and the pipeline has grown from 29,692 rooms in 144 hotels in 2009 when we first started, to 76,322 rooms in 418 hotels today.
Africa continues to present considerable opportunities for the discerning investor. According to the World Bank, six of the world’s fastest growing economies in 2018 are in Africa, and of these, three (Ethiopia, Senegal and Tanzania) appear in the top 10 countries by rooms and pipeline status in this report.
94 deals were reported to have been signed since the beginning of 2017 to now, up on the

3Hotel Chain Development Pipelines in Africa 2018
2016 total of 86 deals. 2017 was a relatively good year for many countries in Africa, taking into consideration the macroeconomic adjustments necessitated by the low price of oil and other commodities, and the resultant cutbacks in government expenditure. Africa continues to show its resilience, and the continent is expected to grow by 3.5 per cent in 2018, according to the African Development Bank.
Marriott International once again leads the hotel chain development pipeline in terms of number of rooms and number of hotels. But as well as the global giants, we have also been able to include more African hotel chains as contributors this year, and are especially pleased to welcome those contributing to our report for the first time, such as Latitude and Verde. We also welcome international chains who are new contributors to the pipeline report: The Ascott, Kerzner International and RIU Hotels & Resorts.
As well as the data, our report contains insights from senior development executives in the hotel chains on their outlook for 2018, and which provide information on the internal strategic considerations that affect pipeline activity.
As we have now been collecting data on the pipeline for 10 years, we present in this report a comparative analysis, to show by how much hotel development activity has grown in the past decade. The pipeline in Africa has grown by 148 per cent since 2009, mainly focused on the chains’ upscale, upper upscale and luxury brands, which in 2018 make up fully 80 per cent of the total pipeline. There remains a clear gap in the market for the entry of budget and midscale brands, positioned to cater for the rising volume of intra-Africa travel, as well as to growing numbers of domestic travellers.
The chains typically seek to enter a country with their flagship brand, mostly upscale or above, before opening a budget or midscale brand hotel. This move into other categories will
allow the hotel industry to expand its provision of quality service and great guest experiences to a wider range of people. Midscale hotels are “easier” (and faster) to build, and less expensive to develop.
Our annual report on hotel development activity in Africa has become acknowledged as the most authoritative source on the growth of the hotel industry in Africa. We are delighted to have the continuing opportunity to be closely involved in the African hotel success story.
We are extremely grateful to the hotel chains who contributed to our report this year, both those stalwarts who provide their data every year, and those new to the survey in 2018. A full list of the contributors to this report is provided in Appendix 1.
A special thank you goes to the hotel chain executives who responded to our request for commentary on the hospitality industry, as quoted throughout this report; they have provided very interesting insight into the development potential of Africa, and their activity there.
Should you have any comments and questions on the report, then please do get in touch.
Trevor J WardManaging DirectorW Hospitality GroupLagos, NigeriaMay 2018
Foreword

4Hotel Chain Development Pipelines in Africa 2018
Best Western Nairobi
Best Western Executive Residency
Nairobi

Foreword from Bench Events
5Hotel Chain Development Pipelines in Africa 2018
Congratulations to W Hospitality Group for another excellent publication, providing the industry with intelligent insight into the pipeline activity of the main hotel players in Africa. It is only through such knowledge and transparency that the industry can execute their strategic plans for growth. With year-on-year double-digit growth in the number of deals signed by the chains, Africa is today regularly spoken about in the corporate boardrooms of power, and those global companies not investing their time in this burgeoning market are missing out on the opportunity of a lifetime.
Marriott’s surge to the top of the African rankings is a case in point. Having almost no presence on the continent just five years ago, and nothing in sub-Saharan Africa, they are by far the biggest bigger player in Africa now, through a combination of acquisitions – of Protea in 2014 and Starwood in 2016 – and focused development effort, all driven from the very top of the organisation. We are the organisers of the Africa Hotel Investment Forum (AHIF), and the pipeline report and the detailed findings are always one of the featured sessions at AHIF, with Trevor Ward presenting the results of his company’s research. These findings provide a solid background to some of the debates that follow, as the chains and investors discuss their future plans for Africa.
Trevor will be joined by Chris Nassetta, CEO of Hilton; Cedric Guilleminot, CEO of African operator Onomo Hotels; financier Ilaria Benucci of CDC, an investor in the industry; and conservationist Dr Max Graham of Space for Giants, to name but a few. AHIF is attended by the highest calibre international hotel investors of any conference in Africa. It connects business leaders from the international and regional markets, driving investment into tourism projects, infrastructure and hotel development across the continent.
The 9th edition of AHIF will take place at the Radisson Blu, Nairobi from 2-4 October 2018 and we are delighted to be returning to Kenya, where we are working closely with the Kenyan Ministry of Tourism & Wildlife, and the Tourism Finance Corporation. There are a number of events taking place in the first week of October including the Magical Kenya Tourism Expo. Kenya’s Head of State, President Uhuru Kenyatta, will launch both events publicly on the morning of Wednesday October 3rd at a ceremony at the Kenyatta International Convention Centre. For more information on AHIF 2018 and to register as a delegate visit: www.africa-conference.com.
About Bench EventsBench Events delivers outstanding conferences for the hospitality industry for delegates to learn, to network and to do deals – like those deals featured in this report. Our conferences also aim to raise awareness for our industry as a leading contributor to economic growth, employment and prosperity in Africa.
Jonathan WorsleyChairman, Bench Eventswww.benchevents.com

6Hotel Chain Development Pipelines in Africa 2018
Foreword by Trevor Ward .......................................................................................................................................................2
Foreword from Bench Events ...............................................................................................................................................5
Methodology ...............................................................................................................................................................................7
2018 Research Findings ....................................................................................................................................................... 10
Section 1: Regional Summary ........................................................................................................................................... 11
The African Hotel Industry in 2017 ................................................................................................................................ 19
Africa in the Global Hotel Industry................................................................................................................................. 22
Section 2: Hotel Chains and Brands ............................................................................................................................... 24
Expectations for 2018 ........................................................................................................................................................... 30
Section 3: Status of Hotel Development Activity .................................................................................................... 32
Appendices ............................................................................................................................................................................... 41
About Us ..................................................................................................................................................................................... 54
Table of Contents
7Hotel Chain Development Pipelines in Africa 2018
Our report covers the 54 countries in Africa, including North Africa (Morocco, Algeria, Tunisia, Libya and Egypt), sub-Saharan Africa and the Indian Ocean islands, and provides consistent, reliable and comparable data on the development pipeline activity of the hotel chains who are operating in, and those who are seeking to enter for the first time, Africa.
This report has been compiled from the data on signed deals provided to us in early 2018 by 41 regional (African) and international hotel chains. To be included in this report, Africa-based chains need to operate in more than one country on the continent, and the international chains in more than one country globally. We do not, therefore, include hotel chains which are domestic, i.e. operate in only one country. In addition, the deals need to be legally-binding management, franchise or other agreements (some of the chains are owner-operators) which state the intention of the parties to open a hotel at a date in the future. Deals at the stage of an MOU, which are “hoped-for” (whether or not they are under construction), are not included.
The data have been analysed in several ways, including by region, by country, by city, by hotel chain and by brand. This provides several permutations with which to understand the pipeline activity in Africa. The status of each project has been assessed, differentiating hotels that are in the pre-planning stage (i.e. still on paper) from those that are on-site, in the construction phase. “In construction” is a phrase that needs some explanation, however – it means that work has started on site, but there are many projects where work has been suspended for some time (in a few cases for several years). Whether or not they will ever materialise is a moot point, but they remain as deals in the pipeline.
The comparative figures shown in our analysis for 2017 are not the same as those shown in last year’s report - the mega-deal signed by AccorHotels for 50 hotels in Angola has fallen away, and we have therefore rebased previous years’ data to account for this.
This year we have a record 41 contributors, and are pleased to welcome as new participants, amongst others Ascott, Kerzner, Latitude and Verde. Appendices1, 3 and 4 list all the hotel chains, and their brands, that participated in our survey this year, and details of their individual development activity in Africa.
If you would like to participate in our survey, and meet the criteria stated above, then please do get in touch.
41chains
111Brands
Methodology

Azalaï HôtelAbidjan
8Hotel Chain Development Pipelines in Africa 2018

List of Tables and Charts
9Hotel Chain Development Pipelines in Africa 2018
TablesTable 1: Regional Summary ..................................................................................................................... 11
Table 2: Regional Summary: 2009 to 2018 Comparison ............................................................ 11
Table 3: Countries in the Pipeline by Sub-Region ......................................................................... 12
Table 4: Countries with no Pipeline ..................................................................................................... 13
Table 5: Top 10 Countries by Number of Rooms ........................................................................... 14
Table 6: 2009: Top 5 Countries by Number of Rooms ................................................................. 15
Table 7: Top 10 Brands by Number of Planned Hotels and Rooms ...................................... 24
Table 8: Top 10 Chains by Number of Planned Hotels ................................................................ 25
Table 9: Top 10 Chains by Number of Planned Rooms ............................................................... 26
Table 10: 2009: Top 5 Chains by Number of Planned Rooms ..................................................... 27
Table 11: Hotel Openings 2017 ................................................................................................................ 28
Table 12: Top 10 Chains: Pipeline vs Existing Hotels in Africa .................................................... 29
Table 13: SSA vs. North Africa by Pipeline Status ............................................................................. 32
Table 14: Top 10 Countries by Pipeline Status .................................................................................. 32
Table 15: 2009: Top 5 Countries by Pipeline Status ......................................................................... 33
Table 16: Top 10 Brands by Pipeline Status ........................................................................................ 33
Table 17: Top 10 Chains by Pipeline Status......................................................................................... 34
Table 18: Years the Deals Were Signed – Number of Hotels....................................................... 35
Table 19: 2015-2017 Scheduled vs. Actual Hotel Openings ....................................................... 36
Table 20: Anticipated Opening Years of Pipeline Deals ................................................................ 36
Table 21: Anticipated Opening Years of Pipeline Deals – Onsite Construction ................. 37
ChartsChart 1: Regional Summary ..................................................................................................................... 12
Chart 2: Sub-Saharan Africa Sub-Regional Breakdown (Rooms) ............................................ 13
Chart 3: Top 10 countries by number of planned rooms and their average size ........... 15
Chart 4: Top 10 Countries by Number of Planned Rooms 2016 -2018 ................................ 16
Chart 5: Top 10 Cities by Number of Planned Rooms ................................................................. 16
Chart 6: Top 10 Cities by Number of Planned Rooms (Sub-Saharan Africa) ..................... 17
Chart 7: Top 10 Brands by Number of Planned Rooms & Average Size .............................. 25
Chart 8: Top 10 Chains by Number of Planned Rooms & Average Size .............................. 27
Chart 9: Type of Agreement - Number of Deals Signed ............................................................. 29
Chart 10: Anticipated Opening Years of Pipeline Deals ................................................................ 35
Chart 11: Anticipated Additions to Supply (Rooms, Cumulative) ............................................ 37
Chart 12: Anticipated Opening Years of Pipeline Deals – Onsite Construction ................. 38

10Hotel Chain Development Pipelines in Africa 2018
2018 Research Findings

Ten Years AgoWhat was happening a decade ago? In 2009, the pipeline rooms in North Africa were approximately half today’s figure, and in sub-Saharan approximately one third.
11Hotel Chain Development Pipelines in Africa 2018
Section 1: Regional Summary
Table 1: Hotel Chain Development Pipelines in Africa 2018Regional Summary
2014 2015 2016 2017 2018
Hotels Rooms Hotels Rooms Hotels Rooms Hotels Rooms Hotels Rooms
North Africa 73 16,449 79 18,565 87 19,971 107 23,836 120 28,643
Sub-Saharan Africa 142 23,283 191 31,150 227 39,416 262 43,113 298 47,679
TOTAL 215 39,732 270 49,715 314 59,387 369 66,949 418 76,322
14%overall growth
76,322rooms
Table 2: Hotel Chain Development Pipelines in Africa 2018Regional Summary: 2009 to 2018 Comparison
2009 2018 Change
Hotels Rooms Hotels Rooms Hotels Rooms
North Africa 61 15,611 120 28,643 97% 83%
Sub-Saharan Africa 87 15,210 298 47,679 243% 213%
TOTAL 148 30,821 418 76,322 182% 148%
This year 41 hotel chains contributed to our survey, reporting pipeline activity of 76,322 rooms in 418 hotels.
The data have been analysed initially according to two main regions, i.e. North Africa (5 countries) and sub-Saharan Africa (49 countries, including the Indian Ocean islands). Both regions reported growth in their pipeline activity, as shown in Table 1. There is growth overall of 14 per cent in 2018, and since 2014 has almost doubled in five years. Since 2014, the North Africa pipeline has grown by 74 per cent, from 16,449 rooms in 73 hotels to 28,643 rooms in 120 hotels this year.
Growth has been higher in sub-Saharan Africa, more than doubling since 2014. Year-on-year performance in 2018 still shows growth, although more muted than in recent years – a massive 33 per cent in 2015, 26 per cent in 2016, 9 per cent in 2017, and 11 per cent in 2018. The growth is, of course, on a higher base, with a similar number of rooms – around 10,000 – added to the total pipeline each year since 2014.
418hotels

12Hotel Chain Development Pipelines in Africa 2018
60,000
50,000
40,000
30,000
20,000
10,000
0
2014 2015 2016 2017 2018
Table 3: Hotel Chain Development Pipelines in Africa 2018Countries in the Pipeline by Sub-Region
North Southern and Indian Ocean West East Central
AlgeriaEgyptLibya
MoroccoTunisia
AngolaBotswana
MadagascarMalawi
MauritiusMozambique
NamibiaSeychelles
South AfricaSwaziland
ZambiaZimbabwe
Benin RepublicCape Verde
Côte d’IvoireGhanaGuinea
Guinea BissauMali
MauritaniaNiger
NigeriaSenegal
Sierra LeoneTogo
BurundiEthiopia
KenyaRwanda
South SudanTanzaniaUganda
CameroonCongo
DR CongoGabon
Chart 1: Hotel Chain Development Pipelines in Africa 2018Regional Summary
Chart 1 provides a graphical representation of the planned rooms in North Africa and sub-Saharan Africa.
Quantifying this by number of rooms and planned hotels, West Africa has the main pipeline activity with over 23,000 rooms in its pipeline, a large proportion in Nigeria. This is followed by East Africa with about 14,000 pipeline rooms, mainly in Kenya and Ethiopia.
The chains have deals signed in 41 countries in Africa, out of a total of 54 as shown in Table 3. West Africa is in first place with 13 countries having pipeline development activity – but then it is the region with the most countries in the first place, a total of 16. It is closely followed by the Southern and Indian Ocean sub-region, where chains report activity in 12 countries.
Sub-Saharan Africa
North Africa

13Hotel Chain Development Pipelines in Africa 2018
In Table 5, we present the top 10 countries by number of rooms in the pipeline. Together, the top ten represent 70 per cent of the total hotels in the survey, and 75 per cent of the rooms:
48%
19%
29%
4%
Chart 2: Hotel Chain Development Pipelines in Africa 2018Sub-Saharan Africa Sub-Regional Breakdown (Rooms)
Focusing on sub-Saharan Africa, Chart 2 provides our analysis of the distribution of pipeline rooms there. West Africa is, as ever, the largest region, with 48 per cent of the pipeline, slightly higher than 2017’s 42 per cent. East Africa has increased from 23 per cent to 29 per cent. Central Africa has just a 4 per cent share, similar to 2017’s 5 per cent, whilst Southern Africa reports a decrease, with reported pipeline development of 8,958 rooms, a 19 per cent share, compared to 12,933 rooms in 2017, which made up 30 per cent of the pipeline rooms in sub-Saharan Africa.
13 countries in Africa have no pipeline hotels reported, although there are reasons to expect that to change in the future. Djibouti has an incredibly strategic location in the Horn of Africa, and serves as the main port for Ethiopia, plus in recent years it has increased in importance as a military base. The government is in the process of developing Africa’s largest Free Trade Zone, and is promoting investment in hotels and resorts in the country. Further, economic sanctions on Sudan have eased, and we may see hotel development activity in Khartoum and Port Sudan in the future.
Table 4: Hotel Chain Development Pipelines in Africa 2018Countries with no Pipeline
Southern and Indian Ocean West East Central
Comoros IslandsLesotho
Burkina FasoLiberia
The Gambia
DjiboutiEritrea
SomaliaSudan
ChadCentral African Republic
Equatorial GuineaSão Tomé and Principe

14Hotel Chain Development Pipelines in Africa 2018
Egypt has the largest number of rooms in the pipeline this year, displacing Nigeria, who for several of the previous years has had the most rooms in the pipeline. Over 2,000 new rooms were signed in Egypt in 2017, led by Hilton and IHG - Hilton alone has a pipeline of 3,519 rooms in Egypt. South Africa has more pipeline activity in 2018, with 37 hotels in the contributors’ pipelines, 12 per cent up on 2017.
Looking back at when South Africa hosted the 2010 FIFA World Cup, the chains then reported a pipeline of 2,005 rooms in 11 hotels in the build up to the event, reducing to a low of just 990 rooms in eight hotels in 2012, and increasing to the current pipeline of 4,311 rooms in 37 hotels, an increase of 335 per cent. The chains with the most reported activity in South Africa include Marriott International, Mantis Group and aha Hotels and Lodges. Of note, however, is that the size of hotels being developed in South Africa, at an average of 117 rooms, is the smallest in the top 10.
Ethiopia, in third place, has seen a massive increase in pipeline deals, up from 20 hotels in 2017 to 31 hotels in 2018, signed both by international chains such as AccorHotels and Hilton, as well as regional chains such as aha and Latitude. As reported below, the majority of these deals (86 per cent of total rooms) are in Addis Ababa.
Senegal moves into the top 10 this year with 17 hotels, mainly in Dakar, including the “new” Dakar, Diamniadio.
As in 2017, four of the five North African countries are in the top 10 by number of planned rooms. There are no new deals being signed in Libya, and some previous deals there are being cancelled or suspended.
4 of 5 North African
Countries are in the top 10 by number of planned
rooms
Table 5: Hotel Chain Development Pipelines in Africa 2018Top 10 Countries by Number of Rooms
Hotels Rooms Average Size
1 Egypt 43 13,636 317
2 Nigeria 57 9,603 168
3 Ethiopia 31 5,717 184
4 Morocco 33 5,456 165
5 South Africa 37 4,311 117
6 Tunisia 21 4,279 204
7 Algeria 19 4,151 218
8 Cape Verde 12 4,011 334
9 Kenya 20 3,444 172
10 Senegal 17 2,514 148

15Hotel Chain Development Pipelines in Africa 2018
Ten Years AgoTen years’ ago the countries with the largest pipelines were Egypt, Nigeria, Morocco, South Africa and Libya
Table 6: Hotel Chain Development Pipelines in Africa 20182009: Top 5 Countries by Number of Rooms
Hotels Rooms Average Size
1 Egypt 19 6,043 318
2 Nigeria 24 4,707 196
3 Morocco 19 3,882 204
4 Libya 9 2,872 319
5 South Africa 14 2,224 158
With the exception of Libya, four of the top 5 countries in terms of pipeline development activity still have the largest pipelines in 2018. As noted, South Africa was busy building new hotels (and much larger hotels than today) in readiness for the FIFA World Cup, whilst Libya was opening up its economy to reintegrate with the international community. Ten years ago, Ethiopia was still relatively “closed”.
Chart 3 shows the top 10 countries by number of planned rooms and their average size. Cape Verde and Egypt have much larger hotels on average, the majority of which are vacation resorts.
Chart 3: Hotel Chain Development Pipelines in Africa 2018Top 10 Countries by Number of Planned Rooms and Average Size
16,000
14,000
12,000
10,000
8,000
6,000
4,000
2,000
0
400
350
300
250
200
150
100
50
0
Pipeline Rooms (LH axis)
Average Room Size (RH axis)
Egypt Nigeria Ethiopia Morocco South Tunisia Algeria Cape Kenya Senegal Africa Verde

16Hotel Chain Development Pipelines in Africa 2018
7,000
6,000
5,000
4,000
3,000
2,000
1,000
0
6,478
4,907
4,135
3,485 3,4663,223
2,738
2,0191,830
1,600
Cairo Addis Lagos Abuja Sharm El Algiers Nairobi Dakar Abidjan Boa Vista Ababa Sheikh
16,000
14,000
12,000
10,000
8,000
6,000
4,000
2,000
0 Egypt Nigeria Ethiopia Morocco South Tunisia Algeria Cape Kenya Senegal Africa Verde
2016
2017
2018
Chart 4: Hotel Chain Development Pipelines in Africa 2018Top 10 Countries by Number of Rooms 2016-2018
Chart 5: Hotel Chain Development Pipelines in Africa 2018Top 10 Cities by Number of Planned Rooms
In Chart 4 we track the development activity in the top 10 countries since 2016. Nigeria and Algeria have a slight decrease in the number of rooms in the pipeline, due in part to completed projects in Algeria, and some cancelled projects in Nigeria.
The significant increase in the pipeline in Egypt and Ethiopia is clear. The number of pipeline rooms in Egypt increased from 9,851 rooms in 2017 to 13,636 rooms in 2018. In Ethiopia there has been a 50 per cent increase in pipeline activity between 2017 and 2018, although from a much smaller base than that of Egypt.
We show the top 10 cities in Africa by number of planned rooms in Chart 5

17Hotel Chain Development Pipelines in Africa 2018
Chart 6: Hotel Chain Development Pipelines in Sub-Saharan Africa 2018Top 10 Cities by Number of Planned Rooms
Addis Lagos Abuja Nairobi Dakar Abidjan Boa Kampala Sao Accra Ababa Vista Vicente
6,000
5,000
4,000
3,000
2,000
1,000
0
4,907
4,135
3,485
2,738
2,0191,830
1,6001,198 1,143 1,082
Cairo and Addis Ababa displace Lagos from its leading position last year. Abuja is in fourth place, moving down by one place from 2017. Abidjan and Boa Vista (Cape Verde) are new entrants into this year’s top 10. Sharm El Sheikh has moved to 5th place from 7th place in 2017.
Looking only at sub-Saharan Africa (Chart 6), Addis Ababa displaces Lagos from its first place position. There have been several new signings in the former including deals by AccorHotels, Hilton, Marriott and Dusit, among others. Abidjan moves into the top 10 this year, as Côte d’Ivoire recovers and, like Nigeria, Cape Verde has two destinations, Boa Vista and Sao Vicente in the top 10, due to a flurry of development activity there. .
There has been a marked slow down in new signings in Nigeria due to the economic conditions – the country went into recession at the beginning of 2016, and has recoded only weak growth since the recession ended in Q2 2017. Developers and investors there are reluctant to enter into long-term commitments when confidence in low – the chains, however, are keen as ever to enter and expand in this giant in West Africa.
Appendix 2 provides country by country information on the chains’ development activity.

Dusit Thani Addis Ababa
Legedadi
18Hotel Chain Development Pipelines in Africa 2018

19Hotel Chain Development Pipelines in Africa 2018
The African Hotel Industry in 2017
2017 was a relatively stable year for the African hotel industry. Commodity prices, including oil, mostly recovered, contributing to the estimated 3.6 per cent growth in continent-wide GDP (African Development Bank 2018). This stability allowed the hotel chains to build on growing their brands, and explore innovative opportunities to add to the guest experience, according to Karl de Lacy, International Development Director for Best Western. Some of these areas, says Henk Meyknecht, Chief Operating Officer Middle East and Africa for Kempinski, include non-accommodation categories - food and beverage, spa & recreation, and corporate events.
The metrics are also working for the continent. Africa had 62 million international arrivals in 2017, an 8 per cent increase on 2016 according to the UNWTO’s Travel Barometer. The continent also increased its flight coverage, and is working to ease visa requirements which restrict travel to and within the continent. In February 2018 the African Union launched its Single African Air Transport Market (SAATM) initiative – Open Skies, which is intended to increase intra-African connectivity. Governments are focusing on infrastructural development: roads, rail, electricity, airports and seaports.
These actions are contributing to the growth in the number of new deals signed, and opening up a wealth of opportunities for hotel chains looking to develop their footprint on the continent. Swiss International Hotels & Resorts opened an area office in Nairobi, Kenya in order, says CEO Hans Kennedy, to be better able to harness the opportunities in Africa. The chain is focusing on expansion in East Africa but is keen also to grow its presence in West Africa. According to Kennedy, the benefits of having an office on the continent are already being realised. Swiss International Hotels & Resorts have signed an agreement to develop and operate two lifestyle resorts, the Swiss International Resort Mount Kenya and the Royal Swiss Empuku in Uganda, both set for completion in 2019.
Peter Norman, Senior Vice President, Acquisitions and Development at Hyatt shared the chain’s strategy of entering markets with their upper upscale Hyatt Regency brand – the chain plans to open six new Hyatt Regency hotels over the next two years, in Morocco, Tanzania, Ethiopia, Senegal, Algeria and Cameroon, doubling its presence on the continent
In terms of location strategy, while the focus for many of the hotel chains has been on city hotel development, resort projects are definitely areas for growth, especially if there is easy access to large cities. In this way, according to Cyrill Czerwonka, Assistant Development Director for Dusit, the destination can be positioned as both a conference hotel and a resort, appealing to the local market who are looking for leisure options outside of the busy city. Dusit have signed the Dusit Thani Addis Ababa Legedadi resort, part of the largest mixed-use development in Ethiopia, located just 20 kilometres from Addis Ababa.
Insight

20Hotel Chain Development Pipelines in Africa 2018
InsightOne of the major challenges facing the hospitality industry is human capital. Dusit focuses on training local talent for positions in the hospitality industry. The chain already has six hotel schools in Asia with 12,000 full time students and, according to Czerwonka, there are plans to locate hotel schools within hotels in Africa in future, to create some synergies.
Another key challenge for the hotel industry, especially in sub-Saharan Africa, is the time it takes to construct hotels, with many projects failing to complete within the agreed timelines, which in turn affects access to finance, with banks reluctant to lend to hotel projects when the development schedule is uncertain. What solutions are there? Alain Sebah, CEO of Louvre Hotels Group, puts forward the turnkey construction option, where the design and build of the hotel is managed centrally by a contractor, and completed before being handed over to the owner, to then be managed by a hotel management company. Design and build can reduce the total time for the development.
According to Dusit’s Czerwonka, there remain opportunities for developing more rooms across all segments of the market, from economy to luxury, and for all types of assets: hotels, resorts, lodges and serviced residences.

21Hotel Chain Development Pipelines in Africa 2018
DusitNairobi

Insight
22Hotel Chain Development Pipelines in Africa 2018
Africa in the Global Hotel Industry The travel and tourism industry accounts for more than one-tenth of global GDP, and the industry is projected to grow by 4 per cent in 2018, according to the World Travel & Tourism Council (WTTC). And according to STR, RevPAR in Africa’s hotels grew by 13.8 per cent in 2017), higher than other regions - Europe grew by 5.6 per cent, the United States by 3 per cent, and the Middle East declined by 5.6 per cent. The pace of growth in the global hotel industry is the strongest it has been in 15 years, according to Franck Edja, Marketing and Communication Manager at Azalaï Hotels, due to growth in the chains’ branded and non-branded hotels, the latter their “soft” brands such as Hilton’s Curio and Marriott’s Autograph.
According to Dusit’s Czerwonka, while Europe starts to divide (Brexit, Spain’s Catalonia crisis…..), Africa is showing a willingness to increase interconnectivity and relationships, especially with the launch of the Africa passport in 2020, a move that should contribute to growth in intra-African travel. This, linked with improvements in connectivity, will generate increased demand for travel and tourism, says Peter Norman of Hyatt, who sees a rise in business tourism, and in domestic leisure travel arising from the growing African middle class.
The biggest potential for the market, Czerwonka shares, will be the economy and midscale segments, an observation that Kennedy of Swiss International agrees with. Customers need to be offered a wider range of products in terms of style and price, says Wesam Okasha, Group Business Development Director for Mangalis. Kennedy sees more needing to be done to focus on the customer experience, traveller-focused technology, and health & wellness, contributing to the holistic lifestyle that hotel brands are claiming to stand for. New sub-categories of the mid-market segment are emerging, focusing on the “de-compartmentalisation of spaces”, and creating thematic customer experiences, says Edja of Azalaï Hotels. The luxury and upper upscale segments still have growth potential, but this is limited, and requires careful and considered development over the next few years, shares Yusuf Siddiqui, Senior Analyst, Development, Middle East and Africa for Four Seasons.
The future will see more hotel expansion on the continent, in North as well as sub-Saharan Africa. Meyknecht of Kempinski believes emerging markets will be prime vehicles of growth for the hotel chains – but only if the delivery time of the hotel projects can be shortened, according to Mangalis’ Okasha.

23Hotel Chain Development Pipelines in Africa 2018
Taj Hotel Lusaka

24Hotel Chain Development Pipelines in Africa 2018
Table 7: Hotel Chain Development Pipelines in Africa 2018Top 10 Brands by Number of Planned Hotels and Rooms
Rank by Hotels Rank by Rooms Change on 2017
Average Size
RoomsHotels Rooms Hotels Rooms
1 Radisson Blu 25 5,473 1 Hilton 24 6,687 17% 279
2 Hilton 24 6,687 2 Radisson Blu 25 5,473 2% 219
3 Hilton Garden Inn 17 2,818 3 Marriott 16 3,438 14% 215
4 Marriott 16 3,438 4 Fairmont 8 2,977 66% 372
5 Four Points 13 2,006 5 Hilton Garden Inn 17 2,818 31% 166
6= Sheraton 9 2,013 6 Sheraton 9 2,013 18% 224
6= Golden Tulip 9 1,662 7 Four Points 13 2,006 -8% 154
7 Fairmont 8 2,977 8 Swissôtel 4 1,961 65% 490
8 Meliá Hotels & Resorts 6 1,935 9 Meliá Hotels & Resorts 6 1,935 -21% 323
9 Swissôtel 4 1,961 10 Golden Tulip 9 1,662 251% 185
In this section we present our analysis of the activity of the individual hotel chains and their brands. Table 7 shows the top 10 brands by number of planned hotels and by number of rooms.
Hilton tops the list of brands ranked by number of rooms, with a 17 per cent increase compared to 2017. Golden Tulip has seen a massive increase in its pipeline, from 474 rooms in 2017 to 1,662 rooms in 2018, all of which are under construction; some 1,300 rooms, almost 80 per cent of the total, are due to open in Tunisia in 2018. Fairmont, an AccorHotels brand, has grown from 1,788 rooms in 2017 to 2,977 rooms in 2018, the increase mostly in new deals in North Africa.
Swissôtel (another AccorHotels brand) has by far the largest hotels, with an average of 490 rooms, followed by Fairmont with 372 rooms, and Meliá with 323 rooms. Hotels tend to be larger in resort locations than in the city locations. Meliá has fewer rooms in its pipeline than last year, down 21 per cent, as the chain opened resorts in Tanzania (the Serengeti) and in Morocco in 2017, but they signed only one new hotel, in Maputo, last year.
Section 2: Hotel Chains and Their Brands

25Hotel Chain Development Pipelines in Africa 2018
Table 8: Hotel Chain Development Pipelines in Africa 2018Top 10 Chains by Number of Planned Hotels
Rank by Hotels
Hotels Rooms Change on 2017 Average Size
1 Marriott International 93 17,708 8.0% 190
2 Hilton 54 11,528 26.7% 213
3 Radisson Hotel Group 39 7,868 0.1% 202
4 AccorHotels 37 10,059 33.9% 272
5 Best Western Hotels & Resorts 17 1,697 2.7% 100
6 Louvre Hotels Group 16 2,414 82.2% 151
7 Mangalis Hotel Group 14 1,746 29.4% 125
8 Hyatt International 9 1,768 13.0% 196
9 InterContinental Hotels Group 9 1,891 15.9% 210
10 Meliá Hotels International 6 1,935 -20.6% 323
8,000
7,000
6,000
5,000
4,000
3,000
2,000
1,000
0
600
500
400
300
200
100
0
Hilton Radisson Marriott Fairmont Hilton Sheraton Four Swissotel Melia Golden Blu Garden Points Hotel & Tulip Inn Resorts
Both AccorHotels and Hilton have two brands in the top 10, whilst Marriot has three – the Marriott brand, Sheraton and Four Points by Sheraton. The dominance of these three chains is discussed below.
Of note is that the average size of a Four Points by Sheraton-branded hotel has reduced, from 200 rooms in 2016 to 183 rooms in 2017 and 154 rooms today, this despite them having one of the largest hotels in the entire survey, the 450-room Four Points in Addis Ababa.
The previous analysis is by individual brands (further detail regarding each brand is provided in Appendix 3). Several of the chains have more than one brand which they are seeking to expand or establish in Africa.
We present in Table 8 the top 10 chains by number of planned hotels in Africa.
Chart 7: Hotel Chain Development Pipelines in Africa 2018Top 10 Brands by Number of Planned Rooms & Average Size
Pipeline Rooms (LH axis)
Average Size (RH axis)

26Hotel Chain Development Pipelines in Africa 2018
Table 9: Hotel Chain Development Pipelines in Africa 2018Top 10 Chains by Number of Planned Rooms
Rank by Rooms
Hotels Rooms Change on 2017 Average Size
1 Marriott International 93 17,708 8.0% 190
2 Hilton 54 11,528 26.7% 213
3 AccorHotels 37 10,059 33.9% 272
4 Radisson Hotel Group 39 7,868 0.1% 202
5 Louvre Hotels Group 16 2,414 82.2% 151
6 Meliá Hotels International 6 1,935 -20.6% 323
7 InterContinental Hotels Group 9 1,891 15.9% 210
8 Hyatt International 9 1,768 13.0% 196
9 Mangalis Hotel Group 14 1,746 29.4% 125
10 Best Western Hotels & Resorts 17 1,697 2.7% 100
Marriott, the world’s largest hotel chain, has far and away the biggest pipeline in Africa, 72 per cent more hotels and 54 per cent more rooms than second-placed Hilton, and almost 10 times the pipeline of IHG (rooms), the former global Number 1. Marriott does, of course, include two chains which it absorbed in the last four years, Starwood and Protea, but as they say “growth begets growth”.
Best Western is also one of the global giants, and by number of hotels would be ranked fifth, but the relatively small size of their deals means they just sneak into the top 10 by number of rooms, as in Table 9 below.
Seven of the top 10 by rooms (Table 9), that is Hilton, Marriott, Radisson, AccorHotels, Louvre, Hyatt and Best Western, have development offices in Africa, recognising that they need to be on the ground to deliver deals – and that presence is clearly achieving that. Of international chains not in the top 10, Wyndham also has a presence in Africa, with a newly-appointed development manager based in Nigeria. Other chains are also looking to establish a corporate presence in West Africa.
Hilton, AccorHotels, Louvre and Mangalis all had great years in terms of increasing their development pipeline. Hilton and AccorHotels delivered some of the largest increases in the pipeline, each increasing the number of rooms by around 2,500. Radisson Hotel Group fared less well, maintaining par with 2017, but then they were in the first three in terms of opening hotels (which at the end of the day is the main objective of all this!), five properties with almost 1,000 rooms.
Mangalis is the only African chain in the top 10. Launched only in 2011, they now have three hotels operating, and a pipeline of 14 hotels, almost all in Francophone West Africa. Louvre had the largest increase in pipeline rooms compared with last year, and has 16 new properties in the offing, of which several are resorts in Tunisia, where tourism is recovering following terrorist attacks three years ago.

27Hotel Chain Development Pipelines in Africa 2018
Further detail regarding each hotel chain is provided in Appendix 4.
20,000
18,000
16,000
14,000
12,000
10,000
8,000
6,000
4,000
2,000
0
350
300
250
200
150
100
50
0
Marriott Hilton Accor Radisson Louvre Melia Intercontinental Hyatt Mangalis Best Western International Hotel Hotels Hotels Hotels International Hotel Hotels & Group Group International Group Group Resorts
Chart 8: Hotel Chain Development Pipelines in Africa 2018Top 10 Brands by Number of Planned Rooms & Average Size
Pipeline Rooms (LH axis)
Average Size (RH axis)
Ten Years AgoWith the exception of Kempinski, the hotels in the top five chains remain in the Top 10 in 2018. Kempinski today has nine hotels operating in Africa, some of which were in their 2009 pipeline, but only one hotel in their 2018 pipeline, a 180-room hotel in Brazzaville scheduled to open in 2019. IHG’s pipeline in 2018 is around half what it was 10 years ago, their focus being elsewhere presently.
The average sizes of rooms have changed, in some cases significantly, with IHG and Starwood down by 20 per cent, and AccorHotels up by 64 per cent, the latter because of the larger size of Fairmont and Swissôtel brands, which they acquired in 2016.
Table 10: Hotel Chain Development Pipelines in Africa 20182009: Top 5 Chains by Number of Planned Rooms
Rank by Rooms
Hotels Rooms Average Size*
1 AccorHotels 28 4,640 166 (272)
2 InterContinental Hotels Group 15 3,912 261 (210)
3 Rezidor** 17 3,725 219 (202)
4 Kempinski 18 3,344 186 (180)
5 Starwood*** 13 3,092 238 (190)
* 2018 average size in brackets** Now the Radisson Hotel Group*** Now part of Marriott International
28Hotel Chain Development Pipelines in Africa 2018
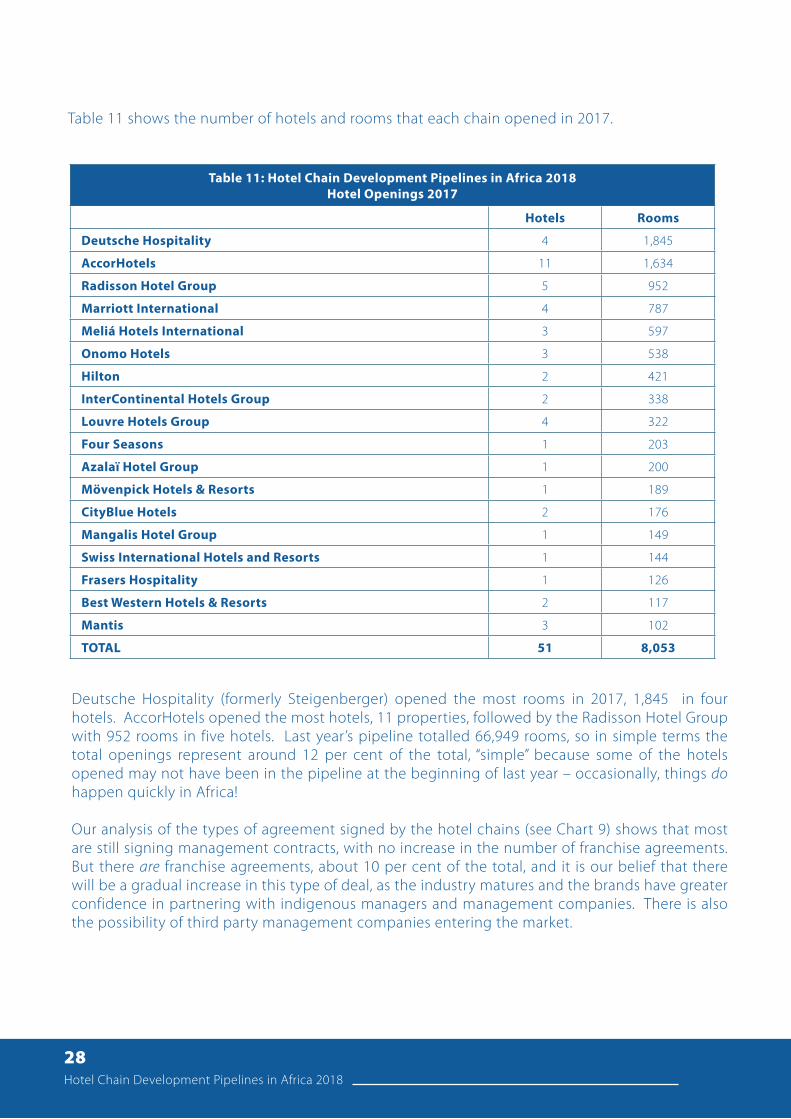
Table 11: Hotel Chain Development Pipelines in Africa 2018Hotel Openings 2017
Hotels Rooms
Deutsche Hospitality 4 1,845
AccorHotels 11 1,634
Radisson Hotel Group 5 952
Marriott International 4 787
Meliá Hotels International 3 597
Onomo Hotels 3 538
Hilton 2 421
InterContinental Hotels Group 2 338
Louvre Hotels Group 4 322
Four Seasons 1 203
Azalaï Hotel Group 1 200
Mövenpick Hotels & Resorts 1 189
CityBlue Hotels 2 176
Mangalis Hotel Group 1 149
Swiss International Hotels and Resorts 1 144
Frasers Hospitality 1 126
Best Western Hotels & Resorts 2 117
Mantis 3 102
TOTAL 51 8,053
Deutsche Hospitality (formerly Steigenberger) opened the most rooms in 2017, 1,845 in four hotels. AccorHotels opened the most hotels, 11 properties, followed by the Radisson Hotel Group with 952 rooms in five hotels. Last year’s pipeline totalled 66,949 rooms, so in simple terms the total openings represent around 12 per cent of the total, “simple” because some of the hotels opened may not have been in the pipeline at the beginning of last year – occasionally, things do happen quickly in Africa!
Our analysis of the types of agreement signed by the hotel chains (see Chart 9) shows that most are still signing management contracts, with no increase in the number of franchise agreements. But there are franchise agreements, about 10 per cent of the total, and it is our belief that there will be a gradual increase in this type of deal, as the industry matures and the brands have greater confidence in partnering with indigenous managers and management companies. There is also the possibility of third party management companies entering the market.
Table 11 shows the number of hotels and rooms that each chain opened in 2017.

29Hotel Chain Development Pipelines in Africa 2018
Chart 9: Hotel Chain Development Pipelines in Africa 2018Type of Agreement - Number of Deals Signed
Other - 34
Franchise - 41
Management - 343
The ‘Other’ category includes joint ventures between hotel chains and hotel owners, and owner-operators such as Azalaï and City Lodge, as well as a very small number of leases.
The analysis of the chains’ pipelines versus their existing presence on the continent, shown in Table 12, shows that Marriot ranks top as the chain with the highest potential increase in their existing footprint, measured by the number of rooms in the pipeline.
Marriott, Hilton, Hyatt and Mangalis all have pipelines greater than their existing footprint, with Best Western a similar figure to those currently operating. Should all the pipeline rooms materialise, and all of the existing rooms stay within the chains’ brands (a highly unlikely scenario), then AccorHotels will have slightly more rooms in operation than Marriott, despite its smaller pipeline, because of its superior existing presence.
Table 12: Hotel Chain Development Pipelines in Africa 2018Top 10 Chains: Pipeline vs Existing Hotels in Africa
Pipeline Existing Pipeline vs Existing
(Rooms)Rank Hotels Rooms Hotels Rooms
1 Marriott International 93 17,708 100 13,708 129.1%
2 Hilton 54 11,528 40 11,346 101.6%
3 AccorHotels 37 10,059 123 22,451 44.8%
4 Radisson Hotel Group 39 7,868 45 9,868 79.7%
5 Louvre Hotels Group 16 2,414 36 6,161 39.2%
6 Meliã Hotels International 6 1,935 9 2,551 75.9%
7 InterContinental Hotels Group 9 1,891 26 6,429 29.4%
8 Hyatt International 9 1,768 6 1,330 132.9%
9 Mangalis Hotel Group 14 1,746 3 425 410.8%
10 Best Western Hotels & Resorts 17 1,697 21 1,758 96.5%
TOTAL 294 58,614 409 76,027 77.1%

Insight
30Hotel Chain Development Pipelines in Africa 2018
Expectations for 2018
There is optimism that the growth trend in hotel development activity will continue, even as economies hit by elections and recent financial crises work towards recovery and diversification. The tourism industry is receiving increasing focus from governments in Africa, as a pathway to economic diversification, given the industry’s contributions to GDP and social development. The hotel industry has come a long way in the past two decades, moving from a proliferation of government-built hotels managed by international brands to include mainly private investments, including African investors, as well as the rise in African hotel chains. Edja of Azalaï shares that there is still room for more supply to satisfy current and future demand. Siddiqui of Four Seasons confirms this optimism, while recognising the opportunity for more segments of the hotel market to be introduced into Africa, in addition to the luxury brands.
More intra-Africa travel will stimulate tourism demand which will drive demand for hotels, and in anticipation of this, hotel chains like Hyatt, according to Hyatt’s Norman, are focusing on building long-term relationships with investors, to drive a deeper understanding of the markets, and open up more opportunities. This optimism is tempered with some pragmatism, as brands will have to be more strategic and flexible, by providing owners with increased brand options to exploit other segments of the hotel market, according to Sebah of Louvre Hotels. His view is shared by Okasha of Mangalis, who agrees that expansion into other segments of the market will allow chains and owners to capture more market share.
Expanding on the subject of segmentation, Best Western’s de Lacy explains that the introduction of a chain’s soft brands, such as their Premier Collection, can be a viable market entry strategy, especially for markets where branded hotels are not yet present. A soft brand provides hotel owners with the opportunity for the hotel to have its own identity while having a chain/franchise affiliation. The key advantage for the hotel is its access into the hotel chain’s marketing and reservation system.
West Africa and East Africa will remain focus areas for development, mostly in key cities in Nigeria, Liberia, Kenya, Rwanda, Tanzania, Ethiopia & Uganda. Mangalis’ Okasha shares that Nigeria is one of their most important markets for development in West Africa, as the current supply does not meet the demand for hotel accommodation and other services.
That said, there will be eight elections in Africa in 2018, so this optimism is hinged on political stability on the continent. Training will remain an area of focus with more chains realizing the need for local talent development, especially given the pipeline development activity, and the lack of the required talent to fill positions in the new hotels.
Where will the hotel demand be coming from? More arrivals, mainly for business, will come from the Middle East and Asia, driven by the airlines’ route expansion. Senegal has a new airport which will contribute to more arrivals, and more hotel demand.
Dominique Viard, Director General and Director of Operations for PEFACO, foresees that growth (especially in the Democratic Republic of Congo) will start to cascade into hotel industry growth in the latter half of 2018. The DRC has experienced financial crisis and political instability due to elections being moved and postponed in 2017, but coming out of that, the country has huge potential.

31Hotel Chain Development Pipelines in Africa 2018
More focus will also be paid to sustainability issues in 2018, to include environmentally-friendly designs and a more sustainable hospitality value chain - factors that, according to Bruce Walker, CEO of Verde Hotels, are not mutually exclusive to productivity, and can coexist. As the market becomes more sophisticated, customers will increasingly demand sustainability consideration from hotels, and the destinations they visit in Africa.
Club Med Mauritius

Table 13: Hotel Chain Development Pipelines in Africa 2018SSA vs. North Africa by Pipeline Status
Hotels Rooms
Total Total Onsite Construction
North Africa 120 28,643 15,797 55%
Sub-Saharan Africa 298 47,679 25,611 54%
TOTAL 418 76,322 41,408 54%
Table 14: Hotel Chain Development Pipelines in Africa 2018Top 10 Countries by Pipeline Status
Rank HotelsRooms
Total Onsite Construction
1 Egypt 43 13,636 5,451 40%
2 Nigeria 57 9,603 4,081 43%
3 Ethiopia 31 5,717 3,433 60%
4 Algeria 19 4,151 3,307 80%
5 Morocco 33 5,456 3,266 60%
6 Tunisia 21 4,279 2,808 66%
7 Kenya 20 3,444 2,754 80%
8 Cape Verde 41 4,011 2,710 68%
9 South Africa 37 4,311 2,101 49%
10 Tanzania 15 1,494 1,494 100%
32Hotel Chain Development Pipelines in Africa 2018
Tanzania enters the top 10 with all of its pipeline rooms under construction. However, the pipeline (which includes Zanzibar) is very small compared to many other countries, and development there is muted due to the prevailing economic and political environment. Kenya has 80 per cent of its rooms onsite, mostly in Nairobi, where there are 1,424 rooms in nine hotels due to open in 2018.
Section 3: Status of Hotel Development Activity
In this section we present the status of the chains’ hotel development activity in Africa. Table 13 details the status of development activity in North Africa and sub-Saharan Africa. Just over half of rooms in the African pipeline are currently onsite and under construction.
Table 14 shows the pipeline status of the top 10 countries by number of rooms. Unlike last year, when Egypt had 75 per cent of its pipeline rooms under construction, that figure has dropped to 40 per cent, primarily because of the large number of deals that were signed there in 2017. The proportion under construction in Nigeria has increased, not because more projects have moved to site, but because there has been a “cleaning” of the chains’ pipelines, removing non-performing deals.

Table 16: Hotel Chain Development Pipelines in Africa 2018Top 10 Brands by Pipeline Status
Rank HotelsRooms
Total Pipeline Onsite Construction
1 Radisson Blu 25 5,473 3,322 60.7%
2 Hilton 24 6,687 3,014 45.1%
3 Marriott 16 3,438 2,368 68.9%
4 Meliá Hotels & Resorts 6 1,935 1,935 100.0%
5 Hilton Garden Inn 17 2,818 1,774 63.0%
6 Golden Tulip 9 1,662 1,662 100.0%
7 DoubleTree by Hilton 9 1,517 1,305 86.0%
8 Fairmont 8 2,977 1,124 37.8%
9 Mövenpick 7 1,535 1,075 70.0%
10 JW Marriott 6 1,645 1,038 63.1%
33Hotel Chain Development Pipelines in Africa 2018
Table 16 presents our analysis of the brands according to pipeline status. Radisson Blu displaces Marriott at first place, having the highest number of rooms actually under construction.
Ten Years AgoEgypt and Nigeria have consistently headed the table in the past ten years, both in total and in the number of rooms under construction. In 2009, South Africa was building hotels for the FIFA World Cup holding the next year, hence the high proportion of rooms under construction.
Table 15: Hotel Chain Development Pipelines in Africa 20182009: Top 5 Countries by Pipeline Status
Rank HotelsRooms
Total Onsite Construction
1 Egypt 19 6,043 4,658 77%2 Nigeria 24 4,707 3,427 73%3 Morocco 19 3,882 2,390 62%4 South Africa 14 2,224 2,099 94%5 Libya 9 2,872 1,630 57%
The Hilton brand has the largest number of pipeline rooms, but Radisson Blu has the largest number actually under construction, 3,322 rooms, almost 61 per cent of their pipeline.
As a company, Hilton has three brands in the top 10 when ranked by rooms under construction, their core brand Hilton as well as DoubleTree by Hilton and Hilton Garden Inn, with the former helped by the Hilton Africa Growth Initiative, which was announced in 2017, whereby there is US$50 million available primarily for the conversion of existing hotels to the DoubleTree brand (and others).

34Hotel Chain Development Pipelines in Africa 2018
Table 17: Hotel Chain Development Pipelines in Africa 2018Top 10 Chains by Pipeline Status
Rooms
Rank Company Hotels Total Onsite Construction
1 Marriott International 93 17,708 8,587 48.5%
2 Hilton 54 11,528 6,352 55.1%
3 Radisson Hotel Group 39 7,868 4,840 61..5%
4 AccorHotels 37 10,059 3,648 36.3%
5 Louvre Hotels Group 16 2,414 2,414 100.0%
6 Meliá Hotels International 6 1,935 1,935 100.0%
7 Best Western Hotels & Resorts 17 1,697 1,552 91.5%
8 Hyatt International 9 1,768 1,188 67.2%
9 Mövenpick Hotels & Resorts 7 1,535 1,075 70.0%
10 InterContinental Hotels Group 9 1,891 856 45.3%
Getting to the onsite construction phase means that the deals are in a more advanced stage than those which are “on paper”, and are more likely to represent hotels that will actually open – but note that starting construction does not mean that they ever will happen. Whilst a higher ratio means that more of the brand’s new hotels are on site, it also means there are fewer deals coming onto the pipeline. Two brands, Meliá and Golden Tulip, have all of their pipeline rooms on site, which means that they need to get new deals signed, if they are to have continued growth in their African portfolios.
Most of AccorHotels’ deals are fairly new, signed in 2016 and 2017, and therefore it is not unexpected that only 36 per cent of rooms in their pipeline are under construction. Best Western has just over 91 per cent of its pipeline rooms onsite, with fewer deals (491 rooms in four hotels) signed in 2017, compared to 579 rooms in seven hotels signed in 2016. Louvre and Meliá both have all of their pipeline rooms under construction.
In Table 18 we detail when the deals in the chains’ pipelines were signed. 75 of the projects reported were signed in 2017 – in reality a few more were signed that year, and opened soon thereafter. The table shows only the hotels that are still in the pipeline as of the beginning of 2018, the balance having opened or been deleted from the pipeline (often because the owner has not performed as promised). At the time of the collection of the data (Q1, 2018), 25 deals had been signed so far this year.

35Hotel Chain Development Pipelines in Africa 2018
140
120
100
80
60
40
20
0
2007 2008 2009 2010 2011 2012 2013 2014 2015 2016 2017 2018 N/K (YTD March)
Chart 10: Hotel Chain Development Pipelines in Africa 2018Years the Deals were Signed - Number of Hotels
Table 18: Hotel Chain Development Pipelines in Africa 2018Years the Deals Were Signed – Number of Hotels
2007 1
2008 6
2009 6
2010 2
2011 6
2012 10
2013 27
2014 37
2015 55
2016 77
2017 75
2018 (YTD March) 25
Not known 91

36Hotel Chain Development Pipelines in Africa 2018
Table 19: Hotel Chain Development Pipelines in Africa 20182015-2017 Scheduled vs. Actual Hotel Openings
Scheduled Actual Actualization
2015 69 27 36%
2016 110 54 49%
2017 95 51 54%
TOTAL 289 132 46%
Table 20: Hotel Chain Development Pipelines in Africa 2018Anticipated Opening Years of Pipeline Deals
Hotels Rooms Cumulative New Rooms
2018 115 17,912 17,912
2019 106 15,969 33,881
2020 75 14,072 47,953
2021 44 10,873 58,826
2022 30 7,147 65,973
2023 10 2,324 68,297
2024 and Ongoing* 38 8,025 76,322
* includes some where the opening date is not yet known
The trend is positive, with over 54 per cent of pipeline hotels opening on schedule in 2017, compared with only 36 per cent in 2015. Four chains - Frasers Hospitality, IHG, Meliá and Onomo Hotels - opened all of their scheduled pipeline hotels in 2017, whilst two chains (AccorHotels and Deutsche Hospitality) opened more than their scheduled openings. AccorHotels opened five more hotels, and Deutsche Hospitality opened one more hotel than scheduled.
Table 20 shows the anticipated opening years of the hotels in the chains’ pipelines, as per their expectations. It is clear from Appendix 5 that, sometimes, their expectations are over-optimistic - hotels very often take a long time to develop in Africa! The projections are based on the hotel deals signed by the chains at the time of data collection (Q1, 2018), and no doubt more deals will be added to these totals.
Scheduled vs Actual Openings 2015-2017
We have analysed the data provided by the chains to look at the hotels that were scheduled to open over the last three years, i.e. in 2015, 2016 and 2017, and have compared those expectations with what actually happened. Appendix 5 has the detail of each chain’s scheduled openings and those that actually opened.

37Hotel Chain Development Pipelines in Africa 2018
2019 2020 2021 2022 2023 2024
100,000
80,000
60,000
40,000
20,000
0
Chart 11: Hotel Chain Development Pipelines in Africa 2018 Anticipated Additions to Supply (Rooms, Cumulative)
Table 21: Hotel Chain Development Pipelines in Africa 2018Anticipated Opening Years of Pipeline Deals – Onsite Construction
Total Rooms Onsite Construction
2018 17,912 17,397 97%
2019 15,969 12,677 79%
2020 14,072 4,605 33%
2021 10,873 3,503 32%
2022 7,147 734 10%
2023 2,324 574 25%
2024 and Ongoing 8,025 1,798 22%
TOTAL 76,322 41,288 54%
Of the total 76,322 rooms in the pipeline, almost 18,000 rooms (23 per cent) are expected by the chains to open in 2018, and a further 16,000 in 2019. The reality on ground, however, is that 4,000 of the rooms anticipated to open this year and next were not even under construction in Q1, 2018! It would not therefore be amiss of us to suggest that there is a degree of over-optimism on the part of the chains regarding their expansion plans.
Table 21 shows the number of rooms that are scheduled to open and those actually onsite, by year. 97 per cent of the rooms scheduled to open in 2018 are onsite.

38Hotel Chain Development Pipelines in Africa 2018
18,000
16,000
14,000
12,000
10,000
8,000
6,000
4,000
2,000
0
17,397
12,677
4,6053,503
734 5741,798
2018 2019 2020 2021 2022 2023 2024 & Ongoing
Chart 12: Hotel Chain Development Pipelines in Africa 2018Anticipated Additions to Supply (Rooms)
Demonstrating the reality that hotel construction in Africa is, well, slow, almost 1,800 of the rooms scheduled to open 2024 and ongoing are already under construction – that’s 6+ years away!
Each year, we take a “snapshot” of the hotel chains’ development activity in Africa. Each year, the number of deals signed increases, as does the number of rooms in the hotels planned. The chains closely monitor the number of rooms in the pipeline, and for the quoted companies it is one of the metrics that the analysts look at to determine their buy-hold-sell recommendations.
As we point out in the analysis, these are signed deals, and of the total about 55 per cent are under construction. But some of those are at a stand-still, so let’s say that around 50 per cent of the pipeline, or about 38,000 rooms, are “happening”. That’s an average of just 700 rooms per country in Africa!
Hotel development has never been easy, anywhere in the world, and Africa brings its own challenges to the table, which are discussed at length at the various conferences held each year. Sometimes the big-picture metrics aren’t so conducive for entrepreneurs and investors, especially those contemplating an investment for the first time. But UNCTAD research shows that investors’ perception of risk, of all types, is lower on the part of those already here on the continent, and on the part of domestic investors, compared to that perceived by someone looking in, so to speak.
Concluding Remarks
39Hotel Chain Development Pipelines in Africa 2018
The headline figures might show sluggish GDP growth, or poor education performance, or poor progress in improving the investment environment, but look at the cities in those countries with poor national statistics, and you’ll often find a different picture. For example, it’s a moot point as to whether Lagos State was ever in recession, which hit Nigeria for five successive quarters. Lagos is claimed to account for over 90 per cent of Nigeria’s foreign trade flow, 30 per cent of the country’s GDP and 65 per cent of its manufacturing activity. So are there still opportunities in Lagos? For sure! Don’t ignore the national metrics, but don’t be fooled into relying solely on them for your investment strategy – look far more at the city-scale metrics and opportunities, and the specifics of the project under study.
Africa’s like that. Of course, there’s no such place as Africa, we’re 54 very diverse countries. In the World Bank’s 2018 Doing Business Report, four countries in sub-Saharan Africa, i.e. Djibouti, Malawi, Nigeria and Zambia, were listed in the top 10 improvers – it was getting easier to do business there. Meanwhile, six of the bottom 10 countries (and 12 of the bottom 20) are in Africa, where doing business can be frighteningly difficult. So never generalise about Africa.
We said last year that Africa was “woefully under-provided” when it comes to the provision of quality hotels. That’s still the case, we have tracked 51 hotels that the chains opened in 2017, with around 8,000 rooms, an average of 150 rooms per country. So there’s a way to go before the chains achieve anything like the penetration of their brands in the USA or Europe, estimated to be in the order of 70 per cent and 40 per cent, respectively. We estimate that, Africa-wide, the brand penetration is no more than 10 per cent, higher in cities such as Cairo and Cape Town, Nairobi and Lagos, but tiny in Addis Ababa, and zero in Ouagadougou and Asmara.
But we’re getting there. Ten years ago about the only chain with a development office in sub-Saharan Africa was Rezidor (now Radisson Hotel Group), with all other chains trying to reach out from Cairo, Dubai or Europe. Today, several chains have development offices in South Africa, Kenya and Nigeria, with more seeking to expand their corporate presence. Ten years ago, the pipeline was around 31,000 rooms, today it’s over 76,000, and already in 2018 there’s been a flurry of activity.
There are 115 hotels in the chains’ pipeline that are due to open this year. We strongly believe that we will see far more actually open than has been the case in previous years, contributing to the growth, and the much-needed improvement in quality, of the African hotel industry.

40Hotel Chain Development Pipelines in Africa 2018
SheratonAddis
SheratonCairo

Appendices
41Hotel Chain Development Pipelines in Africa 2018

42Hotel Chain Development Pipelines in Africa 2018
APPENDIX 1Hotel Chain Development Pipelines in Africa 2018
Contributors to the Survey – Hotel Chains & Brands
Hotel Chains Brands
AccorHotels
AdagioFairmont
Grand Mercureibis
ibis StylesMercure
M-GalleryNovotelPullmanRafflesSofitel
Swissôtel
aha Hotels & Lodges aha
Azalaï Hotel Group Azalaï
Banyan Tree Hotels & Resorts Banyan Tree
Best Western Hotels & Resorts
Best WesternBest Western Plus
Best Western PremierVib
Best Western Premier Collection
Executive Residency by Best Western
CityBlue Hotels CityBlue Urban by CityBlue
City Lodge Hotel GroupCity Lodge
Road LodgeTown Lodge
Club Med Club Med
Corinthia Hotels International Corinthia
Deutsche Hospitality Jaz at the Beach Steigenberger Hotels & Resorts
Dusit International Dusit Thani
Emaar Hospitality Group The Address
Four Seasons Hotels & Resorts Four Seasons Hotels and Resorts
Frasers Hospitality Fraser Suites
Groupe Azalaї Azalaï
Hilton Curio Collection by Hilton
DoubleTree by HiltonHilton
Hilton Garden InnWaldorf Astoria
Hyatt International Hyatt CentricHyatt Place
Hyatt RegencyPark Hyatt
InterContinental Hotels GroupCrowne PlazaHoliday Inn
InterContinentalStaybridge Suites
Kempinski Hotels Kempinski
Kerzner International One&Only
Louvre Hotels GroupGolden Tulip
KyriadPremière Classe
Royal TulipTulip Inn
Mangalis Hotel GroupNoomSeen
Yaas

43Hotel Chain Development Pipelines in Africa 2018
APPENDIX 1Hotel Chain Development Pipelines in Africa 2018
Contributors to the Survey – Hotel Chains & Brands
Hotel Chains Brands
Mantis Collection Mantis
Marriott International
AC HotelsAloft HotelsAutograph
Courtyard by MarriottElement
Four Points by SheratonJW MarriottLe Méridien
Marriott
Marriott Executive Apartments
Protea HotelsRenaissance
Residence Inn by MarriottRitz-Carlton
SheratonSt. Regis
WWestin
Meliã Hotels International Meliã Hotels & Resorts
Millennium Hotels & Resorts * Grand Millennium
Minor Hotel Group Anantara AVANI
Mövenpick Hotels & Resorts Mövenpick
Oberoi Hotels & Resorts The Oberoi
Onomo Hotels Onomo
Pefaco Hotels Pefaco
Pestana Hotels & Resorts Pestana CR7 Lifestyle Hotels Pestana Hotels
Radisson Hotel GroupPark Inn by Radisson
RadissonRadisson Blu
Radisson Collection
RIU Hotels & Resorts RIU Hotels & Resorts
Rotana Hotels & ResortsArjaan Hotel Apartments by
RotanaCentro Hotels by Rotana
Rayhaan Hotels and Resorts by Rotana
Rotana Hotels and Resorts
Sarovar Hotels & ResortsHometel
Sarovar Portico Sarovar Premiere
Serena Hotels & Resorts Serena Hotels
Swiss International Hotels and ResortsRoyal Swiss
Swiss InternationalSwiss International Villas
Swiss Spirit Hotel & Suites
The Ascott Ascott
The Latitude Hotels Group Latitude
Verde Hotels Verde
Wyndham Hotels and ResortsDays Hotel & Suites
Ramada EncoreTryp by Wyndham
WyndhamWyndham Garden
*Note: these are the brands for which the chains have signed deals. Some have many more brands than are listed here, but no deals in Africa for those brands.

44Hotel Chain Development Pipelines in Africa 2018
APPENDIX 2Hotel Chain Development Pipelines in Africa 2018
Hotels and Rooms by Country
Total by Country
Hotels Rooms
Algeria 19 4,151 20% 80%
Angola 7 1,163 44% 56%
Benin Republic 5 768 26% 74%
Botswana 3 507 39% 61%
Burundi 1 120 0% 100%
Cameroon 5 776 44% 56%
Cape Verde 12 4,011 32% 68%
Congo, Rep of 4 530 17% 83%
Côte d'Ivoire 10 1,830 70% 30%
DR Congo 3 362 44% 56%
Egypt 43 13,636 62% 38%
Ethiopia 31 5,717 40% 60%
Gabon 2 290 100% 0%
Ghana 7 1,412 16% 84%
Guinea 2 429 100% 0%
Guinea Bissau 1 208 100% 0%
Kenya 20 3,444 20% 80%
Libya 4 1,121 14% 86%
Madagascar 3 528 60% 40%
Malawi 1 144 100% 0%
Mali 2 340 0% 100%
Mauritania 2 380 0% 100%
Mauritius 7 1,022 100% 0%
Morocco 33 5,456 36% 64%
Mozambique 3 375 45% 55%
Namibia 2 234 0% 100%
Niger 3 442 68% 32%
Nigeria 57 9,603 58% 42%
Pre-
Cons
truc
tion
(P
lann
ing)
Room
s on
Sit
e
(Con
stru
ctio
n)

45Hotel Chain Development Pipelines in Africa 2018
APPENDIX 2Hotel Chain Development Pipelines in Africa 2018
Hotels and Rooms by Country
Total by Country
Hotels Rooms
Rwanda 7 655 30% 70%
Senegal 17 2,514 72% 28%
Seychelles 2 366 81% 19%
Sierra Leone 3 437 24% 76%
South Africa 37 4,311 51% 49%
South Sudan 2 393 60% 40%
Swaziland 1 124 0% 100%
Tanzania 15 1,494 0% 100%
Togo 2 306 39% 61%
Tunisia 21 4,279 34% 66%
Uganda 9 1,238 64% 36%
Zambia 9 961 49% 51%
Zimbabwe 1 245 100% 0%
TOTAL 418 76,322 46% 54%
Pre-
Cons
truc
tion
(P
lann
ing)
Room
s on
Sit
e
(Con
stru
ctio
n)

46Hotel Chain Development Pipelines in Africa 2018
APPENDIX 3Hotel Chain Development Pipelines in Africa 2018
Hotels and Rooms by Brand
Total by Brand
Hotels Rooms
AC Hotels 1 189 0% 100%
Adagio 1 110 100% 0%
aha 8 1,126 64% 36%
aloft 2 300 100% 0%
Anantara 4 553 29% 71%
Arjaan Hotel Apartments by Rotana 1 140 100% 0%
Ascott 1 220 0% 100%
Autograph 1 54 0% 100%
AVANI 3 429 90% 10%
Azalaï 5 862 77% 23%
Banyan Tree 1 60 0% 100%
Best Western 3 363 0% 100%
Best Western Plus 9 856 0% 100%
Best Western Premier 2 225 29% 71%
Best Western Premier Collection 1 83 0% 100%
Centro Hotels by Rotana 2 512 100% 0%
City Lodge 3 467 0% 100%
CityBlue 6 468 47% 53%
Club Med 4 886 100% 0%
Corinthia 2 490 39% 61%
Courtyard by Marriott 3 809 15% 85%
Crowne Plaza 2 384 48% 52%
Curio Collection by Hilton 3 259 0% 100%
Days Hotel & Suites 1 85 0% 100%
DoubleTree by Hilton 9 1,517 14% 86%
Dusit Thani 3 925 100% 0%
Element 2 449 77% 23%
Executive Residency by Best Western 1 90 0% 100%
Fairmont 8 2,977 62% 38%
Four Points by Sheraton 13 2,006 83% 17%
Pre-
Cons
truc
tion
(P
lann
ing)
Room
s on
Sit
e
(Con
stru
ctio
n)

47Hotel Chain Development Pipelines in Africa 2018
APPENDIX 3Hotel Chain Development Pipelines in Africa 2018
Hotels and Rooms by Brand
Total by Brand
Hotels Rooms
Four Seasons Hotels and Resorts 3 432 84% 16%
Fraser Suites 1 90 100% 0%
Golden Tulip 9 1,662 0% 100%
Grand Mercure 1 115 0% 100%
Grand Millennium 1 255 100% 0%
Hilton 24 6,687 55% 45%
Hilton Garden Inn 17 2,818 37% 63%
Holiday Inn 4 856 23% 77%
Hometel 1 80 0% 100%
Hyatt Centric 1 152 0% 100%
Hyatt Place 1 150 100% 0%
Hyatt Regency 6 1,285 33% 67%
ibis 6 1,073 43% 57%
ibis Styles 2 435 69% 31%
InterContinental 2 501 100% 0%
Jaz at the Beach 1 250 100% 0%
JW Marriott 6 1,645 37% 63%
Kempinski 1 180 0% 100%
Kyriad 1 98 0% 100%
Latitude 2 170 62% 38%
Le Méridien 3 720 27% 73%
Mantis 18 744 7% 93%
Marriott 16 3,438 31% 69%
Marriott Executive Apartments 5 834 34% 66%
Meliá Hotels & Resorts 6 1,935 0% 100%
Mercure 3 502 36% 64%
M-Gallery 1 218 0% 100%
Mövenpick 7 1,535 30% 70%
Noom 7 1,094 28% 72%
Novotel 7 1,441 67% 33%
Pre-
Cons
truc
tion
(P
lann
ing)
Room
s on
Sit
e
(Con
stru
ctio
n)

48Hotel Chain Development Pipelines in Africa 2018
APPENDIX 3Hotel Chain Development Pipelines in Africa 2018
Hotels and Rooms by Brand
Total by Brand
Hotels Rooms
One&Only 2 47 0% 100%
Onomo 6 839 50% 50%
Park Hyatt 1 181 0% 100%
Park Inn by Radisson 10 1,395 42% 58%
Pefaco 1 186 0% 100%
Pestana CR7 Lifestyle Hotels 1 164 0% 100%
Pestana Hotels & Resorts 1 224 0% 100%
Première Classe 1 124 0% 100%
Protea Hotels 9 1,289 53% 47%
Pullman 2 650 0% 100%
Radisson 1 152 0% 100%
Radisson Blu 25 5,473 39% 61%
Radisson Collection 3 848 35% 65%
Raffles 1 343 100% 0%
Ramada Encore 1 84 0% 100%
Rayhaan Hotels and Resorts by Rotana 1 180 0% 100%
Renaissance 1 216 100% 0%
Residence Inn by Marriott 4 651 77% 23%
Ritz-Carlton 8 1,011 46% 54%
RIU Hotels & Resorts 1 500 0% 100%
Road Lodge 1 90 0% 100%
Rotana Hotels & Resorts 2 456 44% 56%
Royal Swiss 1 40 0% 100%
Royal Tulip 2 260 0% 100%
Sarovar Portico 1 130 0% 100%
Sarovar Premiere 2 183 0% 100%
Seen 3 219 100% 0%
Serena Hotels 1 100 0% 100%
Sheraton 9 2,013 55% 45%
Sofitel 1 234 100% 0%
Pre-
Cons
truc
tion
(P
lann
ing)
Room
s on
Sit
e
(Con
stru
ctio
n)
49Hotel Chain Development Pipelines in Africa 2018
APPENDIX 3Hotel Chain Development Pipelines in Africa 2018
Hotels and Rooms by Brand
Total by Brand
Hotels Rooms
St. Regis 6 1,018 49% 51%
Staybridge Suites 1 150 100% 0%
Steigenberger Hotels & Resorts 3 979 46% 54%
Swiss International 4 684 30% 70%
Swiss International Villas 1 25 0% 100%
Swiss Spirit Hotels and Suites 2 200 0% 100%
Swissôtel 4 1,961 100% 0%
The Address 3 389 51% 49%
The Oberoi 1 84 0% 100%
Town Lodge 1 158 100% 100%
Tryp by Wyndham 1 120 100% 100%
Tulip Inn 3 270 0% 100%
Urban by CityBlue 3 220 73% 27%
Verde 1 106 0% 100%
Vib 1 80 100% 0%
W 3 678 100% 0%
Waldorf Astoria 1 247 100% 0%
Westin 1 388 100% 0%
Wyndham 2 451 64% 36%
Wyndham Garden 1 110 0% 100%
Yaas 4 433 100% 0%
TOTAL 418 76,322 46% 54%

50Hotel Chain Development Pipelines in Africa 2018
APPENDIX 4Hotel Chain Development Pipelines in Africa 2018
Hotels and Rooms by Chain
Total by Chain
Countries Hotels Rooms
AccorHotels 10 37 10,059 64% 36%
aha Hotels & Lodges 4 8 1,126 64% 36%
Banyan Tree Hotels & Resorts 1 1 60 0% 100%
Best Western Hotels & Resorts 7 17 1,697 9% 91%
CityBlue Hotels 4 9 688 55% 45%
City Lodge Hotel Group 4 5 715 22% 78%
Club Med 3 4 886 100% 0%
Corinthia Hotels International 2 2 490 39% 61%
Deutsche Hospitality 4 4 1,229 57% 43%
Dusit International 3 3 925 100% 0%
Emaar Hospitality Group 2 3 389 51% 49%
Four Seasons Hotels & Resorts 3 3 432 84% 16%
Frasers Hospitality 1 1 90 100% 0%
Groupe Azalaї 5 5 862 77% 23%
Hilton 21 54 11,528 45% 55%
Hyatt International 7 9 1,768 33% 67%
InterContinental Hotels Group 5 9 1,891 55% 45%
Kempinski Hotels 1 1 180 0% 100%
Kerzner International 1 2 47 0% 100%
Louvre Hotels Group 8 16 2,414 0% 100%
Mangalis Hotel Group 8 14 1,746 55% 45%
Mantis Collection 3 18 744 7% 93%
Marriott International 24 93 17,708 52% 48%
Meliá Hotels International 2 6 1,935 0% 100%
Millennium Hotels & Resorts 1 1 255 100% 0%
Minor Hotel Group 4 7 982 56% 44%
Mövenpick Hotels & Resorts 6 7 1,535 30% 70%
Oberoi Hotels & Resorts 1 1 84 0% 100%
Onomo Hotels 6 6 839 50% 50%
Pefaco Hotels 1 1 186 0% 100%
Pestana Hotels & Resorts 1 2 388 0% 100%
Radisson Hotel Group 19 39 7,868 38% 62%
Pre-
Cons
truc
tion
(P
lann
ing)
Room
s on
Sit
e
(Con
stru
ctio
n)

51Hotel Chain Development Pipelines in Africa 2018
APPENDIX 4Hotel Chain Development Pipelines in Africa 2018
Hotels and Rooms by Chain
Total by Chain
Countries Hotels Rooms
RIU Hotels & Resorts 1 1 500 0% 100%
Rotana Hotels & Resorts 6 6 1,288 66% 34%
Sarovar Hotels & Resorts 4 4 393 0% 100%
Serena Hotels & Resorts 1 1 100 0% 100%
Swiss International Hotels and Resorts 4 8 949 22% 78%
The Ascott 1 1 220 0% 100%
The Latitude Hotels Group 2 2 170 62% 38%
Verde Hotels 1 1 106 0% 100%
Wyndham Hotels and Resorts 4 6 850 48% 52%
TOTAL 418 76,322 46% 54%
Pre-
Cons
truc
tion
(P
lann
ing)
Room
s on
Sit
e
(Con
stru
ctio
n)

52Hotel Chain Development Pipelines in Africa 2018
APPENDIX 5Hotel Chain Development Pipelines in Africa 2018Hotels and Rooms by Chain - Pipeline Realisation
Scheduled opening year 2015 2016 2017
Hotels Hotels Hotels
Scheduled Actual Scheduled Actual Scheduled Actual
AccorHotels 6 1 17% 21 13 62% 6 11 183%
Aha Hotels & Lodges - - - - - - - -
Banyan Tree 1 - - 1 1 100% - - -
Best Western 7 3 43% 8 4 50% 7 2 29%
CityBlue Hotels - - - 6 1 17% 3 2 67%
City Lodge 2 - - - - - 2 - -
Club Med - - - - - - - -
Corinthia - - - - - - - - -
Deutsche Hospitality - - - 2 1 50% 3 4 133%
Dusit International - - - - - - - - -
Emaar Hospitality
Four Seasons 1 1 100% - - - 2 1 50%
Frasers Hospitality - - - 1 - - 1 1 100%
Groupe Azalaï 2 1 50% 1 1 100% - 1 -
Hilton 2 2 100% 3 1 33% 4 2 50%
Hyatt International 2 2 100% - - - - - -
InterContinental 1 1 100% - - - 2 2 100%
Kempinski Hotels 3 2 67% - - - - - -
Kerzner International - - - - - - - -
Louvre Hotels Group 3 2 67% 16 10 63% 8 4 50%
Mangalis Hotel Group 2 - - 3 3 100% 3 1 33%
Mantis Collection 4 1 25% 3 - - 6 3 50%
Marriott International 7 - - 7 9 129% 17 4 24%
Meliá - - - 1 1 100% 3 3 100%
Millennium
Minor Hotel Group 3 2 67% 5 1 20% 5 - -
Mövenpick - - - 2 1 50% 2 1 50%
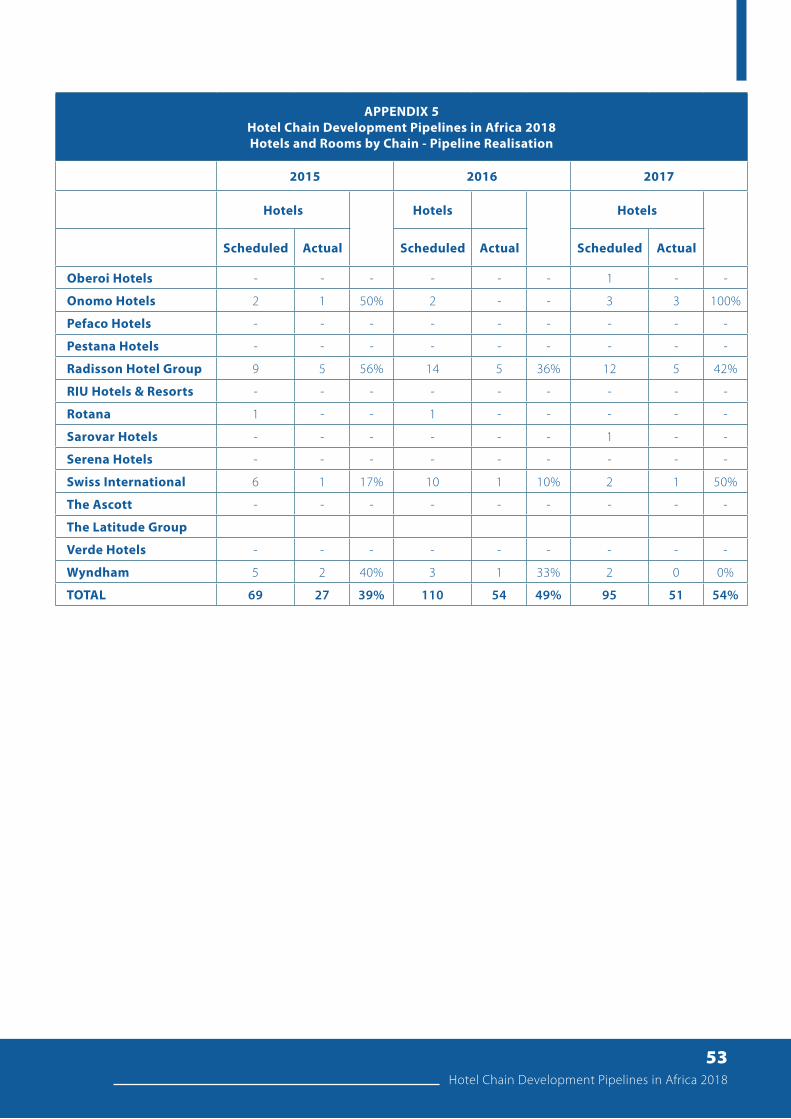
53Hotel Chain Development Pipelines in Africa 2018
APPENDIX 5Hotel Chain Development Pipelines in Africa 2018Hotels and Rooms by Chain - Pipeline Realisation
2015 2016 2017
Hotels Hotels Hotels
Scheduled Actual Scheduled Actual Scheduled Actual
Oberoi Hotels - - - - - - 1 - -
Onomo Hotels 2 1 50% 2 - - 3 3 100%
Pefaco Hotels - - - - - - - - -
Pestana Hotels - - - - - - - - -
Radisson Hotel Group 9 5 56% 14 5 36% 12 5 42%
RIU Hotels & Resorts - - - - - - - - -
Rotana 1 - - 1 - - - - -
Sarovar Hotels - - - - - - 1 - -
Serena Hotels - - - - - - - - -
Swiss International 6 1 17% 10 1 10% 2 1 50%
The Ascott - - - - - - - - -
The Latitude Group
Verde Hotels - - - - - - - - -
Wyndham 5 2 40% 3 1 33% 2 0 0%
TOTAL 69 27 39% 110 54 49% 95 51 54%

About Us
54Hotel Chain Development Pipelines in Africa 2018
At W Hospitality Group we specialise in the hotel, tourism and leisure industries in Africa, providing a full range of services to our clients who have investments in the sector, or who are looking to enter them, through development, acquisition or other means. Our services are integral parts of the process of realising a successful project, and delivering profitability post-completion. For many years we have been regarded as the market leader in sub-Saharan Africa due to the market and financial expertise of our staff, our experience of the global and African hotel industry, our commitment to our clients and our desire to see them succeed.
Our team has experience of more than 90 countries, including 39 in Africa, both developed and developing, and at all market levels, from deluxe hotels to roadside lodges, exclusive health clubs to public recreation facilities, and from the master planning of thousand hectare sites to the best use of city blocks. This experience is essential when advising on multi-million dollar projects, in order to bring first-hand knowledge of success factors – and sometimes how not to do it.
We have worked with most of the major international and regional hotel companies, as well as multilateral funding agencies, financial institutions and governments, and individual entrepreneurs. Our clients benefit from our relationships with senior executives in these stakeholders, and our knowledge of how they operate.
We are regarded as the foremost international expert on the hotel industry in West Africa – and this expertise is considered by our clients to be of great benefit to them. In recognition of our expertise, we were awarded the accolade of Tourism Investment Advisor of the Year 2008, and again in 2011, by Africa Investor magazine, for our work on projects in Africa, where we have been able to “make it happen”. The award has not been made since 2011.
We are a founder member of Hotel Partners Africa (HPA), a group of consultants and advisers offering complementary services to hotel developers and owners. In the complex world of hotel development and management, where a client’s specific needs must be balanced with all the processes and requirements to satisfy funders, manage risk, oversee cost efficient and fit-for-purpose construction, contract negotiation with operators, asset management, valuations, sales and acquisitions, and recruitment, HPA is a unique professional and integrated complete-solutions provider with integrity, experience and a proven track record, providing a seamless service throughout the lifecycle of a hotel project.
HPA has a highly proactive team with long-standing relationships with major players, particularly branded chains, developers, fund managers and property owners. The partners are based in Lagos, London, Cape Town, Addis Ababa and Florida.

Back Cover:Yaas Hôtel
Dakar
TajCape Town
55Hotel Chain Development Pipelines in Africa 2018

US$ 500.00ON TOP OF AFRICA
US$500.00
W HOSPITALITY GROUP
Plot 10, Babatunde Crescent, off Oniru Market Road,
Lekki Phase 1, Lagos, Nigeria
Tel: +234 (0) 803 321 0646
www.w-hospitalitygroup.com


