37
1 2019-2020 School Enrollment Projections East Greenbush Central School District
1
2019-2020 School
Enrollment Projections East Greenbush Central School District
2
Capital District Regional Planning Commission
One Park Place | Suite 102 | Albany, New York 12205-2676
www.cdrpc.org
January 2020
Cover Picture Courtesy of East Greenbush Central School District
3
Contents About the Capital District Regional Planning Commission .................................................................................5
Executive Summary ............................................................................................................................................6
Introduction........................................................................................................................................................7
Chart 1. 20-Year Total Enrollment, East Greenbush Central School District .............................................7
Grade-to-Grade Survival Multipliers ..............................................................................................................8
Chart 2: Number of Births .........................................................................................................................9
Impact of Housing Development and Home Sales ...................................................................................... 10
Table 4. Number of Housing Units, East Greenbush Central School District .......................................... 10
Chart 3. Total Number of Housing Units, East Greenbush Central School District ................................ 10
Table 5: Building Permits Issuances ....................................................................................................... 11
Chart 4a: Building Permits Issued Town of East Greenbush .................................................................. 12
Chart 4b: Building Permits Issued Town of Schodack ............................................................................ 13
Chart 5: East Greenbush Central School District Existing Home Sales .................................................... 14
Five Year Enrollment Projections ............................................................................................................ 15
Chart 6: Total Enrollment with Projections, 2009-2024 ......................................................................... 15
Kindergarten Enrollment Projection ........................................................................................................... 16
Chart 7: Kindergarten Enrollment with Projections, 2009-2024 ............................................................ 16
K-5 Enrollment Projection ........................................................................................................................... 17
Chart 8: K-5 Enrollment with Projections, 2009-2024 ............................................................................ 17
6-8 Enrollment Projection ........................................................................................................................... 18
Chart 9: 6-8 Enrollment with Projections, 2009-2024 ............................................................................ 18
9-12 Enrollment Projection ......................................................................................................................... 19
Chart 10: 9-12 Enrollment with Projections, 2009-2024 ........................................................................ 19
Historic Enrollment Trends .............................................................................................................................. 20
Chart 11. 20-Year Total Enrollment ........................................................................................................ 20
20-Year Kindergarten Enrollment ............................................................................................................... 21
Chart 12. 20-Year Kindergarten Enrollment ........................................................................................... 21
20-Year K-5 Enrollment ............................................................................................................................... 22
Chart 13. 20-Year K-5 Enrollment ........................................................................................................... 22
20-Year 6-8 Enrollment ............................................................................................................................... 23
Chart 14. 20-Year 6-8 Enrollment ........................................................................................................... 23

4
20-Year 9-12 Enrollment ............................................................................................................................. 24
Chart 15. 20-Year 9-12 Enrollment ......................................................................................................... 24
Actual vs. Projected Enrollment & Survival Multipliers .................................................................................. 24
Chart 16: Actual vs. Projected Enrollment ............................................................................................. 25
Generational Enrollment Patterns .................................................................................................................. 26
Chart 17: Actual vs. Projected Enrollment ............................................................................................. 27
Conclusion ....................................................................................................................................................... 27
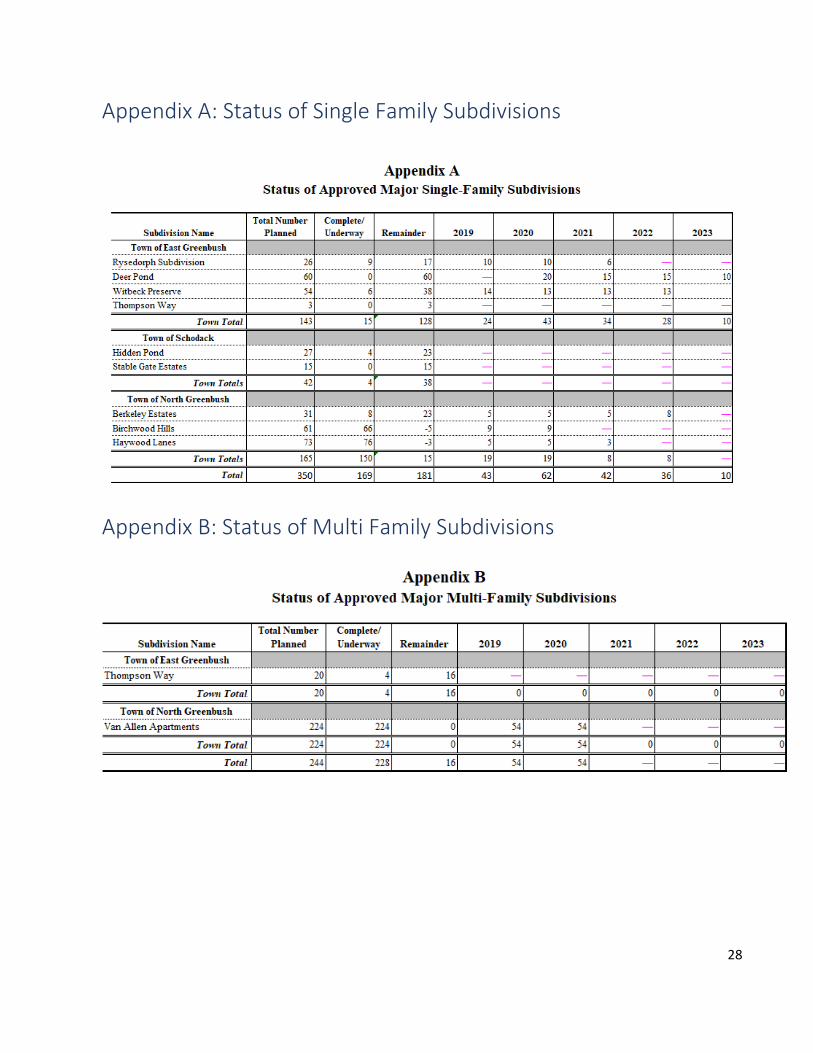
Appendix A: Status of Single Family Subdivisions ........................................................................................... 28
Appendix B: Status of Multi Family Subdivisions ............................................................................................ 28
Appendix: Data Tables .................................................................................................................................... 29
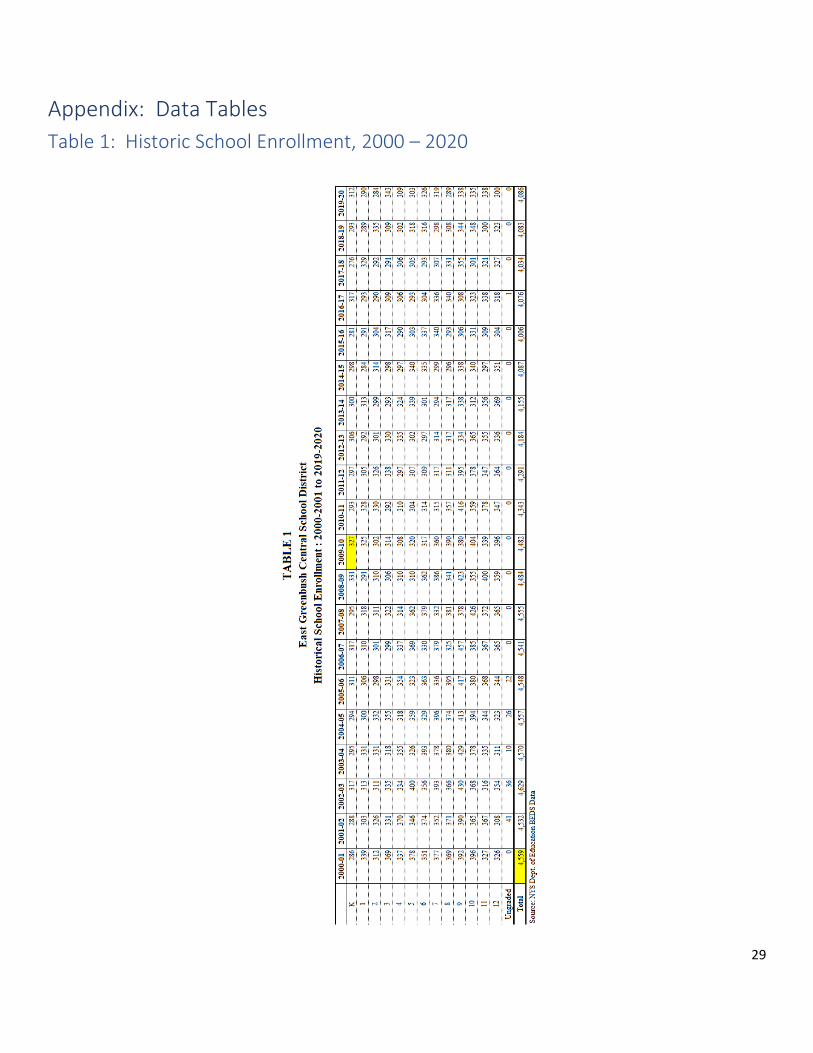
Table 1: Historic School Enrollment, 1999 – 2019 ..................................................................................... 29
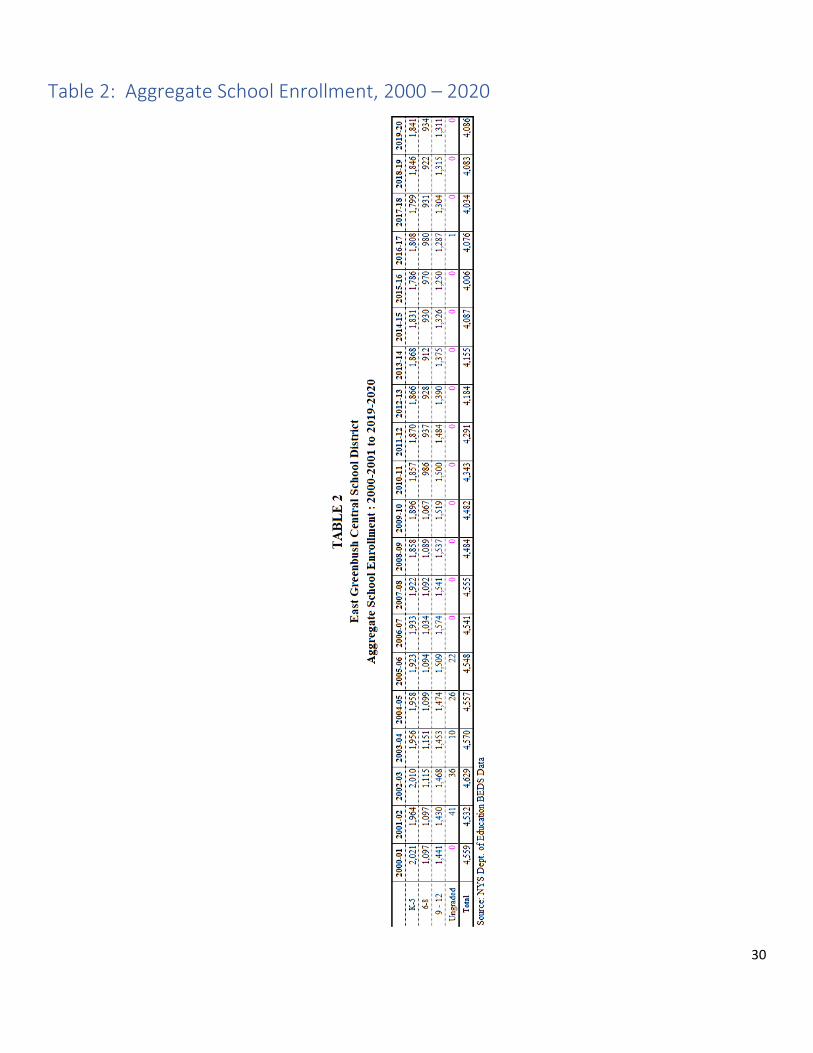
Table 2: Aggregate School Enrollment, 1999 – 2019 ................................................................................. 30
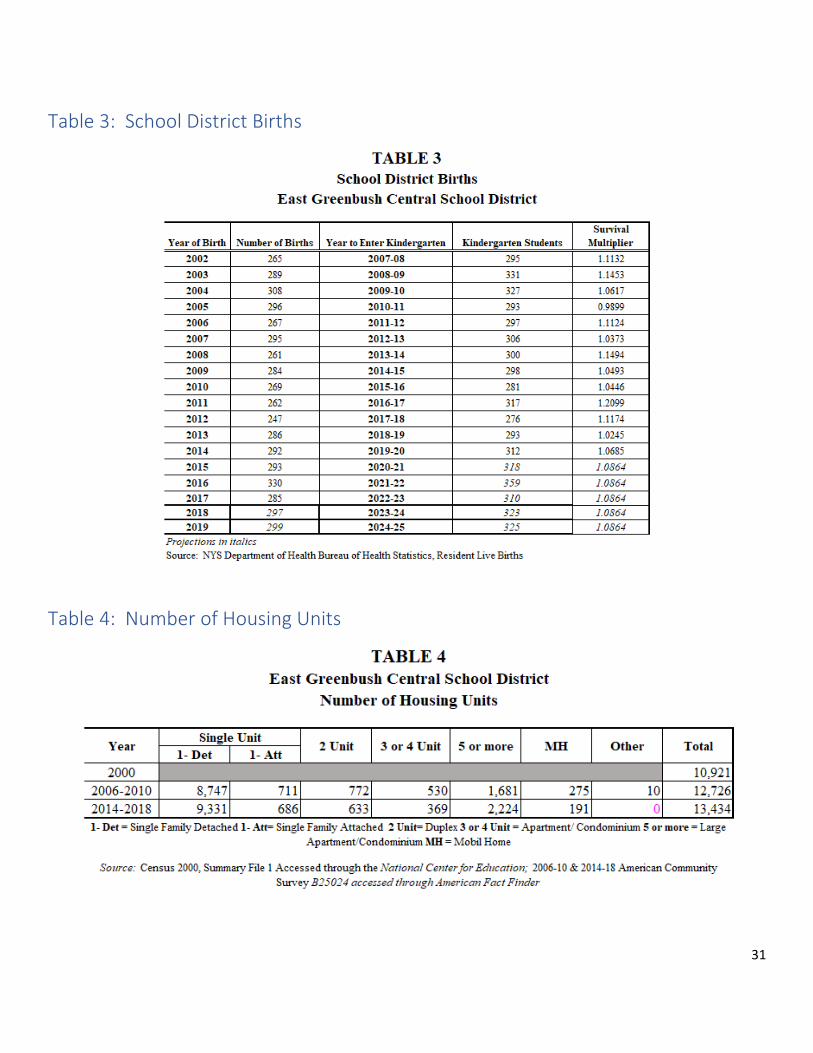
Table 3: School District Births ..................................................................................................................... 31
Table 4: Number of Housing Units ............................................................................................................. 31
Table 5: Building Permits ............................................................................................................................ 32
Table 6: Existing Home Sales ...................................................................................................................... 33
Table 7: Enrollment Projections, 2019 – 2024 ........................................................................................... 35
5
About the Capital District Regional Planning Commission
Our Mission
The Capital District Regional Planning Commission (CDRPC) is a regional planning and resource center serving
Albany, Rensselaer, Saratoga, and Schenectady counties. CDRPC provides objective analysis of data, trends,
opportunities, and challenges relevant to the Region’s economic development and planning communities.
CDRPC serves the best interests of the public and private sectors by promoting intergovernmental
cooperation; communicating, collaborating, and facilitating regional initiatives; and sharing information and
fostering dialogues on solutions to regional challenges.
Our History
CDRPC was established as a regional planning board in 1967 by a cooperative agreement among the counties
of Albany, Rensselaer, Saratoga, and Schenectady. Its original purpose was to perform and support
comprehensive planning work, including surveys, planning services, technical services, and the formulation
of plans and policies to promote sound and coordinated development of the entire Region. Over time, the
mission of the Planning Commission evolved in response to changes in the Region’s needs, funding sources,
organizational structure, and information technology. While continuing to provide a wide variety of
comprehensive planning services, CDRPC has also assumed the functions of Data and Information Center,
Economic Development District, Foreign-Trade Zone Administrator, Clean Energy Communities Program
Coordinator, and Water Quality Manager.
6
Executive Summary The 2019-20 School Enrollment Projections for East Greenbush Central School District provides five-year
enrollment projections beginning with the 2020-21 school year. This report looks at key indicators such as
enrollment trends, birth rates, residential development activity, and more, to draw key findings. Some of the
key findings of the report are as follows:
• After years of decline, total enrollment has continued a recent trend of enrollment increases.
Enrollment in 2019-20 saw a slight increase from last year with 4,086 total students enrolled.
• Since the 20-year low enrollment of 4,006 in 2015-16, total enrollment has increased by 80 students
or 2%.
• Enrollment in both the K-5 and 9-12 cohorts have seen decreases since last year, but the 6-8 cohort
saw an increase from last year’s total. The K-5 and 6-8 cohorts are both projected to see increases
over the next five years. 9-12 enrollment is projected to decline over the next five years. Increases in
the lower cohorts will eventually help increase 9-12 enrollment over the next decade.
• While district births have been steadily increasing, 2017’s birth class saw a drop to 285, the lowest
since 2012. Monitoring birth rates in 2018 and 2019 will be important in determining future growth
in the K-5 cohort and total enrollment overall.
• Approximately 600 residential units are approved, planned, or recently completed within the District.
These developments feature both multi and single-family homes which could have a significant
impact on future enrollment. Many of the already approved units are planned to be completed by
2022 which could add a boost to enrollment in the future.
• Existing home sales in the District continue to be strong. This year’s sales are on pace to be less than
last year’s totals but greater than in 2017 and 2016. Potential new families moving into the District
can help increase enrollment and births.
• By 2024-25, the K-5 and 6-8 cohorts are expected to increase to 1,968 (6.9%) and 960 (2.8%)
respectively. The 9-12 cohort is projected to decrease to 1,268 students, a decline of 3.3%.
• Total enrollment for 2020-21 is projected to be 4,105 students, an increase of .47% from 2019-20.
Enrollment for K-5, 6-8, and 9-12 is projected at 1,867 (1.4%), 951 (1.8%), and 1,287 (-1.8%)
respectively.
• Total enrollment by 2024-25 is projected to be 4,196 students, an increase of 2.69% from 2019-20.
Enrollment for K-5, 6-8, and 9-12 is projected at 1,968 (6.9%), 960 (2.8%), and 1,268 (-3.3%)
respectively.
7
Introduction The East Greenbush Central School District (the District) authorized the Capital District Regional Planning
Commission (CDRPC) to prepare district-wide school enrollment projections annually for the 2017-2020
school years. This report contains school district enrollment projections for the 2020-21 through 2024-25
school years.
The following is a description of the data, assumptions, activities, and trends that may influence the number
of students enrolled in the East Greenbush Central School District, as well as future enrollment projections.
A variety of data sets were evaluated leading to the preparation of a final set of projections and include the
following:
• Historical enrollment trends;
• District grade-to-grade survival multipliers calculated from enrollment data in 5-, 10-, and 20-
year increments;
• Annual school district birth data since 2002;
• District-wide housing data including total count, and types of homes;
• Residential building permit issuances from the primary overlapping municipalities;
• Annual existing home sales since 2014;
• Anticipated new residential building activity in the District;
The historical enrollment trends examine the patterns and trends in enrollment over the previous 20 years
and inform how enrollment fluctuates year-to-year over a generation of students. This report also examines
patterns and trends for individual grades and total enrollment is examined alongside those of the three grade
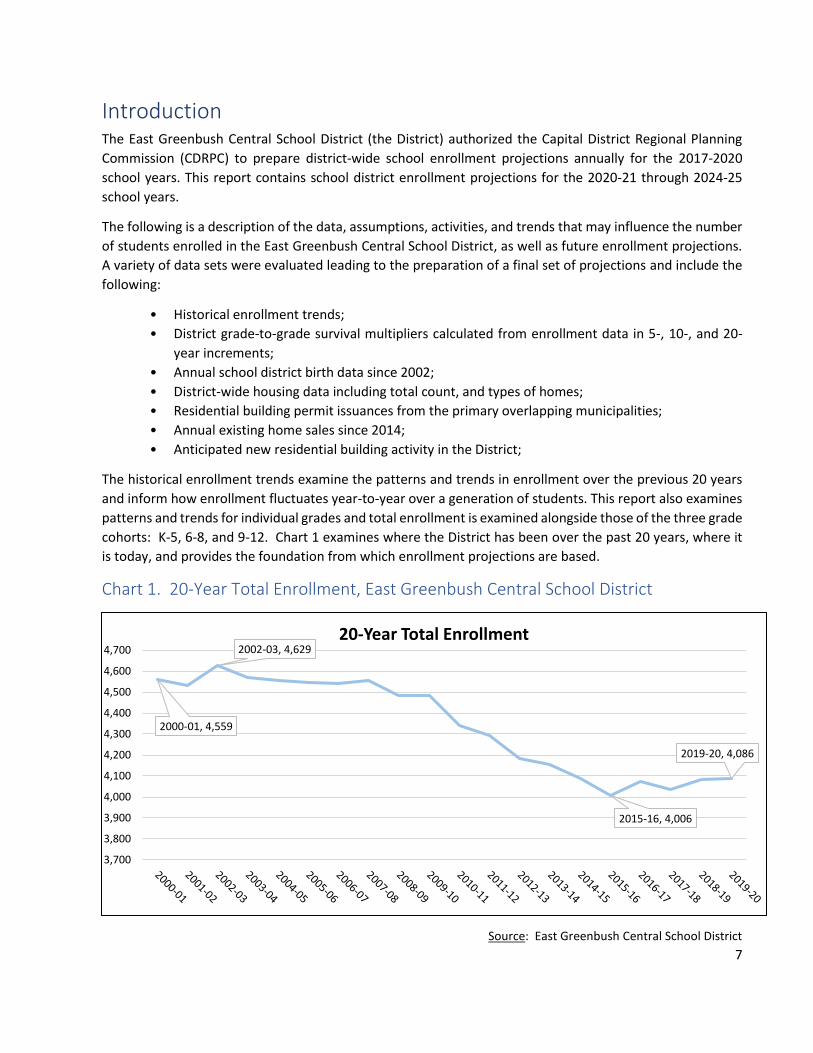
cohorts: K-5, 6-8, and 9-12. Chart 1 examines where the District has been over the past 20 years, where it
is today, and provides the foundation from which enrollment projections are based.
Chart 1. 20-Year Total Enrollment, East Greenbush Central School District
Source: East Greenbush Central School District
2000-01, 4,559
2002-03, 4,629
2015-16, 4,006
2019-20, 4,086
3,700
3,800
3,900
4,000
4,100
4,200
4,300
4,400
4,500
4,600
4,70020-Year Total Enrollment
8
Enrollment data was provided by the District as of the Fall of 2019. Enrollment was calculated as those
students in “regular” classes. Students listed as “Self-Contained” are typically included as a unique
classification and not assigned to any specific grade, however they were not presented as a separate category
in this projection.
Grade-to-Grade Survival Multipliers
Grade-to-grade survival multipliers provide a foundation from which enrollment projections are calculated.
We calculate a survival multiplier by dividing the number of students in a grade per year by the number of
students in the previous grade in the prior year.
With enrollment data dating back to the 1984-1985 school year, it is possible to determine short-term,
medium-term, and long-term survival multipliers. These terms are categorized as 5-year, 10-year, and 20-
year survival multipliers. These multipliers are calculated by taking the average survival multiplier for a grade
by the designated number of years. These averages are then used as a possible method for projecting future
enrollment.
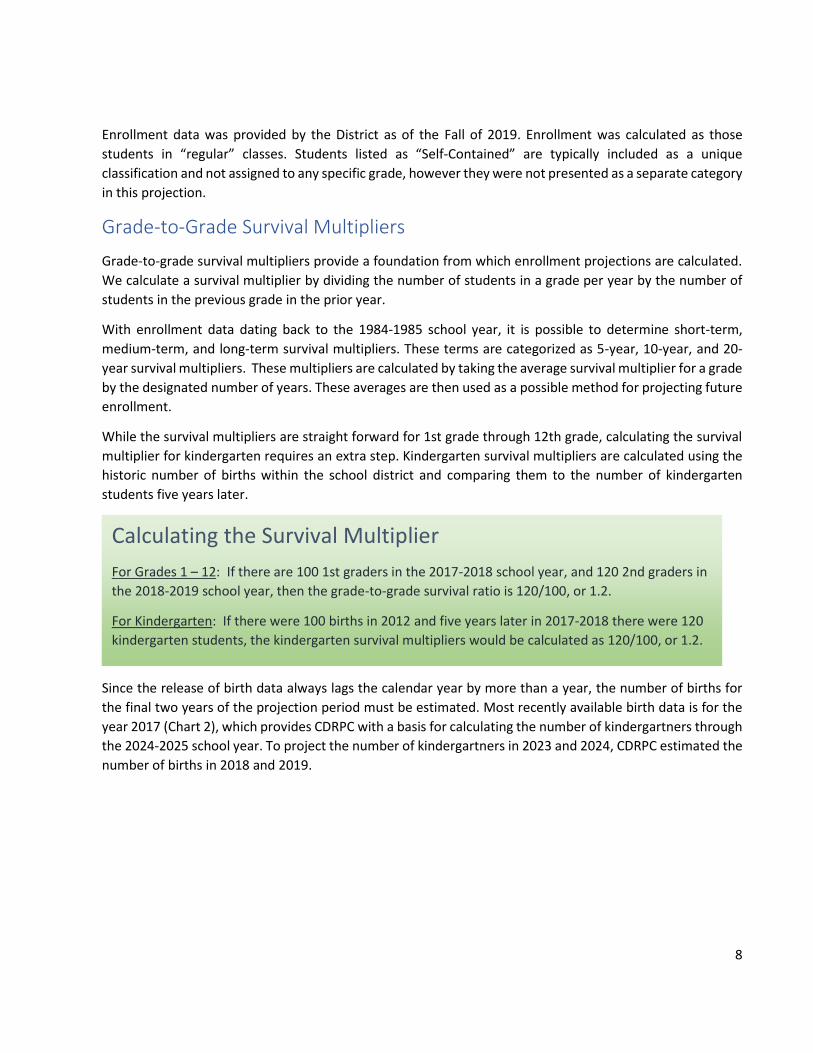
While the survival multipliers are straight forward for 1st grade through 12th grade, calculating the survival
multiplier for kindergarten requires an extra step. Kindergarten survival multipliers are calculated using the
historic number of births within the school district and comparing them to the number of kindergarten
students five years later.
Since the release of birth data always lags the calendar year by more than a year, the number of births for
the final two years of the projection period must be estimated. Most recently available birth data is for the
year 2017 (Chart 2), which provides CDRPC with a basis for calculating the number of kindergartners through
the 2024-2025 school year. To project the number of kindergartners in 2023 and 2024, CDRPC estimated the
number of births in 2018 and 2019.
Calculating the Survival Multiplier
For Grades 1 – 12: If there are 100 1st graders in the 2017-2018 school year, and 120 2nd graders in
the 2018-2019 school year, then the grade-to-grade survival ratio is 120/100, or 1.2.
For Kindergarten: If there were 100 births in 2012 and five years later in 2017-2018 there were 120
kindergarten students, the kindergarten survival multipliers would be calculated as 120/100, or 1.2.
9
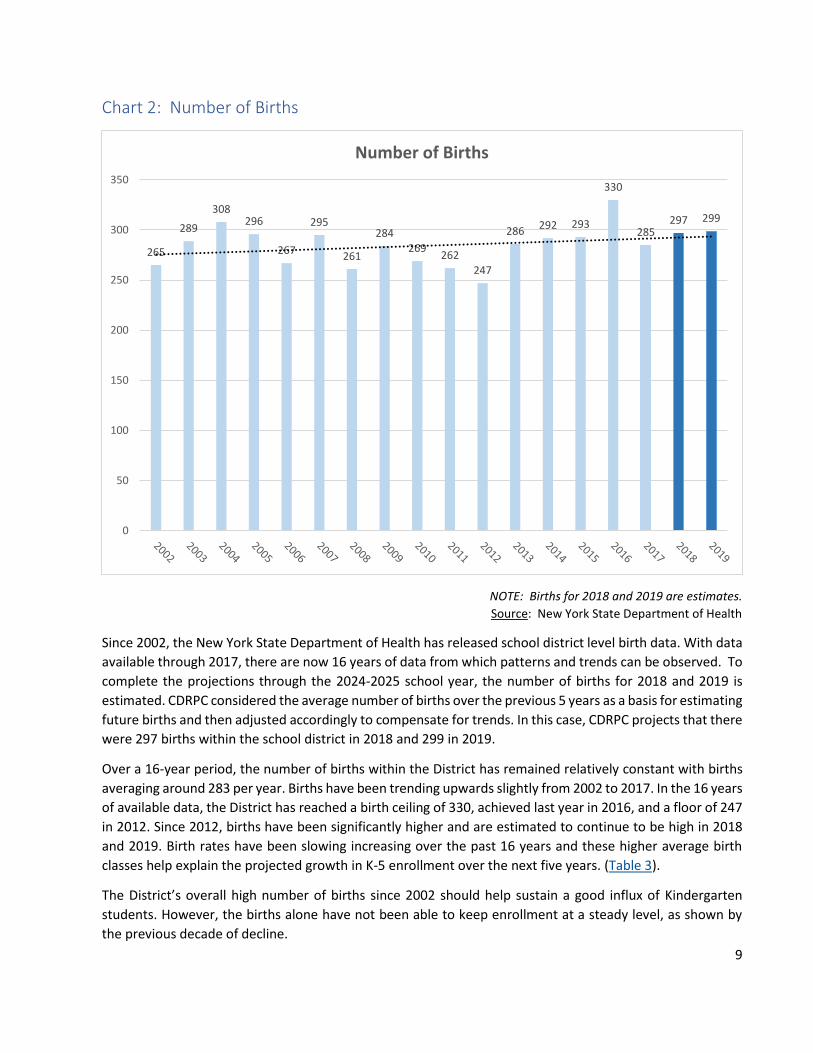
Chart 2: Number of Births
NOTE: Births for 2018 and 2019 are estimates.
Source: New York State Department of Health
Since 2002, the New York State Department of Health has released school district level birth data. With data
available through 2017, there are now 16 years of data from which patterns and trends can be observed. To
complete the projections through the 2024-2025 school year, the number of births for 2018 and 2019 is
estimated. CDRPC considered the average number of births over the previous 5 years as a basis for estimating
future births and then adjusted accordingly to compensate for trends. In this case, CDRPC projects that there
were 297 births within the school district in 2018 and 299 in 2019.
Over a 16-year period, the number of births within the District has remained relatively constant with births
averaging around 283 per year. Births have been trending upwards slightly from 2002 to 2017. In the 16 years
of available data, the District has reached a birth ceiling of 330, achieved last year in 2016, and a floor of 247
in 2012. Since 2012, births have been significantly higher and are estimated to continue to be high in 2018
and 2019. Birth rates have been slowing increasing over the past 16 years and these higher average birth
classes help explain the projected growth in K-5 enrollment over the next five years. (Table 3).
The District’s overall high number of births since 2002 should help sustain a good influx of Kindergarten
students. However, the births alone have not been able to keep enrollment at a steady level, as shown by
the previous decade of decline.
265
289
308296
267
295
261
284
269262
247
286292 293
330
285297 299
0
50
100
150
200
250
300
350
Number of Births
10
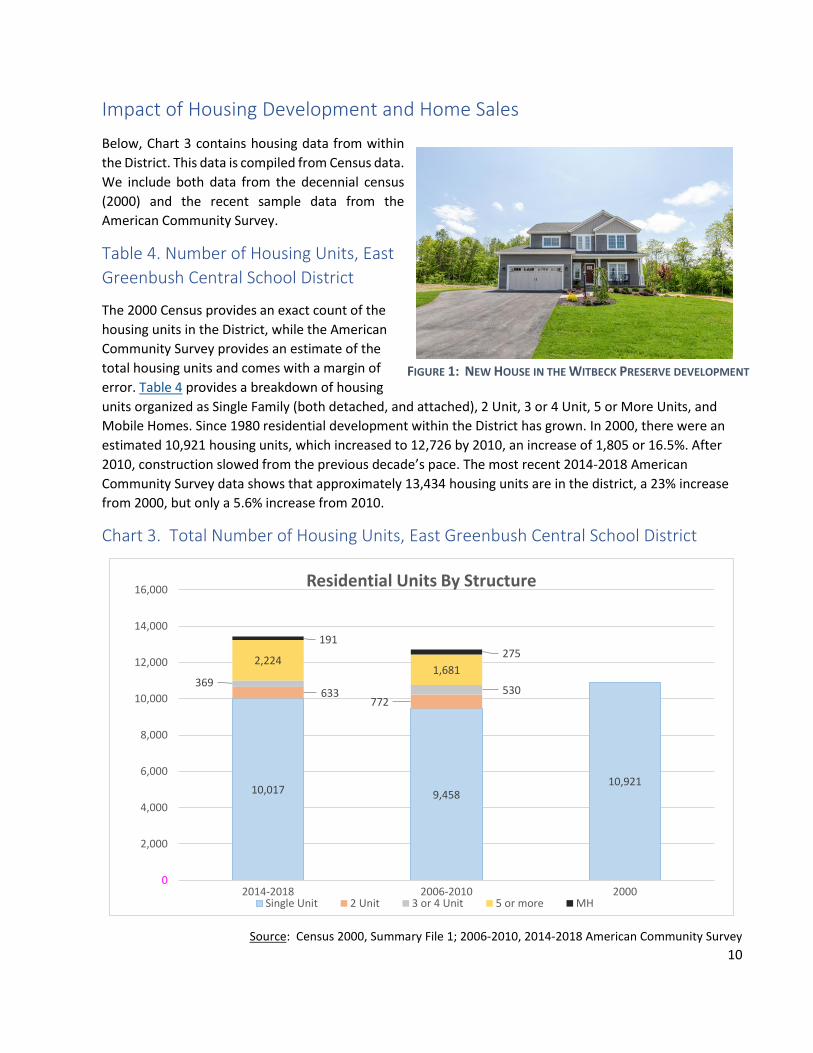
Impact of Housing Development and Home Sales
Below, Chart 3 contains housing data from within
the District. This data is compiled from Census data.
We include both data from the decennial census
(2000) and the recent sample data from the
American Community Survey.
Table 4. Number of Housing Units, East
Greenbush Central School District
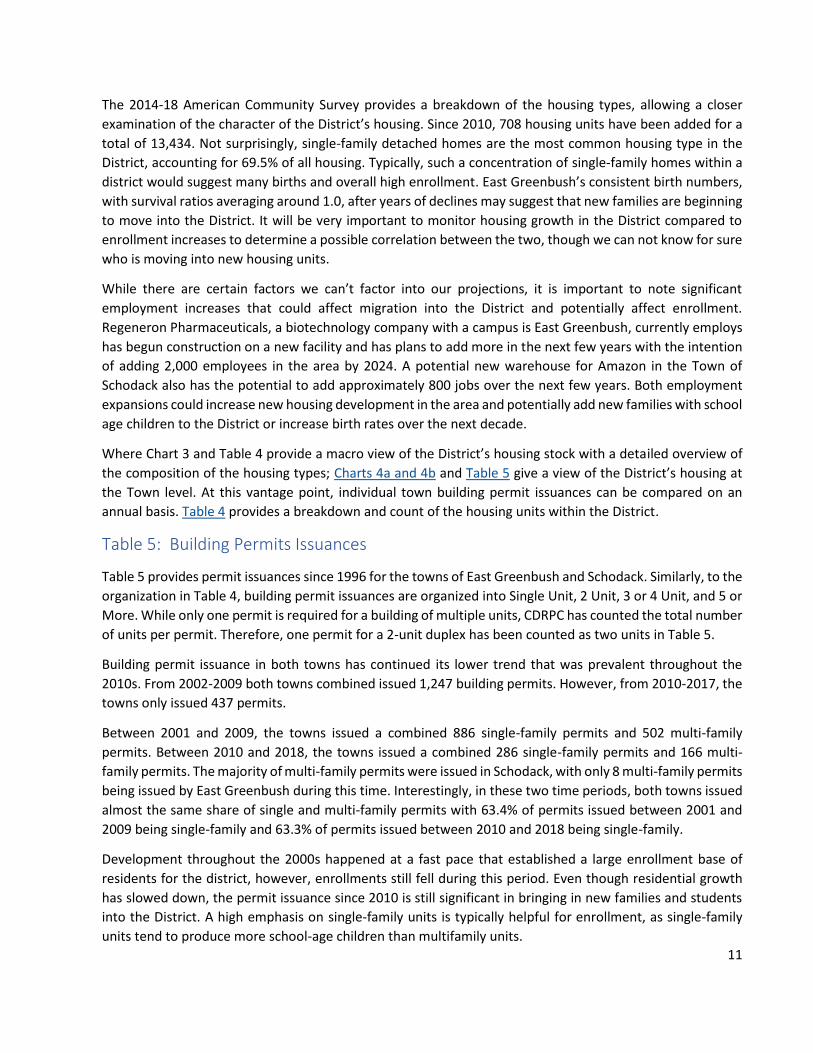
The 2000 Census provides an exact count of the
housing units in the District, while the American
Community Survey provides an estimate of the
total housing units and comes with a margin of
error. Table 4 provides a breakdown of housing
units organized as Single Family (both detached, and attached), 2 Unit, 3 or 4 Unit, 5 or More Units, and
Mobile Homes. Since 1980 residential development within the District has grown. In 2000, there were an
estimated 10,921 housing units, which increased to 12,726 by 2010, an increase of 1,805 or 16.5%. After
2010, construction slowed from the previous decade’s pace. The most recent 2014-2018 American
Community Survey data shows that approximately 13,434 housing units are in the district, a 23% increase
from 2000, but only a 5.6% increase from 2010.
Chart 3. Total Number of Housing Units, East Greenbush Central School District
Source: Census 2000, Summary File 1; 2006-2010, 2014-2018 American Community Survey
10,017 9,45810,921
633772
369530
2,2241,681
191275
0
2,000
4,000
6,000
8,000
10,000
12,000
14,000
16,000
2014-2018 2006-2010 2000
Residential Units By Structure
Single Unit 2 Unit 3 or 4 Unit 5 or more MH
FIGURE 1: NEW HOUSE IN THE WITBECK PRESERVE DEVELOPMENT
11
The 2014-18 American Community Survey provides a breakdown of the housing types, allowing a closer
examination of the character of the District’s housing. Since 2010, 708 housing units have been added for a
total of 13,434. Not surprisingly, single-family detached homes are the most common housing type in the
District, accounting for 69.5% of all housing. Typically, such a concentration of single-family homes within a
district would suggest many births and overall high enrollment. East Greenbush’s consistent birth numbers,
with survival ratios averaging around 1.0, after years of declines may suggest that new families are beginning
to move into the District. It will be very important to monitor housing growth in the District compared to
enrollment increases to determine a possible correlation between the two, though we can not know for sure
who is moving into new housing units.
While there are certain factors we can’t factor into our projections, it is important to note significant
employment increases that could affect migration into the District and potentially affect enrollment.
Regeneron Pharmaceuticals, a biotechnology company with a campus is East Greenbush, currently employs
has begun construction on a new facility and has plans to add more in the next few years with the intention
of adding 2,000 employees in the area by 2024. A potential new warehouse for Amazon in the Town of
Schodack also has the potential to add approximately 800 jobs over the next few years. Both employment
expansions could increase new housing development in the area and potentially add new families with school
age children to the District or increase birth rates over the next decade.
Where Chart 3 and Table 4 provide a macro view of the District’s housing stock with a detailed overview of
the composition of the housing types; Charts 4a and 4b and Table 5 give a view of the District’s housing at
the Town level. At this vantage point, individual town building permit issuances can be compared on an
annual basis. Table 4 provides a breakdown and count of the housing units within the District.
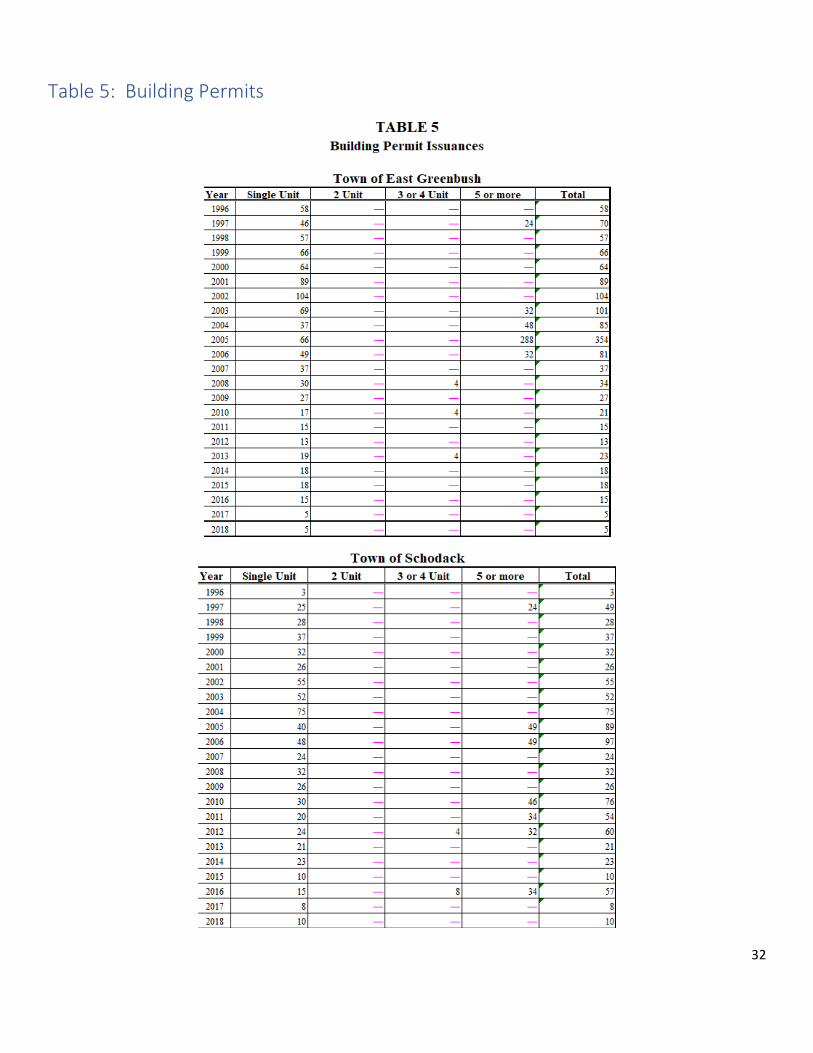
Table 5: Building Permits Issuances
Table 5 provides permit issuances since 1996 for the towns of East Greenbush and Schodack. Similarly, to the
organization in Table 4, building permit issuances are organized into Single Unit, 2 Unit, 3 or 4 Unit, and 5 or
More. While only one permit is required for a building of multiple units, CDRPC has counted the total number
of units per permit. Therefore, one permit for a 2-unit duplex has been counted as two units in Table 5.
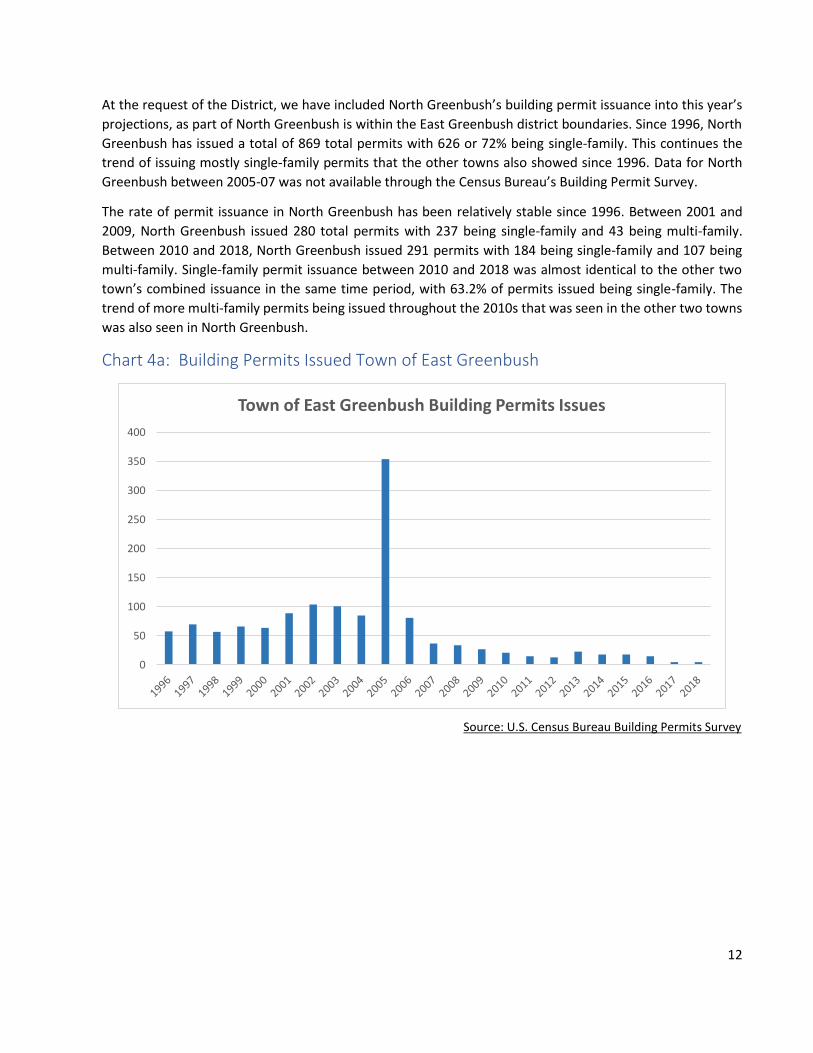
Building permit issuance in both towns has continued its lower trend that was prevalent throughout the
2010s. From 2002-2009 both towns combined issued 1,247 building permits. However, from 2010-2017, the
towns only issued 437 permits.
Between 2001 and 2009, the towns issued a combined 886 single-family permits and 502 multi-family
permits. Between 2010 and 2018, the towns issued a combined 286 single-family permits and 166 multi-
family permits. The majority of multi-family permits were issued in Schodack, with only 8 multi-family permits
being issued by East Greenbush during this time. Interestingly, in these two time periods, both towns issued
almost the same share of single and multi-family permits with 63.4% of permits issued between 2001 and
2009 being single-family and 63.3% of permits issued between 2010 and 2018 being single-family.
Development throughout the 2000s happened at a fast pace that established a large enrollment base of
residents for the district, however, enrollments still fell during this period. Even though residential growth
has slowed down, the permit issuance since 2010 is still significant in bringing in new families and students
into the District. A high emphasis on single-family units is typically helpful for enrollment, as single-family
units tend to produce more school-age children than multifamily units.
12
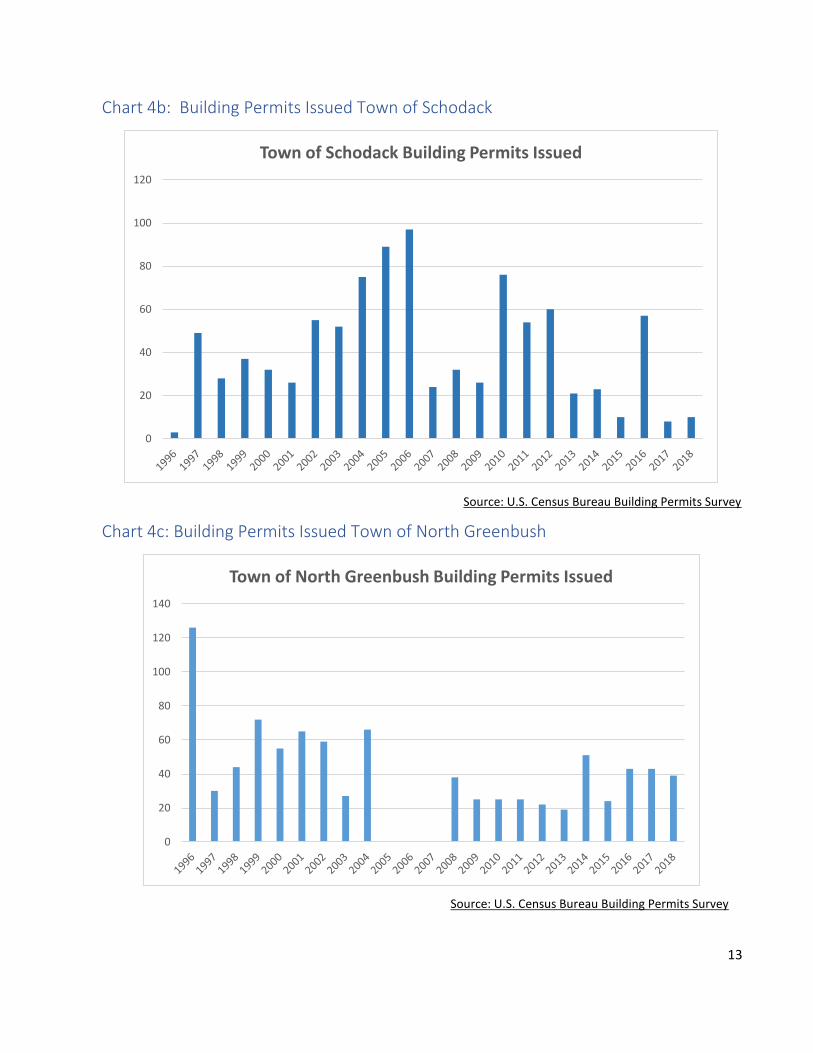
At the request of the District, we have included North Greenbush’s building permit issuance into this year’s
projections, as part of North Greenbush is within the East Greenbush district boundaries. Since 1996, North
Greenbush has issued a total of 869 total permits with 626 or 72% being single-family. This continues the
trend of issuing mostly single-family permits that the other towns also showed since 1996. Data for North
Greenbush between 2005-07 was not available through the Census Bureau’s Building Permit Survey.
The rate of permit issuance in North Greenbush has been relatively stable since 1996. Between 2001 and
2009, North Greenbush issued 280 total permits with 237 being single-family and 43 being multi-family.
Between 2010 and 2018, North Greenbush issued 291 permits with 184 being single-family and 107 being
multi-family. Single-family permit issuance between 2010 and 2018 was almost identical to the other two
town’s combined issuance in the same time period, with 63.2% of permits issued being single-family. The
trend of more multi-family permits being issued throughout the 2010s that was seen in the other two towns
was also seen in North Greenbush.
Chart 4a: Building Permits Issued Town of East Greenbush
Source: U.S. Census Bureau Building Permits Survey
0
50
100
150
200
250
300
350
400
Town of East Greenbush Building Permits Issues
13
Chart 4b: Building Permits Issued Town of Schodack
Source: U.S. Census Bureau Building Permits Survey
Chart 4c: Building Permits Issued Town of North Greenbush
Source: U.S. Census Bureau Building Permits Survey
0
20
40
60
80
100
120
Town of Schodack Building Permits Issued
0
20
40
60
80
100
120
140
Town of North Greenbush Building Permits Issued
14
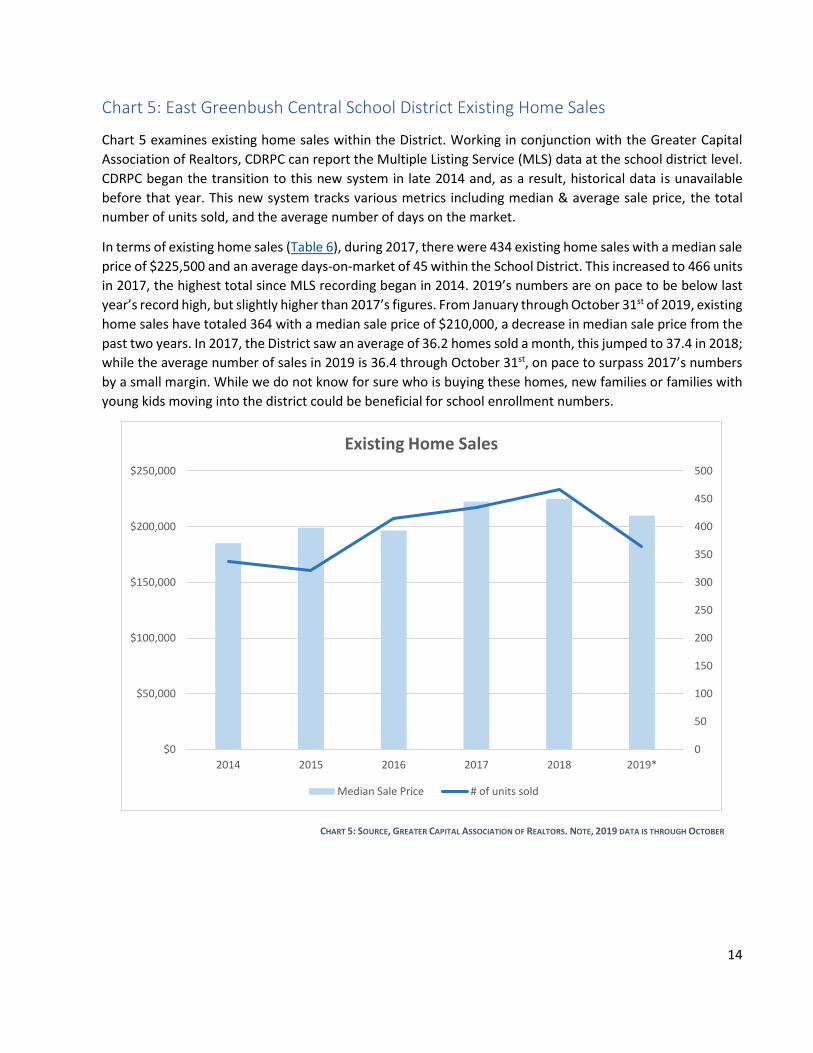
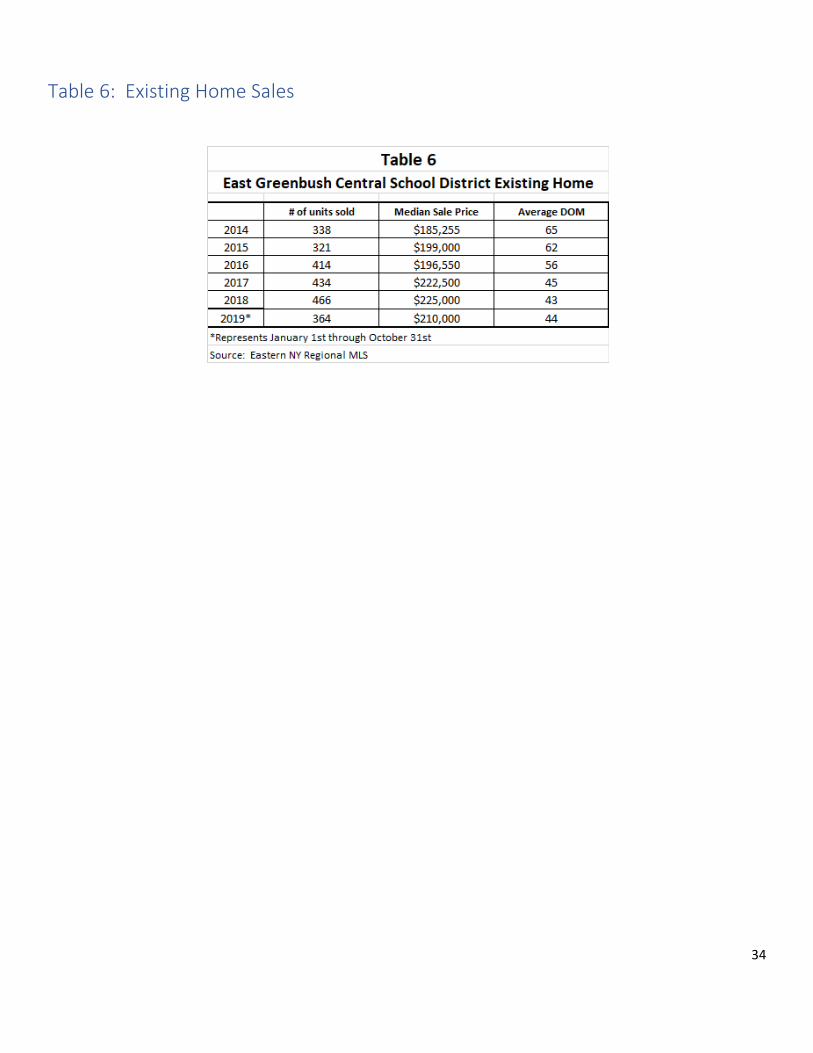
Chart 5: East Greenbush Central School District Existing Home Sales
Chart 5 examines existing home sales within the District. Working in conjunction with the Greater Capital
Association of Realtors, CDRPC can report the Multiple Listing Service (MLS) data at the school district level.
CDRPC began the transition to this new system in late 2014 and, as a result, historical data is unavailable
before that year. This new system tracks various metrics including median & average sale price, the total
number of units sold, and the average number of days on the market.
In terms of existing home sales (Table 6), during 2017, there were 434 existing home sales with a median sale
price of $225,500 and an average days-on-market of 45 within the School District. This increased to 466 units
in 2017, the highest total since MLS recording began in 2014. 2019’s numbers are on pace to be below last
year’s record high, but slightly higher than 2017’s figures. From January through October 31st of 2019, existing
home sales have totaled 364 with a median sale price of $210,000, a decrease in median sale price from the
past two years. In 2017, the District saw an average of 36.2 homes sold a month, this jumped to 37.4 in 2018;
while the average number of sales in 2019 is 36.4 through October 31st, on pace to surpass 2017’s numbers
by a small margin. While we do not know for sure who is buying these homes, new families or families with
young kids moving into the district could be beneficial for school enrollment numbers.
0
50
100
150
200
250
300
350
400
450
500
$0
$50,000
$100,000
$150,000
$200,000
$250,000
2014 2015 2016 2017 2018 2019*
Existing Home Sales
Median Sale Price # of units sold
CHART 5: SOURCE, GREATER CAPITAL ASSOCIATION OF REALTORS. NOTE, 2019 DATA IS THROUGH OCTOBER
15
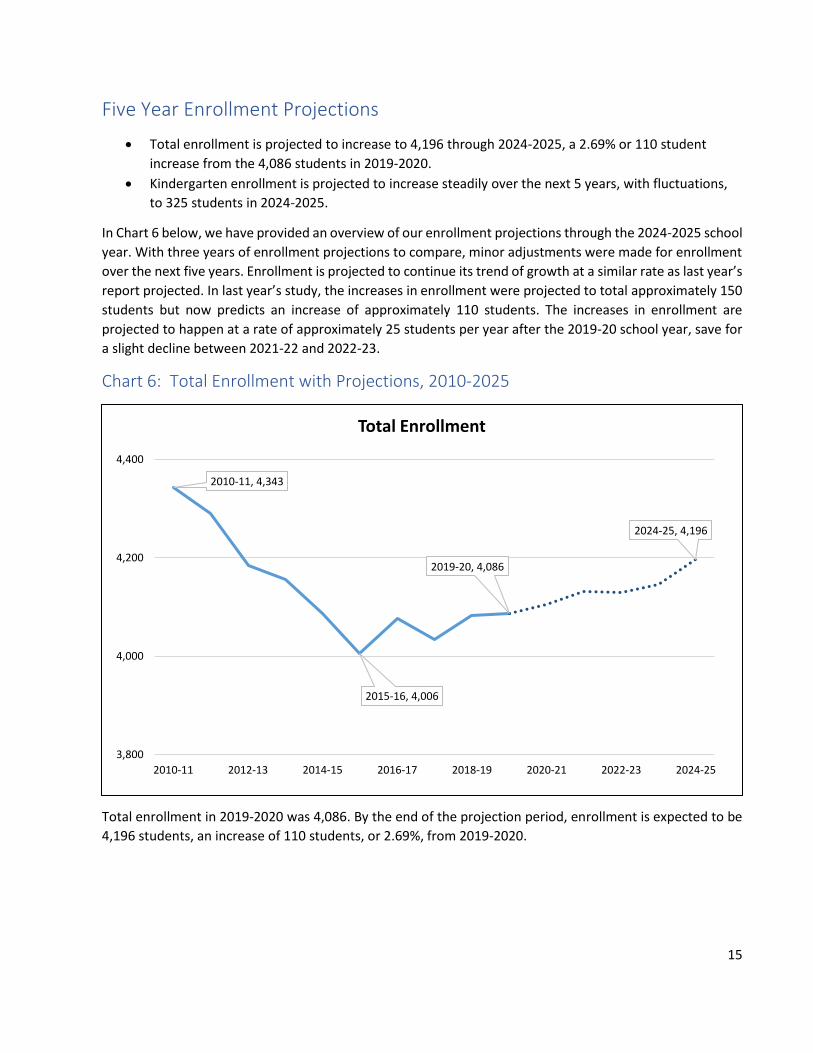
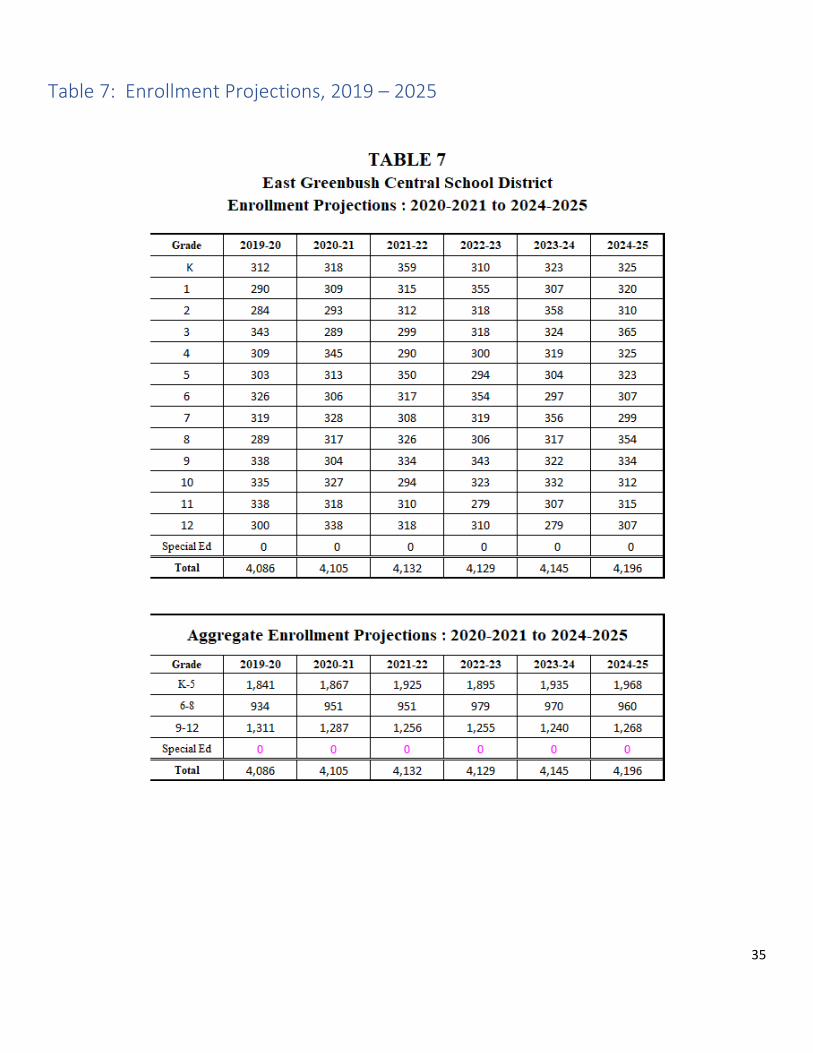
Five Year Enrollment Projections
• Total enrollment is projected to increase to 4,196 through 2024-2025, a 2.69% or 110 student
increase from the 4,086 students in 2019-2020.
• Kindergarten enrollment is projected to increase steadily over the next 5 years, with fluctuations,
to 325 students in 2024-2025.
In Chart 6 below, we have provided an overview of our enrollment projections through the 2024-2025 school
year. With three years of enrollment projections to compare, minor adjustments were made for enrollment
over the next five years. Enrollment is projected to continue its trend of growth at a similar rate as last year’s
report projected. In last year’s study, the increases in enrollment were projected to total approximately 150
students but now predicts an increase of approximately 110 students. The increases in enrollment are
projected to happen at a rate of approximately 25 students per year after the 2019-20 school year, save for
a slight decline between 2021-22 and 2022-23.
Chart 6: Total Enrollment with Projections, 2010-2025
Total enrollment in 2019-2020 was 4,086. By the end of the projection period, enrollment is expected to be
4,196 students, an increase of 110 students, or 2.69%, from 2019-2020.
2010-11, 4,343
2015-16, 4,006
2019-20, 4,086
2024-25, 4,196
3,800
4,000
4,200
4,400
2010-11 2012-13 2014-15 2016-17 2018-19 2020-21 2022-23 2024-25
Total Enrollment
16
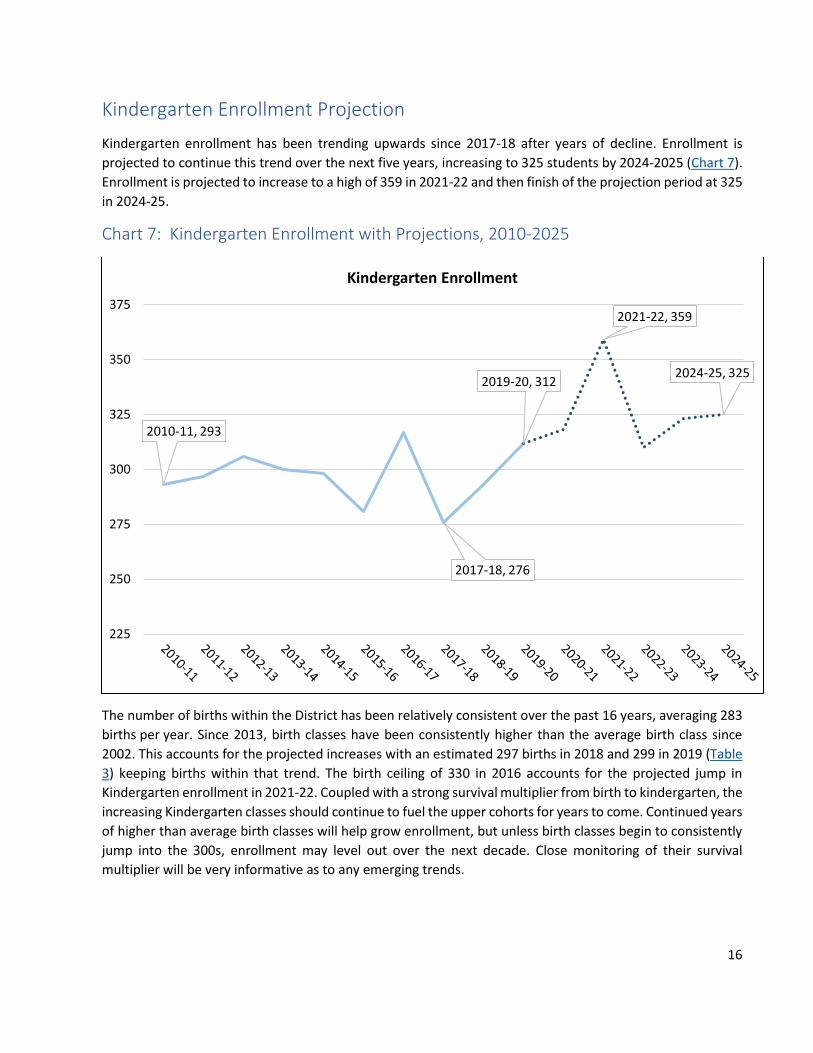
Kindergarten Enrollment Projection
Kindergarten enrollment has been trending upwards since 2017-18 after years of decline. Enrollment is
projected to continue this trend over the next five years, increasing to 325 students by 2024-2025 (Chart 7).
Enrollment is projected to increase to a high of 359 in 2021-22 and then finish of the projection period at 325
in 2024-25.
Chart 7: Kindergarten Enrollment with Projections, 2010-2025
The number of births within the District has been relatively consistent over the past 16 years, averaging 283
births per year. Since 2013, birth classes have been consistently higher than the average birth class since
2002. This accounts for the projected increases with an estimated 297 births in 2018 and 299 in 2019 (Table
3) keeping births within that trend. The birth ceiling of 330 in 2016 accounts for the projected jump in
Kindergarten enrollment in 2021-22. Coupled with a strong survival multiplier from birth to kindergarten, the
increasing Kindergarten classes should continue to fuel the upper cohorts for years to come. Continued years
of higher than average birth classes will help grow enrollment, but unless birth classes begin to consistently
jump into the 300s, enrollment may level out over the next decade. Close monitoring of their survival
multiplier will be very informative as to any emerging trends.
2010-11, 293
2017-18, 276
2019-20, 312
2021-22, 359
2024-25, 325
225
250
275
300
325
350
375
Kindergarten Enrollment
17
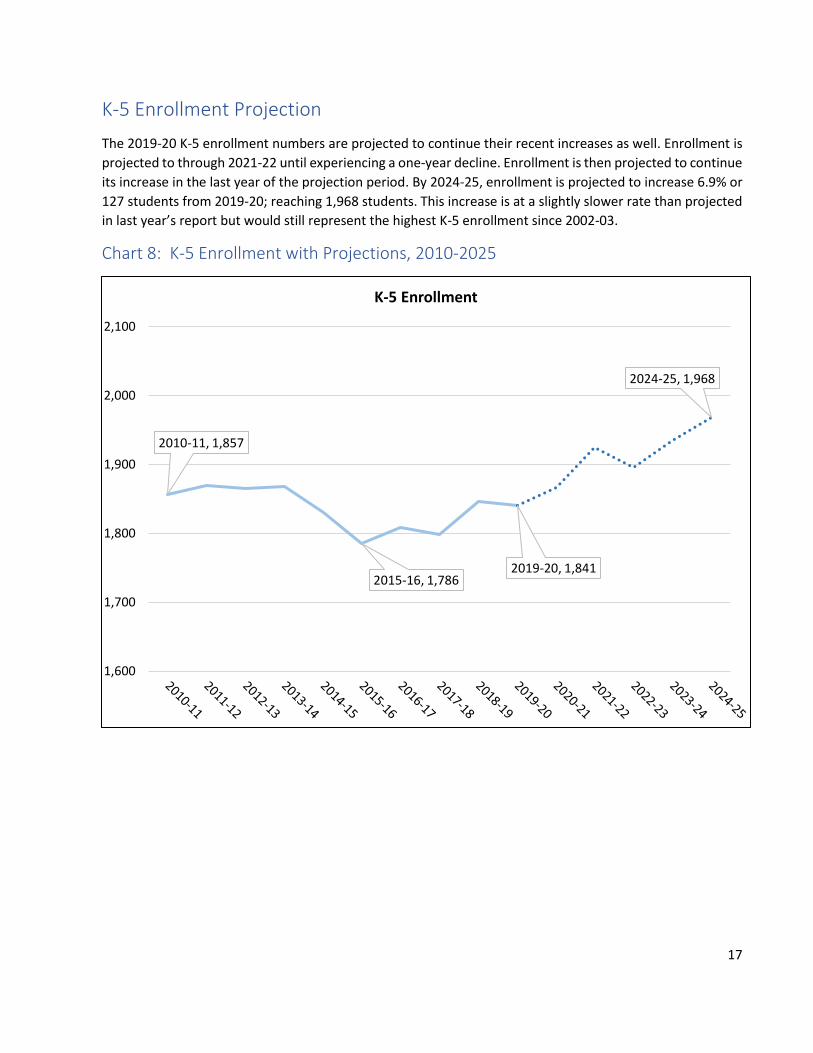
K-5 Enrollment Projection
The 2019-20 K-5 enrollment numbers are projected to continue their recent increases as well. Enrollment is
projected to through 2021-22 until experiencing a one-year decline. Enrollment is then projected to continue
its increase in the last year of the projection period. By 2024-25, enrollment is projected to increase 6.9% or
127 students from 2019-20; reaching 1,968 students. This increase is at a slightly slower rate than projected
in last year’s report but would still represent the highest K-5 enrollment since 2002-03.
Chart 8: K-5 Enrollment with Projections, 2010-2025
2010-11, 1,857
2015-16, 1,7862019-20, 1,841
2024-25, 1,968
1,600
1,700
1,800
1,900
2,000
2,100
K-5 Enrollment

18
6-8 Enrollment Projection
Enrollment in grades 6-8 is projected to continue its steady increase at a similar rate to last year’s projections.
After back to back years of the same enrollment in the first two years of the projection, enrollment Is
projected to increase in 2022-23 where it will reach 979 students and then decrease to 960 in the final year
of the projection. Overall, this would result in a 26 or 2.8% increase from 2019-20’s enrollment total.
Chart 9: 6-8 Enrollment with Projections, 2010-2025
2010-11, 986
2013-14, 912 2019-20, 934
2024-25, 960
700
800
900
1,000
1,100
1,200
6-8 Enrollment
19
9-12 Enrollment Projection
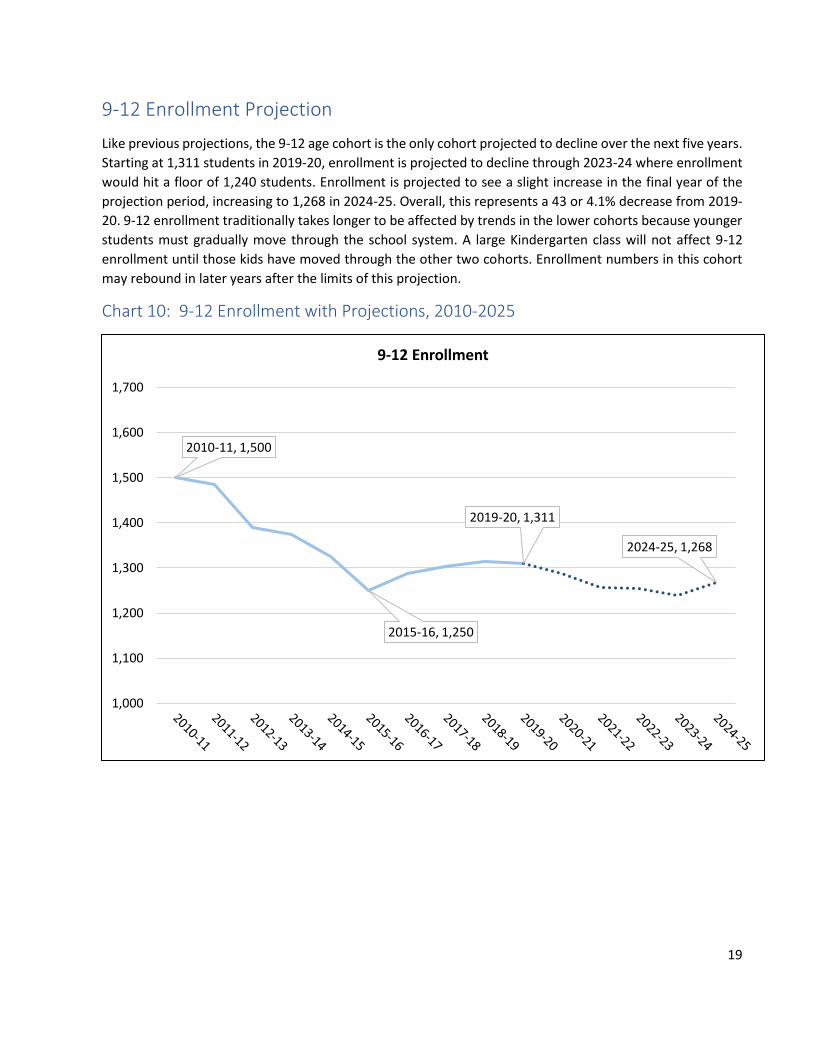
Like previous projections, the 9-12 age cohort is the only cohort projected to decline over the next five years.
Starting at 1,311 students in 2019-20, enrollment is projected to decline through 2023-24 where enrollment
would hit a floor of 1,240 students. Enrollment is projected to see a slight increase in the final year of the
projection period, increasing to 1,268 in 2024-25. Overall, this represents a 43 or 4.1% decrease from 2019-
20. 9-12 enrollment traditionally takes longer to be affected by trends in the lower cohorts because younger
students must gradually move through the school system. A large Kindergarten class will not affect 9-12
enrollment until those kids have moved through the other two cohorts. Enrollment numbers in this cohort
may rebound in later years after the limits of this projection.
Chart 10: 9-12 Enrollment with Projections, 2010-2025
2010-11, 1,500
2015-16, 1,250
2019-20, 1,311
2024-25, 1,268
1,000
1,100
1,200
1,300
1,400
1,500
1,600
1,700
9-12 Enrollment
20
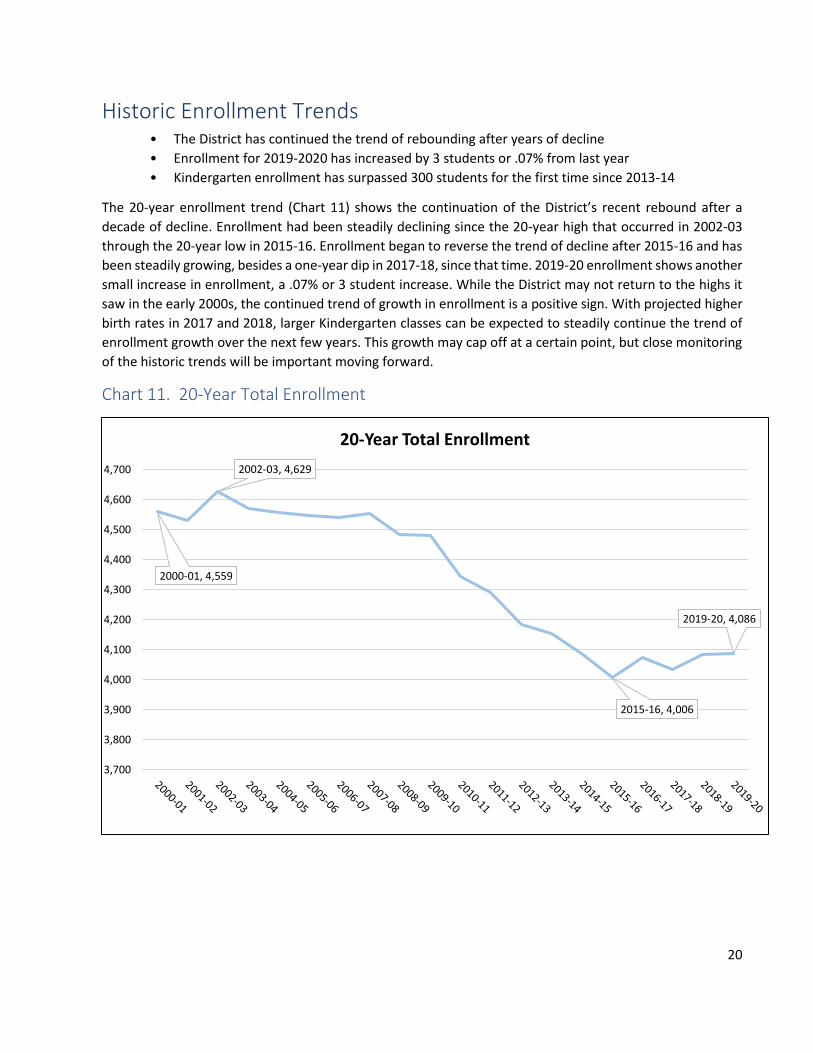
Historic Enrollment Trends • The District has continued the trend of rebounding after years of decline
• Enrollment for 2019-2020 has increased by 3 students or .07% from last year
• Kindergarten enrollment has surpassed 300 students for the first time since 2013-14
The 20-year enrollment trend (Chart 11) shows the continuation of the District’s recent rebound after a
decade of decline. Enrollment had been steadily declining since the 20-year high that occurred in 2002-03
through the 20-year low in 2015-16. Enrollment began to reverse the trend of decline after 2015-16 and has
been steadily growing, besides a one-year dip in 2017-18, since that time. 2019-20 enrollment shows another
small increase in enrollment, a .07% or 3 student increase. While the District may not return to the highs it
saw in the early 2000s, the continued trend of growth in enrollment is a positive sign. With projected higher
birth rates in 2017 and 2018, larger Kindergarten classes can be expected to steadily continue the trend of
enrollment growth over the next few years. This growth may cap off at a certain point, but close monitoring
of the historic trends will be important moving forward.
Chart 11. 20-Year Total Enrollment
2000-01, 4,559
2002-03, 4,629
2015-16, 4,006
2019-20, 4,086
3,700
3,800
3,900
4,000
4,100
4,200
4,300
4,400
4,500
4,600
4,700
20-Year Total Enrollment
21
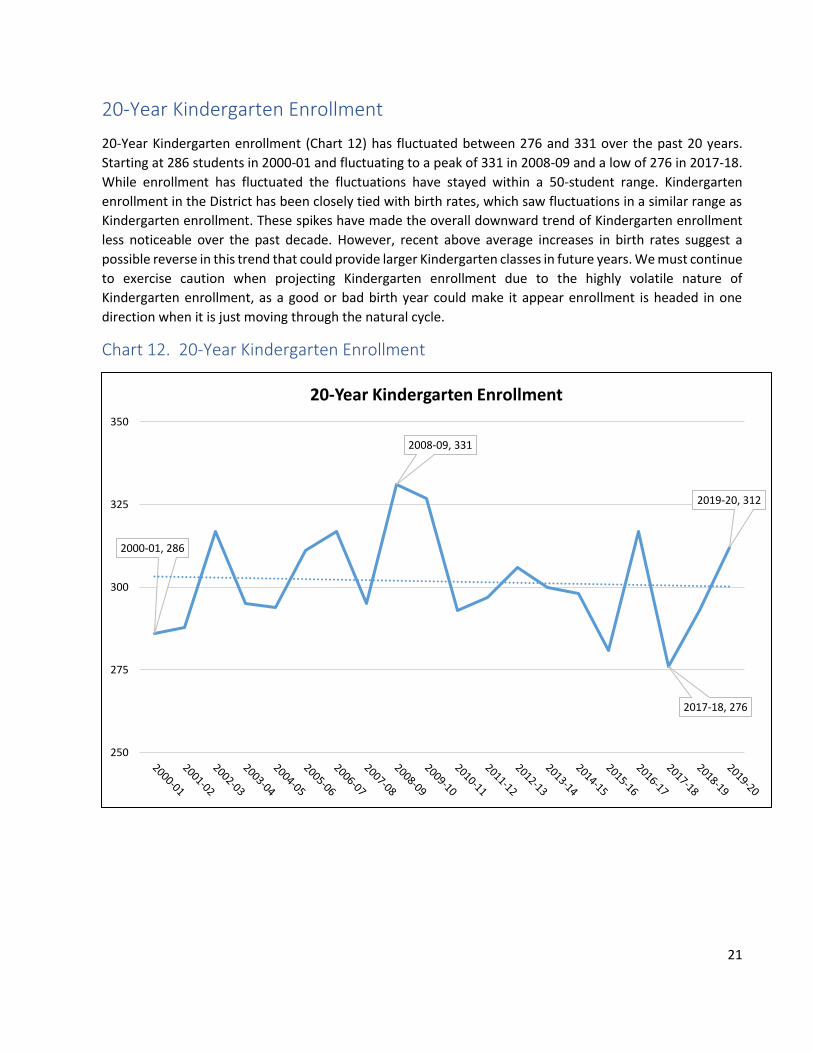
20-Year Kindergarten Enrollment
20-Year Kindergarten enrollment (Chart 12) has fluctuated between 276 and 331 over the past 20 years.
Starting at 286 students in 2000-01 and fluctuating to a peak of 331 in 2008-09 and a low of 276 in 2017-18.
While enrollment has fluctuated the fluctuations have stayed within a 50-student range. Kindergarten
enrollment in the District has been closely tied with birth rates, which saw fluctuations in a similar range as
Kindergarten enrollment. These spikes have made the overall downward trend of Kindergarten enrollment
less noticeable over the past decade. However, recent above average increases in birth rates suggest a
possible reverse in this trend that could provide larger Kindergarten classes in future years. We must continue
to exercise caution when projecting Kindergarten enrollment due to the highly volatile nature of
Kindergarten enrollment, as a good or bad birth year could make it appear enrollment is headed in one
direction when it is just moving through the natural cycle.
Chart 12. 20-Year Kindergarten Enrollment
2000-01, 286
2008-09, 331
2017-18, 276
2019-20, 312
250
275
300
325
350
20-Year Kindergarten Enrollment

22
20-Year K-5 Enrollment
Enrollment by grade cohort (Table 2) illustrates how enrollment trends by the three cohorts influence trends
in the District’s total enrollment. Since 2000, enrollment in the K-5 cohort has fluctuated but ultimately
decreased. Enrollment began with 2,021 students in the cohort but consistently declined until it reached a
20-year floor in 2015-16 of 1,786. This represents an 11.6% decline over a fifteen-year period. Total
enrollment mirrored K-5 enrollment, as they both declined at similar rates over that same period. Starting at
4,559 students in 2000, 2015-16 enrollment had dropped 12.1% to 4,006 students. K-5 enrollment has a
cascading effect in overall total enrollment, as the lower cohort is generally the main factor that feeds into
enrollment in the upper cohorts. Since the 20-year low, K-5 has continued a reversal of these trends and has
seen growth to 1,841 students in 2019-20, a 3.1% increase. Overall, K-5 enrollment is down 8.9% from the
20-year high 2000-01 enrollment.
Chart 13. 20-Year K-5 Enrollment
2000-01, 2,021
2015-16, 1,7862019-20, 1,841
3,600
3,700
3,800
3,900
4,000
4,100
4,200
4,300
4,400
4,500
4,600
4,700
1,700
1,800
1,900
2,000
2,100
20-Year K-5 Enrollment
K-5
Total Enrollment
23
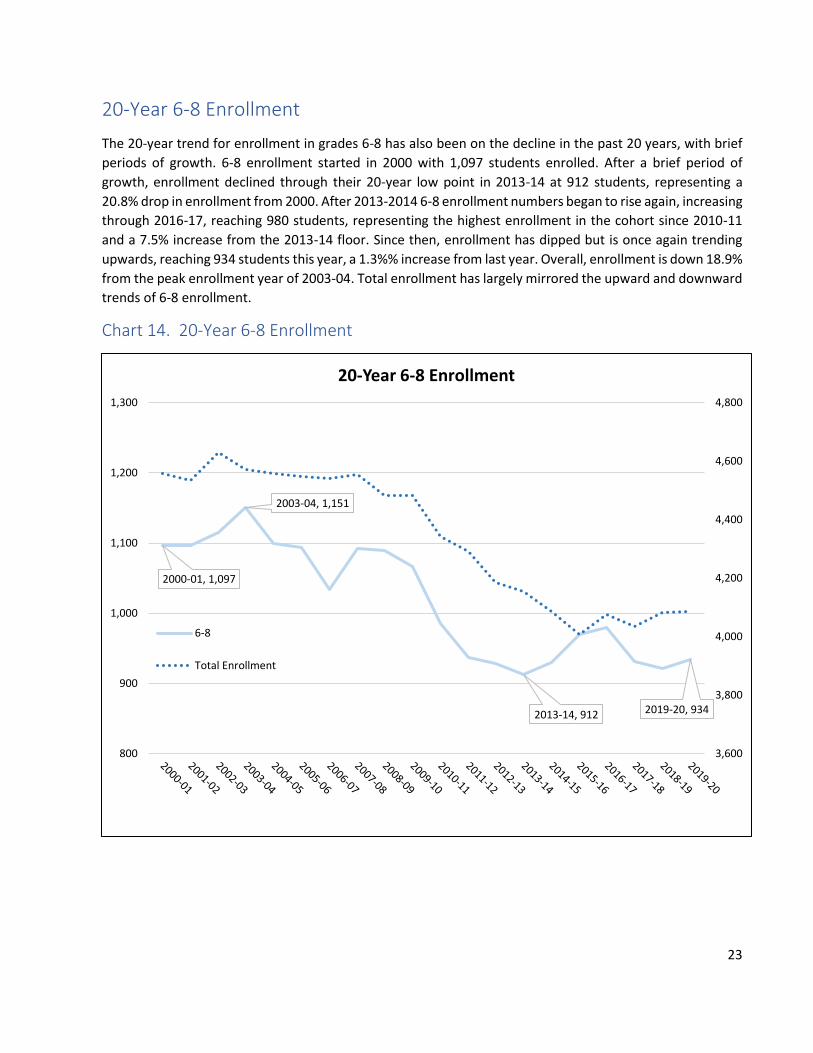
20-Year 6-8 Enrollment
The 20-year trend for enrollment in grades 6-8 has also been on the decline in the past 20 years, with brief
periods of growth. 6-8 enrollment started in 2000 with 1,097 students enrolled. After a brief period of
growth, enrollment declined through their 20-year low point in 2013-14 at 912 students, representing a
20.8% drop in enrollment from 2000. After 2013-2014 6-8 enrollment numbers began to rise again, increasing
through 2016-17, reaching 980 students, representing the highest enrollment in the cohort since 2010-11
and a 7.5% increase from the 2013-14 floor. Since then, enrollment has dipped but is once again trending
upwards, reaching 934 students this year, a 1.3%% increase from last year. Overall, enrollment is down 18.9%
from the peak enrollment year of 2003-04. Total enrollment has largely mirrored the upward and downward
trends of 6-8 enrollment.
Chart 14. 20-Year 6-8 Enrollment
2000-01, 1,097
2003-04, 1,151
2013-14, 912 2019-20, 934
3,600
3,800
4,000
4,200
4,400
4,600
4,800
800
900
1,000
1,100
1,200
1,300
20-Year 6-8 Enrollment
6-8
Total Enrollment
24
20-Year 9-12 Enrollment
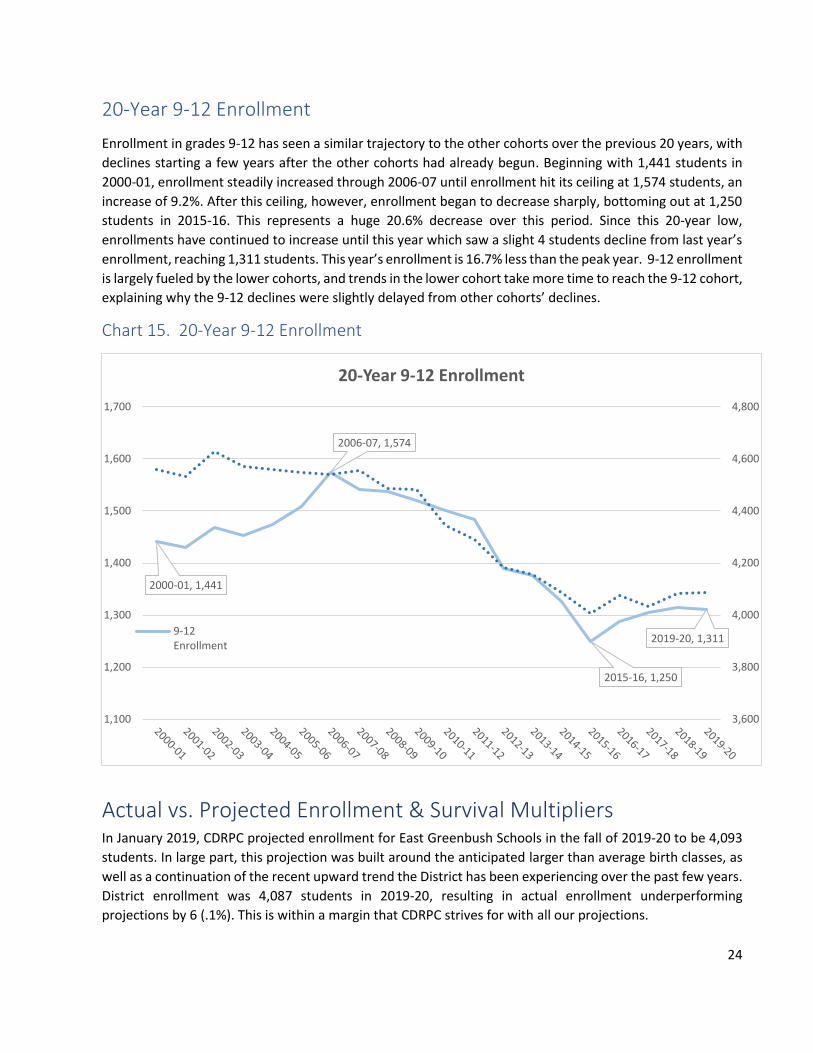
Enrollment in grades 9-12 has seen a similar trajectory to the other cohorts over the previous 20 years, with
declines starting a few years after the other cohorts had already begun. Beginning with 1,441 students in
2000-01, enrollment steadily increased through 2006-07 until enrollment hit its ceiling at 1,574 students, an
increase of 9.2%. After this ceiling, however, enrollment began to decrease sharply, bottoming out at 1,250
students in 2015-16. This represents a huge 20.6% decrease over this period. Since this 20-year low,
enrollments have continued to increase until this year which saw a slight 4 students decline from last year’s
enrollment, reaching 1,311 students. This year’s enrollment is 16.7% less than the peak year. 9-12 enrollment
is largely fueled by the lower cohorts, and trends in the lower cohort take more time to reach the 9-12 cohort,
explaining why the 9-12 declines were slightly delayed from other cohorts’ declines.
Chart 15. 20-Year 9-12 Enrollment
Actual vs. Projected Enrollment & Survival Multipliers In January 2019, CDRPC projected enrollment for East Greenbush Schools in the fall of 2019-20 to be 4,093
students. In large part, this projection was built around the anticipated larger than average birth classes, as
well as a continuation of the recent upward trend the District has been experiencing over the past few years.
District enrollment was 4,087 students in 2019-20, resulting in actual enrollment underperforming
projections by 6 (.1%). This is within a margin that CDRPC strives for with all our projections.
2000-01, 1,441
2006-07, 1,574
2015-16, 1,250
2019-20, 1,311
3,600
3,800
4,000
4,200
4,400
4,600
4,800
1,100
1,200
1,300
1,400
1,500
1,600
1,700
20-Year 9-12 Enrollment
9-12Enrollment
25
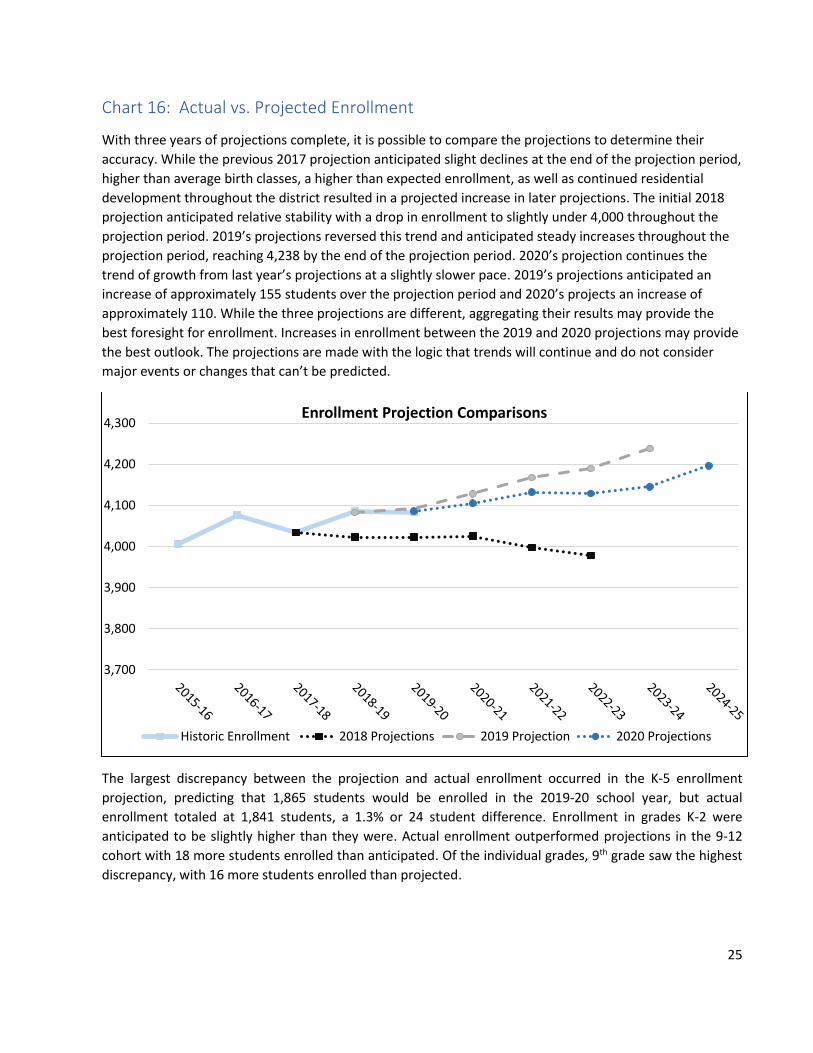
Chart 16: Actual vs. Projected Enrollment
With three years of projections complete, it is possible to compare the projections to determine their
accuracy. While the previous 2017 projection anticipated slight declines at the end of the projection period,
higher than average birth classes, a higher than expected enrollment, as well as continued residential
development throughout the district resulted in a projected increase in later projections. The initial 2018
projection anticipated relative stability with a drop in enrollment to slightly under 4,000 throughout the
projection period. 2019’s projections reversed this trend and anticipated steady increases throughout the
projection period, reaching 4,238 by the end of the projection period. 2020’s projection continues the
trend of growth from last year’s projections at a slightly slower pace. 2019’s projections anticipated an
increase of approximately 155 students over the projection period and 2020’s projects an increase of
approximately 110. While the three projections are different, aggregating their results may provide the
best foresight for enrollment. Increases in enrollment between the 2019 and 2020 projections may provide
the best outlook. The projections are made with the logic that trends will continue and do not consider
major events or changes that can’t be predicted.
The largest discrepancy between the projection and actual enrollment occurred in the K-5 enrollment
projection, predicting that 1,865 students would be enrolled in the 2019-20 school year, but actual
enrollment totaled at 1,841 students, a 1.3% or 24 student difference. Enrollment in grades K-2 were
anticipated to be slightly higher than they were. Actual enrollment outperformed projections in the 9-12
cohort with 18 more students enrolled than anticipated. Of the individual grades, 9th grade saw the highest
discrepancy, with 16 more students enrolled than projected.
3,700
3,800
3,900
4,000
4,100
4,200
4,300Enrollment Projection Comparisons
Historic Enrollment 2018 Projections 2019 Projection 2020 Projections
26
Generational Enrollment Patterns To better understand the long-term trends in enrollment, CDRPC examines all available data related to total enrollment, including data beyond the aforementioned 20-year window. As more historical data is collected, long-term patterns and trends may be discerned that would otherwise be hidden by the confines of the 20-year window. While the 20-year view of enrollment allows for a detailed understanding of the trends within a generation of students, the generational enrollment data will allow for an analysis of the District’s enrollment trends between generations.
To understand the changing patterns of generation enrollment, it is useful to both define the generations of students that have matriculated through the District and discuss the societal structures that influence family creation.
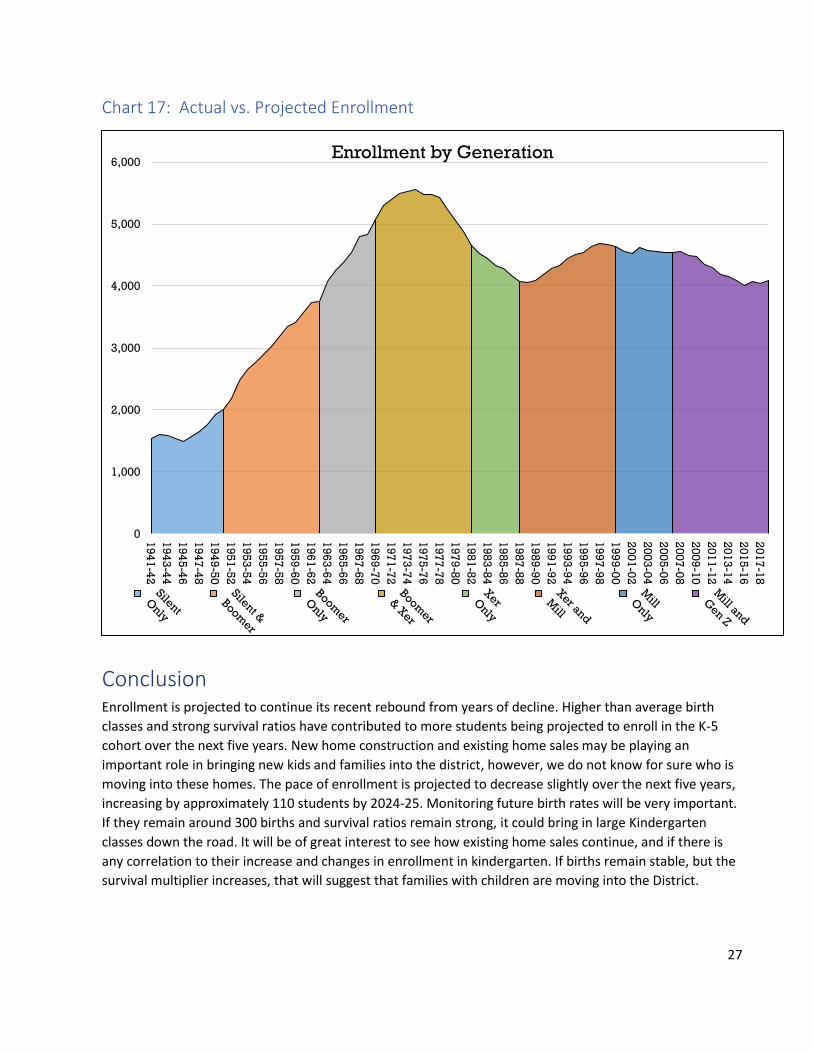
With 78 years of enrollment data available, we can see how the influence of various generations of students has impacted enrollment. This is perhaps the most important element that the generational enrollment history can provide; the ability to plot an entire enrollment cycle- a cycle that will stretch across decades and be influenced by multiple generations of students.
Since the 1941-42 school year, parts of five generations of children have gone through or are still students in the District. Generations are typically thought to span 20 years, but there is no single definition for how long a generation can last. Furthermore, outside of the Baby Boomers, clearly defined start and end dates for generations are disputed. The definitions below attempt to identify each generation with estimated parameters. Since only the Baby Boomers are clearly defined, all other generations are defined based upon the Boomers’ parameters, fixed in 1964.
The Silent Generation: Roughly those born between 1926 and 1945, only the tail end of this generation is captured in the historical enrollment data. This generation is marked by low birth rates due to pressure from the Great Depression and World War II. It is sometimes referred to as the “Forgotten Generation”, wedged between the “Greatest Generation”, and the Baby Boom- generations that are better remembered.
The Baby Boomers: The children born during the Post-War boom, these children are popularly grouped together as born between 1946 and 1964. This generation is well known for the explosion in births that occurred after the war.
Generation X: This generation of children is roughly described as being born between 1965 and 1982. Gen Xer’s are sometimes associated with the “Baby Bust” due to the sharp decline in the high number of births that had defined the Boomers.
Millennials: Born roughly between 1983 and 2001, this generation is largely responsible for the enrollment increases of the late 1980s and 1990s. They are sometimes thought of as an “echo” of the Baby Boomers.
Generation Z: These children, born since 2002, have only recently begun to influence enrollment statistics. Due to their timing with severe economic contractions and foreign wars, these children are sometimes compared to the Silent Generation in that they appear to be significantly smaller than previous generations.
27
Chart 17: Actual vs. Projected Enrollment
Conclusion Enrollment is projected to continue its recent rebound from years of decline. Higher than average birth
classes and strong survival ratios have contributed to more students being projected to enroll in the K-5
cohort over the next five years. New home construction and existing home sales may be playing an
important role in bringing new kids and families into the district, however, we do not know for sure who is
moving into these homes. The pace of enrollment is projected to decrease slightly over the next five years,
increasing by approximately 110 students by 2024-25. Monitoring future birth rates will be very important.
If they remain around 300 births and survival ratios remain strong, it could bring in large Kindergarten
classes down the road. It will be of great interest to see how existing home sales continue, and if there is
any correlation to their increase and changes in enrollment in kindergarten. If births remain stable, but the
survival multiplier increases, that will suggest that families with children are moving into the District.
0
1,000
2,000
3,000
4,000
5,000
6,000
19
41
-42
19
43
-44
19
45
-46
19
47
-48
19
49
-50
19
51
-52
19
53
-54
19
55
-56
19
57
-58
19
59
-60
19
61
-62
19
63
-64
19
65
-66
19
67
-68
19
69
-70
19
71
-72
19
73
-74
19
75
-76
19
77
-78
19
79
-80
19
81
-82
19
83
-84
19
85
-86
19
87
-88
19
89
-90
19
91
-92
19
93
-94
19
95
-96
19
97
-98
19
99
-00
20
01
-02
20
03
-04
20
05
-06
20
07
-08
20
09
-10
20
11
-12
20
13
-14
20
15
-16
20
17
-18
Enrollment by Generation
28
Appendix A: Status of Single Family Subdivisions
Appendix B: Status of Multi Family Subdivisions
29
Appendix: Data Tables
Table 1: Historic School Enrollment, 2000 – 2020
30
Table 2: Aggregate School Enrollment, 2000 – 2020
31
Table 3: School District Births
Table 4: Number of Housing Units
32
Table 5: Building Permits

33
Year Single Unit 2 Unit 3 or 4 Unit 5 or more Total
1996 22 — — 104 126
1997 30 — — — 30
1998 42 2 — — 44
1999 56 — 16 — 72
2000 55 — — — 55
2001 65 — — — 65
2002 59 — — — 59
2003 27 — — — 27
2004 41 — — 25 66
2005 0 — — — 0
2006 0 — — — 0
2007 0 — — — 0
2008 30 — 8 — 38
2009 15 6 4 — 25
2010 15 6 4 — 25
2011 11 8 6 — 25
2012 12 6 4 — 22
2013 12 4 3 — 19
2014 26 16 9 — 51
2015 12 6 6 — 24
2016 35 — — 8 43
2017 31 2 — 10 43
2018 30 4 — 5 39
Town of North Greenbush
Source US Census
34
Table 6: Existing Home Sales
35
Table 7: Enrollment Projections, 2019 – 2025