2019 Energy Storage Technology Assessment Platte River Power Authority June 19, 2019 Principal Investigators Mathew Roling Joseph M Klobucar, PE Lukas Rowland, PE Carl Mannheim Cristina Piekarz
Tables Table 1. PHES Cost Data ........................................................................................................................... 19
Table 2. Li-ion BESS Cost Data .................................................................................................................. 21
Table 3. Vanadium Redox Flow BESS Costs Data .................................................................................... 23
Table 4. Energy Storage Systems Lifecycle Cost Comparison .................................................................. 25
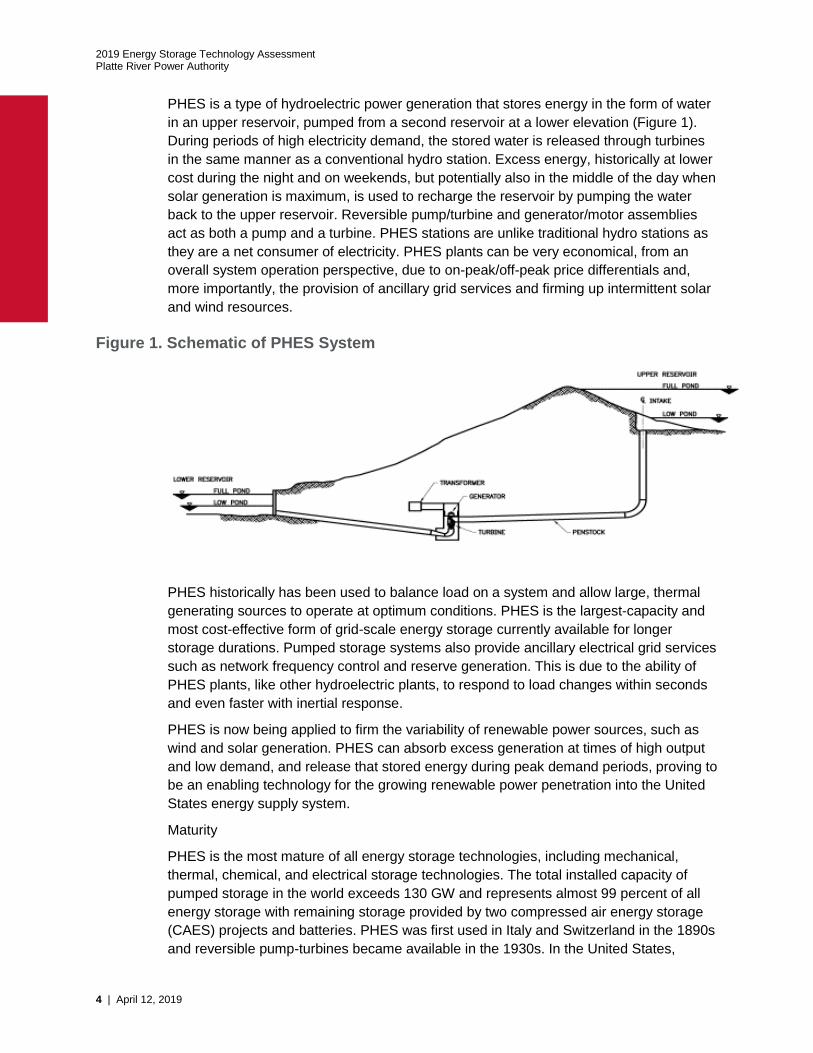
Figures Figure 1. Schematic of PHES System .......................................................................................................... 4
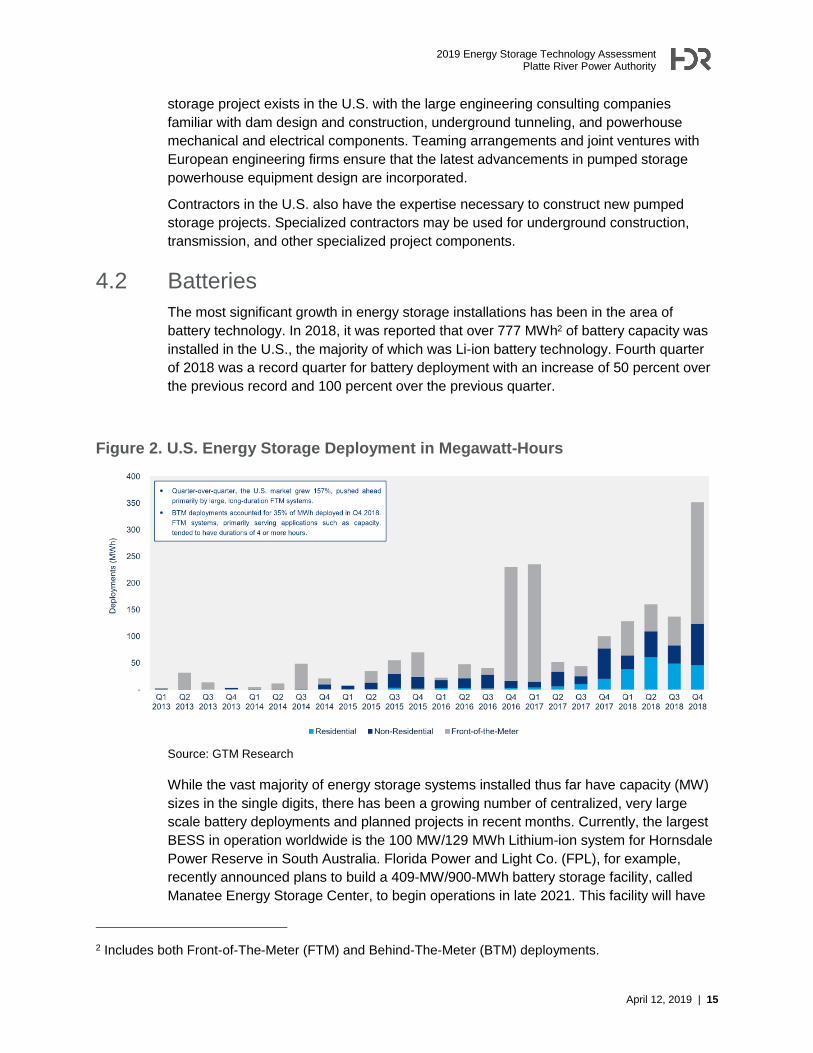
Figure 2. U.S. Energy Storage Deployment in Megawatt-Hours ................................................................ 15
Figure 3. Cost Projections for 4-hour Battery Energy Storage Systems .................................................... 17
Figure 4. Capacity Value of Storage as a Function of Stored Energy ........................................................ 28
2019 Energy Storage Technology Assessment
Platte River Power Authority
April 12, 2019 | 1
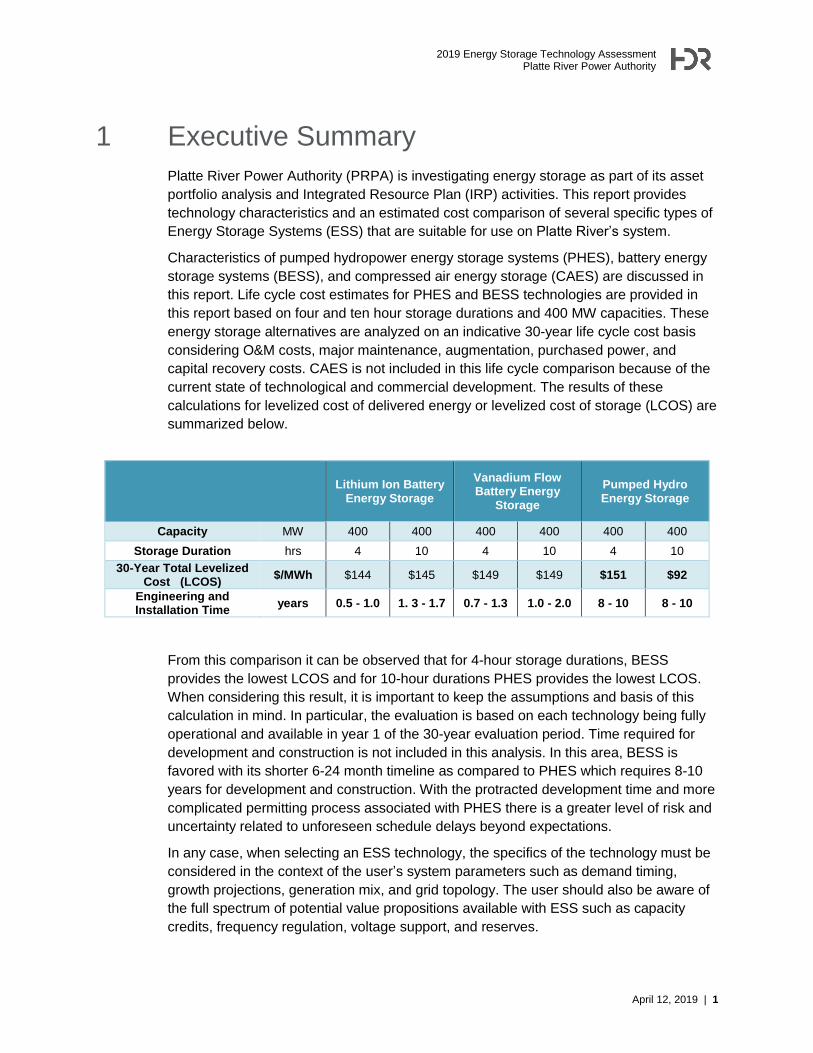
1 Executive Summary
Platte River Power Authority (PRPA) is investigating energy storage as part of its asset
portfolio analysis and Integrated Resource Plan (IRP) activities. This report provides
technology characteristics and an estimated cost comparison of several specific types of
Energy Storage Systems (ESS) that are suitable for use on Platte River’s system.
Characteristics of pumped hydropower energy storage systems (PHES), battery energy
storage systems (BESS), and compressed air energy storage (CAES) are discussed in
this report. Life cycle cost estimates for PHES and BESS technologies are provided in
this report based on four and ten hour storage durations and 400 MW capacities. These
energy storage alternatives are analyzed on an indicative 30-year life cycle cost basis
considering O&M costs, major maintenance, augmentation, purchased power, and
capital recovery costs. CAES is not included in this life cycle comparison because of the
current state of technological and commercial development. The results of these
calculations for levelized cost of delivered energy or levelized cost of storage (LCOS) are
Energy Storage Project in Washington, 400 MW Swan Lake North Pumped Storage
Project in Oregon, and 1,300 MW Eagle Mountain Pumped Storage Project in Southern
California.
In Europe, several new pumped storage projects have recently been brought on line,
including the 1,000 MW Limmern Pumped Storage Project completed in 2017 and the
900 MW Nant de Drance Pumped Storage Project in Switzerland in 2018.
Variable speed reversible turbine technology has been the typical equipment selected for
the new installations in Europe where greater operational flexibility is required by the
grid. Similarly, these types of pump-turbines have also been the focus for the projects
under study in the U.S., primarily because of the increased operating flexibility, increased
operating range and efficiency, and ancillary services that they can provide for a market
that is becoming more penetrated by intermittent generation sources like solar and wind.
In the U.S., several of the projects under study and in FERC licensing proceedings are
closed-loop facilities, meaning they have no continuous connection with an existing
waterway. They, therefore, require construction of two new reservoirs by excavation or
damming of suitable valleys as well as identification of a water source for filling up the
reservoirs to prepare for commercial operation and to offset any water losses due to
evaporation, infiltration, and leakage during operation. However, the environmental
issues can be fewer with closed-loop projects, consequently resulting in fewer required
environmental studies and lower overall impact to those resources.
A pumped-storage project is little more than a typical hydroelectric power plant with
associated water retaining structures, powerhouse, and water conveyances, but with
more complicated rotating generating equipment. The expertise to engineer a pumped
2019 Energy Storage Technology Assessment
Platte River Power Authority
April 12, 2019 | 15
storage project exists in the U.S. with the large engineering consulting companies
familiar with dam design and construction, underground tunneling, and powerhouse
mechanical and electrical components. Teaming arrangements and joint ventures with
European engineering firms ensure that the latest advancements in pumped storage
powerhouse equipment design are incorporated.
Contractors in the U.S. also have the expertise necessary to construct new pumped
storage projects. Specialized contractors may be used for underground construction,
transmission, and other specialized project components.
4.2 Batteries
The most significant growth in energy storage installations has been in the area of
battery technology. In 2018, it was reported that over 777 MWh2 of battery capacity was
installed in the U.S., the majority of which was Li-ion battery technology. Fourth quarter
of 2018 was a record quarter for battery deployment with an increase of 50 percent over
the previous record and 100 percent over the previous quarter.
Figure 2. U.S. Energy Storage Deployment in Megawatt-Hours
Source: GTM Research
While the vast majority of energy storage systems installed thus far have capacity (MW)
sizes in the single digits, there has been a growing number of centralized, very large
scale battery deployments and planned projects in recent months. Currently, the largest
BESS in operation worldwide is the 100 MW/129 MWh Lithium-ion system for Hornsdale
Power Reserve in South Australia. Florida Power and Light Co. (FPL), for example,
recently announced plans to build a 409-MW/900-MWh battery storage facility, called
Manatee Energy Storage Center, to begin operations in late 2021. This facility will have
2 Includes both Front-of-The-Meter (FTM) and Behind-The-Meter (BTM) deployments.
2019 Energy Storage Technology Assessment Platte River Power Authority
16 | April 12, 2019
roughly four times the storage capacity of the world’s current largest operational battery
system in South Australia.
To meet these goals using batteries, land use constraints, the electrical characteristics of
PRPA’s existing grid infrastructure, and other economic factors would need to be
considered. These factors would likely favor deployment of a distributed fleet of BESS
projects rather than a large centralized unit. Distributed storage assets could provide
multiple services to multiple areas of the grid simultaneously, could use a range of
technologies tailored to specific use-cases, and could provide greater redundancy than
highly centralized storage assets.
5 Pricing Trends
5.1 Pumped Hydro
In general, cost trends for pumped storage projects tend to follow the general
construction cost trends of any large infrastructure project. Pricing for pumped storage is
very site specific and strongly dependent on available head and length of any water
conveyances. The pump-turbine and related electrical and mechanical balance of plant
equipment supply and installation typically represents approximately 25 percent of the
total cost of the project for a green field site with no existing infrastructure. If one existing
reservoir can be utilized, the cost share of the equipment supply and install can be
approximately 30 percent, and if two existing reservoirs are used, then that share may be
even higher. Recent equipment budget estimates indicate that variable speed equipment
supply and installation costs can vary from approximately $400/kW to $600/kW,
depending on size of units, number of units, and the head. Costs for single speed pump-
turbine equipment would be less. As the technology is very mature, any future cost
variation will likely be more a function of availability of suppliers, cost of steel, and
general market conditions than any advancement or innovation in the technology.
Overall project construction costs are also highly dependent on the project location and
availability of the skilled labor needed to construct a pumped storage project. These are
large infrastructure projects that require a significant workforce that typically stay in either
a nearby town, or, if project is remote, in a camp on site. Regional labor market
conditions will affect the construction costs as these projects can employ up to 1000
workers or more. Competition from other large concurrent infrastructure projects in the
region will affect the number of qualified bidders, which would also affect the cost.
5.2 Batteries
The costs for battery storage technologies are expected to continue to fall as maturity is
gained and the economies of growing market orders are secured. The cost of Li-ion
batteries have dropped nearly 90 percent from their commercialization in 1991 and have
been trending down at an annual rate of approximately 14 percent over the past 5 years.
Most indications show that the downward trend will continue as suppliers continue to
improve manufacturing processes and production capacity. In 2018, increasing demand
for mineral resources, especially cobalt, slowed the decline in NMC battery prices and
2019 Energy Storage Technology Assessment
Platte River Power Authority
April 12, 2019 | 17
increased lead times. This has redirected some attention to LFP technology, a trend
which is expected to continue. Less established technologies such as flow batteries will
likely see a substantial decline in installed cost if they are able to reach the level of
widespread commercialization that Li-ion batteries are now experiencing. Many flow
technologies also offer the advantage of a very long cycle life as compared to current Li-
ion cell technology. This means they do not require the same periodic augmentation (and
the associated costs) that Li-ion batteries do to maintain energy capacity.
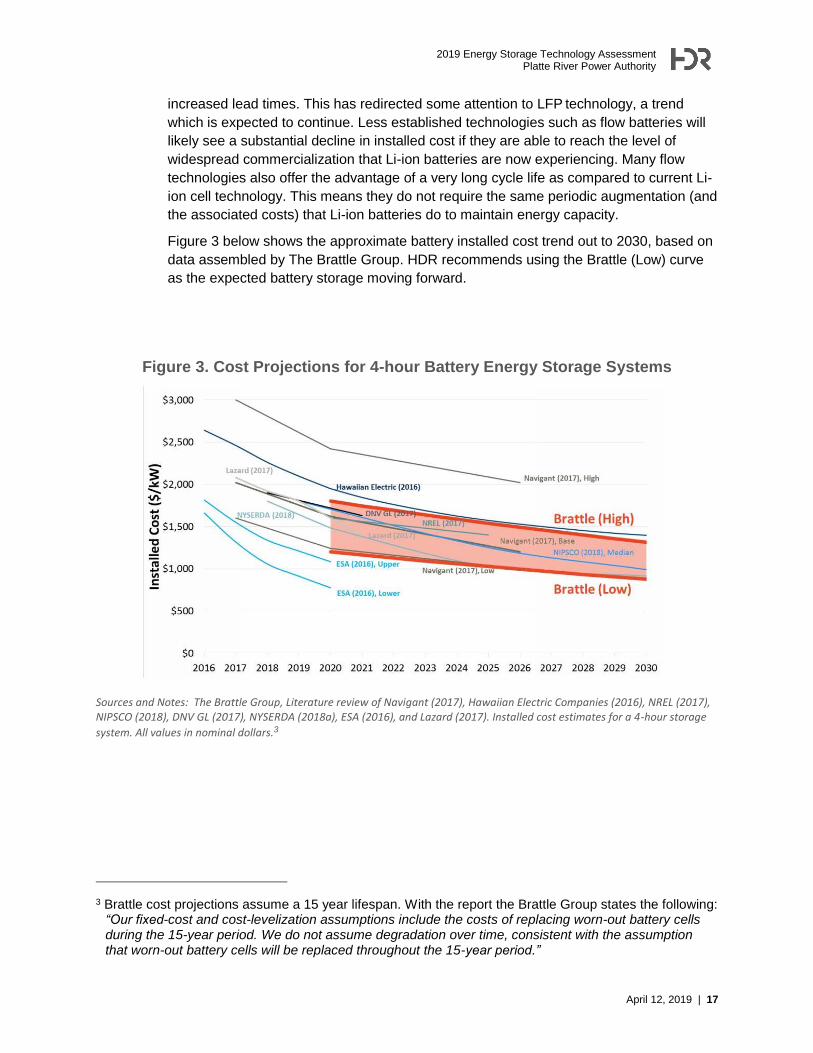
Figure 3 below shows the approximate battery installed cost trend out to 2030, based on
data assembled by The Brattle Group. HDR recommends using the Brattle (Low) curve
as the expected battery storage moving forward.
Figure 3. Cost Projections for 4-hour Battery Energy Storage Systems
Sources and Notes: The Brattle Group, Literature review of Navigant (2017), Hawaiian Electric Companies (2016), NREL (2017), NIPSCO (2018), DNV GL (2017), NYSERDA (2018a), ESA (2016), and Lazard (2017). Installed cost estimates for a 4-hour storage
system. All values in nominal dollars.3
3 Brattle cost projections assume a 15 year lifespan. With the report the Brattle Group states the following: “Our fixed-cost and cost-levelization assumptions include the costs of replacing worn-out battery cells during the 15-year period. We do not assume degradation over time, consistent with the assumption that worn-out battery cells will be replaced throughout the 15-year period.”
2019 Energy Storage Technology Assessment Platte River Power Authority
18 | April 12, 2019
6 Cost Comparison
6.1 Pumped Hydro
Construction costs for pumped storage were estimated in Oct 2018 dollars using actual
construction cost data published by EPRI4 for fourteen historical pumped storage
projects constructed in the United States between the years 1962 and 1982. The original
construction costs were first escalated to Oct 2018 dollars using U.S. Bureau of
Reclamation construction and labor cost indexes and then calibrated to the estimated
construction costs for five recent feasibility level studies of pumped storage projects with
capacities ranging from 400 to 1200 MW and with energy storage ranging from 10 to 12
hours. The 2018 costs were escalated to 2019 dollars using a 3 percent escalation rate
for the cost comparison analysis.
The historical cost data included the separated costs attributable to capacity (MW) and to
energy storage (MWh). Therefore, the analysis and escalation of the historic data to
2019 dollars provided these cost components, which facilitated the cost estimation of the
generic pumped storage projects of interest. Recent supplier quotes for variable speed
pump-turbines and associated electrical equipment and costs from recent European
experience for balance of plant equipment were used to ensure that the pump-turbine
costs and balance of plant electric and mechanical equipment costs were accurately
captured. Note that the costs estimated and presented below do not include
transmission, land acquisition, or cost of capital during construction (AFUDC) which can
be significant due to the large quantities of land and the long project construction
durations that are typically required. The cost of AFUDC is not included because it is
specific to owner financing parameters. The costs do include indirect costs, such as
administration and construction management. Engineering costs were estimated to be 3
percent of total construction cost; planning and FERC licensing costs for an original
FERC license were estimated to be $3,000,000. The generic project cost estimates
presented below include an assumption of a four-unit powerhouse with no existing
reservoirs.
However, although based on historic cost information, the actual construction cost of a
pumped storage project is highly site specific. The costs presented below represent
completely generic projects assuming completely new infrastructure (two new reservoirs
with dams) and must, therefore, be considered with a level of uncertainty of
approximately -30 percent to +50 percent. High capacity and energy projects constructed
on sites with good access, high head, short water conveyances, in good rock, suitable
topography for the reservoirs, and easy access to construction power and water, would
result in lower project costs. Similarly, if one or two existing reservoirs could be used for
either or both the upper and lower reservoirs, the project cost would be lower by the
avoided cost of constructing those dams and the reservoirs. For example, utilizing one
existing lake or reservoir for the lower reservoir could reduce total construction costs by
4 EPRI. 1990. Pumped-Storage Planning and Evaluation Guide. Prepared by Harza Engineering Company, Chicago, Illinois. January 1990.
2019 Energy Storage Technology Assessment
Platte River Power Authority
April 12, 2019 | 19
approximately 10 percent. Projects with the opposite characteristics to those described
above would result in higher costs.
In addition to the upfront costs for licensing, permitting, engineering, and construction,
we have also estimated operation and maintenance (O&M) costs per the table below.
Annual O&M costs were estimated per EPRI (1990) guidance, which provides annual
costs based on estimated annual energy generation and include costs for operation (e.g.
station service load), maintenance, general expenses, insurance premiums, and other
related expenses. For the purpose of this analysis, we assumed the project would
complete one full operating cycle at full capacity for 358 days a year, including a total of
one week of outage every year. At an interval of every 20 years, the pump-turbines and
motor-generators would be refurbished at a cost of approximately $10,000,000 per unit.
In addition, the original FERC license is assumed to be issued for 50 years, after which
we estimate relicensing costs of $2,000,000 every 40 years after that.
It should be noted that there is still significant value remaining in any hydropower facility,
including pumped storage facilities, at the end of its typical service life, which is typically
estimated to be between 80 and 120 years. The civil structures would likely have
significant service life remaining, although the electro-mechanical equipment would likely
need to be replaced. We have not estimated this value, but it should be taken into
consideration when comparing pumped storage to other technologies with shorter
expected service life and no remaining or salvage value at the end. Decommissioning
costs are also not included.
Table 1. PHES Cost Data
Capacity (MW) 400 400
Energy Storage (hrs) 4 10
Engineering, Construction & Commissioning Capital Cost ($M)
$876 $1,107
O&M Cost ($M)5
O&M (annual)6 $3.50 $4.90
Insurance7 $0.90 $1.10
Bi-Annual 3-week Outage Costs ($)
$0.60 $0.60
Replacement / Major Overhaul (every 20 years)
$30.0 $30.0
Other Factors
Approximate Footprint Requirements
25-100 ac 50-150 ac
Permitting See Planning/Original
See Planning/Original
5 First year costs, later years are escalated
6 Excludes estimated insurance costs
7 Assumed equal to 0.1 percent of Construction & Commissioning Capital Costs per EPRI (1990).
2019 Energy Storage Technology Assessment Platte River Power Authority
20 | April 12, 2019
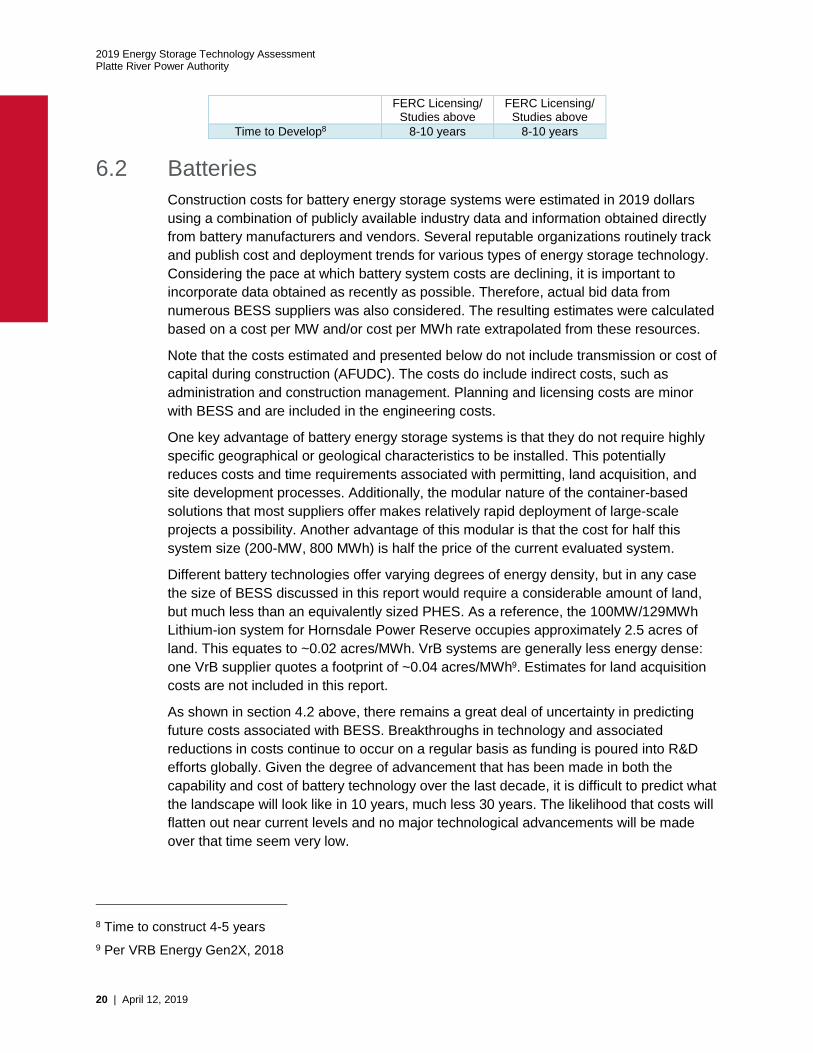
FERC Licensing/ Studies above
FERC Licensing/ Studies above
Time to Develop8 8-10 years 8-10 years
6.2 Batteries
Construction costs for battery energy storage systems were estimated in 2019 dollars
using a combination of publicly available industry data and information obtained directly
from battery manufacturers and vendors. Several reputable organizations routinely track
and publish cost and deployment trends for various types of energy storage technology.
Considering the pace at which battery system costs are declining, it is important to
incorporate data obtained as recently as possible. Therefore, actual bid data from
numerous BESS suppliers was also considered. The resulting estimates were calculated
based on a cost per MW and/or cost per MWh rate extrapolated from these resources.
Note that the costs estimated and presented below do not include transmission or cost of
capital during construction (AFUDC). The costs do include indirect costs, such as
administration and construction management. Planning and licensing costs are minor
with BESS and are included in the engineering costs.
One key advantage of battery energy storage systems is that they do not require highly
specific geographical or geological characteristics to be installed. This potentially
reduces costs and time requirements associated with permitting, land acquisition, and
site development processes. Additionally, the modular nature of the container-based
solutions that most suppliers offer makes relatively rapid deployment of large-scale
projects a possibility. Another advantage of this modular is that the cost for half this
system size (200-MW, 800 MWh) is half the price of the current evaluated system.
Different battery technologies offer varying degrees of energy density, but in any case
the size of BESS discussed in this report would require a considerable amount of land,
but much less than an equivalently sized PHES. As a reference, the 100MW/129MWh
Lithium-ion system for Hornsdale Power Reserve occupies approximately 2.5 acres of
land. This equates to ~0.02 acres/MWh. VrB systems are generally less energy dense:
one VrB supplier quotes a footprint of ~0.04 acres/MWh9. Estimates for land acquisition
costs are not included in this report.
As shown in section 4.2 above, there remains a great deal of uncertainty in predicting
future costs associated with BESS. Breakthroughs in technology and associated
reductions in costs continue to occur on a regular basis as funding is poured into R&D
efforts globally. Given the degree of advancement that has been made in both the
capability and cost of battery technology over the last decade, it is difficult to predict what
the landscape will look like in 10 years, much less 30 years. The likelihood that costs will
flatten out near current levels and no major technological advancements will be made
over that time seem very low.
8 Time to construct 4-5 years
9 Per VRB Energy Gen2X, 2018
2019 Energy Storage Technology Assessment
Platte River Power Authority
April 12, 2019 | 21
Additionally, much of the data gathered for this report is based on battery system sizes
on the order of 10-160 MWh. The scale of deployment that PRPA is considering for this
report is greater than this, which creates economies of scale that may reduce specific
costs of the system. These potential economies of scale are not explicitly included within
this report. They are reflected in the higher negative uncertainty values associated with
this estimate of approximately -50 percent to +30 percent.
Requirements for O&M of battery systems vary for different technologies. For Li-ion
systems, O&M costs tend to be quite minimal as there are virtually no moving parts aside
from HVAC systems. Flow systems, however, require a system of pumps to move
electrolyte fluid between storage tanks and across an ion exchange membrane. These
pumps require periodic maintenance and replacement, which elevates O&M costs. A
major advantage of flow systems is that the energy capacity of a flow system does not
degrade over time in the way that Li-ion battery cells do. The rate of capacity degradation
of a Li-ion battery depends heavily on duty-cycle, but generally these systems require
either augmentation (adding new modules to the existing degraded ones) or full
replacement of degraded modules with fresh ones every 5-10 years to maintain
adequate capacity. The cost associated with that augmentation and replacement is
broken out separately in the table below and are not included in Warranty or O&M
estimates. Because cell cycle-life is expected to continue to improve, it is assumed that
an average of 2 full module replacements would be required over a 30 year project life.
At the end of the 30 year project life, there are several options an owner could consider
as a path forward. If the system is Li-ion, the capacity maintenance agreement could be
renewed and another cycle of augmentation or replacement could be undertaken to allow
the system to retain its nameplate capacity. Alternatively, the system could simply remain
in use at a continuously de-rated capacity. If it is desired that the system be
decommissioned and dismantled, there would be costs associated with the recycling and
disposal of the equipment. Most suppliers offer a recycling / disposal program with the
supply of their equipment. Those costs are not included in this report. Many suppliers of
flow systems offer commercial arrangements to lease the electrolyte or a purchase and
buy-back option, where the supplier will purchase the electrolyte fluid from the owner at
the end of the project. This residual value is also not included in this report.
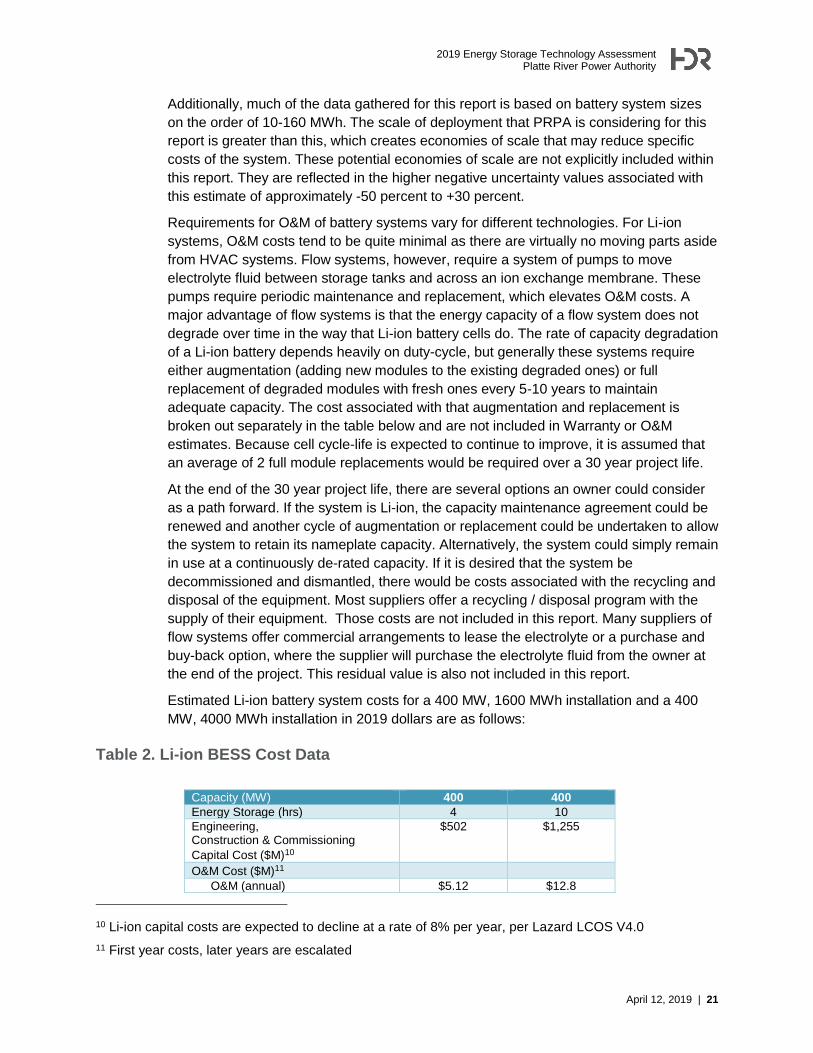
Estimated Li-ion battery system costs for a 400 MW, 1600 MWh installation and a 400
MW, 4000 MWh installation in 2019 dollars are as follows:
Table 2. Li-ion BESS Cost Data
Capacity (MW) 400 400
Energy Storage (hrs) 4 10
Engineering, Construction & Commissioning
Capital Cost ($M)10
$502 $1,255
O&M Cost ($M)11
O&M (annual) $5.12 $12.8
10 Li-ion capital costs are expected to decline at a rate of 8% per year, per Lazard LCOS V4.0
11 First year costs, later years are escalated
2019 Energy Storage Technology Assessment Platte River Power Authority
22 | April 12, 2019
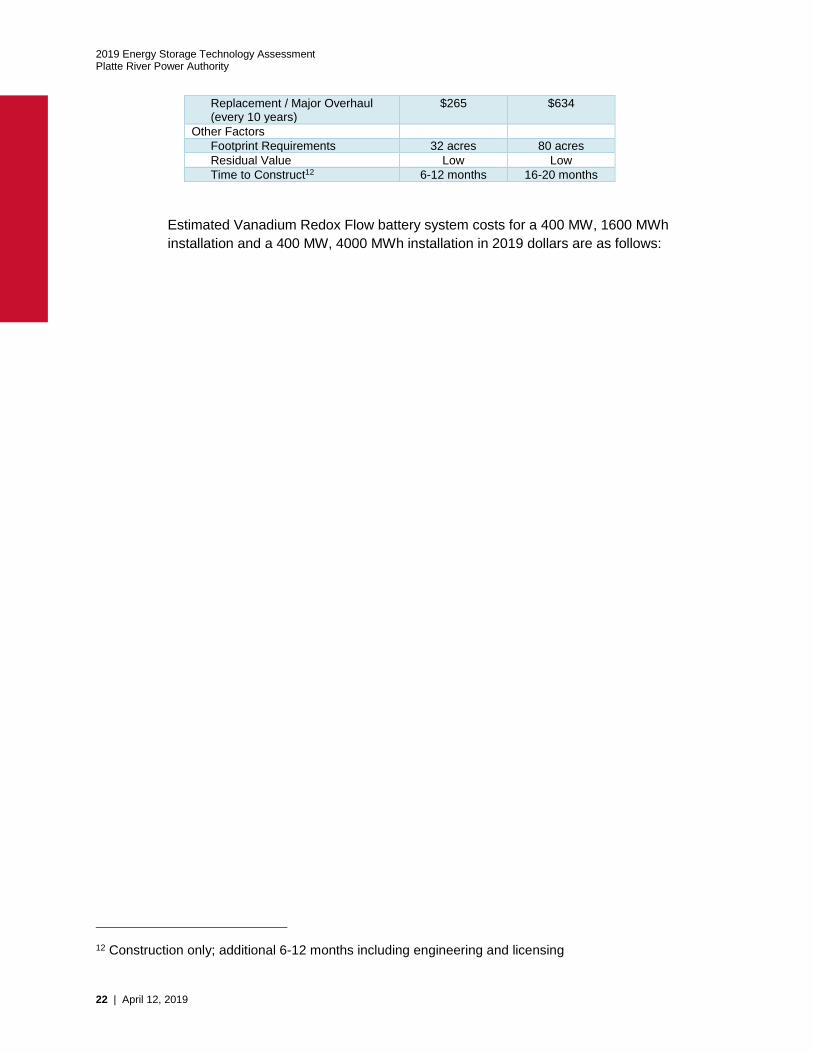
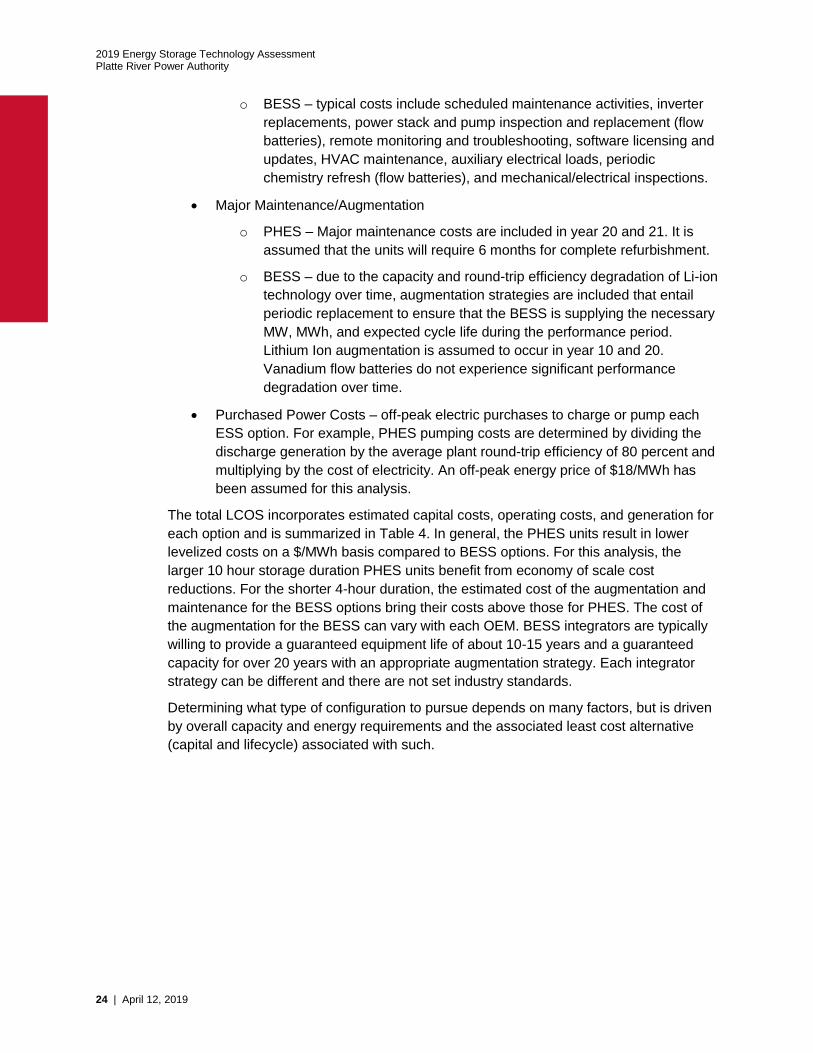
Replacement / Major Overhaul (every 10 years)
$265 $634
Other Factors
Footprint Requirements 32 acres 80 acres
Residual Value Low Low
Time to Construct12 6-12 months 16-20 months
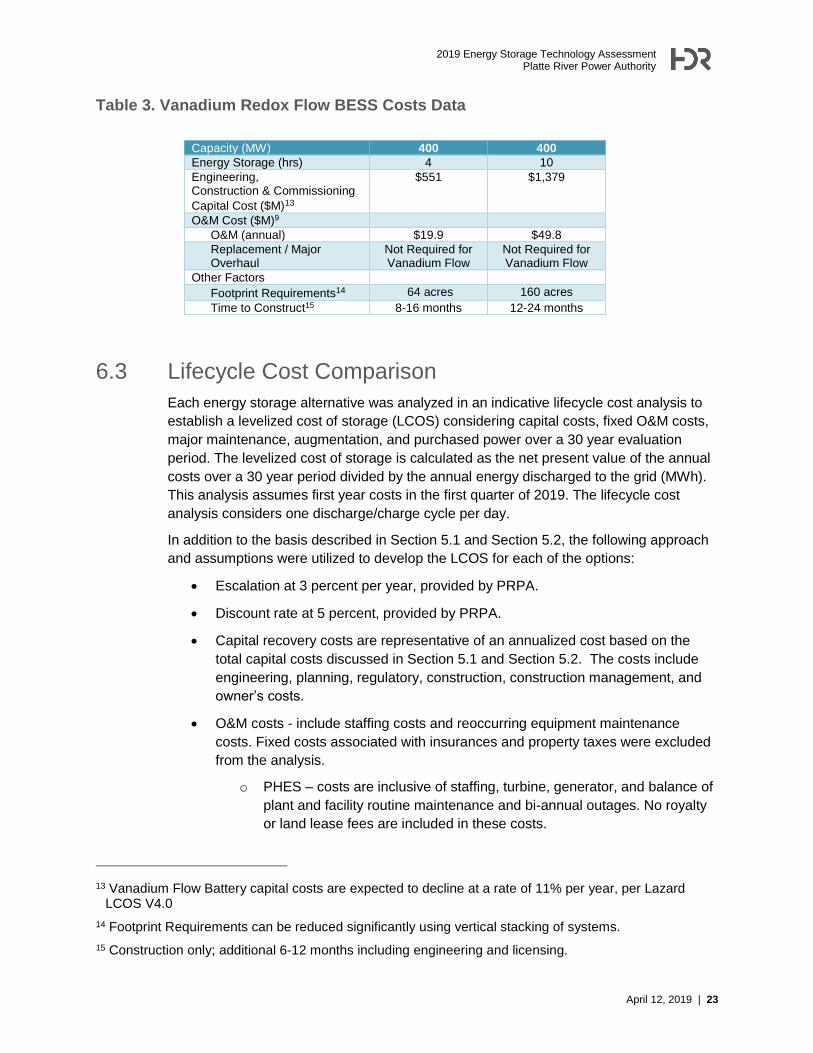
Estimated Vanadium Redox Flow battery system costs for a 400 MW, 1600 MWh
installation and a 400 MW, 4000 MWh installation in 2019 dollars are as follows:
12 Construction only; additional 6-12 months including engineering and licensing
2019 Energy Storage Technology Assessment
Platte River Power Authority
April 12, 2019 | 23
Table 3. Vanadium Redox Flow BESS Costs Data
Capacity (MW) 400 400
Energy Storage (hrs) 4 10
Engineering, Construction & Commissioning
Capital Cost ($M)13
$551 $1,379
O&M Cost ($M)9
O&M (annual) $19.9 $49.8
Replacement / Major Overhaul
Not Required for Vanadium Flow
Not Required for Vanadium Flow
Other Factors
Footprint Requirements14 64 acres 160 acres
Time to Construct15 8-16 months 12-24 months
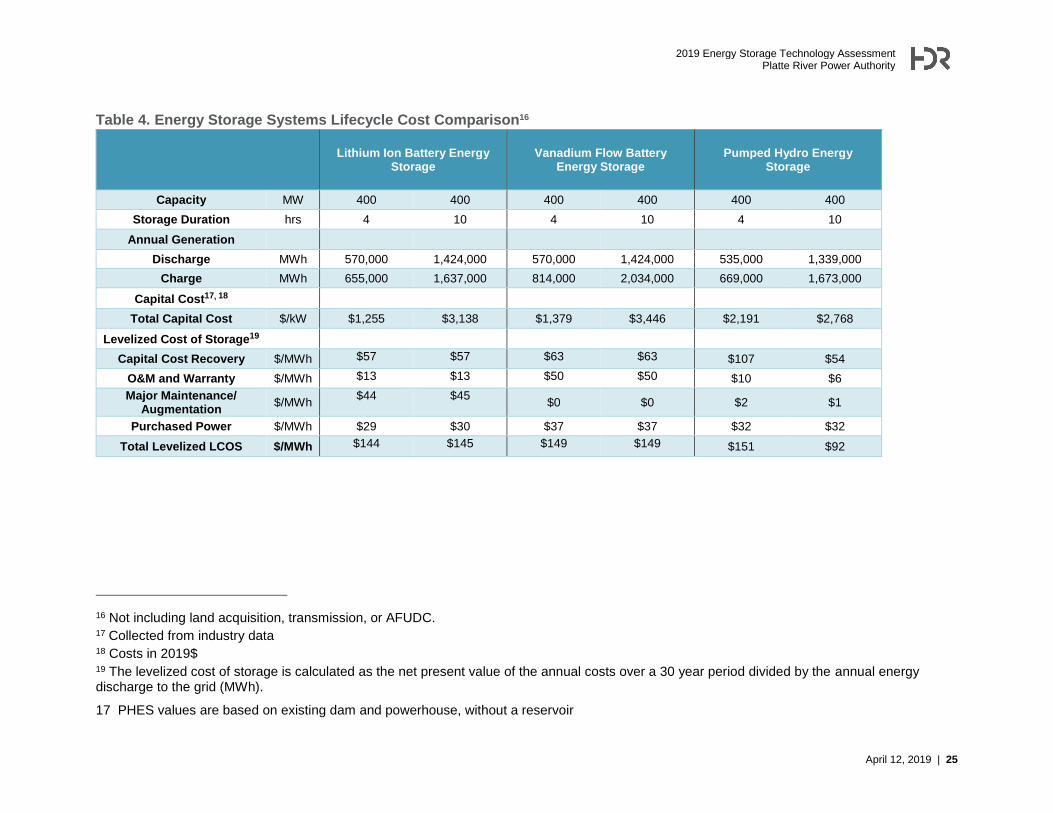
6.3 Lifecycle Cost Comparison
Each energy storage alternative was analyzed in an indicative lifecycle cost analysis to
establish a levelized cost of storage (LCOS) considering capital costs, fixed O&M costs,
major maintenance, augmentation, and purchased power over a 30 year evaluation
period. The levelized cost of storage is calculated as the net present value of the annual
costs over a 30 year period divided by the annual energy discharged to the grid (MWh).
This analysis assumes first year costs in the first quarter of 2019. The lifecycle cost
analysis considers one discharge/charge cycle per day.
In addition to the basis described in Section 5.1 and Section 5.2, the following approach
and assumptions were utilized to develop the LCOS for each of the options:
• Escalation at 3 percent per year, provided by PRPA.
• Discount rate at 5 percent, provided by PRPA.
• Capital recovery costs are representative of an annualized cost based on the
total capital costs discussed in Section 5.1 and Section 5.2. The costs include
engineering, planning, regulatory, construction, construction management, and
owner’s costs.
• O&M costs - include staffing costs and reoccurring equipment maintenance
costs. Fixed costs associated with insurances and property taxes were excluded
from the analysis.
o PHES – costs are inclusive of staffing, turbine, generator, and balance of
plant and facility routine maintenance and bi-annual outages. No royalty
or land lease fees are included in these costs.
13 Vanadium Flow Battery capital costs are expected to decline at a rate of 11% per year, per Lazard LCOS V4.0
14 Footprint Requirements can be reduced significantly using vertical stacking of systems.
15 Construction only; additional 6-12 months including engineering and licensing.
2019 Energy Storage Technology Assessment Platte River Power Authority
24 | April 12, 2019
o BESS – typical costs include scheduled maintenance activities, inverter
replacements, power stack and pump inspection and replacement (flow
batteries), remote monitoring and troubleshooting, software licensing and
Total Capital Cost $/kW $1,255 $3,138 $1,379 $3,446 $2,191 $2,768
Levelized Cost of Storage19
Capital Cost Recovery $/MWh $57 $57 $63 $63 $107 $54
O&M and Warranty $/MWh $13 $13 $50 $50 $10 $6
Major Maintenance/ Augmentation
$/MWh $44 $45
$0 $0 $2 $1
Purchased Power $/MWh $29 $30 $37 $37 $32 $32
Total Levelized LCOS $/MWh $144 $145 $149 $149 $151 $92
16 Not including land acquisition, transmission, or AFUDC. 17 Collected from industry data 18 Costs in 2019$ 19 The levelized cost of storage is calculated as the net present value of the annual costs over a 30 year period divided by the annual energy discharge to the grid (MWh).
17 PHES values are based on existing dam and powerhouse, without a reservoir
2019 Energy Storage Technology Assessment
Platte River Power Authority
June 19, 2019 | 27
7 Capacity Credit
Assigning capacity credit (CC) values to energy storage systems is a topic of much
discussion in the energy storage industry today. The ability of an ESS to provide reliable
capacity depends greatly on the characteristics of the ESS itself, particularly the duration
of the system. As such, there is no standard CC value that can be attributed to ESS.
Several frameworks for assessing CC values for storage systems have been developed,
which calculate CC values iteratively based on the storage system parameters and the
characteristics of the system on which they are modeled.
In general, there are three main factors that inhibit a storage resource’s ability to provide
firm capacity during a stress event (Great Britain 2017):
1. Stress events may last longer than the duration of the ESS.
2. The declining performance of ESS over time reduces their contribution to security of
supply.
3. Some ESS may be less than fully charged at the start of a stress event if they are
simultaneously providing multiple grid services.
Therefore, to some degree, the higher the duration of a storage resource, the higher the
CC that can be assigned to it. An energy storage system with a duration of many hours
would behave similarly to a thermal generator in terms of its ability to provide firm energy
to the grid at the time of need (CC = availability).
In addition, it must be assumed that the resource is available during the period(s) with
the highest load at a full state-of-charge. When the resource is being used
simultaneously for an alternative application (such as frequency response), this may not
be the case. To account for this, an ESS can be over-built to provide multiple services by
allocating portions of its energy capacity to each service. For example, a 20 MWh ESS
can assign 4 MWh of its energy capacity to frequency regulation, while the remaining
16 MWh can be used for supplying capacity reserves.
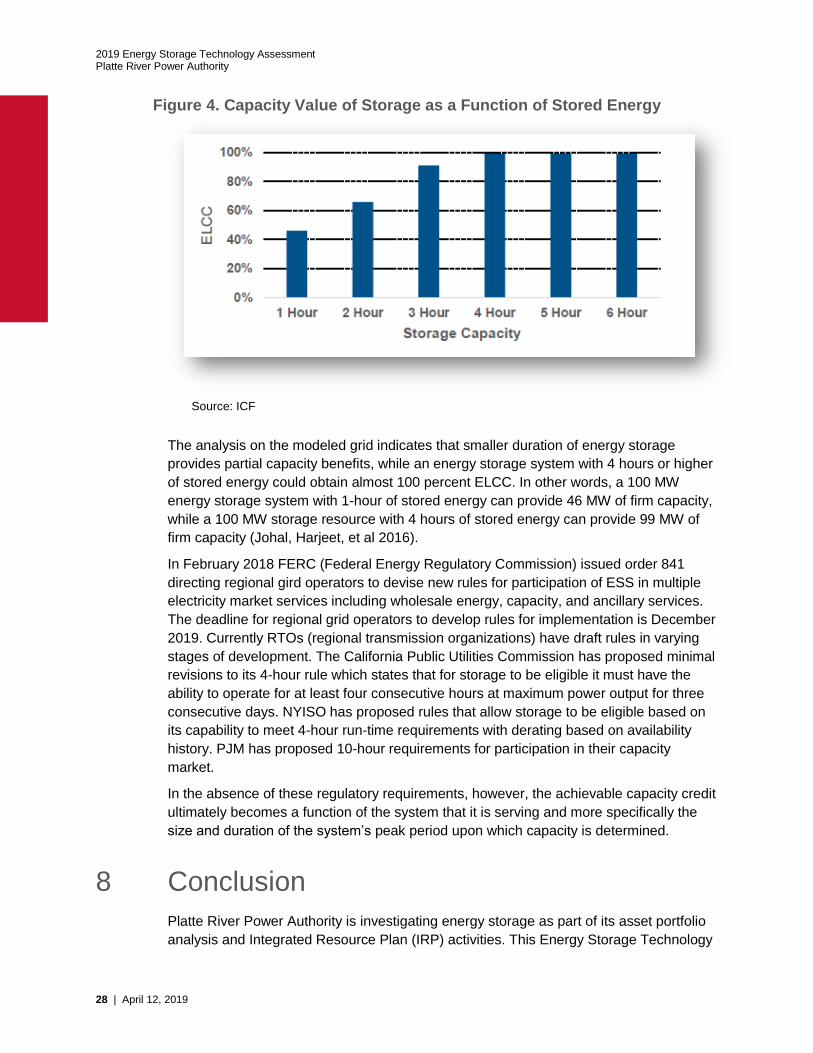
A 2016 study by ICF sought to quantify the relationship between duration and CC by
modeling energy storage systems of varying durations on the ERCOT grid. The results of
the study indicated that a 1-hour energy storage device provides nearly half the capacity
value, and a 4-hour energy storage device provides almost full capacity value. Figure 4
shows the relationship between the Electric Load Carrying Capability (ELCC) of an
energy storage device and the duration of the device (Johal, Harjeet, et al 2016).
2019 Energy Storage Technology Assessment Platte River Power Authority
28 | April 12, 2019
Figure 4. Capacity Value of Storage as a Function of Stored Energy
Source: ICF
The analysis on the modeled grid indicates that smaller duration of energy storage
provides partial capacity benefits, while an energy storage system with 4 hours or higher
of stored energy could obtain almost 100 percent ELCC. In other words, a 100 MW
energy storage system with 1-hour of stored energy can provide 46 MW of firm capacity,
while a 100 MW storage resource with 4 hours of stored energy can provide 99 MW of
firm capacity (Johal, Harjeet, et al 2016).
In February 2018 FERC (Federal Energy Regulatory Commission) issued order 841
directing regional gird operators to devise new rules for participation of ESS in multiple
electricity market services including wholesale energy, capacity, and ancillary services.
The deadline for regional grid operators to develop rules for implementation is December
2019. Currently RTOs (regional transmission organizations) have draft rules in varying
stages of development. The California Public Utilities Commission has proposed minimal
revisions to its 4-hour rule which states that for storage to be eligible it must have the
ability to operate for at least four consecutive hours at maximum power output for three
consecutive days. NYISO has proposed rules that allow storage to be eligible based on
its capability to meet 4-hour run-time requirements with derating based on availability
history. PJM has proposed 10-hour requirements for participation in their capacity
market.
In the absence of these regulatory requirements, however, the achievable capacity credit
ultimately becomes a function of the system that it is serving and more specifically the
size and duration of the system’s peak period upon which capacity is determined.
8 Conclusion
Platte River Power Authority is investigating energy storage as part of its asset portfolio
analysis and Integrated Resource Plan (IRP) activities. This Energy Storage Technology
2019 Energy Storage Technology Assessment
Platte River Power Authority
June 19, 2019 | 29
Assessment report is intended to provide technology characteristics and an estimated
cost comparison of contemporary generic and non-site-specific, utility-scale Energy
Storage Systems that are suitable for use on Platte River’s system.
There is a wide assortment of ESS technologies available for utility-scale applications. A
few of these options have reached a sufficient state of technological and commercial
development so that they can be considered by PRPA. These include pumped
hydropower energy storage systems (PHES) and battery energy storage systems
(BESS). These technologies have characteristics and costs that make them suitable for
consideration by PRPA and are discussed in depth in this report. Compressed air energy
storage (CAES), is discussed in this report but it is not considered favorable for PRPA’s
application because of the limited commercial experience, system complexity, and
geographical requirements of the technology.
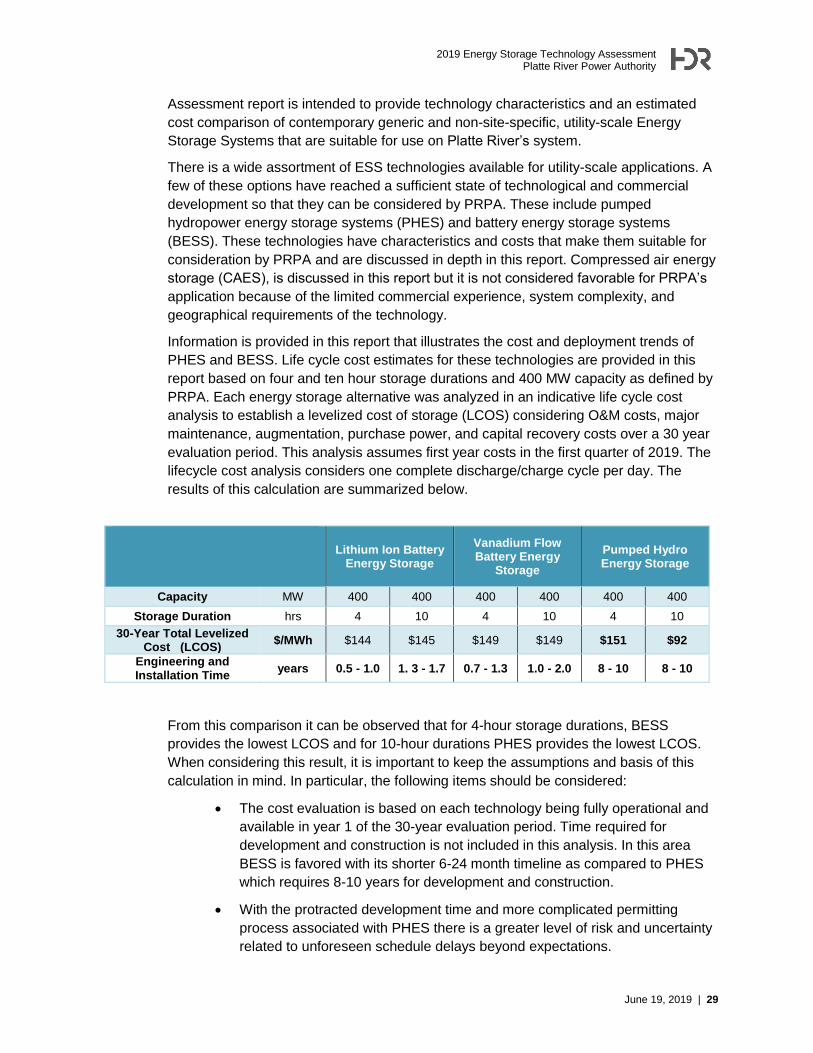
Information is provided in this report that illustrates the cost and deployment trends of
PHES and BESS. Life cycle cost estimates for these technologies are provided in this
report based on four and ten hour storage durations and 400 MW capacity as defined by
PRPA. Each energy storage alternative was analyzed in an indicative life cycle cost
analysis to establish a levelized cost of storage (LCOS) considering O&M costs, major
maintenance, augmentation, purchase power, and capital recovery costs over a 30 year
evaluation period. This analysis assumes first year costs in the first quarter of 2019. The
lifecycle cost analysis considers one complete discharge/charge cycle per day. The