90


CORPORATE DIRECTORY
D e e p Y e l l o w L i m i t e d 1 2 0 2 0 A n n u a l R e p o r t
BOARD OF DIRECTORS REGISTERED OFFICE
Mr Rudolf Brunovs Chairman (Non-executive) Unit 17, Spectrum Building, Second Floor
Mr John Borshoff Managing Director/CEO * 100-104 Railway Road
Ms Gillian Swaby Executive Director Subiaco, Western Australia, 6008
Mr Mervyn Greene Non-executive Director Telephone: + 61 8 9286 6999
Mr Justin Reid Non-executive Director Email: [email protected]
Mr Christophe Urtel Non-executive Director
* referred to as Managing Director throughout this report
COMPANY SECRETARY POSTAL ADDRESS
Mr Mark Pitts PO Box 1770
Subiaco Western Australia 6904
STOCK EXCHANGE LISTINGS AUDITOR
Australian Securities Exchange (ASX) Code: DYL Ernst & Young
OTC Markets Group (OTCQX) Code: DYLLF 11 Mounts Bay Road
Namibian Stock Exchange (NSX) Code: DYL Perth Western Australia 6000
WEBSITE ADDRESS SHARE REGISTRY
www.deepyellow.com.au Computershare Investor Services Pty Limited
Level 11
172 St George’s Terrace
AUSTRALIAN BUSINESS NUMBER Perth Western Australia 6000
97 006 391 948 Telephone: 1300 787 272
Facsimile: +61 8 9323 2033
CONTENTS
Summary Information 2
Chairman’s Letter 3
CEO Insights 4
Project Description and Review 5
Sustainability
Safety, Health, Environment & Radiation 13
Corporate Social Responsibility 14
Corporate Governance Statement 19
Directors’ Report 20
Remuneration Report 26
Auditor’s Independence Declaration 39
Financial Statements 40
Notes to the Financial Statements 44
Directors’ Declaration 80
Independent Audit Report 81
ASX Additional Information 86
Schedule of Mineral Tenure 88

SUMMARY INFORMATION
D e e p Y e l l o w L i m i t e d 2 2 0 2 0 A n n u a l R e p o r t
COMPANY PROFILE Led by a proven and experienced management team with an exceptional track record of uranium success, Deep Yellow Limited (Deep Yellow) (ASX:DYL) is focused on becoming a tier-one, low-cost uranium producer by establishing a multi-project, globally diversified uranium portfolio. The Company is advancing a bold, counter cyclical, dual-pillar growth strategy. The strategy is focused on organic growth through the development of the Company’s existing asset base in Namibia and inorganic growth through a targeted merger and acquisition program. The long-term outlook for uranium is extremely positive underpinned by the integral role nuclear power will need to play in meeting clean energy targets. Aside from growth already forecasted to meet electricity demand in regions such as Asia, Middle East and Eastern Europe, the expectation is that additional nuclear demand will be driven by the requirement to counter growing greenhouse gas emissions. Deep Yellow is preparing itself to be in a position to provide a secure and reliable supply of uranium to this growing market.
CORPORATE STRATEGY Since the appointment of John Borshoff as CEO and Managing Director in October 2016, the Company has set a new direction built around a unique, counter-cyclical strategy focused on organic and inorganic growth to deliver a 5-10Mlb, Tier 1 uranium producer with a low cost, multi-project global uranium platform. Organic growth will be delivered through exploration and development of the Company’s Namibian project portfolio. Since 2016, exploration success has tripled the resource base at the Reptile Project, at an extremely low discovery cost of 11.5c/lb. The Company’s “inorganic” growth plan is based on a targeted merger and acquisition program to establish a diversified portfolio of uranium operations for development from 2023 onwards. Effective execution of this unique strategy requires a leadership team with a proven track record, extensive industry knowledge and capability to deliver. Deep Yellow has assembled a standout uranium team that brings strong project development, operational and corporate capabilities. The majority of this team successfully worked together at Paladin Energy, which grew from a $2M explorer into a $4B high-quality uranium producer pre-Fukushima. The medium to long-term outlook for uranium is extremely positive, supported by the integral role nuclear power will play in meeting global clean energy targets. Through the operational expertise of the Company’s Board and management team, along with the execution of the unique and differentiated dual-pillar strategy, Deep Yellow is well placed to provide uranium supply security and certainty into a growing market.
HIGHLIGHTS OF THE 2020 FINANCIAL YEAR
Key achievements in the Company have been as follows: Continued drilling of the prospective Tumas palaeochannel system continued to increase the resource base on the
Reptile Project with 55km of this 125km target remaining to be adequately tested.
With the positive results, a Scoping Study (SS) was completed initiating commencement of a Pre-Feasibility Study (PFS) to test viability of Langer Heinrich-style deposits which are found to occur on the Tumas Palaeochannel of the Reptile Project.
Exploration on the on the Nova Joint Venture (NJV) Project funded 100% by JOGMEC continued testing for basement associated mineralisation (Husab/Rössing alaskite-associated mineralisation) and surficial calcrete-style mineralisation (Langer Heinrich-style deposits) with highly encouraging results identified at the Barking Gecko basement target.
Completion of a capital raising program in July 2019, involving both placements to selected parties to broaden the shareholder base and a Share Purchase Plan. It jointly raised A$11.3M to support sector consolidation possibilities and advancement of the feasibility studies on Reptile Project.
Against the uncertainty and volatility caused by the COVID-19 pandemic, the Company conducted a full review of activities focused on adjusting workstreams to safeguard the Company’s key assets. Proceeded with re-adjusted work programs to preserve cash, whilst maintaining and advancing the core key drivers of the Company’s strategy. This included advancing the Tumas 3 PFS, carrying out critical exploration on the NJV and assessing M&A activities.

CHAIRMAN’S LETTER
D e e p Y e l l o w L i m i t e d 3 2 0 2 0 A n n u a l R e p o r t
Dear Shareholder It has been another year of steady progress at Deep Yellow. Your company is continuing its journey toward the goals articulated in our annual report last year. We set a twin strategy for growth. Firstly, through the identification of additional resources in our Namibian exploration licences. At the same time seeking expansion by way of acquisitions be they via joint ventures or outright acquisition. Progress on both fronts has been achieved. The discovery of additional resources and updates to our Mineral Resource Estimates (MRE) has been disclosed via various ASX announcements. The recent infill drilling has resulted in a successful and meaningful conversion of resources from Inferred to Indicated. We are all particularly pleased with the progress. The ongoing work on acquisition opportunities is being conducted internally. One area I particularly wish to acknowledge is the leadership of Deep Yellow in their overall management of the COVID-19 issue. This came up for all of us very suddenly but management responded with effective action on a timely basis. To make matters even more complicated we have had to deal with the issue in both Namibia and Australia. Full marks go to the whole team and in particular the leadership shown by John Borshoff and Gill Swaby for getting us through this. Albeit we recognise that it remains an issue. The frustrating part is our inability to visit our operations in Namibia. A concerted effort during the year was made to complete the SS. This gave us the confidence to progress to the PFS together with the Environmental Impact Study. Both are currently underway. We have every expectation to follow this with the next stage being the Feasibility Study. As part of this process we will be seeking a Mining Licence early next year. Overall, another solid year for Deep Yellow. While this may be self-evident what does need to acknowledged is that this has been achieved through the combined effort and energy of our teams of people in both Namibia and Perth. We are fortunate to have highly experienced and motivated people across a wide range of skill sets. Finally, the rerate of the uranium price is a matter we believe to be inevitable and in the not distant future. Yours faithfully
Rudolf Brunovs

CEO INSIGHTS
D e e p Y e l l o w L i m i t e d 4 2 0 2 0 A n n u a l R e p o r t
URANIUM OUTLOOK STILL FAVOURS A CONTRARIAN APPROACH FY20 has been an interesting year in the uranium world. Uranium price reached a low of US$23.90/lb in late March 2020 and then a uranium price uplift occurred, mainly crystallised by COVID-19 consequences moving price to a high of US$34.10/lb in late May 2020. COVID-19 caused more reaction than the relatively ineffective mine closures that occurred between early 2018 to early 2020. Ironically, although the uranium price still remains in the doldrums in relative terms, there are positive signs that the price recovery that we need is coming closer to eventuating.
Analysts and general commentators in the industry have, in my opinion, overread the meaning of this uranium price response in the period late March to May 2020, postulating a very near-term continuation of uranium price escalation to signify the dawning of the next uranium boom. I think these enthusiastic predictions have been premature as the current, post FY20 situation has prices languishing and in fact falling somewhat finishing at $33.10/lb at the end of June 2020 and falling further post this period to $31.40/lb in late August 2020. While there are positive signals, which have been long awaited, the overall supply/demand dynamics for a full-scale return of nuclear utilities to engage in long-term contracting, in my opinion, is not yet with us. Over-supply continues to dog the industry and have negative effect. Nevertheless, the supply/demand tensions are becoming apparent and it is easier to see the crossover to shortage occurring so we should remain very confident that the age of uranium price resurgently could be upon us in 15 to 18 months.
All this perfectly suits the Deep Yellow dual strategy for growth. Our Reptile Project in Namibia has moved from a positive SS assessment completed mid FY20 resulting in the immediate start-up of a PFS for which ongoing results from this work have been very positive confirming the assumptions made in the SS. It is anticipated that, with the conclusion and successful outcome of our PFS by mid FY21, we should be able to commence our Definitive Feasibility Study on the Tumas Project in quick succession and its completion will likely be in perfect timing with uranium price increases anticipated in the mid/late 2022.
Also, with our sector consolidation objectives still remaining strong, we are confident of acquiring one or two acquisition to strengthen our project pipeline and improve the Company’s chances of becoming a premier uranium company by establishing project diversity. This strategy has the added advantage of also having the required management and technical teams to develop these projects when the price is right to move.
On top of all this we achieved some very encouraging results late in the year on our NJV project where JOGMEC has just completed an A$4.5M earn-in obligation and we expect investigations on this JV project to continue.
So, as I mentioned last year, Deep Yellow continues to remain an excellent investment opportunity differentiated from its competitors with an appropriate strategy in place to capitalise during this period of uranium downturn. Uranium will likely be the surprise performance sector. This may take a little while longer, but this sector has the very real potential to reward handsomely.
Yours faithfully
John Borshoff

PROJECT DESCRIPTION AND REVIEW
D e e p Y e l l o w L i m i t e d 5 2 0 2 0 A n n u a l R e p o r t
OVERVIEW Activities for the 12-month period to 30 June 2020 significantly advanced the Company’s Namibian projects together with the ongoing M&A effort. In addition, a successful capital raising was completed in July 2019 to boost cash reserves to support future programs. NAMIBIAN OPERATIONS Deep Yellow continues to hold an interest in three key projects in Namibia; Reptile, the NJV and the Yellow Dune Joint Venture (YDJV) (Figure 1). Reptile and NJV are active exploration projects, YDJV is inactive and these projects are described below. Reptile Mineral Resources and Exploration (Pty) Ltd (RMR – wholly owned subsidiary of Deep Yellow) is the manager of all projects. In three and a half years much has been accomplished with the uranium resource base associated with calcrete deposits within the Tumas palaeochannel improved nearly three-fold, with much upside still remaining. Importantly, a SS was completed on the Tumas 3 deposit with positive results. This has been followed by a PFS which is currently underway.
Figure 1: Locality map showing Deep Yellow’s interests in Namibia including
uranium mines and projects held by other companies in the region
PROJECT DESCRIPTION AND REVIEW
D e e p Y e l l o w L i m i t e d 6 2 0 2 0 A n n u a l R e p o r t
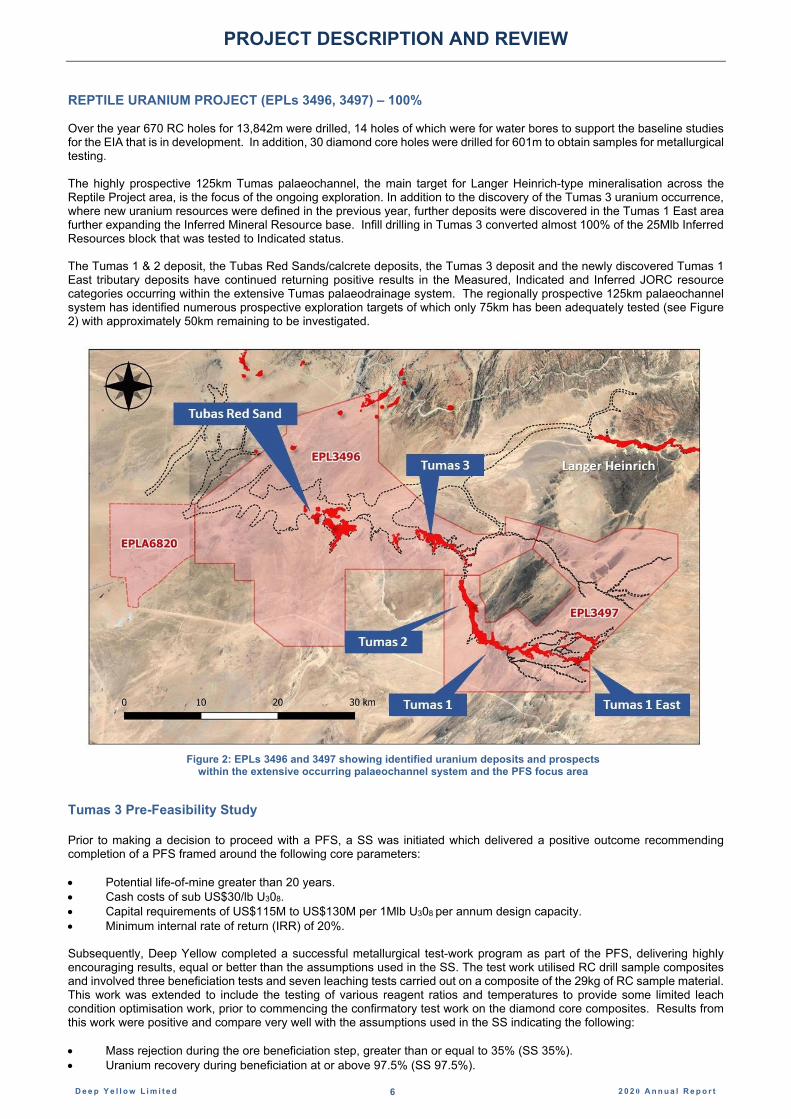
REPTILE URANIUM PROJECT (EPLs 3496, 3497) – 100% Over the year 670 RC holes for 13,842m were drilled, 14 holes of which were for water bores to support the baseline studies for the EIA that is in development. In addition, 30 diamond core holes were drilled for 601m to obtain samples for metallurgical testing. The highly prospective 125km Tumas palaeochannel, the main target for Langer Heinrich-type mineralisation across the Reptile Project area, is the focus of the ongoing exploration. In addition to the discovery of the Tumas 3 uranium occurrence, where new uranium resources were defined in the previous year, further deposits were discovered in the Tumas 1 East area further expanding the Inferred Mineral Resource base. Infill drilling in Tumas 3 converted almost 100% of the 25Mlb Inferred Resources block that was tested to Indicated status. The Tumas 1 & 2 deposit, the Tubas Red Sands/calcrete deposits, the Tumas 3 deposit and the newly discovered Tumas 1 East tributary deposits have continued returning positive results in the Measured, Indicated and Inferred JORC resource categories occurring within the extensive Tumas palaeodrainage system. The regionally prospective 125km palaeochannel system has identified numerous prospective exploration targets of which only 75km has been adequately tested (see Figure 2) with approximately 50km remaining to be investigated.
Figure 2: EPLs 3496 and 3497 showing identified uranium deposits and prospects
within the extensive occurring palaeochannel system and the PFS focus area
Tumas 3 Pre-Feasibility Study
Prior to making a decision to proceed with a PFS, a SS was initiated which delivered a positive outcome recommending completion of a PFS framed around the following core parameters: Potential life-of-mine greater than 20 years. Cash costs of sub US$30/lb U308. Capital requirements of US$115M to US$130M per 1Mlb U308 per annum design capacity. Minimum internal rate of return (IRR) of 20%. Subsequently, Deep Yellow completed a successful metallurgical test-work program as part of the PFS, delivering highly encouraging results, equal or better than the assumptions used in the SS. The test work utilised RC drill sample composites and involved three beneficiation tests and seven leaching tests carried out on a composite of the 29kg of RC sample material. This work was extended to include the testing of various reagent ratios and temperatures to provide some limited leach condition optimisation work, prior to commencing the confirmatory test work on the diamond core composites. Results from this work were positive and compare very well with the assumptions used in the SS indicating the following: Mass rejection during the ore beneficiation step, greater than or equal to 35% (SS 35%). Uranium recovery during beneficiation at or above 97.5% (SS 97.5%).

PROJECT DESCRIPTION AND REVIEW
D e e p Y e l l o w L i m i t e d 7 2 0 2 0 A n n u a l R e p o r t
Leach extraction greater than 95% (SS 95%) for uranium. Leach reagent concentrations and residence times at just half the respective levels assumed for the SS, also achieved
high leach extraction rates for uranium. The updated metallurgical model indicates an overall higher recovery than that assumed for the SS (92.2% for
uranium), with lower overall reagent and consumable costs. Vanadium performance remains at or above the assumptions used for the SS. Metallurgical testing subsequently undertaken on the diamond core composites confirmed the positive results above and importantly identified that RC chip samples are suitable for further leach and hydrometallurgical test-work. This will allow a material reduction in future metallurgical sample collection costs for samples representative of the Tumas 3 Mineral Resource.
The successful outcomes from the test work program have allowed for finalisation of the Process Design Criteria for the PFS, with work ongoing. The process being developed for the Project is aimed at achieving operating costs for uranium (without vanadium credit) that are in the lower quartile of producer operating costs (sub US$30/lb) while also minimising risk, site remediation and closure costs.
EIA Baseline Studies
The development of the Tumas Project will require an Environmental Clearance Certificate (ECC) to be issued by the Environmental Commissioner. The ECC is also required before the Mining Licence for the tenement will be granted. In order to obtain an ECC, an Environmental Impact Assessment (EIA) will be required for the Project and submitted to the competent authorities for approval before the ECC will be issued. Baseline studies have commenced for the development of the EIA and this work is ongoing. Studies commenced to date include initiation of groundwater, radiological, air quality, flora and fauna studies.
Tumas 3 Resource Upgrade to Indicated A resource-infill RC drilling program, covering the central zone of the Tumas 3 deposit (Figure 2) targeted an area containing 25Mlb of Inferred Resources, grading 381ppm eU3O8 using a 200ppm cut off. The primary goal of the drilling program was to convert approximately 50% of the total Inferred Resource at Tumas 3 (33.1Mlb) to Indicated Resource status to support the Tumas PFS. Pleasingly, the drilling program successfully converted 96.4% of the Inferred Resource available within the area drilled to an Indicated Resource category, whilst also identifying additional Inferred Resources.
Successful resource infill drilling led to an updated MRE at the Tumas 3 deposit of 24.1Mlb at 313ppm eU3O8 of Indicated Resources using a 200ppm cut off. Additionally, this work identified a further 3.7Mlb of Inferred Resources in this same area. This is a notable improvement in both resource quality and amount converted to Indicated from the original Inferred Resource of 33.1Mlb. The Tumas 3 uranium resource upgrade tripled the overall Indicated and Measured Resource base associated with the Tumas Channel from 13.1Mlb to a total of 37.2Mlb eU308.
The MRE was estimated by Ordinary Kriging. Cut-off grades used for the expanded MRE included 100, 150, 200, 250 and 300ppm eU3O8 and the Indicated Mineral Resources derived from these cut-off grades indicate the mineralisation remains robust and consistent (Table 1). Drilling also delineated an additional 3.7Mlb in the Inferred Resource category at a cut-off of 200ppm eU3O8 giving a combined Mineral Resource of Tumas 1, 2 and 3, of 77.4Mlb at a grade of 324ppm eU3O8 at that cut-off. Total surficial Measured, Indicated, and Inferred Resources in the overall Tumas palaeochannel are now 96.2Mlb at 292ppm eU3O8, as outlined in the JORC Resource in Table 2. Table 1 - Tumas 3 JORC 2012 MRE Indicated Resources at various cut-off grades
Cut-off (ppm U3O8)
Tonnes (M)
U3O8
(ppm) U3O8
(Mlb) 100 45.9 279 28.3 150 43.8 286 27.6 200 34.9 313 24.1 250 22.2 364 17.8 300 14.0 418 12.9
Notes: Figures have been rounded and totals may reflect small rounding errors.
eU3O8 - equivalent uranium grade as determined by downhole gamma logging.
Gamma probes were calibrated at the Langer Heinrich uranium mine test pit.
During drilling, probes were checked daily against a standard source.
The 200ppm eU3O8 cut-off has been selected as being the most appropriate for headline reporting of the resource estimations.

PROJECT DESCRIPTION AND REVIEW
D e e p Y e l l o w L i m i t e d 8 2 0 2 0 A n n u a l R e p o r t
Resource Upgrade at Tumas 1 East An updated MRE for the Tumas 1 East deposit (Tumas 1 East) was completed resulting in a successful resource extension increasing the existing resource by 34%. Inferred Mineral Resources at Tumas 1 East are now 24.8Mlb at 319ppm eU3O8 (at a 200ppm eU3O8 cut-off). Following the resource drilling carried out during the year at Tumas 1 and Tumas 3, the combined overall Tumas palaeochannel resource totals 96.2Mlb eU3O8 at 292ppm over EPLs 3496/97 (Table 1). The overall total surficial calcrete-related Mineral Resources across the Company’s Namibian projects, including the Aussinanis Deposit on MDRL3498, have more than doubled since 2017 to 114.2Mlb U308. Table 2 shows the MRE results for the combined Tumas 1, 2 and 3 resource at a 200ppm eU3O8 cut-off in conjunction with the overall RMR resource inventory. NOVA JV, NAMIBIA (EPLS 3669, 3670) – 65% DEEP YELLOW Over the year 235 RC holes were drilled on the project for 8,255m. JOGMEC is currently earning a 39.5% equity interest in the Nova JV, with $4.5M required to be spent over a four-year period. The balance of the earn in obligation is expected to be fulfilled during calendar year 2020. Work on the NJV is focussing on follow-up drill testing on both the previously identified basement-related uranium targets (Rössing/Husab style deposits) and the palaeochannel/calcrete-associated uranium targets (Langer Heinrich style deposits). Exploration of the basement targets on EPL3669 has identified a promising zone of uranium anomalism at Barking Gecko (Figure 1). Although grade and thickness of the mineralisation encountered at Barking Gecko is mostly low-level, some of the higher grade and thicker intersections encountered required follow-up drilling. This follow-up exploration drilling at the Barking Gecko prospect encountered highly encouraging uranium mineralisation and, following this work, JOGMEC completed its A$4.5M earn-in obligation in August 2020. The 2,041m RC drilling program focused on the testing of this target on three regional lines spaced 1 to 1.2km apart with holes spaced at 200m. Eleven holes were completed with Figure 3 showing the Barking Gecko exploration target, drill hole locations and geology.
Figure 3: Barking Gecko Prospect showing drill hole locations and prospective zone

PROJECT DESCRIPTION AND REVIEW
D e e p Y e l l o w L i m i t e d 9 2 0 2 0 A n n u a l R e p o r t
All seven holes drilled on the central section intersected mineralisation, with grades and thicknesses improving to the North. The best intersections to date have been obtained in hole TN236RC, which returned a cumulative downhole thickness of 44m with a maximum grade of 736ppm eU3O8 over 1m. This zone includes 24m averaging 297ppm eU3O8. The mineralised intersections correspond to steeply south dipping alaskite (leucogranite) dykes intruding marble and biotite gneiss. In-house portable XRF (pXRF) assaying showed that the very high grade eU3O8 intersections of 2m at 754ppm in TN233RC and 7m at 1,115ppm in TN235RC are partly due to thorium enrichment. The corrected intersections are 2m of 309ppm and 7m at 415ppm U3O8 respectively. The thorium association in these two holes proved to be an exception, as all other intersections are uranium-dominated. The encouraging results from Barking Gecko with the 200m wide drill spacing leave the mineralisation intersected open both laterally and at depth. This drilling completed the JOGMEC earn-in obligations and data evaluation is underway to determine continuation of this joint venture. Should all parties elect to proceed and contribute, the equity positions will be - 39.5% Deep Yellow, 39.5% JOGMEC, 15% Toro Energy Limited and 6% Sixzone Investments (Pty) Ltd. Implication of Positive Results at Barking Gecko The discovery of notably thicker uranium intersections is of great significance for Deep Yellow, as the Company holds a highly underexplored grouping of three basement-related deposits (Ongolo, MS7 and Inca). These occur between 10km to 18km to the East/North East of the Barking Gecko discovery, in its adjacent EPL3496 (Figure 1). These 3 deposits occur in the 100% owned Reptile Project and contain 45.1Mlb grading 420ppm U3O8 as shown in Table 2. These deposits, combined with the emerging Barking Gecko results, provide a distinct opportunity to substantially improve on the basement-related uranium resources. The combination of EPL3669 (part of the NJV project) and the adjacent EPL3496 (100% owned Reptile Project) now forms a highly prospective land package that has already delivered substantial uranium resources. The exploration results from the last drilling campaign at Barking Gecko reaffirm management's positive expectation for additional discoveries to be made on both these projects.
YELLOW DUNE JOINT VENTURE (EPL 3498) The parties to the YDJV are Yellow Dune Uranium Resources (Pty) Ltd, a wholly owned subsidiary of Reptile Uranium Namibia (Pty) Ltd (RUN) (85%), Oponona Investments (Pty) Ltd (10%) and Epangelo Mining Company (Pty) Ltd (5%). As previously reported, EPL3498 is considered fully explored and that there is no further potential for additional discovery to add to the existing resources that have been defined. Due to the depressed uranium outlook, an application was made for a Mineral Deposit Retention Licence (MDRL) to secure the area containing the resource within EPL3498. Economic studies show that a mining operation at the current prevailing low uranium prices is not viable. Approval for grant of the MDRL was given, valid through to January 2025. OVERALL MINERAL RESOURCE ESTIMATES The overall resource base of Deep Yellow incorporating the latest MRE classified under JORC 2012 is indicated in the Annual Mineral Resource Statement (refer Table 2). Since the new exploration approach was applied from November 2016, the overall palaeochannel-hosted resources have more than doubled over its Namibian projects totalling 114.2Mlb U308, fully vindicating the change of focus to achieving uranium resource increase within the expanded, extensive, regionally-occurring palaeochannel-related exploration target. The JORC 2004 classified resources have not been updated to comply with the JORC Code 2012 on the basis that the information has not materially changed since it was last reported, however they are being progressively reviewed to bring all resources up to JORC 2012 standards.

PROJECT DESCRIPTION AND REVIEW
D e e p Y e l l o w L i m i t e d 1 0 2 0 2 0 A n n u a l R e p o r t
ANNUAL MINERAL RESOURCE STATEMENT
Table 2 - JORC 2004 AND 2012 MINERAL RESOURCE ESTIMATE
Notes: Figures have been rounded and totals may reflect small rounding errors.
XRF chemical analysis unless annotated otherwise.
♦ eU3O8 - equivalent uranium grade as determined by downhole gamma logging.
# Combined XRF Fusion Chemical Assays and eU3O8 values.
Where eU3O8 values are reported it relates to values attained from radiometrically logging boreholes.
Gamma probes were calibrated at Pelindaba, South Africa in 2007. Recent calibrations were carried out at the Langer Heinrich Mine calibration facility in July 2018 and September 2019.
During drilling, probes are checked daily against standard source.
Deposit Category Cut-off Tonnes U3O8 U3O8 U3O8 Resource Categories (Mlb U3O8)
(ppm U3O8)
(M) (ppm) (t) (Mlb) Measured Indicated Inferred
BASEMENT MINERALISATION Omahola Project - JORC 2004
INCA Deposit ♦ Indicated 250 7.0 470 3,300 7.2 - 7.2 -
INCA Deposit ♦ Inferred 250 5.4 520 2,800 6.2 - - 6.2
Ongolo Deposit # Measured 250 7.7 395 3,000 6.7 6.7 - -
Ongolo Deposit # Indicated 250 9.5 372 3,500 7.8 - 7.8 -
Ongolo Deposit # Inferred 250 12.4 387 4,800 10.6 - - 10.6
MS7 Deposit # Measured 250 4.4 441 2,000 4.3 4.3 - -
MS7 Deposit # Indicated 250 1.0 433 400 1 - 1 -
MS7 Deposit # Inferred 250 1.3 449 600 1.3 - - 1.3
Omahola Project Sub-Total 48.7 420 20,400 45.1 11.0 16.0 18.1
CALCRETE MINERALISATION Tumas 3 Deposit - JORC 2012
Tumas 3 Deposits ♦ Indicated 200 34.9 313 10,900 24.1 - 24.1 -
Inferred 200 16.1 358 5,500 12.7 - 12.7
Tumas 3 Deposits Total 51.0 328 16,400 36.8
Tumas 1, 1 East & 2 Project – JORC 2012
Tumas 1 & 2 Deposit ♦ Measured 200 10.8 383 4,100 9.1 9.1 - -
Tumas 1 & 2 Deposit ♦ Indicated 200 5.5 333 1,800 4.0 - 4.0 -
Tumas 1 & 2 Deposit ♦ Inferred 200 40.9 304 12,400 27.5 - - 27.5
Tumas 1 & 2 Project Total 57.2 322 18,300 40.6
Sub-Total of Tumas 1, 2 and 3 108.2 324 34,700 77.4
Tubas Red Sand Project - JORC 2012
Tubas Sand Deposit # Indicated 100 10.0 187 1,900 4.1 - 4.1 -
Tubas Sand Deposit # Inferred 100 24.0 163 3,900 8.6 - - 8.6
Tubas Red Sand Project Total 34.0 170 5,800 12.7
Tubas Calcrete Resource - JORC 2004
Tubas Calcrete Deposit Inferred 100 7.4 374 2,800 6.1 - - 6.1
Tubas Calcrete Total 7.4 374 2,800 6.1
Total for overall Tumas channel 149.6 292 43,300 96.2
Aussinanis Project - JORC 2004
Aussinanis Deposit ♦ Indicated 150 5.6 222 1,200 2.7 - 2.7 -
Aussinanis Deposit ♦ Inferred 150 29.0 240 7,000 15.3 - - 15.3
Aussinanis Project Total 34.6 237 8,200 18.0
Calcrete Projects Sub-Total 184 281 51,500 114.2 9.1 34.9 70.2
GRAND TOTAL RESOURCES 233 310 71,900 159.3 20.1 50.9 88.3
PROJECT DESCRIPTION AND REVIEW
D e e p Y e l l o w L i m i t e d 1 1 2 0 2 0 A n n u a l R e p o r t
Review of Material Changes The total mineral resources at 30 June 2020 are now 233Mt at 310ppm for 159.3Mlb of U3O8 up from 211Mt at 323ppm for 149.3Mlb of U3O8 at 30 June 2019. As outlined on pages 7 and 8, in May 2020 the Company confirmed changes to existing mineral resources at Tumas 3 and Tumas 1 East during the year. An exceptionally pleasing result from a resource infill drilling campaign at Tumas 3 delivered a conversion of 96.4% of existing Inferred resources to the Indicated category whilst also identifying additional Inferred resources. At June 2019 the mineral resource estimate for Tumas 3 was 39.7Mt at 378ppm for 33.1Mlb of U3O8, all in the Inferred category. At 30 June 2020 the mineral resource estimate for Tumas 3 totalled 51Mt at 328ppm for 36.8Mlb of U3O8 with 24.1Mlb in the Indicated category. (refer Table 2) In addition, an updated mineral resource estimate at the Tumas 1 East deposit resulted in an increase to the existing resource by 34%. At June 2019 the mineral resource estimate for Tumas 1 and 2 was 46.8Mt at 332ppm for 34.3Mlb of U3O8. At 30 June 2020 the mineral resource estimate for Tumas 1 and 2 totalled 57.2Mt at 322ppm for 40.6Mlb of U3O8. (refer Table 2). Other than the above noted change there were no material changes from the prior year. Governance and Internal Controls The Company maintains thorough QAQC protocols for conducting exploration, site practice, sampling, safety, monitoring and rehabilitation which are documented in the company’s various standard operating procedure manuals (SOPs). Drilling methods vary according to the nature of the prospect under evaluation. These can include auger, sonic, air core or reverse circulation drilling for unconsolidated formations; to reverse circulation (hammer) and diamond core drilling (HQ & NQ) for hard rock formations. Typically, resource estimations are based on a mix of downhole radiometric sampling and chemical assaying. Assay samples are collected over one metre intervals. Radiometric data is acquired at 5 cm intervals and composited to one metre intervals. Where statistical validation confirms radiometric and chemical assay equivalence, the resource estimate is primarily based on the radiometric data. All radiometric data is acquired digitally by in-house personnel trained to operate the Company’s fleet of Auslog downhole probes. These probes are calibrated at the Pelindaba pits in South Africa. QAQC controls for radiometrically acquired data comprises daily calibration sleeve checks and periodic comparison at a Reptile Uranium Namibia (Pty) Ltd test hole in Namibia. Assay samples are acquired by a three-tier riffle splitter or cone splitter at the drill site. Duplicate samples are inserted at 1:20 frequency. Diamond core samples are assayed as quarter-core over one metre intervals. External laboratories (ALS South Africa) assay for uranium by either pressed powder XRF or fused bead XRF. Characterisation of radiometric equilibrium is periodically assessed by submission of samples to ANSTO Minerals Laboratory in Sydney, Australia. Drill hole collars are DGPS-surveyed by in-house operators, after an initial pick-up by hand-held GPS. Downhole directional surveys are outsourced to independent contractors. Drill hole sample logging captures a suite of lithologic, alteration, mineralogic and hand-held radiometric data, at one metre intervals. This data is captured as permanent hard copy prior to digital input onto an in-house GBIS database. The parallel collection of drill sample and wireline probe data enables error recognition in depth discrepancies and confirmation of sampling accuracy. Drill plans and sections generated from drilling and surface mapping are used to constrain wireframe mineralisation models; upon which resource estimations are made. Resource estimations for currently quoted prospects have been calculated by internal qualified staff or independent third-party consultants.

PROJECT DESCRIPTION AND REVIEW
D e e p Y e l l o w L i m i t e d 1 2 2 0 2 0 A n n u a l R e p o r t
Competent Person’s Statements Exploration The information in this Report as it relates to exploration results was compiled by Dr Katrin Kärner, a Competent Person who is a Member of the Australasian Institute of Mining and Metallurgy (AusIMM). Dr Kärner, who is currently the Exploration Manager for RMR, has sufficient experience which is relevant to the style of mineralisation and type of deposit under consideration and to the activity which she is undertaking, to qualify as a Competent Person as defined in the 2012 Edition of the ‘Australasian Code for Reporting of Exploration Results, Mineral Resources and Ore Reserves’. Dr Kärner consents to the inclusion in this Report of the matters based on the information in the form and context in which it appears. Dr Kärner holds shares in the Company. Mineral Resource Estimate The information in this Annual Mineral Resource Statement is based on and fairly represents information and supporting documentation prepared or reviewed and compiled by Mr. Martin Hirsch, M.Sc. Geology, who is a member of the Institute of Materials, Minerals and Mining (UK) and the South African Council for Natural Science Professionals. Mr. Hirsch is the Manager for Resources and Pre-Development for Reptile Mineral Resources (Pty) Ltd and, has sufficient experience which is relevant to the style of mineralisation and type of deposit under consideration and to the activity which he is undertaking, to qualify as a Competent Person in terms of the ‘Australasian Code for Reporting of Exploration Results, Mineral Resources and Ore Reserves’ (JORC Code 2012 Edition). Mr. Hirsch consents to the inclusion in this announcement of the matters based on his information in the form and context in which it appears. Geophysics Component
Deconvolution was used to convert the current down-hole gamma data from the Tumas 3 project to equivalent uranium values (eU3O8) and was performed by experienced in-house personnel from Deep Yellow. The data conversion was checked and validated by Matt Owers up to October 2019, a geophysicist who is knowledgeable in this process and worked as a consultant for Resource Potentials with over 5 years of relevant experience in the industry. Mr Owers is a member of Australian Institute of Geoscientists and has sufficient experience with this type of processes to qualify as a Competent Person in terms of the ‘Australasian Code for Reporting of Exploration Results, Mineral Resources and Ore Reserves’ (JORC Code 2012 Edition). Mr Owers consents to the inclusion in this Report of the matters based on his information in the form and context in which it appears. Subsequently this work was done by Dr. Doug Barrett, a geophysicist who works as a consultant with over 10 years of relevant experience in the industry. Dr. Barrett has sufficient experience with this type of processes to qualify as a Competent Person in terms of the ‘Australasian Code for Reporting of Exploration Results, Mineral Resources and Ore Reserves’ (JORC Code 2012 Edition). Dr. Barrett consents to the inclusion in the Report of the matters based on his information in the form and context in which it appears. Project and Technical Expertise
Mr Darryl Butcher is a process engineer/metallurgist working for Deep Yellow and has sufficient relevant experience to advise the Company on matters relating to mine development and uranium processing, project scheduling, processing methodology and project capital and operating costs. Mr Butcher is satisfied and consents to the information provided in this Report with regard to the Tumas PFS progress.

SUSTAINABILITY
D e e p Y e l l o w L i m i t e d 1 3 2 0 2 0 A n n u a l R e p o r t
OUR APPROACH TO SUSTAINABILITY
Deep Yellow is focused on creating long-term value for its shareholders, stakeholders and the communities in which we operate. A key pillar to successfully achieving this goal is through the efficient, effective and ongoing implementation of environmental, social and governance (ESG) pillars.
With a management team that has a proven and successful history in the uranium sector, we understand the importance of sustainably and making it core to how we operate, as we move into pre-development and beyond. By taking an early approach to the implementation of key ESG practices and principles, Deep Yellow is focused on creating a company-wide approach to sustainable practices and developing the Company and our projects in the right manner.
Our commitment to managing the ESG pillars key to Deep Yellow is evident by the release of our first Sustainability Report providing the foundation of activities as the Group develops. This will provide transparency around advancing Deep Yellow in a sustainable manner. As an aspiring mining company, we believe we can and should progressively integrate our focus on ESG from early stages of exploration and development, positively influencing our culture and communities, with sustainability integral to our growth.
OVERVIEW
Below is an overview of the Group’s SHER and CSR activity for the past year. As mentioned above, our first Sustainability Report has been released and can be accessed at https://deepyellow.com.au/wp-content/uploads/SustainabilityReportSep20.pdf providing a base from which to grow as we develop the Company.
SAFETY, HEALTH, ENVIRONMENT & RADIATION
Safety and Health
Deep Yellow and each of its subsidiaries is committed to provide and maintain a safe and healthy work environment, with the target of “zero” harm in the workplace. The Company believes that attaining a high level of performance in occupational health and safety is critical to the long-term success of its business.
Safety is prioritised in the working environment by implementing control measures to prevent any injury or even fatality. Employees are encouraged to report all near misses in order to eliminate risks and this is a recurring theme for the regular tool-box talks. Employees’ and contractors’ working hours accumulated to almost 78,000 hours (2019: 65,000) in the reporting period with no lost time injury or fatality recorded.
Our focused approach is already delivering on its stated goals with RMR (the operating Namibian subsidiary) awarded the Inter-Mining Safety Certificate (Category 2 - Exploration Companies) by the Chamber of Mines for 2019. This was the second year in a row it was the proud recipient.
COVID-19 figured heavily in the conduct of our operations from March 2020 onwards, ensuring the safety and health of our workforce was a priority. Stringent controls were implemented, with the Australian workforce operating from home for a period of time in accordance with government requirements. In Namibia, management was fortunate to be able to take the lead from Australia and ensure high-level controls were put in place with appropriate procedures implemented prior to being mandated by the Namibian government. As the resources industry was deemed an essential service in Namibia, exploration activity was able to continue although at a slightly reduced capacity. A strict health and hygiene regime and appropriate protocols were put in place to ensure the safety of our personnel. These remain in place.
Environment
Environmental management remains integral to the Namibian operations in accordance with the Namibian Environmental Management Act No 7 of 2007 and RMR’s Environmental Management Plan. As the operations are carried out in the Namib-Naukluft National Park (NNNP) in Namibia, environmental responsibility is of particular significance. The Company has taken a structured and organised approach with well-defined programmes, training, responsibilities and commitment aimed at effectively protecting the environment and minimising the impacts of its operations on the environment. Education and training of personnel highlights the importance of responsible activity withing the NNNP.
The Environmental Control Officer ensured that these programmes were effectively implemented with the results reported bi-annually to Ministry of Environment in a timely manner. RMR’s exploration licences are in good standing with all having valid Environmental Clearances Certificates issued.

SUSTAINABILITY (continued)
D e e p Y e l l o w L i m i t e d 1 4 2 0 2 0 A n n u a l R e p o r t
Radiation
As a specialist uranium company, Deep Yellow adopts the ALARA (As Low as Reasonably Achievable) principle to ensure that exposure of ionizing radiation to its employees, contractors, the public and the environment are minimised.
RMR’s Radiation Safety Officer ensured compliance with the Atomic Energy and Radiation Protection Act 5 of 2005 and adherence to its Radiation Management Plan (RMP), which details the radiation safety requirements including:
radiation induction for all employees, contractors, and visitors; Personal Protective Equipment and behavioural measures; occupational radiation exposure monitoring; area gamma exposure monitoring; surface contamination monitoring; public exposure monitoring; and environmental monitoring.
All radiation safety matters and monitoring results were reported to the Namibian Radiation Protection Authority in March 2020. RMR also participated in a training exercise in Walvis Bay simulating a spill with participation of all the uranium companies in Namibia.
The highest recorded radiation exposure dose of RMR workers due to inhalation of LLRD and direct gamma radiation was 1.00 mSv/a for a contract driller. No cases of radiation over-exposure occurred during the reporting period as all recorded doses were well below both RMR’s internal dose limit of 5mSv/a and the legal occupational dose limit of 20mSv/a.
Throughout the year, RMR was fully compliant with its RMP, thereby ensuring that workers, the general public and the environment were effectively safeguarded against potential harmful effects that may have been caused by any incremental exposure to ionising radiation due to operational activities. In this regard, no radiation incidents were recorded.
CORPORATE SOCIAL RESPONSIBILITY
It is vitally important that the Group contributes to the growth and prosperity of those countries in which it operates and, within the capacity that is possible, responds to the needs of its communities.
The Group’s operations are currently centred in Namibia and therefore the CSR activity is focussed in that country under the RMR banner. A detailed report for the year ended June 2020 can be found on the Deep Yellow website at https://deepyellow.com.au/wp-content/uploads/CSRReportSep20.pdf.
Overview
RMR’s CSR activities were aligned with Namibia’s Fifth National Development Plan (NDP5) and the Harambee Prosperity Plan covering varied needs and primarily focussed on:
fostering early childhood development through educational support; empowering communities through sport; promoting a sustainable environment; and community support through COVID-19 aid initiatives.
In the reporting period, RMR invested close to N$500,000 into community initiatives, a clear commitment to working with those communities in which the Company operates. A summary of the various projects follows.
Early Childhood Development
Mondesa Youth Opportunities (MYO)
MYO is a non-profit, registered Namibian Trust that operates entirely on donations.
120 learners, ranging from Grades 4 to 8, receive extra instruction in English, Mathematics, Reading, Life Skills, Computers, Sports and Music, every day after school, for a period of 5 continuous years. MYO targets high-achieving learners from disadvantaged socioeconomic backgrounds and cultivates positive thinking and high self-esteem to lay the path for a future generation of forward-thinking Namibian leaders. In addition to cash donations, staff from Perth and Namibia collected stationery and personal hygiene supplies for distribution to the students.

SUSTAINABILITY (continued)
D e e p Y e l l o w L i m i t e d 1 5 2 0 2 0 A n n u a l R e p o r t
“Your donation allows MYO to offer free intensive education intervention for students from underprivileged schools here in Swakopmund. Our students can maximize their academic potential this year due to your generous donation and for that we are truly grateful.”, Neels Strijdom, Manager at MYO said.
Music Class. Maths Class.
Children with Handicap Action in Namibia (C.H.A.I.N.)
C.H.A.I.N. in Swakopmund is currently looking after 20 handicapped children (i.e., mainly down syndrome and cerebral palsy), 3 to 12 years of age. C.H.A.I.N. collects the children from their homes in the morning and takes them to the centre. Here, they follow an educational programme, teaching them not only basic education but also physical movement and mobility. C.H.A.I.N. also provides a nutritious meal to the children.
C.H.A.I.N. day care centre. Symbolic cheque handover.
Empowering Communities Through Sports
Albertus Tsamaseb Boxing Academy (ATBA)
ATBA is a registered non-profit organisation in Swakopmund serving previously disadvantaged community members. It provides a safe training environment that instils co-operation, athleticism, sportsmanship, commitment and self-confidence in its members.
Over the years ATBA has produced both national and international champions including Jonas Junias Jonas who won a gold medal at the 2018 Commonwealth Games and has been training at the academy since the age of 10. Jonas had qualified for the 2020 Olympic Games in Japan although these were cancelled due to the global pandemic.
RMR continues to support the academy with the upgrading of its training facility and the provision of uniforms and administrative support. During the year, a boxing ring was procured and donated to ABTA. Due to Covid-19 related trade restrictions the delivery of the boxing ring was delayed and will be assembled as soon as local lockdown restrictions are lifted.

SUSTAINABILITY (continued)
D e e p Y e l l o w L i m i t e d 1 6 2 0 2 0 A n n u a l R e p o r t
Tricot handover. Left: Owner and coach Albertus Tsamaseb, right: Gillian Swaby, Executive Director,
Deep Yellow Ltd.
Jonas Junias Jonas presenting his gold medal won at the African Olympic qualifiers in Dakar, Senegal in early 2020.
Supporting a Sustainable Environment
Vultures of Namibia
Vultures of Namibia was established in 1997 and focusses on Lappet-faced vulture ringing in the NNNP, vulture ringing on commercial farms and visiting farming communities to promote vulture conservation.
All six vulture species still found in Namibia are under pressure from several sources, with poison as the number one killer. Like vultures throughout Africa and other parts of the world, vultures continue to decline in numbers. In Namibia, the status of vultures, as defined by the International Union for conservation of Nature (IUCN), is as follows:
Egyptian Vulture Extinct as a breeding species Hooded Vulture Endangered White-backed Vulture Endangered Cape Vulture Critically endangered Lappet-faced Vulture Vulnerable White-headed Vulture Vulnerable.
Although many vultures breed in national parks, game reserves and protected areas, they often feed on farms and communal areas. Here they become victims of the unrelenting struggle between farmers and predatory mammals attacking domestic livestock.
RMR adopted a vulture and sponsored satellite tracking equipment to promote nature conservation and help to raise awareness of the endangered species breeding in the NNNP, where RMR operates.
Climbing small tree to ring chick. Chick with satellite tracker.

SUSTAINABILITY (continued)
D e e p Y e l l o w L i m i t e d 1 7 2 0 2 0 A n n u a l R e p o r t
Cacti Eradication
Invasive cacti are taking over habitats of native vegetation (Figure 29) and spreading throughout Namibia at an incredibly rapid pace.
Friedhelm and Gunhild Voigts from Windhoek founded “Cactus Clean-up” to prevent an entire collapse of the native vegetation. They employ jobless workers to do the clean-ups who are paid by donations only. All equipment used by them is also donated and RMR provided rakes and wheelbarrows to support this initiative.
Aloes losing their habitat. Photo by G. Voigts.
Cacti eradication in Windhoek using tools donated by RMR. Photo by G. Voigts.
Community Support – COVID-19 Initiatives
Hands of Hope
Hands of Hope (HoH) is a voluntary organization that started off in 2013 and has recently registered as a non-profit organization. The organization has volunteers in various towns who assist with all funding from their own pockets and time.
Since the outbreak of Covid-19 HoH efforts have been focused on supplying food parcels to those who are financially severely affected by the pandemic. HoH concentrates its efforts mainly on families with disabled children, single mothers as well as the elderly and those who have ill family members with illnesses such as severe diabetes or others who need specialised diets.
The funds donated by RMR were utilised for food and basic hygiene articles. RMR also assisted the organisation with its staff packing and distributing the food parcels in Swakopmund. In addition, RMR’s employees donated second-hand clothes and other household items to the organisation. This support continued in August 2020 with further funding.
Packing of food parcels at RMR’s office premises. Distribution of food parcels in Swakopmund.

SUSTAINABILITY (continued)
D e e p Y e l l o w L i m i t e d 1 8 2 0 2 0 A n n u a l R e p o r t
Grow Together Kindergarten
The Grow Together Kindergarten is located in the Democratic Resettlement Community (DRC) at the outskirts of Swakopmund and was originally created in support of the DRC Women’s Project to supervise the children of the women working at the centre. Today, the kindergarten is open for all children of the DRC community.
The kindergarten currently caters for 64 children between 3 and 6 years of age taught in three separate classes.
Due to the outbreak of the Covid-19 pandemic RMR assisted the kindergarten with disinfectant, sanitisers and other cleaning reagents to ensure that children could continue learning in a safe environment.
Classroom of the DRC kindergarten (before the pandemic). Handover of cleaning reagents to the DRC kindergarten.
CORPORATE GOVERNANCE STATEMENT
D e e p Y e l l o w L i m i t e d 1 9 2 0 2 0 A n n u a l R e p o r t
GOVERNANCE FRAMEWORK The Board of Deep Yellow has responsibility for corporate governance for the Company and its subsidiaries (the Group) and has implemented policies, procedures and systems of control with the intent of providing a strong framework and practical means for ensuring good governance outcomes which meet the expectations of all stakeholders. The Corporate Governance Statement, dated 30 June 2020 and approved by the Board on 23 September 2020, sets out corporate governance practices of the Group which, taken as a whole, represents the system of governance. The framework for corporate governance follows the 4th Edition of the ASX Corporate Governance Council’s Principles and Guidelines. The Directors have implemented policies and practices which they believe will focus their attention and that of their Executives on accountability, risk management and ethical conduct. DYL will continue to review its policies to ensure they reflect any changes within the Group, or to accepted principles and good practice. The updated policies are available on the Company’s website. Where the Board considers the Group is not of sufficient size or complexity to warrant adoption of all the recommendations set out in the ASX Corporate Governance Council’s published guidelines, these instances have been highlighted. This statement is available on our website, along with the ASX Appendix 4G, a checklist cross-referencing the ASX Principles and Recommendations to disclosures in this statement and copies and summaries of charters, principles and policies referred to in this statement.

DIRECTORS’ REPORT
D e e p Y e l l o w L i m i t e d 2 0 2 0 2 0 A n n u a l R e p o r t
The Directors present their report on Deep Yellow and the entities it controlled at the end of, and during, the year ended 30 June 2020 (the Group). DIRECTORS The names and details of the Directors of the Company in office during the financial year and until the date of this report are as set out below. Directors were in office for this entire period. Names, qualifications, experience and special responsibilities Rudolf Brunovs MBA, FCA, FAICD Non-executive Chair Mr Brunovs is a highly experienced Chartered Accountant and Director with more than 35 years of experience in business. He is a former audit partner of the international accounting firm Ernst & Young and for 12 years held the position of Managing Partner, first of the firm’s Parramatta office and followed by the Perth office. He was also a member of the Minerals and Energy Division within Ernst & Young. Mr Brunovs has been a Director of Lions Eye Institute, a major WA based not for profit organisation, for more than 10 years and is a director of a privately-owned biotechnology company based in Perth. He holds a Masters of Business Administration from Bowling Green State University in Ohio and is a Fellow of both the Institute of Chartered Accountants of Australia and New Zealand and the Australian Institute of Company Directors. Mr Brunovs joined the Deep Yellow Board in August 2007 and was elected Non-executive Chairman in January 2016. Mr Brunovs is the Chair of the Audit Committee. John Borshoff BSc, FAusIMM, FAICD Managing Director/CEO Mr Borshoff is an experienced mining executive and geologist with more than 30 years of uranium industry experience. He spent more than a decade at the start of his career as a senior geologist and manager of the Australian activities of German uranium miner Uranerz. In 1993, following the withdrawal of Uranerz from Australia, Mr Borshoff founded Paladin Energy Ltd (Paladin). He built that company from a junior explorer into a multi-mine uranium producer with a global asset base and valuation of more than US$4.5 billion at its peak. At Paladin, Mr Borshoff led the team that completed the drill out, feasibility studies, financing, construction, commissioning and safe operation of the first two conventional uranium mines built in the world for 20 years. He also oversaw numerous successful, large public market transactions including acquisitions and major capital raisings before leaving Paladin in 2015. Mr Borshoff is recognised as a global uranium industry expert and has a vast international network across the uranium and nuclear industries, as well as the mining investment market. He has a Bachelor of Science (Geology) from the University of Western Australia and is a Fellow of both the Australian Institute of Company Directors and the Australasian Institute of Mining and Metallurgy. He is a member of the Uranium Forum within the Minerals Council of Australia (of which he is a former Board member), sits on the Council of the Namibian Chamber of Mines and is a member of the Supply/Demand Working Group of the World Nuclear Association. Mr Borshoff serves on the Risk Committee (appointed 29 June 2017). Gillian Swaby BBus, FCIS, FAICD, AAusIMM Executive Director Ms Swaby is an experienced mining executive with a broad skillset across a range of corporate, finance and governance areas. She has spent more than 35 years working with natural resources companies in numerous roles including Chief Financial Officer, Company Secretary, Director and corporate advisor. Ms Swaby worked at Paladin for the period 1993 – 2015 in the capacity as Executive Director for 10 years and as GM – Corporate Affairs. She had a key role in managing that company’s growth through mine development, operation, acquisition and exploration. This role included responsibility for the company’s complex corporate, legal, human relations and corporate social responsibility programs as an operating uranium miner in multiple African countries. Ms Swaby holds a Bachelor of Business (Accounting) and is a Fellow of the Australian Institute of Company Directors (AICD), the Institute of Chartered Secretaries and Administrators, and the Governance Institute of Australia. She is a member of the WA Council of the Australian Institute of Company Directors. Ms Swaby serves on the Risk Committee (appointed 29 June 2017). During the past three years Ms Swaby has also served as a Director of the following listed companies: Comet Ridge Limited - appointed 9 January 2004. * Panoramic Resources Limited – appointed 8 October 2019. * Birimian Limited – appointed 26 April 2017; resigned 13 November 2018.

DIRECTORS’ REPORT (continued)
D e e p Y e l l o w L i m i t e d 2 1 2 0 2 0 A n n u a l R e p o r t
Mervyn Greene MA (Maths), BAI (Engineering), MBA Non-executive Director Mr Greene is an experienced investment banker and entrepreneur who has been working in investment markets in Africa, Europe and the United States for more than 35 years. His most recent experience has focussed on private equity investment in a range of sectors, including property. He currently serves as Director of EPIC, The Irish Emigration Museum and is co-founder and Chairman of Dogpatch Labs, Ireland’s leading tech start-up hub, as well as the Managing Director of CHQ Dublin Limited, a leading Irish property developer. All these businesses are located in Dublin, Ireland. From 1997 – 2005 Mr Greene was the London-based partner of Irwin Jacobs Greene, one of Namibia's premier stockbroking, private equity and corporate finance advisory firms. Prior to this Mr Greene worked for investment bank Morgan Stanley in New York and London. Mr Greene has a Masters in Mathematics and Bachelor degree of Civil Engineering from Trinity College in Dublin. Mr Greene also has a Masters of Business Administration from London Business School. Mr Greene was appointed to the Deep Yellow Board in November 2006 and was Chairman from August 2007 to August 2013. Mr Greene serves on the Audit Committee and Remuneration Committee (appointed 1 January 2017). Christophe Urtel MSc, BSc Non-executive Director Mr Urtel has 20 years of experience in the natural resources sector and is currently Group Head of Corporate Development for Anglo American. Prior to joining Anglo American he was Head of Strategy and Capital (EMEA) for commodity trader Noble Group Limited, a Fund Manager at Laurium LP and an Executive Director in J.P. Morgan’s Principal Investment franchise in London, responsible for natural resources investments. Previously Mr Urtel worked in J.P. Morgan and its predecessor organisations from 1999 – 2008, specialising in providing M&A, equity capital market and debt capital market advice to companies in the metals and mining sector. Mr Urtel graduated with a Masters in Mining and Finance and Bachelor of Science (Geology with Engineering Geology) from the Royal School of Mines, Imperial College, London. Mr Urtel joined the Deep Yellow Board in October 2012. Mr Urtel serves on the Remuneration Committee and has been the Chair since 1 January 2017. Justin Reid BSc, MSc, MBA Non-executive Director Mr Reid is a geologist and capital markets executive with more than 20 years of experience focused exclusively in the mineral resources sector. He has held a number of senior executive roles, including President and Director of Sulliden Gold Corporation, until its acquisition of Rio Alto Mining in 2014, President and CEO of Toronto-listed Sulliden Mining Capital Inc which acquires and develops mining projects in the Americas. He is now CEO of Troilus Gold a Canadian development stage resource company focusing in Northern Quebec. Mr Reid started his career as a geologist with SGS and Cominco Limited, before becoming a partner and senior mining analyst at Cormark Securities in Toronto and then Managing Director Global Mining Sales at the National Bank of Canada. Mr Reid holds a Bachelor of Science (Geology) from the University of Regina, a Masters from the University of Toronto and a Masters of Business Administration from the Kellogg School of Management at Northwestern University. Mr Reid joined the Deep Yellow Board in October 2016. Mr Reid serves on the Audit Committee and Remuneration Committee (appointed 1 January 2017 to both) and is Chair of the Risk Committee (appointed 29 June 2017). During the past three years Mr Reid has also served as a Director of the following listed company: Aguia Resources Ltd - appointed 7 April 2015 resigned 5 August 2019 * Denotes current directorship Dividends No dividend has been paid since the end of the previous financial year and no dividend is recommended for the current year.

DIRECTORS’ REPORT (continued)
D e e p Y e l l o w L i m i t e d 2 2 2 0 2 0 A n n u a l R e p o r t
Interests in the Shares and Options of the Company As at the date of this report, the Directors’ interests in shares and Options of the Company were:
Director Number of Ordinary Shares
Number of Options over Ordinary Shares *
Rudolf Brunovs 484,370 92,593 John Borshoff 9,842,040 - Gillian Swaby 6,551,943 - Mervyn Greene 2,774,192 92,593 Justin Reid - 92,593 Christophe Urtel 842,832 92,593
*Non-executive directors were issued with Zero Priced Options on 18 December 2019 with a 1 July 2020 vest date and 1 July 2024 expiry date. Company Secretary Mark Pitts BBus, FCA, GAICD Mr Pitts is a partner in corporate advisory firm Endeavour Corporate and has over 30 years’ experience in business administration, statutory reporting and corporate compliance. Having started his career with KPMG in Perth, he has worked at a senior management level in a variety of commercial and consulting roles including mining services, healthcare and property development. The majority of the past 20 years has been spent working for, or providing company secretarial, accounting, finance and compliance services to, publicly listed companies in the resources sector. He is a registered company auditor and holds a Bachelor of Business Degree from Curtin University, is a Fellow of Chartered Accountants Australia and New Zealand and is a graduate of the Australian Institute of Company Directors. Principal Activities The principal activities during the financial year of entities within the Group were: Exploration activities to progress the 100% owned Reptile Project in Namibia with the emphasis to explore for the
existence of larger uranium deposits that can be developed as standalone operations.
Completion of a SS and commencement of a PFS on its Tumas Project (part of its Reptile Project).
Exploration activities on the NJV Project adjacent to the Reptile Project in Namibia.
Evaluating uranium projects for growth opportunities. Operating and Financial Review Review of Operations A detailed review of the Group’s operations by project is set out in the ‘Review of Operations’ on pages 5 to 12. Operating Results for the Year The Group’s net profit after income tax for the financial year is $2,874,863 (2019: loss $3,814,328). Financial Position At the end of the financial year the Group had $12,116,972 (2019: $14,975,063) in cash and at-call deposits. Capitalised mineral exploration and evaluation expenditure carried forward was $35,415,745 (2019: $31,831,939). The Group has net assets of $47,919,615 (2019: $47,489,320).
DIRECTORS’ REPORT (continued)
D e e p Y e l l o w L i m i t e d 2 3 2 0 2 0 A n n u a l R e p o r t
COVID-19 The Group reacted promptly to the COVID-19 pandemic and conducted a full review of its activities during March 2020. It focussed on adjusting workstreams to safeguard the Group’s key assets against the growing uncertainty and volatility. The adjustment of workstreams brought about a change in remuneration for Directors, employees and consultants as detailed in the Remuneration Report. The pandemic had minimal impact on the Group’s operations in Namibia as mining and related industries were declared as critical services during periods of lockdown. Management understood the severity of COVID-19 and acted quickly to implement protocols and procedures to ensure the safety and well-being of its personnel in both Namibia and Australia. The uranium spot price has moved from US$24.60 at 30 June 2019 to US$32.80 at 30 June 2020. This was partly brought about by both Cameco and Kazatomprom either suspending or reducing mine activity due to COVID-19. The price movement, although significant, is not sufficient to incentivise new production as it is still well below production costs of most mines. The price recovery, although minor, has reactivated investor interest to some degree reviving value of uranium projects from historical lows. The Namibian Dollar (NAD), pegged to the South African Rand (ZAR), has continued to weaken against the AU$ during the COVID-19 pandemic. This provides the Group with stronger buying power at its operations in Namibia. The Group has received temporary cash flow support from the Australian Government through tax-free cash flow boosts delivered through credits in the Business Activity Statement system. The cash flow boosts are equivalent to the amount of monthly tax withheld from wages paid to employees for period March to June 2020. Refer Note 7(a) for details. An additional cash flow boost will be applied when monthly activity statements for the period June to September 2020 are lodged and will be paid out after 30 June 2020. Business Strategies and Prospects for Future Financial Years Deep Yellow Limited is a clearly differentiated, uranium focused, advanced exploration company in pre-development phase that was rejuvenated by the appointment of John Borshoff, founder of Paladin Energy Ltd, as CEO in October 2016. The Company then set a new direction built around a unique, counter-cyclical strategy focused on organic and inorganic growth to deliver a Tier 1 uranium producer with a low cost, multi project global uranium platform. Organic growth is delivered through exploration and development of the Company’s Namibian project portfolio. Since 2016, exploration success has tripled the resource base at the Reptile Project, at an extremely low discovery cost. Namibia is a top ranked uranium mining jurisdiction where Deep Yellow holds four large cornerstone tenements situated in the heart of what is a world recognised, prospective uranium province containing major uranium deposits which includes the three largest open cut uranium mines worldwide. The Company’s inorganic growth plan is based on a targeted merger and acquisition program to establish a diversified portfolio of uranium operations for development. Effective execution of this unique strategy requires a leadership team with a proven track record, extensive industry knowledge and capability to deliver. Deep yellow has assembled a standout uranium team that brings strong project development, operational and corporate capabilities. The majority of this team successfully worked together at Paladin Energy Ltd, which grew from a US$2M explorer into a US$4.5B high-quality uranium producer pre-Fukushima. The medium to long-term outlook for uranium is extremely positive, supported by the integral role nuclear power will play in meeting global clean energy targets. Through the operational expertise of the Company’s Board and management team, along with the execution of the unique and differentiated dual-pillar strategy, Deep Yellow is well placed to provide uranium supply security and certainty into a growing market. Significant achievements in FY20 include an increase to the resource base on the Reptile project with 55km of the 125km target remaining to be adequately tested. A SS was completed, initiating commencement of a PFS to test the viability of Langer Heinrich-style deposits which are found to occur on the Tumas Palaeochannel of the Reptile Project. Exploration on the NJV Project funded 100% by JOGMEC continued testing for basement associated mineralisation (Husab/Rössing alaskite-associated mineralisation) and surficial calcrete-style mineralisation (Langer Heinrich-style deposits) with highly encouraging results identified at the Barking Gecko basement target. Completion of a capital raising program in July 2019, involving both placements to selected parties to broaden the shareholder base and a Share Purchase Plan. It jointly raised A$11.3M to support sector consolidation possibilities and advancement of the feasibility studies on Reptile Project. Significant Events after the Balance Date There have been no events or circumstances which materially affect the Annual Financial Statements of the Group between 30 June 2020 and the date of this report.

DIRECTORS’ REPORT (continued)
D e e p Y e l l o w L i m i t e d 2 4 2 0 2 0 A n n u a l R e p o r t
Environmental Regulation and Performance The Group holds Exclusive Prospecting Licences (EPLs) issued by the relevant authorities of the country in which the Group operates. These EPLs require the holder to observe any requirements, limitations or prohibitions on its exploration operations as may in the interest of the environmental protection, as imposed by the relevant authorities. The Group needs to undertake an EIA scoping study over the area covered by a relevant EPL and formulate and forward an Environmental Management Plan Report to the relevant authorities. There have been no known breaches of the Group’s EPL conditions or any environmental regulations to which it is subject. Share Options Unissued shares As at the date of this report, there were 62,834,990 unissued ordinary shares under option (62,464,618 at 30 June 2020 (the reporting date)). This includes 370,372 Options outstanding for Key Management Personnel (KMP) for which further details can be found in the Remuneration Report. There are no participating rights or entitlements inherent in the Options and Option holders will not be entitled to participate in new issues of capital that may be offered to shareholders during the currency of the Options. Shares issued as a result of the exercise of options No Options have been exercised to acquire fully paid ordinary shares in the Company during the year. Performance Rights As at the date of this report, there were 802,973 Performance Rights outstanding (604,561 at the reporting date). Refer to Note 20 for further details of the Performance Rights outstanding. There are no participating rights or entitlements inherent in the Performance Rights and Performance Right holders will not be entitled to participate in new issues of capital that may be offered to shareholders during the currency of the Performance Rights. During the financial year, 531,363 shares have been issued at a weighted average issue price of 23.75 cents per share in relation to Performance Rights that vested. Indemnification and Insurance of Directors and Officers During or since the financial year, the Company has paid premiums to insure certain officers of the Company. The officers of the Company covered by the insurance policy include the Directors and the Company Secretary named in this report. The Directors’ and Officers’ Liability insurance provides cover against all costs and expenses that may be incurred in defending civil proceedings that fall within the scope of the indemnity and that may be brought against the officers in their capacity as officers of the Company. The insurance policy does not contain details of the premium paid in respect of individual officers of the Company. Disclosure of the nature of the liability cover and the amount of the premium is subject to a confidentiality clause under the insurance policy. Indemnification of Auditors To the extent permitted by law, the Company has agreed to indemnify its auditors, Ernst & Young Australia, as part of the terms of its audit engagement agreement against claims by third parties arising from the audit. No payment has been made to indemnify Ernst & Young during or since the financial year.

DIRECTORS’ REPORT (continued)
D e e p Y e l l o w L i m i t e d 2 5 2 0 2 0 A n n u a l R e p o r t
Directors’ Meetings The number of meetings of Directors (including meetings of Committees of Directors) held during the year ended 30 June 2020, whilst each Director was in office, and the number of meetings attended by each Director was:
Directors’ meetings Meetings of Committees Board Audit Remuneration Risk Eligible Attended Eligible Attended Eligible Attended Eligible Attended Number of meetings held: 13 2 2 1 Number of meetings eligible and attended:
Rudolf Brunovs 13 12 2 2 - - - - John Borshoff 13 13 - - - - 1 1 Gillian Swaby 13 13 - - - - 1 1 Mervyn Greene 13 12 2 2 2 2 - - Justin Reid 13 12 2 2 2 2 1 1 Christophe Urtel 13 13 - - 2 2 - -
Committee Membership As at the date of this report, the Company had Audit, Remuneration and Risk Committees as detailed below:
Audit Remuneration Risk
Rudolf Brunovs (c) Christophe Urtel (c) Justin Reid (c) Mervyn Greene Mervyn Greene John Borshoff Justin Reid Justin Reid Gillian Swaby
Notes (c) designates the Chair of the Committee
Non-audit Services and Auditor’s Independence Declaration During the 2020 financial year Ernst & Young, the Group’s auditor, has not provided any non-audit services in addition to their statutory duties. A copy of the Auditor’s Independence Declaration as required under Section 307C of the Corporations Act is set out on page 39.

DIRECTORS’ REPORT (continued)
D e e p Y e l l o w L i m i t e d 2 6 2 0 2 0 A n n u a l R e p o r t
REMUNERATION REPORT (AUDITED) Contents of the Remuneration Report: 1. Remuneration Report overview 2. Overview of Executive remuneration
(a) Executive remuneration policies, processes and practices (b) Remuneration structures (c) Remuneration mix (d) Elements of remuneration
3. Group performance and Executive remuneration outcomes for FY20 4. Remuneration governance 5. Non-executive Director (NED) fee arrangements 6. Statutory and share-based reporting
(a) Executive remuneration for FY19 and FY20 (b) NED remuneration for FY19 and FY20 (c) Disclosures relating to loan plan and ordinary shares (d) Other transactions and balances with KMP and their related parties
7. Actual remuneration paid to KMP in FY20 1. Remuneration Report Overview The Directors present the Remuneration Report (the Report) for the Group for the year ended 30 June 2020 (FY20). This Report forms part of the Directors’ Report and has been audited in accordance with section 300A of the Corporations Act 2001 (the ACT). Any non-IFRS financial information contained in the Remuneration Report has not been audited or reviewed in accordance with Australian Auditing Standards. The Report details the remuneration arrangements of the Group’s KMP: Non-executive directors (NEDs); and Executive directors KMP of the Group are defined as those persons having authority and responsibility for planning, directing and controlling the major activities of the Group, whether it be directly or indirectly. The table below outlines the KMP of the Group and their movements during FY20.
Name Position Term as KMP
Executive Director John Borshoff Managing Director (MD) / Chief Executive Officer (CEO) Full financial year Gillian Swaby Executive Director Full financial year Non-executive Directors (NEDs)
Rudolf Brunovs Chairman Full financial year Mervyn Greene Non-executive Director Full financial year Justin Reid Non-executive Director Full financial year Christophe Urtel Non-executive Director Full financial year
There were no changes to KMP after the reporting date and before the date the financial report was authorised for issue. 2. Overview of Executive Remuneration (a) Executive Remuneration Policies, Processes and Practices Four principles guide the Group’s decisions about executive remuneration: Fairness: provide a fair level of reward to all employees, benchmarked against peer groups; Value adding: build a culture of achievement by attracting, motivating and retaining high performing individuals who
will add value to the Group; Alignment: promote mutually beneficial outcomes by aligning the interests of Executives with shareholder objectives;
and Group Culture: drive leadership performance that create a culture that promotes safety, diversity and stakeholder
satisfaction. The key objectives of the Group’s award framework therefore ensure that remuneration practices are based on the above principles, in compliance with the Corporations Act, the ASX Listing Rules and are also in accordance with principles of good corporate governance.

DIRECTORS’ REPORT (continued)
D e e p Y e l l o w L i m i t e d 2 7 2 0 2 0 A n n u a l R e p o r t
REMUNERATION REPORT (AUDITED) (continued) (b) Remuneration Structures The Group aims to reward Executives with a level and mix of remuneration appropriate to their position, responsibilities and performance, in a way that aligns with business strategy and shareholder objectives. Executives receive fixed remuneration and variable remuneration consisting of short- and long-term incentive opportunities. The remuneration offered is competitive for companies of a similar industry, size and complexity with longer term remuneration encouraging retention and multi-year performance. Executive remuneration levels are reviewed annually by the Remuneration Committee with reference to the remuneration guiding principles. The Group’s remuneration structure for Executives can include a mix of: Fixed remuneration Variable remuneration
- Short term incentive - Long term incentive
The chart below provides a summary of the structure of remuneration that applied to the Managing Director and Executive Director in FY20:
Managing Director Executive Director
Fixed remuneration Fixed remuneration Service fee Service fee
Variable remuneration Variable remuneration
Short term incentive (STI)
Long term incentive (LTI)
Short term incentive (STI)
Long term incentive (LTI)
Cash Loan Plan Shares
(vest equally over 3 years)
Loan Plan Shares (vest after 3 years)
Loan Plan Shares (vest equally over
2 years)
Loan Plan Shares (vest over 3 years)
Service and KPI milestones
100% non-financial performance Service and Share price
milestones 25% non-financial
75% financial performance
Service milestone 100% non-financial
Service and Share price milestones
25% non-financial 75% financial performance
(c) Remuneration Mix
*based on the value expensed during FY20 of issued Loan Plan Shares

DIRECTORS’ REPORT (continued)
D e e p Y e l l o w L i m i t e d 2 8 2 0 2 0 A n n u a l R e p o r t
REMUNERATION REPORT (AUDITED) (continued) (d) Elements of Remuneration Fixed remuneration The fixed remuneration component is comprised of a service fee, statutory superannuation contributions (where applicable) and other benefits (where applicable). It is paid by the Group to compensate fully for: The scope of the Executive’s role; The Executive’s skills, experience and qualifications; and Individual performance Executive contracts do not include any guaranteed increases. The Group benchmarks the fixed component against appropriate market comparisons with its peer groups. Short Term Incentive Executives have the opportunity to earn an annual incentive award which recognises annual performance. It is delivered in cash and Loan Plan Shares as summarised below:
Managing Director Executive Director How is it paid? 36% of STI delivered as cash with 64%
deferred into Loan Plan Shares vesting equally over three years.
100% of STI deferred into Loan Plan Shares vesting equally over two years
The deferred component was introduced in FY19 to align with Australian market practice.
How much can be earned? A maximum STI opportunity of 70% of annual service fee can be earned as follows: 25% Cash 45% Deferred into Loan Plan Shares
A maximum STI opportunity of 30% of annual service fee can be earned as Deferred Loan Plan Shares
Payment of any STI is entirely discretionary and the mix of cash and Loan Plan Shares can be adjusted as per Board discretion. The governance process and principles adopted by the Board in making the executive pay decisions, specifically during the COVID-19 pandemic, are based on but not limited to: Proactively considering whether discretion needs to be exercised due to the rapid
change in operating environment arising from the COVID-19 pandemic Receiving structured and broader insights and independent information from control
functions such as finance, risk and human resources; The Remuneration Committee maintaining an independent role in overseeing the
function of proposing remuneration decisions to the Board; and Transparently record and communicate the inputs received that led to discretion
being applied. How is performance measured?
The STI performance measures were chosen as they provide a framework for delivering short term success and long-term value to the Group and its shareholders. They reflect the core drivers of short-term performance and recognises and rewards the Managing Director’s contribution to that performance. Performance indicators (KPIs) cover only non-financial measures of performance as listed below: Growth initiatives
i) Mergers and Acquisitions ii) Organic
Capital resources Succession planning
Only service milestones are applicable

DIRECTORS’ REPORT (continued)
D e e p Y e l l o w L i m i t e d 2 9 2 0 2 0 A n n u a l R e p o r t
REMUNERATION REPORT (AUDITED) (continued)
When is it paid? The Remuneration Committee
recommends for Board approval the amount of Cash and vesting of Loan Plan Shares following a review of performance over the financial year against the STI performance measures. The Board approves the final STI award from the recommendation made by the Remuneration Committee. This is usually determined within three months of the end of the financial year. The cash component is therefore paid in the following financial year.
No cash component and only service milestones applicable for the vesting of Loan Plan Shares
Deferral terms The vesting of the Loan Plan Shares is
deferred and subject to a further three-year service period.
The vesting of the Loan Plan Shares is deferred and subject to a further two-year service period
Long Term Incentive Annual grants of Loan Plan Shares are made to the Managing Director and Executive Director to reward them for their contribution to the creation of shareholder value over the long term.
Managing Director Executive Director How is it paid? The Loan Plan Shares rewards and incentivises the participants through an arrangement
where shares are offered subject to long term performance conditions in the form of share price target and time-based vesting conditions. The shares are offered at market value such that the incentive is linked to the increase in value over and above the purchase price and so aligns the participants to the risks and rewards of a shareholder. The purchase price payable by the participant for the ordinary shares is lent to the participant under an interest free limited recourse loan, with the loan secured against the shares. The loan can be repaid at any time, however to avoid compulsory divestment of Loan Plan Shares, the loan must be repaid on the earlier of periods ranging between 5-10 years (determined with each issue) after the issuance of the shares and the occurrence of: (a) in the case of vested shares, the date being 12 months after cessation of
employment or service contract for any reason; or (b) pre-determined occurrences as per the Loan Share Plan including but not limited
to a Control Event or material breach by the Participant. Loan Plan Shares were deliberately chosen because they provide an appropriate level of incentive in a competitive environment and are cost effective in that there is no cash outlay for the Group which is appropriate given the Group’s exploration status.
How much can be earned? A maximum LTI opportunity of 110% of annual service fee can be earned through Loan Plan Shares with the following vesting conditions: non-market (time-based) – 27% market (price target) – 83%
A maximum LTI opportunity of 95% of annual service fee can be earned through Loan Plan Shares with the following vesting conditions: non-market (time-based) – 24% market (price target) – 71%

DIRECTORS’ REPORT (continued)
D e e p Y e l l o w L i m i t e d 3 0 2 0 2 0 A n n u a l R e p o r t
REMUNERATION REPORT (AUDITED) (continued)
The number of Loan Plan Shares granted is determined using the fair value at the date of
formalising the Notice of Meeting to obtain shareholder approval for the grant. Those Loan Plan Shares with non-market-based vesting conditions are valued using a Black Scholes option pricing model whilst those with market based vesting conditions are valued using a Monte Carlo simulation.
How is performance measured?
Loan Plan Shares vest over a period of time if certain Company share price targets are met and the holder of the Loan Plan Shares remains employed with the Company (time-based) during the measurement period. Awards made to the Managing Director and Executive Director contained both share price target and time-based vesting conditions. These conditions were chosen as it reflects an appropriate balance between individual reward and market performance. Those awards with time-based vesting conditions were issued to encourage long-term retention. If these vesting conditions are not met the shares are forfeited and the forfeited shares are treated as full consideration for the repayment of the loan. Financial based performance conditions such as Total Shareholder Return and Return on Equity Earnings are not chosen as a performance measure for the Loan Share Plan as these are difficult to measure in the present operating environment. Loan Plan Shares were granted under the Loan Share Plan to the Managing Director and Executive Director in December 2019 and have been accounted for as a share-based payment. Details in respect of the award are provided in Table 1(a).
When is performance measured?
All Loan Plan Shares are tested three years after grant.
Non-market-based Loan Plan Shares vest equally over three years with the first testing date a year after grant. Market based Loan Plan Shares are tested three years after grant.
What happens if an executive leaves?
Where an Executive ceases providing services prior to the vesting of their Loan Plan Shares, all unvested shares will be compulsorily divested on a date determined by the Board unless the Board exercises its discretion to allow vesting at or post cessation of employment.
What happens if there is a change of control?
In the event of a change of control of the Group, the Board may determine, in its absolute discretion, that some or all of the unvested Loan Plan Shares will automatically vest in a manner that allows the Executive to participate in and/or benefit from any transaction from or in connection with the Change of Control Event.
Are executives eligible for dividends?
The Executive is entitled to receive dividends on unvested Loan Plan Shares. For so long as there is an outstanding loan balance in relation to the Loan Plan Shares, the Executive irrevocably and unconditionally directs the Company to withhold all after-tax dividends in respect of the participants Loan Plan Shares and apply all amounts so withheld in repayment of the outstanding loan balance.
Sign-on Payments In addition to fixed remuneration, STI and LTI, the Board may determine, from time to time, to award sign-on payments to new executives. There were no sign-on payments made in FY20. 3. Group Performance and Executive Remuneration Outcomes for FY20 Group Performance The table below shows the performance of the Group as measured by its earnings per share and its share price over the past five years.
30 June 2020
Cents 30 June 2019
Cents* 30 June 2018
Cents 30 June 2017
Cents 30 June 2016
Cents **
Share price 20.5 32.0 34.0 28.0 8.0 U3O8 spot price (US$/lb) 32.80 24.60 22.65 20.15 26.7 Profit/(Loss per share) 1.19 (1.98) (1.29) (22.51) (1.82)
* Comparatives have not been restated for the adoption of AASB16: Leases **Prior to 1:20 share consolidation completed in March 2017

DIRECTORS’ REPORT (continued)
D e e p Y e l l o w L i m i t e d 3 1 2 0 2 0 A n n u a l R e p o r t
REMUNERATION REPORT (AUDITED) (continued) COVID-19 The Group reacted promptly to the COVID-19 pandemic and conducted a full review of its activities during March 2020. It focussed on adjusting workstreams to safeguard the Group’s key assets against the growing uncertainty and volatility. The adjustment of workstreams brought about a change in remuneration for Directors, employees and consultants of the Group as detailed below: Period 1 April to 30 June 2020 Non-executive director fees reduced by 50% of which 20% was foregone and 30% deferred until 1 January 2021; Scomac personnel days reduced together with a 10% rate reduction; Australian employees’ salaries and Executive Director’s fees reduced by 10%; and Namibian employees’ reduced work hours and corresponding remuneration by 20%. Period 1 July to 31 December 2020 (next review date) Non-executive director fees reduced by 10%; Scomac personnel rate reduction of 10% continues; Australian employees’ salaries and Executive director’s fee reduction of 10% continues; and Namibian employees’ return to normal work hours with a salary reduction of 10%. Actual Remuneration Paid The actual remuneration paid to KMP in FY20 is set out in section 7 below. This provides shareholders with a view of the remuneration actually paid to KMP for performance in FY20 and the value of LTIs that vested during the period. STI Vesting Outcomes Non-financial measures are used to measure performance for STI awards to the CEO as indicated on page 28. Based on an assessment, the average STI award to the CEO as a percentage of target for FY20 was 84%. Included in the assessment was a special allowance through which the CEO was acknowledged for his leadership with and management of the COVID-19 pandemic. The CEO responded with effective action on a timely basis even though matters were complex, dealing with the pandemic in both Namibia and Australia. Furthermore, the Board exercised discretion by maximising the cash component to 100% and adjusting the number of Loan Plan Shares to vest accordingly. This resulted in the following awards being made: $102,500 cash which will be paid during FY21; and 605,153 of 806,677 Loan Plan Shares granted on 18 December 2019 would vest equally over a three-year service
period starting 30 November 2020 and have a 5-year life (from issuance). The balance would be forfeited unvested.

DIRECTORS’ REPORT (continued)
D e e p Y e l l o w L i m i t e d 3 2 2 0 2 0 A n n u a l R e p o r t
REMUNERATION REPORT (AUDITED) (continued) LTI Vesting Outcomes Loan Plan Shares The vesting of Loan Plan Shares issued to Executives is driven by time and market price vesting conditions. The table below outlines current and expected outcomes for the vesting of issued Loan Plan Shares as LTI at 30 June 2020. Projected outcomes for the future vesting of issued Loan Plan Shares as LTI with market price vesting conditions are based on the assumption that the current 52-week high share price will be reached at the future testing date.
Market Price and Time-Based Tests – Loan Plan Shares as LTI FY 2018 grant FY 2019 grant FY 2020 grant
75 cents * 74.3 * 45.9* 10% of awards vested during FY19 14% of awards will vest during FY22 if
time-based vesting conditions are met. 3% of awards will vest during FY21 if time-based vesting conditions are met.
4% of awards vested during FY20 as time-based vesting conditions were met.
86% of awards will be forfeited unexercised during FY22 if the market price test of 74.3 cents is not met or if not vested by Board determination.
3% of awards will vest during FY22 if time-based vesting conditions are met.
16% of awards have been forfeited unexercised during FY20 as market price test was not met.
18% of awards will vest during FY23 if time-based vesting conditions are met.
14% of awards will vest during FY21 if time-based vesting conditions are met
75% of awards will be forfeited unexercised during FY23 if the market price test of 45.9 cents is not met or if not vested by Board determination.
56% of awards will be forfeited unexercised during FY 21 if the market price test of 75 cents is not met or if not vested by Board determination.
75 cents at 12 October 20 74.3 cents at 30 November 2021 45.9 cents at 30 November 2022
4. Remuneration Governance Remuneration Decision Making The Board operates within a remuneration decision making framework whereby: management implement general employee remuneration policies approved by the Managing Director; the Managing Director makes recommendations on remuneration outcomes for senior executives; a Board appointed Remuneration Committee reviews the Group’s remuneration framework and policy and make
recommendations to the Board on remuneration packages for NEDs and Executive Directors and incentive and equity-based remuneration plans for Senior Executives and other employees; and
the Board review and approve the above
The composition of the Remuneration Committee is set out on page 26 of this Annual Report. Further information on the Remuneration Committee’s role, composition, operation, responsibilities and authority can be found in the Remuneration Committee Charter available on the Company’s website.
Use of Remuneration Advisors To ensure the Remuneration Committee is fully informed when making remuneration decisions, it from time to time obtains external advice from an independent consultant. During the financial year, the Remuneration Committee did not engage a remuneration consultant to make any remuneration recommendation (as defined in the Corporations Act) in relation to any of the KMP for the Group. General advice was sought and obtained in relation to market conditions and parity reviews.
DIRECTORS’ REPORT (continued)
D e e p Y e l l o w L i m i t e d 3 3 2 0 2 0 A n n u a l R e p o r t
REMUNERATION REPORT (AUDITED) (continued) Clawback of Remuneration The Board has the discretion to reduce or cancel any unvested STI and LTI including the compulsory divestment of unvested or vested Loan Plan Shares under the Deep Yellow Limited Loan Share Plan if a KMP acts in a manner of: wilful misconduct bringing disrepute to the Group; repeated disobedience or incompetence in the performance of duties, after prior written warning; or fraud, dishonesty or a material breach of their obligations to the Group. Securities Trading Policy The Group’s Securities Trading Policy applies to all KMP. The policy prohibits employees from dealing in the Company’s securities while in possession of material non-public information relevant to the Group. Additional restrictions are placed on Restricted Employees whereby they are prohibited from dealing in the Company’s securities during prescribed closed periods. Directors and employees are further prohibited from engaging in hedging arrangements over unvested securities to protect the value of their unvested STI and LTI awards. Breach of the Securities Trading Policy will also be regarded by the Group as serious misconduct which may lead to disciplinary action and/or dismissal. Executive Contracts Remuneration arrangements for KMP are formalised in service agreements. Details of these agreements are provided below: Mr J Borshoff – Managing Director/CEO Scomac Management Services Pty Ltd as trustee for the Scomac Unit Trust (Scomac) has been appointed on a non-exclusive basis to provide the Company with management, strategic, technical and geological expertise and services through Scomac personnel which they employ or have access to (Scomac agreement). Consultant personnel who Scomac employ or have access to include Mr John Borshoff, the Company’s Managing Director and Chief Executive Officer, who has been appointed pursuant to the Scomac agreement. The terms of the Scomac agreement as it relates to Mr Borshoff as an employee of Scomac are formalised in the Scomac agreement and were disclosed to the ASX on 24 October 2016. The current terms are as follows: No fixed term, duration subject to termination provisions; Fee for services rendered of $410,000 per annum (plus GST); The service fee and/or structure to be reviewed annually; Eligibility to receive an annual short-term incentive of up to 25% of the Service Fee, at the discretion of the Company,
which can be paid in shares and/or cash; and Eligibility to participate in the Company’s Loan funded share plan as long and short-term incentive on terms determined
by the Board, subject to receiving any required or appropriate shareholder approval (details provided in Section 6(c) and Table 1(a)).
Termination provisions: 1. Scomac may terminate the agreement on 6 months’ prior notice to the Company; 2. The Company may terminate the agreement on 12 months’ prior notice to Scomac; 3. Where either party has terminated the agreement, the Company may pay Scomac an amount in lieu of the notice
in which case the agreement shall be at an end on such a payment; and 4. No notice of termination required by the Company for breach of a material term by Scomac.
Ms G Swaby – Executive Director The Company has entered into a Consultancy Agreement with Strategic Consultants Pty Ltd (Strategic) for consultancy services provided by Ms Swaby. The current terms are as follows: Commenced 24 October 2016 and continues until such time as terminated by either party; Consulting fee of $1,850 per day to a maximum of $300,000 per annum unless otherwise determined in accordance
with business needs; The fee and/or structure to be reviewed from time to time having regard to the performance of Ms Swaby and the
Company; Either party may terminate the agreement on one month’s notice to the other party; and Eligibility to participate in the Company’s Loan Share Plan as long and short-term incentive on terms determined by
the Board, subject to receiving any required or appropriate shareholder approval (details provided in Section 6(c) and Table 1(a)).
Both Mr Borshoff and Ms Swaby agreed to a 10% reduction in monthly fees for the period 1 April 2020 to 30 June 2020 as part of a full review of the Company’s activities. The review focussed on adjusting current workstreams to safeguard the Company’s key assets against the growing uncertainty and volatility caused by the COVID-19 pandemic. The 10% monthly reduction has been extended to 31 December 2020.

DIRECTORS’ REPORT (continued)
D e e p Y e l l o w L i m i t e d 3 4 2 0 2 0 A n n u a l R e p o r t
REMUNERATION REPORT (AUDITED) (continued) 5. Non-executive Director (NED) Fee Arrangements Remuneration Structure The structural component of NED fees is separate and distinct from Executive remuneration. It is designed to attract and retain directors of the highest calibre who can discharge the roles and responsibilities required in terms of good governance, strong oversight, independence and objectivity whilst incurring a cost that is acceptable to shareholders. NEDs do not participate in any performance-related incentive awards. Fee Policy The Remuneration Committee reviews NED fees annually against comparable companies. The Board also considers advice from external advisors when undertaking the review process, where applicable. NED fees consist of base fees and committee fees. The payment of additional fees for serving as Chair of a committee recognises the additional time commitment required by NEDs who act as Chair of a Board Committee. REMUNERATION REPORT (AUDITED) (continued) The table below summarises Board and Committee fees payable to NEDs for FY20 (inclusive of superannuation, where applicable):
Board fees Total $
Chair 90,000 NED 60,000 Committee fees
Chair Audit, Remuneration and Risk Committees 5,000 NEDs agreed to a 20% reduction and 30% deferral in monthly fees for the period 1 April 2020 to 30 June 2020 as part of a full review of the Company’s activities. The review focussed on adjusting current workstreams to safeguard the Company’s key assets against the growing uncertainty and volatility caused by the COVID-19 pandemic. The NEDs agreed on the reduction to be extended to 31 December 2020 at a rate of 10%. NEDs may be reimbursed for expenses reasonably incurred in attending to the Group’s affairs. NEDs do not receive retirement benefits, nor do they participate in any incentive programs. Shareholder approval was obtained during November 2019 to provide the NEDs with a component of equity-based remuneration in the form of Zero Exercise Price Options (ZEPOs) in addition to the fees summarised in the table above. On 18 December 2019 each NED was issued with 92,593 ZEPOs at an issue price of 27.5c for a total value of $25,463 per NED. Determination of Fees and Maximum Aggregate NED Fee Pool NED fees are determined within an aggregate NED fee pool limit, which is periodically determined by a general meeting. The latest determination was at the Annual General Meeting held on 19 November 2009 when shareholders approved a maximum amount which could be paid as NED fees of $450,000 per annum to be apportioned between the NEDs as determined by the Board. The maximum aggregate fee pool and the fee structure are reviewed on a periodic basis against fees paid to NEDs of comparable companies. The Board will not seek any increase for the NED pool at the 2020 AGM.

DIRECTORS’ REPORT (continued)
D e e p Y e l l o w L i m i t e d 3 5 2 0 1 9 A n n u a l R e p o r t
REMUNERATION REPORT (AUDITED) (continued) 6. Statutory and Share-based Reporting (a) Executive KMP remuneration for FY19 and FY20
Short-term benefits Post-employment
Long-term benefits Share-based payments Total remuneration
Performance Related (iii) %
Financial year
Fees Cash bonus (i) Superannuation
contributions Long service leave
Loan Plan Shares (ii)
Executive Directors J Borshoff 2020 399,753 102,500 359,511 861,764 37.9
2019 410,000 102,500 - - 386,110 898,610 45.1
G Swaby (iv) 2020 326,248 262,975 589,223 23.2
2019 302,475 - - - 180,235 482,710 20.7
Total Executive KMP 2020 726,001 102,500 - - 622,486 1,450,987
2019 712,475 102,500 - - 566,345 1,381,320
(i) Mr Borshoff earned 100% of his maximum cash STI opportunity for FY19 and FY20. (ii) Details in respect of the awards are provided in Table 1(a). (iii) Performance measures are based on the cash bonus and the market and participant performance vesting hurdles of Loan Plan Shares. (iv) Included in Ms Swaby remuneration of $302,475 for FY19 and $326,248 for FY20 are amounts of $32,000 and $26,000 respectively for services rendered in relation to incremental project work. There has been an
increase in fees as a result of increase in days worked from the prior year.

DIRECTORS’ REPORT (continued)
D e e p Y e l l o w L i m i t e d 3 6 2 0 2 0 A n n u a l R e p o r t
REMUNERATION REPORT (AUDITED) (continued) (b) NED Remuneration for FY19 and FY20
Short term benefits Post-employment Share-based
payments
Financial year
Board and Committee fees
Superannuation contributions
Total
Non-executive Directors R Brunovs 2020 82,423 7,830 25,463 115,716
2019 86,758 8,242 - 95,000
M Greene 2020 57,000 - 25,463 82,463
2019 60,000 - - 60,000
J Reid (i) 2020 61,750 - 25,463 87,213
2019 70,000 - - 70,000
C Urtel 2020 61,754 - 25,463 87,217
2019 65,000 - - 65,000
Total NED 2020 262,927 7,830 101,852 372,609
2019 281,758 8,242 - 290,000 (i) In line with annual remuneration of the Chair of the Audit and Remuneration Committees, Mr Reid received a back payment of $5,000
during FY19 as Chair of the Risk Committee for FY18.
(c) Disclosures Relating to Loan Plan Shares, Options and Ordinary Shares
This section sets out the additional disclosures required under the Corporations Act 2001. The table below disclose the Loan Plan Shares granted, vested and lapsed in relation to KMP during FY20. Loan Plan Shares carry voting rights and participants are entitled to dividends on unvested Loan Plan Shares. For so long as there is an outstanding loan balance in relation to the Loan Plan Shares, the participant irrevocably and unconditionally directs the Company to withhold all after-tax dividends in respect of the participants Loan Plan Shares and apply all amounts so withheld in repayment of the outstanding loan balance. Table 1(a): Loan Plan Shares: Granted, Vested and Divested during FY20
Number Value
Financial
year
Number issued Issue date
Fair Value per share at issue
date (cents)
Vesting date
Exercise price
(cents)
Expiry date (i)
Vested during year
Lapsed during year
(ii)
Issued
during year $A
Vested during year
A$ (iii)
Executive directors
J Borshoff 2018 240,000 6-Dec-17 20.9 12-Oct-19 32.4 5-Dec-27 - 240,000 - -
2018 60,000 6-Dec-17 29.7 12-Oct-19 32.4 5-Dec-27 60,000 - - -
2019 184,685 19-Nov-18 37.6 30-Nov-19 46.5 19-Nov-23 104,235 80,449 - -
2019 184,685 19-Nov-18 37.6 30-Nov-20 46.5 19-Nov-23 - 80,448 - -
2019 184,685 19-Nov-18 37.6 30-Nov-21 46.5 19-Nov-23 - 80,449 - -
2020 268,559 18-Dec-19 15.9 30-Nov-20 27.0 18-Dec-24 - - 42,701 -
2020 268,559 18-Dec-19 15.9 30-Nov-21 27.0 18-Dec-24 - - 42,701 -
2020 268,559 18-Dec-19 15.9 30-Nov-22 27.0 18-Dec-24 - - 42,701 -
2020 530,588 18-Dec-19 18.1 30-Nov-22 27.0 18-Dec-26 - - 96,036 -
2020 1,610,714 18-Dec-19 12.9 30-Nov-22 27.0 18-Dec-26 - - 207,782 -
G Swaby 2018 120,000 6-Dec-17 20.9 12-Oct-19 32.4 5-Dec-27 - 120,000 - -
2018 30,000 6-Dec-17 20.9 12-Oct-19 32.4 5-Dec-27 30,000 - - -
2019 175,676 19-Nov-18 37.6 30-Nov-19 46.5 19-Nov-23 175,676 - - -
2020 308,271 18-Dec-19 15.9 30-Nov-20 27.0 18-Dec-24 - - 49,015 -
2020 308,272 18-Dec-19 15.9 30-Nov-21 27.0 18-Dec-24 - - 49,015 -
2020 111,765 18-Dec-19 15.9 30-Nov-22 27.0 18-Dec-24 - - 17,771 -
2020 1,017,857 18-Dec-19 12.3 30-Nov-22 27.0 18-Dec-24 - - 125,196 -
(i) Loan Plan Shares do not have an expiry date. The limited recourse loan in respect of the Loan Plan Shares has to be fully paid between 5-10 years (determined with each issue) after grant date of the Loan Plan Shares. (ii) Shares forfeited as market price vesting conditions were not met. (iii) The value is based on the number of Loan Plan Shares vested multiplied by the share price on vesting dates and
reduced by the outstanding loan in relation to the Loan Plan Shares that vested. The outstanding loans were both in excess of the value obtained on vesting date.

DIRECTORS’ REPORT (continued)
D e e p Y e l l o w L i m i t e d 3 7 2 0 2 0 A n n u a l R e p o r t
REMUNERATION REPORT (AUDITED) (continued) Table 1(b): Share Options: Granted, Vested and Divested during FY20
Number Value
Financial
year
Number issued Issue Date
Fair Value per option
at issue date
(cents)
Vesting date
Exercise price
(cents)
Expiry date Vested during year
Issued
during year $A
Vested during year
A$ (ii)
Non-executive Directors
R Brunovs 2020 92,593 18-Dec-19 27.5 1-Jul-20 - 1-Jul-24 - 25,463 -
M Greene 2020 92,593 18-Dec-19 27.5 1-Jul-20 - 1-Jul-24 - 25,463 -
J Reid (i) 2020 92,593 18-Dec-19 27.5 1-Jul-20 - 1-Jul-24 - 25,463 -
C Urtel 2020 92,593 18-Dec-19 27.5 1-Jul-20 - 1-Jul-24 - 25,463 -
For details on the valuation of Loan Plan Shares and Options, including models and assumptions used, please refer to Note 20. The Loan Plan Shares and Options were provided at no cost to the recipients. There were no alterations to the terms and conditions of Loan Plan Shares or Options issued as remuneration since their grant/issue dates. Table 1(c): Shareholdings *
2020 Name
Balance at start of the year
Granted as remuneration (i)
Lapsed (ii)(iii) Net change other Balance at the end of the year
(iv) Executive directors J Borshoff (ii) 8,378,020 2,946,979 (1,531,346) 48,387 9,842,040 G Swaby (iii) 4,829,005 1,746,165 (120,000) 96,774 6,551,944 Non-executive Directors R Brunovs 484,370 - - - 484,370 M Greene 2,774,192 - - - 2,774,192 J Reid - - - - - C Urtel 842,832 - - - 842,832
* Includes shares held directly, indirectly and beneficially by KMP
(i) On 18 December 2019 Mr Borshoff and Ms Swaby were issued with Loan Plan Shares. Details in respect of the awards are provided in Table 1(a).
(ii) During FY20 1,290,000 shares were forfeited as market price vesting conditions were not met and 241,346 shares were forfeited as only 72% of performance measures were met during FY19. At reporting date, 5,529,416 shares have not vested.
(iii) During FY20 120,000 shares were forfeited as market price vesting conditions were not met. At reporting date, 3,250,895 shares have not vested
A participant may not trade shares acquired under the Loan Share Plan until the shares have vested, any imposed dealing restrictions have ended and the limited recourse loan in respect to those shares has been paid in full.
Table 1(d): Option holdings
2020 Name
Balance at start of the year
Granted as remuneration
Balance at the end of the year
Vested and exercisable
Non-executive Directors R Brunovs - 92,593 92,593 92,593 M Greene - 92,593 92,593 92,593 J Reid - 92,593 92,593 92,593 C Urtel - 92,593 92,593 92,593
(d) Other Transactions and Balances with KMP and their Related Parties Details and terms and conditions of other transactions with KMP and their related parties: Scomac Management Services Pty Ltd as trustee for the Scomac Unit Trust (Scomac or Consultant) has been appointed on a non-exclusive basis to provide the Group with management, strategic, technical and geological expertise and services through the Consultant personnel they employ or have access to (Scomac agreement). Mr Borshoff has a financial interest in Scomac. During the year ended 30 June 2020 Scomac billed the Company $1,035,968, inclusive of GST and on-costs (2019:$737,113), for technical and geological services (excluding Mr Borshoff) on normal commercial terms and conditions. These amounts are not included in the remuneration tables above. Fees paid to Scomac in relation to services provided by Mr Borshoff as Managing Director are detailed in section 6(a). An amount of $81,687 was outstanding at 30 June 2020 (2019:$54,486). The amount for other services was recognised as non-current asset: capitalised mineral exploration and evaluation expenditure.

DIRECTORS’ REPORT (continued)
D e e p Y e l l o w L i m i t e d 3 8 2 0 2 0 A n n u a l R e p o r t
REMUNERATION REPORT (AUDITED) (continued) 7. Actual Remuneration Paid to KMP in FY20 The actual remuneration paid to executives in FY20 is set out below. This information is considered to be relevant as it provides shareholders with a view of the remuneration actually paid to KMP for performance in FY20 and the value of LTIs that vested during the period. This differs from the remuneration details prepared in accordance with statutory obligations and accounting standards on pages 35 and 36 of this report, as those details include the values of Performance Rights that have been awarded but which may or may not vest.
2020 Name
Fixed cash remuneration (i)
STI (FY19 performance) (ii)
LTI award vested (iii) Total remuneration
received Executive director J Borshoff 399,753 102,500 - 502,253 G Swaby 326,248 - - 326,248 Non-executive Directors R Brunovs 83,128 - - 83,128 M Greene 52,500 - - 52,500 J Reid 56,875 - - 56,875 C Urtel 56,875 - - 56,875
(i) Service fee. (ii) The maximum STI was awarded to the Managing Director for FY19 but only paid during FY20. (iii) The value is based on the number of Loan Plan Shares vested multiplied by the share price on vesting dates and reduced by the
outstanding loan in relation to the Loan Plan Shares that vested. The outstanding loans were both in excess of the value obtained on vesting date, therefore no remuneration was earned.
End of Remuneration Report (Audited) This report is made in accordance with a resolution of the Directors. DATED at Perth this 25th day of September 2020.
John Borshoff Managing Director

A member firm of Ernst & Young Global Limited Liability limited by a scheme approved under Professional Standards Legislation
RK:DA:DYL:008
Ernst & Young 11 Mounts Bay Road Perth WA 6000 Australia GPO Box M939 Perth WA 6843
Tel: +61 8 9429 2222 Fax: +61 8 9429 2436 ey.com/au
Auditor’s independence declaration to the directors of Deep Yellow Limited
As lead auditor for the audit of the financial report of Deep Yellow Limited for the financial year ended
30 June 2020, I declare to the best of my knowledge and belief, there have been:
a. No contraventions of the auditor independence requirements of the Corporations Act 2001 in
relation to the audit; and
b. No contraventions of any applicable code of professional conduct in relation to the audit.
This declaration is in respect of Deep Yellow Limited and the entities it controlled during the financial
year.
Ernst & Young
Robert A Kirkby
Partner
Perth
25 September 2020
39

CONSOLIDATED STATEMENT OF PROFIT OR LOSS AND OTHER COMPREHENSIVE INCOME
FOR THE YEAR ENDED 30 JUNE 2020
D e e p Y e l l o w L i m i t e d 4 0 2 0 2 0 A n n u a l R e p o r t
Note
Consolidated 2020 2019 $ $
Interest and other income 7(a) 257,455 225,332 Revenue from contracts with customers 7(b) 77,199 119,315
Revenue
334,654 344,647
Depreciation and amortisation expenses 8 (215,812) (92,911) Interest expense 8 (26,697) - Marketing expenses (222,461) (142,177) Occupancy expenses (94,324) (209,486) Administrative expenses 8 (1,930,685) (2,068,920) Employee expenses 8 (2,033,839) (1,626,841) Reversal of prior year impairment of capitalised mineral exploration and evaluation expenditure
14 7,100,920 -
Impairment of capitalised mineral exploration and evaluation expenditure
14 (36,893) (18,640)
Profit/(Loss) before income tax
2,874,863 (3,814,328)
Income tax expense 9(a)(b) - -
Profit/(Loss) for the year after income tax
2,874,863 (3,814,328)
Other comprehensive income Items to be reclassified to profit and loss in subsequent periods, net of tax
Foreign currency translation (loss)/gain 17(d) (6,269,172) 921,147
Other comprehensive (loss)/income for the year, net of tax (6,269,172) 921,147
Total comprehensive loss for the year, net of tax (3,394,309) (2,893,181)
Earnings per share for loss attributable to the ordinary equity holders of the Company.
Cents Cents
Basic profit/(loss) per share
10
1.19
(1.90)
Diluted profit/(loss) per share
10
1.19
(1.90)
The above Consolidated Statement of Profit or Loss and Other Comprehensive Income should be read in conjunction with the accompanying notes.

CONSOLIDATED STATEMENT OF FINANCIAL POSITION AS AT 30 JUNE 2020
D e e p Y e l l o w L i m i t e d 4 1 2 0 2 0 A n n u a l R e p o r t
Note Consolidated
2020 2019 $ $
ASSETS Current assets Cash and cash equivalents 11 12,116,972 14,975,063 Receivables 12(a) 298,265 461,989 Other assets 12(b) 187,567 255,707
Total current assets
12,602,804
15,692,759
Non-current assets Right-of-use asset 16 617,015 - Property, plant and equipment 13 518,897 592,797 Capitalised mineral exploration and evaluation expenditure 14 35,415,745 31,831,939
Total non-current assets
36,551,657
32,424,736
Total assets
49,154,461
48,117,495
LIABILITIES Current liabilities Trade and other payables 15 492,605 509,661 Employee provisions 57,562 64,360 Lease liabilities 19 99,221 -
Total current liabilities
649,388
574,021
Non-current liabilities Employee provisions 48,794 54,154 Lease liabilities 19 536,664 -
Total non-current liabilities
585,458
54,154
Total liabilities
1,234,846
628,175
Net assets
47,919,615
47,489,320
EQUITY Issued equity 17(a) 249,753,196 247,264,524 Accumulated losses 17(d) (193,266,333) (196,141,196) Employee equity benefits reserve 17(d) 13,476,273 12,140,341 Foreign currency translation reserve 17(d) (22,043,521) (15,774,349)
Total equity
47,919,615
47,489,320
The above Consolidated Statement of Financial Position should be read in conjunction with the accompanying notes.

STATEMENT OF CHANGES IN EQUITY FOR THE FINANCIAL YEAR ENDED 30 JUNE 2020
D e e p Y e l l o w L i m i t e d 4 2 2 0 2 0 A n n u a l R e p o r t
Issued Equity Accumulated
losses
Employee equity benefits’
reserve
Foreign currency translation
reserve Total Equity
$ $ $ $ $
At 1 July 2019 247,264,524 (196,141,196) 12,140,341 (15,774,349) 47,489,320
Profit for the period - 2,874,863 - - 2,874,863 Other comprehensive loss - - - (6,269,172) (6,269,172)
Total comprehensive loss for the period
- 2,874,863 - (6,269,172) (3,394,309)
Issue of share capital 2,289,507 - - - 2,289,507 Capital raising costs (26,540) - - - (26,540) Vesting of Performance Rights 225,705 - (225,705) - - Share-based payments - - 1,561,637 - 1,561,637 At 30 June 2020 249,753,196 (193,266,333) 13,476,273 (22,043,521) 47,919,615
Issued Equity Accumulated
losses
Employee equity benefits’
reserve
Foreign currency translation
reserve Total Equity
$ $ $ $ $
At 1 July 2018 238,722,162 (192,326,868) 11,086,143 (16,695,496) 40,785,941
Loss for the period - (3,814,328) - - (3,814,328) Other comprehensive income - - - 921,147 921,147
Total comprehensive loss for the period
- (3,814,328) - 921,147 (2,893,181)
Issue of share capital 9,000,000 - - - 9,000,000 Exercise of Options 2,500 - - - 2,500 Capital raising costs (562,023) - - - (562,023) Vesting of Performance Rights 101,885 - (101,885) - - Share-based payments - - 1,038,359 - 1,156,083 At 30 June 2019 247,264,524 (196,141,196) 12,140,341 (15,774,349) 47,489,320
The above Statement of Changes in Equity should be read in conjunction with the accompanying notes.

CASH FLOW STATEMENT FOR THE FINANCIAL YEAR ENDED 30 JUNE 2020
D e e p Y e l l o w L i m i t e d 4 3 2 0 2 0 A n n u a l R e p o r t
Note
Consolidated 2020 2019 $ $
Cash flows from operating activities Interest received 245,789 270,131 Payments to suppliers and employees (2,549,322) (2,827,139) Research and development tax incentive 7(a)(b) - 43,577 COVID-19 employer stimulus 7(a)(b) 36,205 - Other receipts 7(a)(b) 77 119,476 Interest paid 8 (26,697) -
Net cash used in operating activities
11
(2,293,948)
(2,393,955)
Cash flows from investing activities Exploration expenditure (3,068,655) (2,949,508) Payments for property, plant and equipment (133,848) (96,978) Proceeds from sale of property, plant and equipment - 4,308 Other (JV earn-in contribution) 996,761 1,155,715
Net cash used in investing activities
(2,205,742)
(1,886,463)
Cash flows from financing activities Proceeds from the issue of shares 2,289,507 9,002,500 Other (capital raising costs) (57,131) (531,432) Payment of lease liabilities (95,041) -
Net cash from financing activities
2,137,335
8,471,068
Net (decrease)/increase in cash and cash equivalents
(2,362,355)
4,190,650
Effects on cash of foreign exchange (495,736) 94,160 Cash and cash equivalents at the beginning of the financial year 14,975,063 10,690,253
Cash and cash equivalents at the end of the financial year
11
12,116,972
14,975,063
The above Cash Flow Statement should be read in conjunction with the accompanying notes.

NOTES TO THE CONSOLIDATED FINANCIAL STATEMENTS FOR THE FINANCIAL YEAR ENDED 30 JUNE 2020 (continued)
D e e p Y e l l o w L i m i t e d 4 4 2 0 2 0 A n n u a l R e p o r t
Note 1 Corporation information The consolidated financial statements of Deep Yellow Limited and its subsidiaries (the Group) for the year ended 30 June 2020 were authorised for issue in accordance with a resolution of Directors on 23 September 2020, subject to minor changes. Deep Yellow Limited is a for profit company limited by shares incorporated and domiciled in Australia whose shares are publicly traded on the Australian Securities Exchange. Information on the nature of the operations and principal activities of the Group are described in the Directors’ Report. Information on the Group’s structure is provided in Note 6 and information on other related party relationships is provided in Note 22. Note 2 Significant accounting policies (a) Basis of preparation The financial report is a general-purpose financial report, which has been prepared in accordance with the requirements of the Corporations Act 2001, Australian Accounting Standards and other authoritative pronouncements of the Australian Accounting Standards Board. The financial report also complies with International Financial reporting Standards (IFRS) as issued by the International Accounting Standards Board. The financial report has been prepared on a historical cost basis. The financial report is presented in Australian dollars and all values are rounded to the nearest dollar. The consolidated financial statements provide comparative information in respect of the previous period. There has been no retrospective application of accounting policies as a result of the adoption of new accounting standards therefore no restatement of financial statements required for the previous period. (b) Basis of consolidation The consolidated financial statements comprise the financial statements of Deep Yellow Limited and its subsidiaries as at and for the year ended 30 June 2020 (the Group). Control is achieved when the Group is exposed, or has the rights, to variable returns from its involvement with the investee and has the ability to affect those returns through its power over the investee. Specifically, the Group controls an investee if and only if the Group has: ► power over the investee (i.e. existing rights that give it the current ability to direct the relevant activities of the investee); ► exposure, or rights, to variable returns from its involvement with the investee; and ► the ability to use its power over the investee to affect its returns.
Generally, there is a presumption that a majority of voting rights results in control. To support this presumption, and when the Group has less than a majority of the voting or similar rights of an investee, the Group considers all relevant facts and circumstances in assessing whether it has power over an investee, including: ► the contractual arrangement with the other vote holders of the investee; ► rights arising from other contractual arrangements; and ► the Group’s voting rights and potential voting rights. The Group re-assesses whether or not it controls an investee if facts and circumstances indicate that there are changes to one or more of the three elements of control. Consolidation of a subsidiary begins when the Group obtains control over the subsidiary and ceases when the Group loses control of the subsidiary. Assets, liabilities, income and expenses of a subsidiary acquired or disposed of during the year are included in the consolidated financial statements from the date the Group gains control until the date the Group ceases to control the subsidiary. Profit or loss and each component of Other Comprehensive Income (OCI) are attributed to the equity holders of the Group and to the non-controlling interests, even if this results in the non-controlling interests having a deficit balance. When necessary, adjustments are made to the financial statements of subsidiaries to bring their accounting policies into line with the Group’s accounting policies. All intragroup assets and liabilities, equity, income, expenses and cash flows relating to transactions between members of the Group are eliminated in full on consolidation. A change in ownership interest in a subsidiary, without a loss of control, is accounted for as an equity transaction. If the Group loses control over a subsidiary, it derecognises the related assets (including goodwill), liabilities, non-controlling interest and other components of equity while any resultant gain or loss is recognised in profit or loss. Any investment retained is recognised at fair value.

NOTES TO THE CONSOLIDATED FINANCIAL STATEMENTS FOR THE FINANCIAL YEAR ENDED 30 JUNE 2020 (continued)
D e e p Y e l l o w L i m i t e d 4 5 2 0 2 0 A n n u a l R e p o r t
(c) Summary of significant accounting policies
(i) Business combinations Business combinations are accounted for using the acquisition method. The cost of an acquisition is measured as the aggregate of the consideration transferred, which is measured at acquisition date fair value, and the amount of any non-controlling interests in the acquire. For each business combination, the Group elects whether to measure the non-controlling interests in the acquiree at fair value or at the proportionate share of the acquiree’s identifiable net assets. Acquisition-related costs are expensed as incurred and included in administrative expenses. When the Group acquires a business, it assesses the financial assets and liabilities assumed for appropriate classification and designation in accordance with the contractual terms, economic circumstances and pertinent conditions as at the acquisition date. This includes the separation of embedded derivatives in host contracts by the acquiree. Any contingent consideration to be transferred by the acquirer will be recognised at fair value at the acquisition date. Contingent consideration classified as equity is not remeasured and its subsequent settlement is accounted for within equity. Contingent consideration classified as an asset or liability that is a financial instrument and within the scope of IFRS 9 Financial Instruments, is measured at fair value with the changes in fair value recognised in the statement of profit and loss in accordance with IFRS 9. Other contingent consideration that is not within the scope of IFRS 9 is measured at fair value at each reporting date with changes in fair value recognised in profit or loss. (ii) Current versus non-current classification The Group presents assets and liabilities in the Statement of Financial Position based on current/non-current classification. An asset is current when it is: Expected to be realised or intended to sold or consumed in the Group’s normal operating cycle; Held primarily for the purpose of trading; Expected to be realised within twelve months after the reporting period; or Cash or a cash equivalent unless restricted from being exchanged or used to settle a liability for at least twelve months
after the reporting period.
The Group classifies all other assets as non-current. A liability is current when: It is expected to be settled in the Group’s normal operating cycle; It is held primarily for the purpose of trading; It is due to be settled within twelve months after the reporting period; or There is no unconditional right to defer the settlement of the liability for at least twelve months after the reporting period.
The Group classifies all other liabilities as non-current. Deferred tax assets and liabilities are classified as non-current assets and liabilities. (iii) Revenue from Contracts with Customers The Group manages the NJV to which they provide administration services and the right to use the Group’s assets for exploration-related activities. Asset recharges and administration fee earned Revenue from asset recharges and administration fee is recognised at a point in time were the assets were provided for use and administration services rendered. This signifies complete satisfaction of the service as the benefits were received and consumed throughout the month. The consideration on the contract includes a fixed amount per asset category made available for use through-out a service month. It is also entitled to a fixed percentage of administration fee based on the monthly direct costs of operations to which the administration service is provided. The normal credit term is usually 30 days from complete satisfaction of the service, ie. last day of the month. This results in a receivable that represents the Group’s right to an amount that is unconditional. Refer Note 2(c)(x) Financial instruments – Financial assets. Contract balances Trade receivables – A receivable is recognised if an amount of consideration that is unconditional is due from the customer (i.e., only the passage of time is required before payment of the consideration is due). Refer to accounting policies of financial assets in Note 2(c)(x).

NOTES TO THE CONSOLIDATED FINANCIAL STATEMENTS FOR THE FINANCIAL YEAR ENDED 30 JUNE 2020 (continued)
D e e p Y e l l o w L i m i t e d 4 6 2 0 2 0 A n n u a l R e p o r t
(c) Summary of significant accounting policies (continued) (iv) Government grants Government grants are recognised where there is reasonable assurance that the grant will be received, and all attached conditions will be complied with. When the grant relates to an expense item, it is recognised as income on a systematic basis over the periods that the related costs, for which it is intended to compensate, are expensed. When the grant relates to an asset, it is recognised as income in equal amounts over the expected useful life of the related asset. When the Group receives grants of non-monetary assets, the asset and the grant are recorded at nominal amounts and released to profit or loss over the expected useful life of the asset, based on the pattern of consumption of the benefits of the underlying asset by equal annual instalments.
(v) Interest income
Interest income is recognised as it accrues using the effective interest method. This is a method of calculating the amortised cost of a financial asset and allocating the interest income over the relevant period using the effective interest rate, which is the rate that exactly discounts estimated future cash receipts through the expected life of the financial asset to the net carrying amount of the financial asset.
(vi) Income Tax
Current income tax
Current income tax assets and liabilities are measured at the amount expected to be recovered from or paid to the taxation authorities. The tax rates and tax laws used to compute the amount are those that are enacted or substantively enacted at the reporting date in the countries where the Group operates and generates taxable income.
Management periodically evaluates positions taken in tax returns with respect to situations in which applicable tax regulations are subject to interpretation and assess if appropriate provisions are required. Deferred tax Deferred tax is provided using the liability method on temporary differences between the tax bases of assets and liabilities and their carrying amounts for financial reporting purposes at the reporting date. Deferred tax liabilities are recognised for all taxable temporary differences, except:
When the deferred tax liability arises from the initial recognition of goodwill or an asset or liability in a transaction that is not a business combination and, at the time of the transaction, affects neither the accounting profit nor taxable profit or loss; and
In respect of taxable temporary differences associated with investments in subsidiaries, associates and interests in joint arrangements, when the timing of the reversal of the temporary differences can be controlled and it is probable that the temporary differences will not reverse in the foreseeable future
Deferred tax assets are recognised for all deductible temporary differences, the carry forward of unused tax credits and any unused tax losses. Deferred tax assets are recognised to the extent that it is probable that taxable profit will be available against which the deductible temporary differences, and the carry forward of unused tax credits and unused tax losses can be utilised, except:
When the deferred tax asset relating to the deductible temporary difference arises from the initial recognition of an asset or liability in a transaction that is not a business combination and, at the time of the transaction, affects neither the accounting profit nor taxable profit or loss; and
In respect of deductible temporary differences associated with investments in subsidiaries, associates and interests in joint arrangements, deferred tax assets are recognised only to the extent that it is probable that the temporary differences will reverse in the foreseeable future and taxable profit will be available against which the temporary differences can be utilised.
The carrying amount of deferred tax assets is reviewed at each reporting date and reduced to the extent that it is no longer probable that sufficient taxable profit will be available to allow all or part of the deferred tax asset to be utilised. Unrecognised deferred tax assets are re-assessed at each reporting date and are recognised to the extent that it has become probable that future taxable profits will allow the deferred tax asset to be recovered Deferred tax assets and liabilities are measured at the tax rates that are expected to apply in the year when the asset is realised or the liability is settled, based on tax rates (and tax laws) that have been enacted or substantively enacted at the reporting date. Deferred tax relating to items recognised outside profit or loss is recognised outside profit or loss. Deferred tax items are recognised in correlation to the underlying transaction either in OCI or directly in equity.
NOTES TO THE CONSOLIDATED FINANCIAL STATEMENTS FOR THE FINANCIAL YEAR ENDED 30 JUNE 2020 (continued)
D e e p Y e l l o w L i m i t e d 4 7 2 0 2 0 A n n u a l R e p o r t
(c) Summary of significant accounting policies (continued) The Group offsets deferred tax assets and deferred tax liabilities if and only if it has a legally enforceable right to set off current tax assets and current tax liabilities and the deferred tax assets and deferred tax liabilities relate to income taxes levied by the same taxation authority on either the same taxable entity or different taxable entities which intend either to settle current tax liabilities and assets on a net basis, or to realise the assets and settle the liabilities simultaneously, in each future period in which significant amounts of deferred tax liabilities or assets are expected to be settled or recovered. Tax consolidation
(i) Members of the tax consolidated group and the tax sharing arrangement Deep Yellow Limited and its 100% owned Australian resident subsidiaries formed a tax consolidated group with effect from 2 February 2007. Deep Yellow Limited is the head entity of the tax consolidated group. Members of the group have entered into a tax sharing agreement that provides for the allocation of income tax liabilities between the entities should the head entity default on its tax payment obligations. No amounts have been recognised in the financial statements in respect of this agreement on the basis that the possibility of default is remote. The amounts receivable or payable under the tax funding agreement are due upon receipt of the funding advice from the head entity, which is issued as soon as practicable after the end of each financial year. The head entity may also require payment of interim funding amounts to assist with its obligations to pay tax instalments. (ii) Tax effect accounting by members of the tax consolidated group
Measurement method adopted under UIG 1052 Tax Consolidated Accounting The head entity and the controlled entities in the tax consolidated group continue to account for their own current and deferred tax amounts. The Group has applied the group allocation approach in determining the appropriate amount of current taxes and deferred taxes to allocate to members of the tax consolidated group. The current and deferred tax amounts are measured in a systematic manner that is consistent with the broad principles in AASB 112 Income Taxes. Goods and services tax (GST) Revenues, expenses and assets are recognised net of the amount of associated GST, unless the GST incurred is not recoverable from the taxation authority. In this case it is recognised as part of the cost of acquisition of the asset or as a part of the expense. Receivables and payables are stated inclusive of the amount of GST receivable or payable. The net amount of GST recoverable from, or payable to, the taxation authority is included with other receivables or payables in the Statement of Financial Position. Cash flows are presented on a gross basis. The GST components of cash flows arising from investing or financing activities which are recoverable from, or payable to, the taxation authority, are presented as operating cash flows. Commitments and contingencies are disclosed net of the amount of GST recoverable from, or payable to, the taxation authority. (vii) Foreign currency translation
The functional currencies of Deep Yellow Limited and its overseas controlled entities are Australian dollars, Namibian dollars and US dollars. These consolidated financial statements are presented in Australian dollars being the functional currency of the parent entity. Transactions and balances Transactions in foreign currencies are initially recorded in the functional currency by applying the exchange rates ruling at the date of the transaction. Monetary assets and liabilities denominated in foreign currencies are retranslated at the rate of exchange prevailing at balance date. Non-monetary items that are measured in terms of historical cost in a foreign currency are translated using the exchange rate as at the date of the initial transaction. Exchange differences arising from these procedures are recognised in profit and loss for the year. Group companies On consolidation, the assets and liabilities of foreign operations are translated into Australian dollars at the rate prevailing at the reporting date and their statements of profit or loss are translated at the average exchange rate for the year. The exchange differences arising on translation for consolidation purposes are recognised in other comprehensive income. On disposal of a foreign operation, the component of other comprehensive income relating to that particular foreign operation is recognised in profit or loss.

NOTES TO THE CONSOLIDATED FINANCIAL STATEMENTS FOR THE FINANCIAL YEAR ENDED 30 JUNE 2020 (continued)
D e e p Y e l l o w L i m i t e d 4 8 2 0 2 0 A n n u a l R e p o r t
(c) Summary of significant accounting policies (continued) (viii) Property, plant and equipment Property, plant and equipment is stated at historical cost less accumulated depreciation and impairment losses, if any. Historical cost includes expenditure that is directly attributable to the acquisition of the assets. Subsequent costs are included in the asset’s carrying amount or recognised as a separate asset, as appropriate, only when it is probable that future economic benefits associated with the item will flow to the Group and the cost of the item can be measured reliably. All other repairs and maintenance are charged to the profit or loss during the financial period in which they are incurred. Depreciation of property, plant and equipment is calculated using the written down value method or straight-line method to allocate their cost, net of residual values, over their estimated useful lives, as follows:
Office equipment and fittings 12.5% – 33% of cost Site equipment 25% of cost Motor vehicles 25% of cost Leasehold property and buildings 5% of cost
The asset’s residual values and useful lives are reviewed, and adjusted if appropriate, at each balance date. An asset’s carrying amount is written down immediately to its recoverable amount if the asset’s carrying amount is greater than its estimated recoverable amount (Note 2 (c)(xii)). An item of property, plant and equipment is derecognised on disposal or when no further future economic benefits are expected from its use. Any gain or loss arising on derecognition of an asset (calculated as the difference between net disposal proceeds and the carrying amount of the asset) is included in profit and loss in the year the asset is derecognised. (ix) Leases The Group has in prior years classified its leases at inception date either as a finance lease or an operating lease. A lease that transferred substantially all the risks and rewards incidental to ownership to the Group was classified as a finance lease. A lease other than a finance lease where substantially all the risks and benefits remained with the lessor was classified as an operating lease. Finance leases were capitalised at the commencement of the lease at the inception date fair value of the leased property or, if lower, at the present value of the minimum lease payments. Lease payments were apportioned between interest (recognised as finance costs) and reduction of the lease liability. In an operating lease, the leased property was not capitalised, and the lease payments were recognised as rent expense in the statement of profit or loss on a straight-line basis over the lease term. Lease incentives under operating leases were recognised in the profit and loss on a straight-line basis as an integral part of the total lease expense. Any prepaid rent and accrued rent were recognised under Prepayments and Trade and other payables, respectively. Group as a lessee The Group applies a single recognition and measurement approach for all leases, except for short-term leases and leases of low-value assets. The Group recognises lease liabilities to make lease payments and right-of-use assets representing the right to use the underlying assets i) Right-of-use assets The Group recognises right-of-use assets at the commencement date of the lease (i.e., the date the underlying asset is available for use). Right-of-use assets are measured at cost, less any accumulated depreciation and impairment losses, and adjusted for any remeasurement of lease liabilities. The cost of right-of-use assets includes the amount of lease liabilities recognised, initial direct costs incurred, and lease payments made at or before the commencement date less any lease incentives received. Right-of-use assets are depreciated on a straight-line basis over the shorter of the lease term and the estimated useful lives of the assets. If ownership of the leased asset transfers to the Group at the end of the lease term or the cost reflects the exercise of a purchase option, depreciation is calculated using the estimated useful life of the asset. The right-of-use assets are also subject to impairment. Refer Note 2(c)(xii) Impairment of non-financial assets. ii) Lease liabilities At the commencement date of the lease, the Group recognises lease liabilities measured at the present value of lease payments to be made over the lease term. The lease payments include fixed payments (including in substance fixed payments) less any lease incentives receivable, variable lease payments that depend on an index or a rate, and amounts expected to be paid under residual value guarantees. The lease payments also include the exercise price of a purchase option reasonably certain to be exercised by the Group and payments of penalties for terminating the lease, if the lease term reflects the Group exercising the option to terminate. Variable lease payments that do not depend on an index or a rate are recognised as expenses (unless they are incurred to produce inventories) in the period in which the event or condition that triggers the payment occurs. In calculating the present value of lease payments, the Group uses its incremental borrowing rate at the lease commencement date because the interest rate implicit in the lease is not readily determinable. After the commencement date, the amount of lease liabilities is increased to reflect the accretion of interest and reduced for the lease payments made. In addition, the carrying amount of lease liabilities is remeasured if there is a modification, a change in the lease term, a change in the lease payments (e.g., changes to future payments resulting from a change in an index or rate used to determine such lease payments) or a change in the assessment of an option to purchase the underlying asset. (see Note 16).

NOTES TO THE CONSOLIDATED FINANCIAL STATEMENTS FOR THE FINANCIAL YEAR ENDED 30 JUNE 2020 (continued)
D e e p Y e l l o w L i m i t e d 4 9 2 0 2 0 A n n u a l R e p o r t
(c) Summary of significant accounting policies (continued)
i) Short-term leases and leases of low-value assets The Group applies the short-term lease recognition exemption to its short-term leases of machinery and equipment (i.e., those leases that have a lease term of 12 months or less from the commencement date and do not contain a purchase option). It also applies the lease of low-value assets recognition exemption to leases of office equipment that are low value. Lease payments on short-term leases and leases of low value assets are recognised as expense on a straight-line basis over the lease term. (x) Financial instruments – Financial assets
Initial recognition and measurement
Financial assets are classified, at initial recognition, as subsequently measured at amortised cost, fair value through other comprehensive income (OCI), and fair value through profit or loss.
The classification of financial assets at initial recognition depends on the financial asset’s contractual cash flow characteristics and the Group’s business model for managing them. The Group initially measures a financial asset at its fair value plus transactions costs. Trade receivables that do not contain a significant financing component or for which the Group has applied the practical expedient are measured at the transaction price determined under AASB 15. Refer to the accounting policies in Note 2(c)(iii) Revenue from Contracts with Customers. They are measured, at initial recognition, at fair value plus transaction costs, if any.
In order for a financial asset to be classified and measured at amortised cost, it needs to give rise to cash flows that are ‘solely payments of principal and interest (SPPI)’ on the principal amount outstanding. This assessment is referred to as the SPPI test and is performed at an instrument level.
Subsequent measurement
For purposes of subsequent measurement, financial assets are classified at amortised cost (debt instrument), fair value through OCI with recycling of cumulative gains and losses (debt instruments), designated at fair value through OCI with no recycling of cumulative gains and losses upon derecognition (equity instruments) or at fair value through profit or loss.
Other receivables are measured at amortised cost if both of the following conditions are met:
it is held within a business model with the objective to collect contractual cash flows; and the contractual terms give rise on specified dates to cash flows that are solely payments of principal and interest on
the principal amount outstanding, where applicable.
It is subsequently measured using the effective interest (EIR) method and are subject to impairment with gains and losses recognised in profit and loss when the asset is derecognised, modified or impaired.
Derecognition A financial asset (or, where applicable, a part of a financial asset or part of a group of similar financial assets) is primarily derecognised (i.e. removed from the Group’s Consolidated Statement of Financial Position) when: the right to receive cash flows from the asset have expired; or the Group has transferred its rights to receive cash flows from the asset or has assumed an obligation to pay the
received cash flows in full without material delay to a third party under a ‘pass-through’ arrangement; and either (a) the Company has transferred substantially all the risks and rewards of the asset, or (b) the Company has neither transferred nor retained substantially all the risks and rewards of the asset, but has transferred control of the asset.
When the Group has transferred its rights to receive cash flows from an asset or has entered into a pass-through arrangement, it evaluates if, and to what extent, it has retained the risks and rewards of ownership. When it has neither transferred nor retained substantially all of the risks and rewards of the asset, nor transferred control of the asset, the Group continues to recognise the transferred asset to the extent of its continuing involvement. In that case, the Group also recognises an associated liability. The transferred asset and the associated liability are measured on a basis that reflects the rights and obligations that the Group has retained.
Continuing involvement that takes the form of a guarantee over the transferred asset is measured at the lower of the original carrying amount of the asset and the maximum amount of consideration that the Group could be required to repay
Impairment of financial assets
The Company recognises a loss allowance for expected credit losses on other receivables, if any. At each reporting date, the Group assesses whether financial assets carried at amortised cost are credit impaired. A financial asset is credit-impaired when one or more events that have a detrimental impact on the estimated future cash flows of the financial asset have occurred.

NOTES TO THE CONSOLIDATED FINANCIAL STATEMENTS FOR THE FINANCIAL YEAR ENDED 30 JUNE 2020 (continued)
D e e p Y e l l o w L i m i t e d 5 0 2 0 2 0 A n n u a l R e p o r t
(c) Summary of significant accounting policies (continued) The Group recognises an allowance for expected credit losses (ECLs) for all debt instruments not held at fair value through profit or loss. ECLs are based on the difference between the contractual cash flows due in accordance with the contract and all the cash flows that the Group expects to receive, discounted at an approximation of the original effective interest rate. The expected cash flows will include cash flows from the sale of collateral held or other credit enhancements that are integral to the contractual terms.
ECLs are recognised in two stages. For credit exposures for which there has not been a significant increase in credit risk since initial recognition, ECLs are provided for credit losses that result from default events that are possible within the next 12-months (a 12-month ECL). For those credit exposures for which there has been a significant increase in credit risk since initial recognition, a loss allowance is required for credit losses expected over the remaining life of the exposure, irrespective of the timing of the default (a lifetime ECL). For other receivables, the Group applies a simplified approach in calculating ECLs. Therefore, the Group does not track changes in credit risk, but instead recognises a loss allowance based on lifetime ECLs at each reporting date. The Group has established a provision matrix that is based on its historical credit loss experience, adjusted for forward-looking factors specific to the debtors and the economic environment. The Group considers a financial asset in default when contractual payments are 90 days past due, excluding amounts owed from Government Departments where other information are also considered. However, in certain cases, the Group may also consider a financial asset to be in default when internal or external information indicates that the Group is unlikely to receive the outstanding contractual amounts in full before taking into account any credit enhancements held by the Group. A financial asset is written off when there is no reasonable expectation of recovering the contractual cash flows. (xi) Financial instruments – Financial liabilities Initial recognition and measurement Financial liabilities are classified, at initial recognition, as financial liabilities at fair value through profit or loss, loans and borrowings, payables, or as derivatives designated as hedging instruments in an effective hedge, as appropriate. All financial liabilities are recognised initially at fair value and, in the case of loans and borrowings and payables, net of directly attributable transaction costs. The Group’s financial liabilities consist of trade and other payables. Subsequent measurement For purposes of subsequent measurement, financial liabilities are classified at fair value through profit or loss or loans and borrowings. After initial recognition trade and other payables are subsequently measured at amortised cost using the effective interest rate (EIR) method, if applicable. Gains and losses are recognised in profit or loss when the liabilities are derecognised as well as through the EIR amortisation process. Amortised cost is calculated by taking into account any discount or premium on acquisition and fees or costs that are an integral part of the EIR. The EIR amortisation is included as finance costs in the statement of profit or loss. For more information, refer to Note 19: Financial Assets and Liabilities. Derecognition A financial liability is derecognised when the obligation under the liability is discharged or cancelled or expires. When an existing financial liability is replaced by another from the same lender on substantially different terms, or the terms of an existing liability are substantially modified, such an exchange or modification is treated as the derecognition of the original liability and the recognition of a new liability. The difference in the respective carrying amounts is recognised in the statement of comprehensive income. Offsetting of financial instruments Financial assets and financial liabilities are offset and the net amount is reported in the consolidated statement of financial position if there is a currently enforceable legal right to offset the recognised amounts and there is an intention to settle on a net basis, to realise the assets and settle the liabilities simultaneously.

NOTES TO THE CONSOLIDATED FINANCIAL STATEMENTS FOR THE FINANCIAL YEAR ENDED 30 JUNE 2020 (continued)
D e e p Y e l l o w L i m i t e d 5 1 2 0 2 0 A n n u a l R e p o r t
(c) Summary of significant accounting policies (continued) (xii) Impairment of non-financial assets The Group assesses at each reporting date whether there is an indication that an asset may be impaired. If any such indication exists, or when annual impairment testing for an asset is required, the Group makes an estimate of the asset’s recoverable amount. An asset’s recoverable amount is the higher of its fair value less costs to sell and its value in use and is determined for an individual asset, unless the asset does not generate cash inflows that are largely independent of those from other assets or groups of assets and the asset’s value in use cannot be estimated to be close to its fair value. In such cases the asset is tested for impairment as part of the cash-generating unit to which it belongs. When the carrying amount of an asset or cash-generating unit exceeds its recoverable amount, the asset or cash-generating unit is considered impaired and is written down to its recoverable amount. In assessing value in use, the estimated future cash flows are discounted to their present value using a pre-tax discount rate that reflects current market assessments of the time value of money and the risks specific to the asset. Impairment losses relating to continuing operations are recognised in the expense categories consistent with the function of the impaired asset unless the asset is carried at revalued amount (in which case the impairment loss is treated as a revaluation decrease).
An assessment is also made at each reporting date as to whether there is any indication that previously recognised impairment losses may no longer exist or may have decreased. If such indication exists, the recoverable amount is estimated. A previously recognised impairment loss is reversed only if there has been a change in the estimates used to determine the asset’s recoverable amount since the last impairment loss was recognised. If that is the case the carrying amount of the asset is increased to its recoverable amount. That increased amount cannot exceed the carrying amount that would have been determined, net of depreciation, had no impairment loss been recognised for the asset in prior years. Such reversal is recognised in profit or loss unless the asset is carried at revalued amount, in which case the reversal is treated as a revaluation increase. After such a reversal the depreciation charge is adjusted in future periods to allocate the asset’s revised carrying amount, less any residual value, on a systematic basis over its remaining useful life.
Further disclosures relating to impairment of non-financial assets are also provided in the following notes:
Disclosures for significant assumptions Note 3 Property, plant and equipment Note 13 Capitalised mineral exploration and evaluation expenditure Note 14 (xiii) Cash and cash equivalents For Cash Flow Statement presentation purposes, cash and cash equivalents includes cash on hand, deposits held at call with financial institutions, other short term, highly liquid investments with original maturities of three months or less that are readily convertible to known amounts of cash and which are subject to an insignificant risk of changes in value, and bank overdrafts. (xiv) Mineral exploration and evaluation expenditure
Exploration and evaluation expenditure incurred is accumulated in respect of each identifiable Area of Interest. An Area of Interest is generally defined by the Group as a number of geographically proximate exploration permits which could form the basis of a project. These costs are only carried forward to the extent that the Group’s rights of tenure to that Area of Interest are current and that the costs are expected to be recouped through the successful development of the area or where activities in the area have not yet reached a stage that permits reasonable assessment of the existence of economically recoverable reserves.
Accumulated costs in relation to an abandoned area of interest are written-off in full in the Statement of Comprehensive Income in the year in which the decision to abandon the area is made.
A bi-annual review is undertaken of each Area of Interest to determine the appropriateness of continuing to carry forward costs in relation to that Area of Interest or to reverse any previous impairment. (xv) Joint arrangements The Group has interests in joint arrangements that are joint operations. A joint operation is a type of joint arrangement whereby the parties have a contractual agreement to undertake an economic activity that is subject to joint control. A joint operation involves use of assets and other resources of the ventures rather than the establishment of a separate entity. The Company recognises its interest in the joint operations by recognising its interest in the assets and liabilities of the joint operation, including its share of any assets held any liabilities incurred jointly. The Group also recognises the expenses that it incurs and its share of the income that it earns from the sale of goods and services by the joint operations, including any expenses incurred and revenue received jointly. Details relating to the joint operations, are set out in Note 26.

NOTES TO THE CONSOLIDATED FINANCIAL STATEMENTS FOR THE FINANCIAL YEAR ENDED 30 JUNE 2020 (continued)
D e e p Y e l l o w L i m i t e d 5 2 2 0 2 0 A n n u a l R e p o r t
(c) Summary of significant accounting policies (continued) (xvi) Provisions
General Provisions are recognised when the Group has a present obligation (legal or constructive) as a result of a past event, it is probable that an outflow of resources embodying economic benefits will be required to settle the obligation and a reliable estimate can be made of the amount of the obligation. When the Group expects some or all of a provision to be reimbursed, for example, under an insurance contract, the reimbursement is recognised as a separate asset, but only when the reimbursement is virtually certain. The expense relating to a provision is presented in the Statement of Profit or Loss net of any reimbursement. If the effect of the time value of money is material, provisions are discounted using a current pre-tax rate that reflects, when appropriate, the risks specific to the liability. When discounting is used, the increase in the provision due to the passage of time is recognised as a finance cost. Wages, salaries and sick leave Liabilities for wages and salaries, including non-monetary benefits, which are expected to be settled within 12 months of the reporting date are recognised in respect of employees’ services up to the reporting date. They are measured at the amounts expected to be paid when the liabilities are settled. Expenses for non-accumulating sick leave are recognised when the leave is taken and are measured at the rates paid or payable. Long service leave and annual leave The Group does not expect its long service leave or annual leave benefits to be settled wholly within 12 months of each reporting date. The Group recognises a liability for long service leave and annual leave measured as the present value of expected future payments to be made in respect of services provided by employees up to the reporting date using the projected unit credit method. Consideration is given to expected future wage and salary levels, experience of employee departures and periods of service. Expected future payments are discounted using market yields at the reporting date on high quality corporate bonds with terms to maturity and currencies that match, as closely as possible, the estimated future cash outflows. (xvii) Issued equity Ordinary shares are classified as equity. Incremental costs directly attributable to the issue of new shares are shown in equity as a deduction, net of tax, from the proceeds. (xviii) Share-based payments Share-based compensation payments are made available to Directors, consultants and employees (Participants) of the Group, whereby they render services in exchange for a share-based payment. The fair value of these equity-settled transactions is recognised as an employee benefit expense with a corresponding increase in equity. The fair value is measured at grant date and recognised over the period during which the Participants become unconditionally entitled to the award. At each subsequent reporting date until vesting, the cumulative charge to the Statement of Comprehensive Income or Statement of Financial position where the cost is capitalise as Mineral exploration and evaluation expenditure is the product of: i. the grant date fair value of the award; ii. the current best estimate of the number of Options, rights or shares that will vest, taking into account such factors as
the likelihood of employee turnover during the vesting period and the likelihood of non-market performance conditions being met; and
iii. the expired portion of the vesting period.
The charge to the Statement of Comprehensive Income or Statement of Financial position as Capitalised mineral exploration and evaluation expenditure for the period is the cumulative amount as calculated above less the amounts already charged in previous periods. There is a corresponding entry to equity. Share-based compensation payments are granted by the parent company to Participants. The expense recognised by the Group is the total expense associated with all such awards. The fair value at grant date is independently determined using a binomial option pricing model or the Monte-Carlo simulation model, as appropriate, that takes into account the exercise price, the term of the option, right or share, the impact of dilution, the share price at grant date and expected price volatility of the underlying share, the expected dividend yield, the risk free rate for the term of the option and the probability of market based vesting conditions being realised.

NOTES TO THE CONSOLIDATED FINANCIAL STATEMENTS FOR THE FINANCIAL YEAR ENDED 30 JUNE 2020 (continued)
D e e p Y e l l o w L i m i t e d 5 3 2 0 2 0 A n n u a l R e p o r t
(c) Summary of significant accounting policies (continued) The fair value of the award granted is adjusted to reflect market vesting conditions. Non-market vesting conditions are included in assumptions about the number of awards that are expected to become exercisable. At each balance date, the entity revises its estimate of the number of awards that are expected to become exercisable. The employee benefit expense recognised each period, takes into account the most recent estimate. Upon the exercise of awards, the balance of the share-based payments reserve relating to those awards is transferred to share capital and the proceeds received, net of any directly attributable transaction costs, are credited to share capital. No expense is recognised for awards that do not ultimately vest, except for awards where vesting is only conditional upon a market condition. If the terms of an equity-settled award are modified, as a minimum an expense is recognised as if the terms had not been modified. In addition, an expense is recognised for any modification that increases the total fair value of the share-based payment arrangement, or is otherwise beneficial to the employee, as measured at the date of modification. If an equity-settled award is cancelled, it is treated as if it had vested on the date of cancellation, and any expense not yet recognised for the award is recognised immediately. However, if a new award is substituted for the cancelled award and designated as a replacement award on the date that is granted, the cancelled and new award are treated as if they were a modification of the original award, as described in the previous paragraph. The dilutive effect, if any, of outstanding Options and rights is reflected as additional share dilution in the computation of diluted earnings per share. (d) Changes in accounting policies, disclosures, standards and interpretations (i) Changes in accounting policies, new and amended standards and interpretations
From 1 July 2019, Deep Yellow Limited has adopted and applied, where relevant, all Australian Accounting Standards and Interpretations effective from 1 July 2019. The accounting policies adopted are consistent with those of the previous financial year except for AASB 16. The Group applied AASB 16 and Interpretation 23 for the first time. The nature and effect of the changes as a result of adoption of this new standard and Interpretation are described below. AASB 16 Leases AASB 16 Leases replaces AASB 117 Leases for annual periods beginning on or after 1 January 2019. The standard sets out the principles for the recognition, measurement, presentation and disclosure of leases and requires lessees to account for all leases under a single on-balance sheet model. Lessor accounting under AASB16 is substantially unchanged from AASB 117. Lessors will continue to classify leases as either operating or financial leases using similar principles as in AASB 117. The Group adopted AASB 16 using the modified retrospective method of adoption with the date of initial application of 1 July 2019. Under this method, the standard is applied retrospectively with the cumulative effect of initially applying the standard recognised at the date of initial application. The Group elected to use the “transition practical expedient” allowing the standard to be applied only to contracts that were previously identified as leases therefore applying AASB 117 at the date of initial application. The Group also elected to use the recognition exemptions for lease contracts that, at the commencement date, have a lease term of 12 months or less and do not contain a purchase option (‘short term leases’), and lease contracts for which the underlying asset is low value (‘low-value assets’). The effect of adopting AASB 16 as at 1 July 2019 (increase/(decrease)) is as follows:
Assets $ Right-of-use assets 749,560 Total assets 749,560 Current Liabilities Lease liabilities 94,599 Non-Current Liabilities Lease liabilities 654,961 Total liabilities 749,560

NOTES TO THE CONSOLIDATED FINANCIAL STATEMENTS FOR THE FINANCIAL YEAR ENDED 30 JUNE 2020 (continued)
D e e p Y e l l o w L i m i t e d 5 4 2 0 2 0 A n n u a l R e p o r t
(d) Changes in accounting policies, disclosures, standards and interpretations (continued) (i) Changes in accounting policies, new and amended standards and interpretations Nature of the effect of adoption of AASB 16 The Group has a property lease contract. Before the adoption of AASB 16, the Group classified its property lease as an operating lease as it did not transfer substantially all of the risks and rewards incidental to ownership of the leased asset to the Group. The leased property was not capitalised and the lease payments were recognised as rent expense in profit or loss on a straight-line basis over the lease term. Upon adoption of AASB 16, the Group applied a single recognition and measurement approach for all leases, except for short-term leases and leases of low-value assets. The Standard provides specific transition requirements and practical expedients, which has been applied by the Group. The Group recognised right-of-use assets and lease liabilities for the property lease previously classified as an operating lease. The right-of-use asset was recognised based on the amount equal to the lease liability at the initial application date. Lease liabilities were recognised based on the present value of the remaining lease payments, discounted using the incremental borrowing rate at the date of initial application. The Group also applied the available practical expedients, where applicable, wherein it:
► Recognised lease liabilities based on the present value of the remaining lease payments, discounted using the incremental borrowing rate at the date of initial application;
► Relied on its assessment of whether leases are onerous immediately before the date of initial application; ► Applied the short-term lease exemptions to leases with a term that ends within 12 months at the date of initial
application; ► Excluded initial direct costs from the measurement of the right-of-use asset at the date of initial application; and ► Used hindsight in determining the lease term where the contract contains options to extend or terminate the lease.
Based on the foregoing, as at 1 July 2019 right-of-use assets and lease liabilities of $730,926 were recognised and presented separately in the Statement of Financial Position. The lease liabilities as at 1 July 2019 can be reconciled to the operating lease commitments as at 30 June 2019 as follows:
$
Operating lease commitments as at 30 June 2019 – Note 21 of 2019 Annual Financial Statements
645,521
Option to extend and removal of variable lease payments 204,468
Operating lease commitments as at 30 June 2019 849,989
Weighted average incremental borrowing rate 4%
Lease liability recognised at 1 July 2019 749,560
Summary of new accounting policies Set out below are the new accounting policies of the Group upon adoption of AASB 16, which have been applied from the date of initial application:
► Right-of-use assets The Group recognises right-of-use assets at the commencement date of the lease (i.e., the date the underlying asset is available for use). Right-of-use assets are measured at cost, less any accumulated depreciation and impairment losses, adjusted for any remeasurement of lease liabilities. The cost of right-to-use assets includes the amount of lease liabilities recognised, initial direct costs incurred, and lease payments made at or before the commencement date less and lease incentives received. Unless the Group is reasonably certain to obtain ownership of the leased asset at the end of the lease term, the recognised right-of-use assets are depreciated on a straight-line basis over the shorter of its estimated useful life and the lease term. Right-of-use assets are subject to impairment.
► Lease liabilities At the commencement date of the lease, the Group recognises lease liabilities measured at the present value of lease payments to be made over the lease term. The lease payments include fixed payments less any lease incentives receivable, variable lease payments that depend on an index or a rate, and amounts expected to be paid under residual value guarantees. The lease payments also include the exercise price of a purchase option reasonably certain to be exercised by the Group and payments of penalties for terminating a lease, if the lease term reflects the Group exercising the option to terminate. The variable lease payments that do not depend on an index or a rate are recognised as expense in the period on which the event or condition that triggers the payment occurs.

NOTES TO THE CONSOLIDATED FINANCIAL STATEMENTS FOR THE FINANCIAL YEAR ENDED 30 JUNE 2020 (continued)
D e e p Y e l l o w L i m i t e d 5 5 2 0 2 0 A n n u a l R e p o r t
(d) Changes in accounting policies, disclosures, standards and interpretations (continued)
(i) Changes in accounting policies, new and amended standards and interpretations
In calculating the present value of lease payments, the Group uses the incremental borrowing rate at the lease commencement date if the interest rate implicit in the lease is not readily determinable. After the commencement date, the amount of lease liabilities is increased to reflect the accretion of interest and reduced for the lease payments made. In addition, the carrying amount of lease liabilities is remeasured if there is a modification, a change in the lease term, a change in the in-substance fixed lease payments or a change in the assessment to purchase the underlying asset. ► Short-term leases and leases of low-value assets The Group applies the short-term lease recognition exemption to its short-term leases of machinery and equipment, if any (i.e., those leases that have a lease term of 12 months or less from the commencement date and do not contain a purchase option). It also applies the lease of low-value assets recognition exemption to lease of office equipment that are considered of low value. Lease payments on short-term leases and leases of low-value assets are recognised as an expense on a straight-line basis over the lease term. ► Significant judgement in determining the lease term of contracts with renewal options The Group determines the lease term as the non-cancellable term of the lease, together with any periods covered by an option to extend the lease if it is reasonably certain to be exercised, or any periods covered by an option to terminate the lease, if it is reasonably certain not to be exercised.
The Group has the option, under its property lease, to lease the property for an additional term of 3 years. The Group applies judgement in evaluating whether it is reasonably certain to exercise the option to renew. That is, it considers all relevant factors that create an economic incentive for it to exercise the renewal. After the commencement date, the Group reassesses the lease term if there is a significant event or change in circumstances that is within its control and affects its ability to exercise (or not to exercise) the option to renew (e.g. a change in business strategy). The Group included the renewal period as part of the lease term for the property lease due to being reasonably certain that the lease property will continue to suit the Group’s occupation needs at time of the extension option is able to be exercised. Amounts recognised in the Statement of Financial Position and Profit or Loss Set out below are the carrying amounts of the Group’s right-of-use assets and lease liabilities and the movements during the period:
The right-of-use asset is depreciated over a period of 77 months from July 2019 to November 2025.
Lease liability
Property lease
$
As at 1 July 2019 749,560
Interest expense 26,697
Concessions (18,635)
Payments (121,737)
As at 30 June 2020 635,885
Current 99,221
Non-current 536,664
Total lease liability 635,885
Maturity analysis – contractual undiscounted cash flows
Less than one year 122,043
One to five years 584,701
Total undiscounted cash flows 706,744
The Group recognised variable lease payments of $47,494 for the financial year. The variable lease payments primarily relate to operating costs within the framework of the property lease agreement.

NOTES TO THE CONSOLIDATED FINANCIAL STATEMENTS FOR THE FINANCIAL YEAR ENDED 30 JUNE 2020 (continued)
D e e p Y e l l o w L i m i t e d 5 6 2 0 2 0 A n n u a l R e p o r t
(d) Changes in accounting policies, disclosures, standards and interpretations (continued)
(i) Changes in accounting policies, new and amended standards and interpretations Interpretation 23 Uncertainty over Income Tax Treatment The Interpretation addresses the accounting for income taxes when tax treatments involve uncertainty that affects the application of AASB 112 Income Taxes. It does not apply to taxes or levies outside the scope of AASB 112, nor does it specifically include requirements relating to interest and penalties associated with uncertain tax treatments. The Interpretation specifically addresses the following:
► Whether an entity considers uncertain tax treatments separately. ► The assumptions an entity makes about the examination of tax treatments by taxation authorities. ► How an entity determines taxable profit (tax loss), tax bases, unused tax losses, unused tax credits and tax rates. ► How an entity considers changes in facts and circumstances.
An entity has to determine whether to consider each uncertain tax treatment separately or together with one or more other uncertain tax treatments. The approach that better predicts the resolution of the uncertainty needs to be followed. The Group applies significant judgement in identifying uncertainties over income tax treatments. Since the Group operates in a complex multinational environment, it assessed whether the Interpretation had an impact on its consolidated financial statements. Upon adoption of the Interpretation, the Group considered whether it had any uncertain tax positions, particularly those relating to transfer pricing. The Company’s and the subsidiaries’ tax filings in different jurisdictions include deductions related to transfer pricing and the taxation authorities may challenge those tax treatments. The Group determined, based on its tax compliance and transfer pricing review, that it is probable that its tax treatments (including those for the subsidiaries) will be accepted by the taxation authorities. The interpretation did not have an impact on the consolidated financial statements of the Group. Several other amendments and interpretations (listed below) apply for the first time in 2020, but do not have an impact on the consolidated financial statements of the Group. The Group has not early adopted any standards, interpretations or amendments that have been issued but are not yet effective.

NOTES TO THE CONSOLIDATED FINANCIAL STATEMENTS FOR THE FINANCIAL YEAR ENDED 30 JUNE 2020 (continued)
D e e p Y e l l o w L i m i t e d 5 7 2 0 2 0 A n n u a l R e p o r t
(d) Changes in accounting policies, disclosures, standards and interpretations (continued) (i) Changes in accounting policies, new and amended standards and interpretations
Reference Title and Summary Application date
of standard* Application date
for Group* AASB 2017-6 Amendments to Australian Accounting Standards – Prepayment
Features with Negative Compensation This Standard amends AASB 9 Financial Instruments to permit entities to measure at amortised cost or fair value through other comprehensive income particular financial assets that would otherwise have contractual cash flows that are solely payments of principal and interest but do not meet that condition only as a result of a prepayment feature. This is subject to meeting other conditions, such as the nature of the business model relevant to the financial asset. Otherwise, the financial assets would be measured at fair value through profit or loss. The Standard also clarifies in the Basis for Conclusion that, under AASB 9, gains and losses arising on modifications of financial liabilities that do not result in derecognition should be recognised in profit or loss.
1 January 2019 1 July 2019
AASB 2017-7 Amendments to Australian Accounting Standards – Long-term Interests in Associates and Joint Ventures This Standard amends AASB 128 Investments in Associates and Joint Ventures to clarify that an entity is required to account for long-term interests in an associate or joint venture, which in substance form part of the net investment in the associate or joint venture but to which the equity method is not applied, using AASB 9 Financial Instruments before applying the loss allocation and impairment requirements in AASB 128.
1 January 2019 1 July 2019
AASB 2018-1 Annual Improvements to IFRS Standards 2015-2017 Cycle*** The amendments clarify certain requirements in: ► AASB 3 Business Combinations and AASB 11 Joint Arrangements - previously held interest in a joint operation ► AASB 112 Income Taxes - income tax consequences of payments on financial instruments classified as equity ► AASB 123 Borrowing Costs - borrowing costs eligible for capitalisation.
1 January 2019 1 July 2019
AASB 2018-2 Amendments to Australian Accounting Standards – Plan Amendment, Curtailment or Settlement This Standards amends AASB 119 Employee Benefits to specific how an entity accounts for defined benefit plans when a plan amendment, curtailment or settlement occurs during a reporting period. The amendments: ► Require entities to use the updated actuarial assumptions to determine current service cost and net interest for the remainder of the annual reporting period after such an event occurs ► Clarify that when such an event occurs, an entity recognises the past service cost or a gain or loss on settlement separately from its assessment of the asset ceiling.
1 January 2019 1 July 2019
* Designates the beginning of the applicable annual reporting period unless otherwise stated. ** Early adoption is permitted provided that AASB 15 is applied on or before the date of initial application of AASB 16. *** The IASB issued the mending Standard on 12 December 2017. As at the date of the issuance of this publication,
the AASB are yet to issue the equivalent Australian Accounting Standard. **** In December 2015, the IASB postponed the effective date of the amendments indefinitely pending the outcome of
its research project on the equity method of accounting.

NOTES TO THE CONSOLIDATED FINANCIAL STATEMENTS FOR THE FINANCIAL YEAR ENDED 30 JUNE 2020 (continued)
D e e p Y e l l o w L i m i t e d 5 8 2 0 2 0 A n n u a l R e p o r t
Accounting Standards and Interpretations issued but not yet effective Australian Accounting Standards and Interpretations that have recently been issued or amended but are not yet effective, up to the date of issuance of the Group’s financial statements are disclosed below.
Reference Title and Summary Application date
of standard * Application date
for Group * Conceptual Framework AASB 2019-1
Conceptual Framework for Financial Reporting Amendments to Australian Accounting Standards –Reference to the Conceptual Framework ** The revised Conceptual Framework includes some new concepts, provides updated definitions and recognition criteria for assets and liabilities and clarifies some important concepts. It is arranged in eight chapters, as follows: ► Chapter 1 – The objective of financial reporting ► Chapter 2 – Qualitative characteristics of useful financial information ► Chapter 3 – Financial statements and the reporting entity ► Chapter 4 – The elements of financial statements ► Chapter 5 –Recognition and derecognition ► Chapter 6 –Measurement ► Chapter 7 –Presentation and disclosure ► Chapter 8 –Concepts of capital and capital maintenance AASB 2019-1has also been issued, which sets out the amendments to other pronouncements for references to the revised Conceptual Framework. The changes to the Conceptual Framework may affect the application of accounting standards in situations where no standard applies to a particular transaction or event. In addition, relief has been provided in applying AASB 3 and developing accounting policies for regulatory account balances using AASB 108, such that entities must continue to apply the definitions of an asset and a liability (and supporting concepts) in the Framework for the Preparation and Presentation of Financial Statements (July 2004), and not the definitions in the revised Conceptual Framework.
1 January 2020 1 July 2020
AASB 2018-6 Amendments to Australian Accounting Standards – Definition of a Business The Standard amends the definition of a business in AASB 3 Business Combinations. The amendments clarify the minimum requirements for a business, remove the assessment of whether market participants are capable of replacing missing elements, add guidance to help entities assess whether an acquired process is substantive, narrow the definitions of a business and of outputs, and introduce an optional fair value concentration test.
1 January 2020 1 July 2020
AASB 2018-7 Amendments to Australian Accounting Standards – Definition of a Material This Standard amends AASB 101 Presentation of Financial Statements and AAS 108 Accounting Policies, Changes in Accounting Estimates and Errors to align the definition of ‘material’ across the standards and to clarify certain aspects of the definition. The amendments clarify that materiality will depend on the nature or magnitude of information. An entity will need to assess whether the information, either individually or in combination with other information, is material in the context of the financial statements. A misstatement of information is material if it could reasonably be expected to influence decisions made by the primary user
NOTES TO THE CONSOLIDATED FINANCIAL STATEMENTS FOR THE FINANCIAL YEAR ENDED 30 JUNE 2020 (continued)
D e e p Y e l l o w L i m i t e d 5 9 2 0 2 0 A n n u a l R e p o r t
Reference Title and Summary Application date
of standard * Application date
for Group * AASB 2014-10 Amendments to Australian Accounting Standards – Sale or
Contribution of Assets between an Investor and its Associate or Joint Venture The amendments clarify that a full gain or loss is recognised when a transfer to an associate or joint venture involves a business as defined in AASB 3 Business Combinations. Any gain or loss resulting from the sale or contribution of assets that does not constitute a business, however, is recognised only to the extent of unrelated investors’ interests in the associate or joint venture. AASB 2015-10 deferred the mandatory effective date (application date) of AASB 2014-10 so that the amendments were required to be applied for annual reporting periods beginning on or after 1 January 2018 instead of 1 January 2016. AASB 2017-5 further defers the effective date of the amendments made in AASB 2014-10 to periods beginning on or after 1 January 2022.***
1 January 2022 1 July 2022
* Designates the beginning of the applicable annual reporting period unless otherwise stated. ** AASB 2019-1 currently limits the application of the Conceptual Framework to: (a) for-profit private sector entities
that have public accountability and are required by legislation to comply with Australian Accounting Standards; and (b) other for-profit entities that voluntarily elect to apply the Conceptual Framework, which would permit compliance with Australian Accounting Standards (Tier 1) and IFRS Standards.
*** AASB 2017-5 deferred the effective date of AASB 2014-10 to from 1 January 2018 to 1 January 2022 The Group has not yet determined the likely impact of each of the above amendments, if any, on the Group. Note 3 Significant accounting judgements, estimates and assumptions The preparation of the Group’s Consolidated Financial Statements requires management to make judgements, estimates and assumptions that affect the reported amounts of revenues, expenses, assets and liabilities, and the accompanying disclosures, and the disclosure of contingent liabilities. Uncertainty about these assumptions and estimates could result in outcomes that require a material adjustment to the carrying amount of assets or liabilities affected in future periods. COVID-19 has not impacted any of the Group’s key judgments or estimates. Other disclosures relating to the Group’s exposure to risks and uncertainties includes: Capital management Note 5 Financial risk management objectives and policies Note 19 Sensitivity analysis disclosures Note 19 Judgements In the process of applying the Group’s accounting policies, management has made the following judgments, which have the most significant effect on the amount recognised in the consolidated financial statements: Determining the lease term of contracts with renewal and termination options – Group as lessee
The Group determines the lease term as the non-cancellable term of the lease, together with any periods covered by an option to extend the lease if it is reasonably certain to be exercised, or any periods covered by an option to terminate the lease, if it is reasonably certain not to be exercised.
The Group has a property lease contract that include an extension option. The Group applies judgement in evaluating whether it is reasonably certain whether or not to exercise the option to renew the lease. That is, it considers all relevant factors that create an economic incentive for it to exercise the renewal. After the commencement date, the Group reassesses the lease term if there is a significant event or change in circumstances that is within its control and affects its ability to exercise or not to exercise the option to renew. (e.g., operational requirements).
The Group included the renewal period as part of the lease term of the property lease contract based on its operational requirements, location of the lease property and recent leasehold improvements.
Estimates and assumptions
The key assumptions concerning the future and other key sources of estimation uncertainty at the reporting date, that have significant risk of causing a material adjustment to the carrying amounts of assets and liabilities within the next financial year, are described below. The Group based its assumptions and estimates on parameters available when the Consolidated Financial Statements were prepared. Existing circumstances and assumptions about future developments, however, may change due to market changes or circumstances arising beyond the control of the Group. Such changes are reflected in the assumptions when they occur.

NOTES TO THE CONSOLIDATED FINANCIAL STATEMENTS FOR THE FINANCIAL YEAR ENDED 30 JUNE 2020 (continued)
D e e p Y e l l o w L i m i t e d 6 0 2 0 2 0 A n n u a l R e p o r t
Note 3 Significant accounting judgements, estimates and assumptions
Accounting for capitalised mineral exploration and evaluation expenditure
The Group’s accounting policy is stated at Note 3(c)(xiv). A regular review is undertaken of each Project Area to determine the reasonableness of the continuing carrying forward of costs in relation to that Project Area or reversal of previously recognised impairment losses. In determining the costs to be carried forward, the fair value is determined based on the mineral resource estimate multiplied by a resource multiple. Management makes assumptions regarding the Uranium resource multiple that should be used in calculating fair value of the expenditure to determine if costs can continue to be carried forward. Factors that could impact the uranium resource multiple and therefore the continuing carrying forward of costs include the status of resources and exploration targets, changes in legal frameworks and sovereign risk in the countries where the Group operates, changes to commodity prices and foreign exchange rates. Share-based payments The Group’s accounting policy is stated at Note 3(c)(xviii). The Group uses independent advisors to assist in valuing share-based payments. Refer Note 20 for details of estimates and assumptions used. Lease – estimating the incremental borrowing rate The Group cannot readily determine the interest rate implicit in the lease, therefore, it uses its incremental borrowing rate (IBR) to measure lease liabilities. The IBR is the rate of interest that the Group would have to pay to borrow over a similar term, and with a similar security, the funds necessary to obtain an asset of a similar value to the right-of-use asset in a similar economic environment. The IBR therefore reflects what the Group ‘would have to pay’, which requires estimation when no observable rates are available as the Group do not enter into financing transactions. The Group estimates the IBR using observable inputs (such as market interest rates) when available and is required to make certain entity-specific estimates. Note 4 Segment information An operating segment is a distinguishable component of an entity that engages in business activities from which it may earn revenue and incur expenses, whose operating results are regularly reviewed by the entity’s chief operating decision maker to make decisions about how resources should be allocated to the segment and assess its performance and for which discrete financial information is available. Operating segments have been identified based on the information provided to the chief operating decision maker – being the Group Managing Director and Executive management team. The Group has identified its operating segments based on internal reports that are used by the Group Managing Director and Executive management team in assessing performance and in determining the allocation of resources. The operating segments are identified based on activities as this is the area that has the most effect on allocation of resources. The Group conducts uranium exploration and pre-development activities in Namibia whilst Australia is responsible for capital raising and corporate activities, including project evaluation and acquisition. Mauritius as country of operation has been aggregated to form the reportable operating segment for Australia due to its corporate activities. Transfer prices between operating segments are on an arm’s length basis in a manner similar to transactions with third parties.
Australia $
Namibia $
Total $
Year Ended 30 June 2020 Revenue and other income ** - 77,276 77,276
Unallocated Interest income 221,173 COVID-19 employer stimulus grant 36,205
Total revenue and other income 334,654
Expenses Impairment of capitalised mineral exploration and evaluation expenditure
- 36,893 36,893
Reversal of prior year impairment of capitalised mineral exploration and evaluation expenditure
- (7,100,920) (7,100,920)
Profit and Loss Pre-tax segment (loss)/profit (4,137,570) 6,755,055 (2,617,485)
Unallocated Interest income 221,173 COVID-19 employer stimulus grant 36,205
Profit from continuing operations after income tax 2,874,863

NOTES TO THE CONSOLIDATED FINANCIAL STATEMENTS FOR THE FINANCIAL YEAR ENDED 30 JUNE 2020 (continued)
D e e p Y e l l o w L i m i t e d 6 1 2 0 2 0 A n n u a l R e p o r t
Note 4 Segment information (continued) Australia
$ Namibia
$ Total
$
Year Ended 30 June 2020 Segment Assets Segment operating assets 837,308 35,901,916 36,739,224
Unallocated assets Cash 12,116,972 Receivables 298,265
Total assets 49,154,461
Total additions to non-current assets* 775,160 2,220,683 2,995,843
Australia $
Namibia $
Total $
Year Ended 30 June 2019 Revenue and other income ** - 119,476 119,476
Unallocated Interest income 181,594 Research and development tax incentive 43,577
Total revenue and other income 344,647
Expenses Impairment of capitalised mineral exploration and evaluation expenditure
- 18,640 18,640
Profit and Loss Pre-tax segment loss (3,787,796) (251,703) (4,039,499)
Unallocated Interest income 181,594 Research and development tax incentive 43,577
Loss from continuing operations after income tax (3,814,328)
Year Ended 30 June 2019 Segment Assets Segment operating assets 255,500 32,424,943 32,680,443
Unallocated assets Cash 14,975,063 Receivables 461,989
Total assets 48,117,495
Total additions to non-current assets* 19,159 1,841,973 1,861,132
*Non-current assets for this purpose consist of property, plant and equipment and capitalised mineral exploration and evaluation expenditure **NJV revenue amounted to $77,199 (2019: $119,315), from services provided in the Namibia segment. Adjustments and eliminations The following items and associated assets and liabilities are not allocated to operating segments as the underlying instruments are managed on a Group basis and are not considered as part of the core operations of both segments: Interest income. Research and development tax incentive. COVID-19 employer stimulus grant Foreign currency gains and losses. Liabilities are not allocated to the segments as they are not monitored by the executive management team on a segment
by segment basis.

NOTES TO THE CONSOLIDATED FINANCIAL STATEMENTS FOR THE FINANCIAL YEAR ENDED 30 JUNE 2020 (continued)
D e e p Y e l l o w L i m i t e d 6 2 2 0 2 0 A n n u a l R e p o r t
Note 5 Capital management The Group’s approach to capital management has not changed during the financial year. For the purpose of the Group’s capital management, capital includes issued capital and all other equity reserves attributable to the equity holders of the parent as disclosed in the Statement of Financial Position. The primary objective of the Group’s capital management is to maximise the shareholder value. The Board’s policy is to maintain an adequate capital base to maintain investor and creditor confidence, and to sustain future development of the business. The Group does not actively issue dividends; repurchase its own shares or any other form of capital return to shareholders at the current exploration stage of the Group’s activities. It does however from time to time cancel ordinary shares issued under the Loan Share Plan where relevant vesting criteria are not met. The Group does not monitor returns on capital or any other financial performance measure as the indicators of success are quantifiable by physical results from operations. The Group manages its funding by way of issue of shares. The Group does not have capital requirements imposed on it by any external party. It is, however, exposed to Namibian Exchange Controls which has an influence on debt to equity ratios at the Namibian subsidiary level, which are monitored by management and the treatment of investments or other advances for the funding of operations are executed within these guidelines. Unissued shares under option The outstanding balance of unissued ordinary shares under option at date of this report is 62,834,990 as follows:
62,464,618 Options exercisable at 50 cents and expiring 1 June 2022. The expiry date could be accelerated 22 ASX Business Days after Notification Date. The Notification Date means the date (being any date within 5 ASX Business Days of the Acceleration Trigger Date) on which Option holders are notified of the Acceleration Trigger Date” with such notification to be released on the Exchange. The Acceleration Trigger Date means that date, that the closing price of the Shares on ASX is higher than A$0.78 for any 20 consecutive ASX Business Day period, then on the 20th consecutive ASX Business Day of any such period.
370,372 zero exercise price Options expiring at 1 July 2024.
Each option entitles the holder to one fully paid ordinary share in the Company at any time up to expiry date. No Options have been exercised to acquire fully paid ordinary shares in the Company during the year. Note 6 Information about subsidiaries The Consolidated Financial Statements of the Group include:
Name Principal activities Country of
incorporation Equity interest % 2020 2019
Deep Yellow Namibia (Pty) Ltd Investment Mauritius 100 100 Superior Uranium Pty Ltd Uranium exploration Australia 100 100 Reptile Mineral Resources and Exploration (Pty) Ltd Investment Namibia 100 100 Reptile Uranium Namibia (Pty) Ltd Uranium exploration Namibia 100 100 Omahola Uranium (Pty) Ltd Uranium exploration Namibia 100 100 Nova Energy (Namibia)(Pty) Ltd Uranium exploration Namibia 65 65 Shiyela Iron (Pty) Ltd Iron ore exploration Namibia 95 95 Sand and Sea Property Number Twenty Four (Pty) Ltd Property investment Namibia 100 100 Tarquin Investments (Pty) Ltd Property investment Namibia 100 100 QE Investments (Pty) Ltd Property investment Namibia 100 100 Inca Mining (Pty) Ltd Uranium exploration Namibia 95 95 TRS Mining Namibia (Pty) Ltd Uranium exploration Namibia 95 95 Yellow Dune Uranium (Pty) Ltd Uranium exploration Namibia 85 85

NOTES TO THE CONSOLIDATED FINANCIAL STATEMENTS FOR THE FINANCIAL YEAR ENDED 30 JUNE 2020 (continued)
D e e p Y e l l o w L i m i t e d 6 3 2 0 2 0 A n n u a l R e p o r t
Note 7 Revenue, interest and other income
Consolidated 2020 2019 $ $
a) Interest and other income Interest received and receivable 221,173 181,594 Research and development tax incentive - 43,577 COVID-19 employer stimulus grant 36,205 - Other 77 161
257,455 225,332
b) Revenue from contracts with customers Asset recharges and administration fee earned 77,199 119,315
77,199 119,315
Timing of revenue recognition
Services transferred over time * 77,199 119,315
Contract balances
Trade receivables 7,654 17,931 *Revenue relates to Namibia as geographical market with services transferred over time and up to 31 August 2020 when the contract comes to an end.
Key terms and conditions for revenue from contracts with customers are detailed in Note 2(c)(iii). Note 8 Expenses
Consolidated 2020 2019
$ $
Profit/(Loss) before income tax includes the following specific expenses:
Depreciation expense: Buildings 17,570 22,391 Office equipment and fittings 53,149 45,190 Motor vehicles 2,544 2,947 Site equipment 28,639 22,383 Right-of-use asset 113,910 -
Total depreciation and amortisation expense reflected in Notes 13,16 215,812 92,911
Occupancy expenses
Rental expenses on operating leases - 164,633 Variable expenses not capitalised under property lease 47,494 -
Other 46,830 44,853
94,324 209,486
Administrative expenses
Consultancy fees: Executive directors* 403,283 301,559 Technical and other consultants: Project evaluation 473,370 705,967 Professional fees 31,898 41,879 IT expenses 131,651 74,041 Non-executive directors’ fees 279,916 299,646 Corporate and listing costs 313,145 278,629 Other costs 297,422 367,199
1,930,685 2,068,920 *Excludes costs included in capitalised mineral exploration and evaluation expenditure and project evaluation activities. Last mentioned is included under Professional fees.
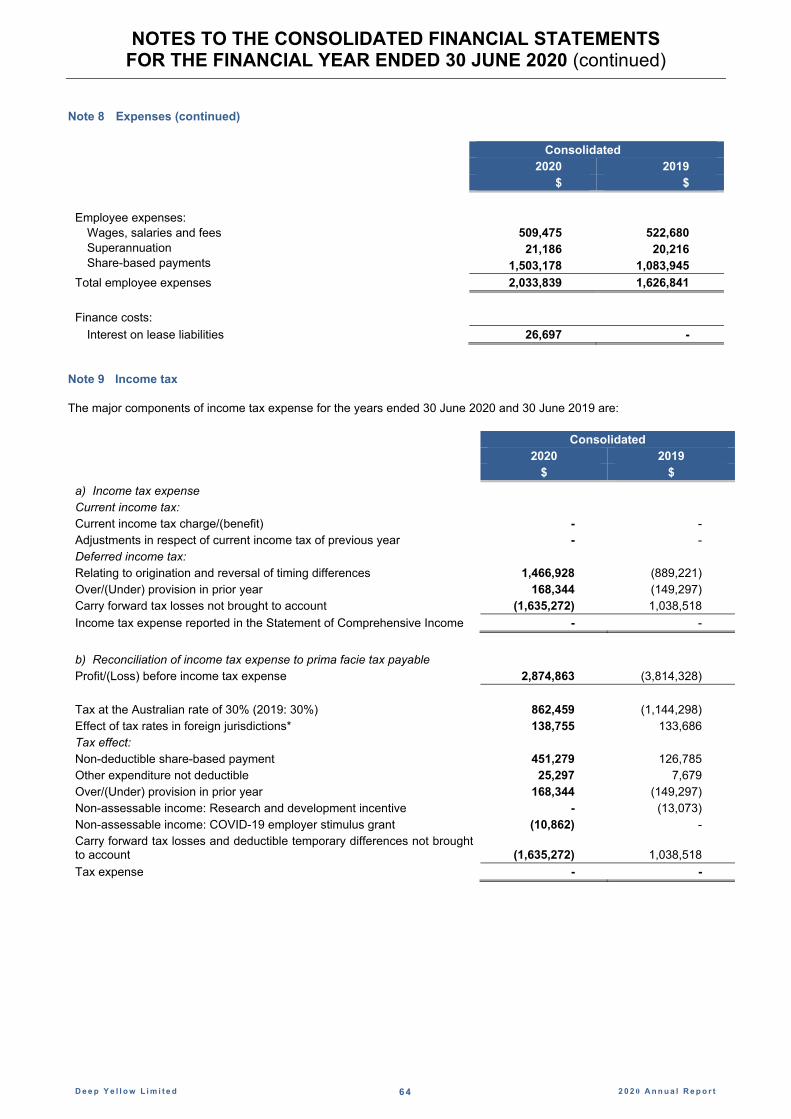
NOTES TO THE CONSOLIDATED FINANCIAL STATEMENTS FOR THE FINANCIAL YEAR ENDED 30 JUNE 2020 (continued)
D e e p Y e l l o w L i m i t e d 6 4 2 0 2 0 A n n u a l R e p o r t
Note 8 Expenses (continued)
Consolidated 2020 2019 $ $
Employee expenses:
Wages, salaries and fees Superannuation Share-based payments
509,475
522,680
21,186 20,216 1,503,178 1,083,945
Total employee expenses 2,033,839 1,626,841
Finance costs:
Interest on lease liabilities 26,697 -
Note 9 Income tax The major components of income tax expense for the years ended 30 June 2020 and 30 June 2019 are:
Consolidated 2020 2019 $ $
a) Income tax expense Current income tax: Current income tax charge/(benefit) - - Adjustments in respect of current income tax of previous year - - Deferred income tax: Relating to origination and reversal of timing differences 1,466,928 (889,221) Over/(Under) provision in prior year 168,344 (149,297) Carry forward tax losses not brought to account (1,635,272) 1,038,518
Income tax expense reported in the Statement of Comprehensive Income - -
b) Reconciliation of income tax expense to prima facie tax payable Profit/(Loss) before income tax expense 2,874,863 (3,814,328)
Tax at the Australian rate of 30% (2019: 30%) 862,459 (1,144,298) Effect of tax rates in foreign jurisdictions* 138,755 133,686 Tax effect: Non-deductible share-based payment 451,279 126,785 Other expenditure not deductible 25,297 7,679 Over/(Under) provision in prior year 168,344 (149,297) Non-assessable income: Research and development incentive - (13,073) Non-assessable income: COVID-19 employer stimulus grant (10,862) - Carry forward tax losses and deductible temporary differences not brought to account (1,635,272) 1,038,518
Tax expense - -

NOTES TO THE CONSOLIDATED FINANCIAL STATEMENTS FOR THE FINANCIAL YEAR ENDED 30 JUNE 2020 (continued)
D e e p Y e l l o w L i m i t e d 6 5 2 0 2 0 A n n u a l R e p o r t
Note 9 Income tax (continued)
Consolidated 2020 2019 $ $
c) Deferred tax – Statement of Financial Position Liabilities
Prepayments 21,637 37,763 Accrued Income - 7,385
21,637 45,148
Assets Revenue losses available to offset against future taxable income 16,392,751 13,835,219 Accrued expenses 30,057 28,699 Deductible equity raising costs 346,800 324,443 Capitalised exploration and evaluation expenditure 17,695,479 18,664,965 Deferred tax assets not brought to account (34,443,450) (32,808,178)
21,637 45,148
Net deferred tax asset/(liability) - -
d) Deferred tax – Statement of Comprehensive Income Liabilities
Prepayments 16,126 (33,242) Accrued Income 7,385 26,561
Assets
Decrease in tax losses carried forward 2,557,532 720,458 Accruals 1,358 4,606 Deductible equity raising costs 22,357 314,543 Capitalised exploration expenses (969,486) 5,592 Deferred tax assets not brought to account (1,635,272) (1,038,518)
Deferred tax expense/(benefit) - -
e) Unrecognised temporary differences At 30 June 2020, there are temporary differences to the value of $17,695,479 in relation to capitalised exploration and evaluation expenditure associated with subsidiaries. It represents a deferred tax asset which would be realised once the subsidiary is in a tax paying position. (2019: $18,664,965). *The Namibian subsidiaries operate in a jurisdiction with higher corporate tax rates. Note 10 Earnings per share (EPS) Basic earnings per share Basic earnings per share is calculated by dividing the net profit for the year attributable to ordinary equity holders of the Company, excluding any costs of servicing equity other than dividends, by the weighted average number of ordinary shares outstanding during the financial year. Diluted earnings per share Diluted earnings per share is calculated by dividing the net profit attributable to ordinary equity holders of the Company, excluding any costs of servicing equity other than dividends, by the weighted average number of ordinary shares outstanding during the financial year plus the weighted average number of ordinary shares that would be issued on conversion of all the dilutive potential ordinary shares into ordinary shares.

NOTES TO THE CONSOLIDATED FINANCIAL STATEMENTS FOR THE FINANCIAL YEAR ENDED 30 JUNE 2020 (continued)
D e e p Y e l l o w L i m i t e d 6 6 2 0 2 0 A n n u a l R e p o r t
Note 10 Earnings per share (EPS) (continued) The following reflects the income and share data used in the basic and diluted EPS computations:
Consolidated 2020 2019* $ $
a) Profit/(Loss) attributable to ordinary equity holders of the Company
Continuing operations 2,874,863 (3,814,328)
b) Weighted average number of ordinary shares for basic EPS 241,748,437 200,315,114
Effects of dilution from: Share Options 197,870 - Performance Rights 456,071 -
Weighted average number of ordinary shares adjusted for effect of dilution 242,402,378 -
*Diluted EPS is the same as basic EPS in 2019 as the Group was in a loss position. c) Information concerning the classification of securities The weighted average number of ordinary shares includes 21,936,800 Loan Plan Shares that were issued under the Loan Share Plan and are subject to short and long-term performance conditions. Note 11 Current assets - cash and cash equivalents
Consolidated 2020 2019 $ $
Cash at bank and on hand 3,449,063 10,975,063 Short term deposits 8,667,909 4,000,000
12,116,972 14,975,063
The carrying amounts of cash and cash equivalents represent fair value. See Note 19 for the Group’s fair value disclosures. Cash at banks earns interest at floating rates based on daily bank notice deposit rates. Deposits are made for varying notice periods of between one and three months, depending on the immediate cash requirements of the Group and earn interest at the respective deposit rates. At 30 June 2020 the deposit rates on the 30-day and 90-day notice deposits were 1% and 1.1% respectively. Cash flow reconciliation:
Consolidated 2020 2019
Profit/(Loss) after income tax 2,874,863 (3,814,328) Depreciation and amortisation 215,812 92,911 Loss on sale of non-current assets 10,079 506 Impairment of capitalised mineral exploration and evaluation expenditure 36,893 18,640 Reversal of prior year impairment of capitalised mineral exploration and evaluation expenditure
(7,100,920) -
Share-based payments expense 1,503,178 1,083,945 Change in operating assets and liabilities:
Decrease in receivables 127,022 84,309 Increase in payables 39,125 140,062
Net cash flows used in operating activities (2,293,948) (2,393,955)
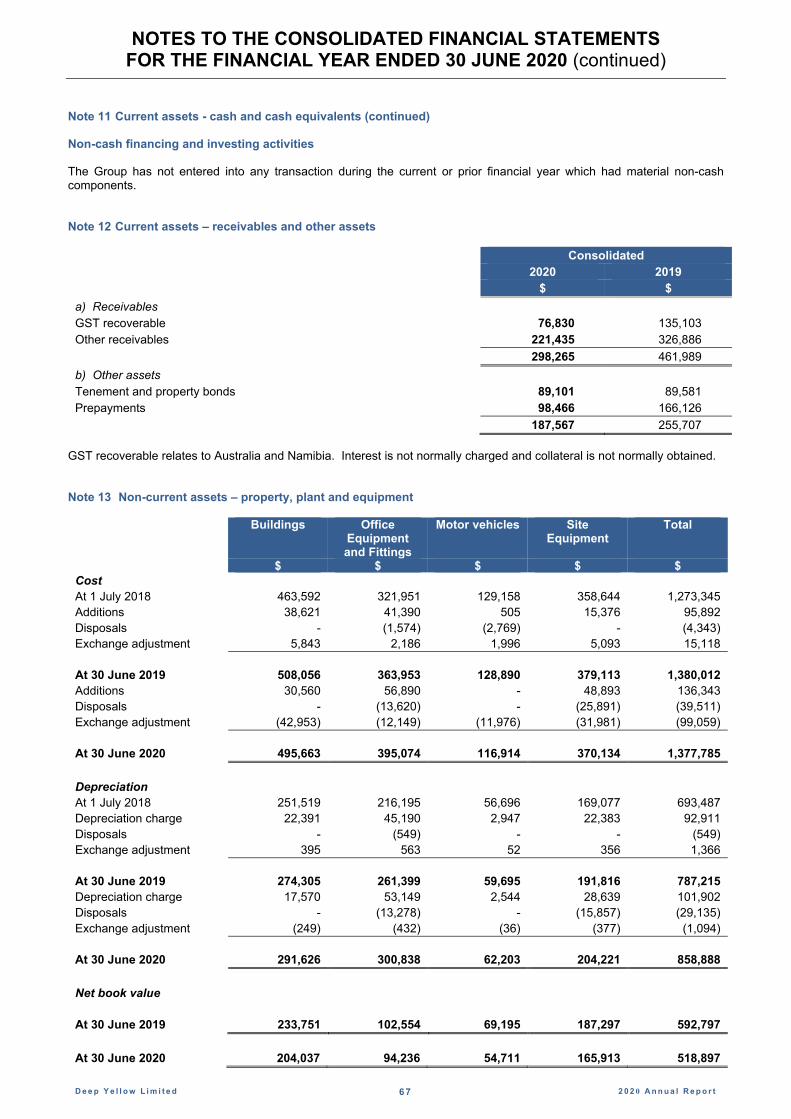
NOTES TO THE CONSOLIDATED FINANCIAL STATEMENTS FOR THE FINANCIAL YEAR ENDED 30 JUNE 2020 (continued)
D e e p Y e l l o w L i m i t e d 6 7 2 0 2 0 A n n u a l R e p o r t
Note 11 Current assets - cash and cash equivalents (continued) Non-cash financing and investing activities The Group has not entered into any transaction during the current or prior financial year which had material non-cash components. Note 12 Current assets – receivables and other assets
Consolidated 2020 2019 $ $
a) Receivables GST recoverable 76,830 135,103 Other receivables 221,435 326,886
298,265 461,989
b) Other assets Tenement and property bonds 89,101 89,581 Prepayments 98,466 166,126
187,567 255,707
GST recoverable relates to Australia and Namibia. Interest is not normally charged and collateral is not normally obtained. Note 13 Non-current assets – property, plant and equipment
Buildings Office Equipment and Fittings
Motor vehicles Site Equipment
Total
$ $ $ $ $ Cost
At 1 July 2018 463,592 321,951 129,158 358,644 1,273,345 Additions 38,621 41,390 505 15,376 95,892 Disposals - (1,574) (2,769) - (4,343) Exchange adjustment 5,843 2,186 1,996 5,093 15,118 At 30 June 2019
508,056
363,953
128,890
379,113
1,380,012
Additions 30,560 56,890 - 48,893 136,343 Disposals - (13,620) - (25,891) (39,511) Exchange adjustment (42,953) (12,149) (11,976) (31,981) (99,059) At 30 June 2020
495,663
395,074
116,914
370,134
1,377,785
Depreciation At 1 July 2018 251,519 216,195 56,696 169,077 693,487 Depreciation charge 22,391 45,190 2,947 22,383 92,911 Disposals - (549) - - (549) Exchange adjustment 395 563 52 356 1,366 At 30 June 2019
274,305
261,399
59,695
191,816
787,215
Depreciation charge 17,570 53,149 2,544 28,639 101,902 Disposals - (13,278) - (15,857) (29,135) Exchange adjustment (249) (432) (36) (377) (1,094) At 30 June 2020
291,626
300,838
62,203
204,221
858,888
Net book value At 30 June 2019 233,751 102,554 69,195 187,297 592,797
At 30 June 2020 204,037 94,236 54,711 165,913 518,897

NOTES TO THE CONSOLIDATED FINANCIAL STATEMENTS FOR THE FINANCIAL YEAR ENDED 30 JUNE 2020 (continued)
D e e p Y e l l o w L i m i t e d 6 8 2 0 2 0 A n n u a l R e p o r t
Note 13 Non-current assets – property, plant and equipment (continued) Security No items of property, plant and equipment have been pledged as security by the Group. Note 14 Non-current assets – Capitalised mineral exploration and evaluation expenditure
Consolidated 2020 2019 $ $
In the exploration and evaluation phase Cost brought forward (net of accumulated impairment) 31,831,939 29,279,061 Exploration expenditure incurred during the year at cost 2,128,575 1,765,240 Exchange adjustment (5,608,796) 806,278 Reversal of impairment loss 7,100,920 - Impairment loss (36,893) (18,640)
Cost carried forward (net of accumulated impairment) 35,415,745 31,831,939
Impairment of capitalised mineral exploration and evaluation expenditure relates to assets for which the expenditure are not expected to be recouped through successful development and exploitation of the area of interest, or alternatively, by its sale. The Group’s areas of interest are defined in Note 2(c)(xiv). Impairment write-down in FY19 and FY20 relate to other projects which are fully impaired. The impairment reversal in FY20 relate to the Reptile Project. All other areas of interest have been fully impaired in the past. The recoverable amount of the Group’s capitalised mineral exploration and evaluation assets at 30 June 2020 determined using the fair value less cost to dispose (FVLCD) method is estimated to be $35.6 million (30 June 2019: $32.6 million). It’s fair value has been determined based on comparable market transactions. The fair value methodology adopted at 30 June 2020 is categorised as Level 3 in the fair value hierarchy. The fair value less cost of disposal was determined using a range of resource multiples between $0.15 and $0.30. Any changes in these estimates could impact the FVLCD of the underlying asset: In determining the fair value of the project, to assess whether any further impairment write-downs or reversals of impairment are required the Board took into consideration: current and forecast uranium spot and term prices; share price of mid to small cap uranium companies; and combination of differentiated mineralisation of its resource-based assets. The impairment reversal was therefore driven by an increase in resources, depreciation of the Namibian dollar against the Australian dollar and improvements in the uranium spot price. A summary of capitalised mineral exploration and evaluation expenditure by country of operation is as follows:
Consolidated 2020 2019 $ $
Namibia 35,415,745 31,831,939
Note 15 Current liabilities – trade and other payables
Consolidated 2020 2019 $ $
Trade payables and accruals 465,417 477,538 Other payables 27,188 32,123
492,605 509,661
Trade payables and accruals are non-interest bearing and normally settled on 30 day terms. There are no secured liabilities as at 30 June 2020. Details of the Group’s exposure to interest rate risk and fair value in respect of its liabilities are set out in Note 19.

NOTES TO THE CONSOLIDATED FINANCIAL STATEMENTS FOR THE FINANCIAL YEAR ENDED 30 JUNE 2020 (continued)
D e e p Y e l l o w L i m i t e d 6 9 2 0 2 0 A n n u a l R e p o r t
Note 16 Leases Group as a lessee The Group has a property lease contract has a term of 5.5 years inclusive of an option to renew for 3 years. The Group is restricted from subleasing the property without the owner’s approval. The lease contains variable lease payments, which are further discussed below. Set out below is the carrying amount of the right-of-use asset recognised and the movements during the period:
Right-of-use asset Property lease
$ Cost
At 1 July 2019 749,560 Concessions (18,635) At 30 June 2020 730,925
Depreciation
At 1 July 2019 - Depreciation charge for the year 113,910 At 30 June 2020 113,910
Net book value At 30 June 2020 617,015
The interest expense, carrying amount and maturity analysis of the lease liability are disclosed in Note 2(d)(i) and Note 19. The amount recognised in profit or loss in relation to variable lease payments not included in the measurement of the lease liability is disclosed in Note 8. The Group had total cash outflows for its property lease of $169,232 in 2020 (2019:Nil) Note 17 Issued capital and reserves
Consolidated Consolidated 2020 2019 2020 2019 No. No. $ $ a) Share capital Issued and fully paid share capital 227,949,263 219,991,857 249,753,196 247,264,524
b) Share movements during the year Issue price
(cents)
At the beginning of the year 230,325,798 194,590,276 247,264,524 238,722,162 Issued on vesting of Performance Rights 571,850 414,323 225,705 101,885 Issued under Loan Share Plan (i) 8,631,205 6,283,941 - - Share buyback (ii) (2,028,346) - - - Issued under capital raising 0.31 7,385,556 29,032,258 2,289,507 9,000,000 Exercise of Options 0.50 - 5,000 - 2,500 Less: Transaction costs attributable to issuance of shares-
- - (26,540) (562,023)
At the end of the year 244,886,063 230,325,798 249,753,196 247,264,524
(i) Shares issued under the Loan Share Plan to Managing Director, Executive Director, employees and contractors and
subject to long term performance conditions and repayment of limited recourse loan made to the participant to purchase the shares. The shares may not be traded until the shares have vested, any imposed dealing restrictions have ended and the limited recourse loan in respect to those shares has been paid in full.
(ii) Ordinary shares previously issued under the Loan Share Plan were cancelled as relevant vesting criteria were not met.

NOTES TO THE CONSOLIDATED FINANCIAL STATEMENTS FOR THE FINANCIAL YEAR ENDED 30 JUNE 2020 (continued)
D e e p Y e l l o w L i m i t e d 7 0 2 0 2 0 A n n u a l R e p o r t
Note 17 Issued capital and reserves (continued) c) Ordinary shares The holding company, Deep Yellow Limited, is incorporated in Perth, Western Australia. The holding company’s shares are limited and entitle the holder to participate in dividends and the proceeds on winding up of the Company in proportion to the number of and amounts paid on the shares held. On a show of hands every holder of ordinary shares present at a meeting in person or by proxy, is entitled to one vote, and upon a poll each share is entitled to one vote. d) Other reserves
Consolidated
2020
Accumulated losses
$
Employee equity benefits’ reserve
(i) $
Foreign Currency Translation Reserve (ii)
$
Balance at 1 July 2019 (196,141,196) 12,140,341 (15,774,349)
Profit for year 2,874,863 - - Transfer to issued capital in respect of Performance Rights vested
- (225,705) -
Recognition of share-based payments - 1,561,637 - Movement for the year - - (6,269,172)
Balance at 30 June 2020 (193,266,333) 13,476,273 (22,043,521)
Consolidated
2019
Accumulated losses
$
Employee equity benefits’ reserve
(i) $
Foreign Currency Translation Reserve (ii)
$
Balance at 1 July 2018 (192,326,868) 11,086,143 (16,695,496)
Loss for year (3,814,328) - - Transfer to issued capital in respect of Performance Rights vested
- (101,885) -
Recognition of share-based payments - 1,156,083 - Movement for the year - - 921,147
Balance at 30 June 2019 (196,141,196) 12,140,341 (15,774,349)
(i) Employee equity benefits’ reserve The previous Option Plan was replaced by an Awards Plan which allows the offer of either Options or Performance Rights. Options over unissued shares are issued and Performance Rights are granted at the discretion of the Board. Information relating to Options issued and Performance Rights granted are set out in Note 20. The Group has a Loan Share Plan which allows the offer of Loan Plan Shares to qualifying employees and/or consultants. Loan Plan Shares are issued at the discretion of the Board. Information relating to Loan Plan Shares are set out in Note 20. (ii) Foreign currency translation reserve The foreign currency translation reserve is used to record exchange differences arising from the translation of the financial statements of foreign subsidiaries. The movement arises from the translation of foreign subsidiaries and opening balance of equity. Note 18 Dividends No dividends were paid or proposed during the financial year (2019: Nil). The Company has no franking credits available as at 30 June 2020 (2019: Nil).

NOTES TO THE CONSOLIDATED FINANCIAL STATEMENTS FOR THE FINANCIAL YEAR ENDED 30 JUNE 2020 (continued)
D e e p Y e l l o w L i m i t e d 7 1 2 0 2 0 A n n u a l R e p o r t
Note 19 Financial assets and liabilities Financial assets
Consolidated 2020 2019 $ $
Financial assets at amortised cost Cash and cash equivalents 12,116,972 14,975,063 Trade and other receivables (Note 12(a) 298,265 461,989
Total current 12,415,237 15,437,052
Financial liabilities: Lease liabilities
Consolidated Borrowing
rate Maturity 2020 2019
$ $
Current liabilities Lease liabilities (Note 2(d)(i)) 4% 2021 99,221 -
Total current liabilities
99,221
-
Non-current liabilities Lease liabilities (Note 2(d)(i)) 4% 2025 536,664 -
Total non-current liabilities
536,664
-
Total liabilities 635,885 635,885
Other financial liabilities
Consolidated 2020 2019 $ $
Financial liabilities at amortised cost Trade and other payables (Note 15) 492,605 509,661
Total current 492,605 509,661 Maturity analysis of financial liabilities
0-12 months 1-5 years Total $ $
As at 30 June 2020 Lease liabilities 99,221 536,664 635,885 Trade and other payables 492,605 - 492,605 As at 30 June 2019 Trade and other payables 509,661 - 509,661
Fair values Apart from lease liabilities, the fair value of financial assets and liabilities approximates their carrying amounts largely due to the short-term maturities of these instruments.
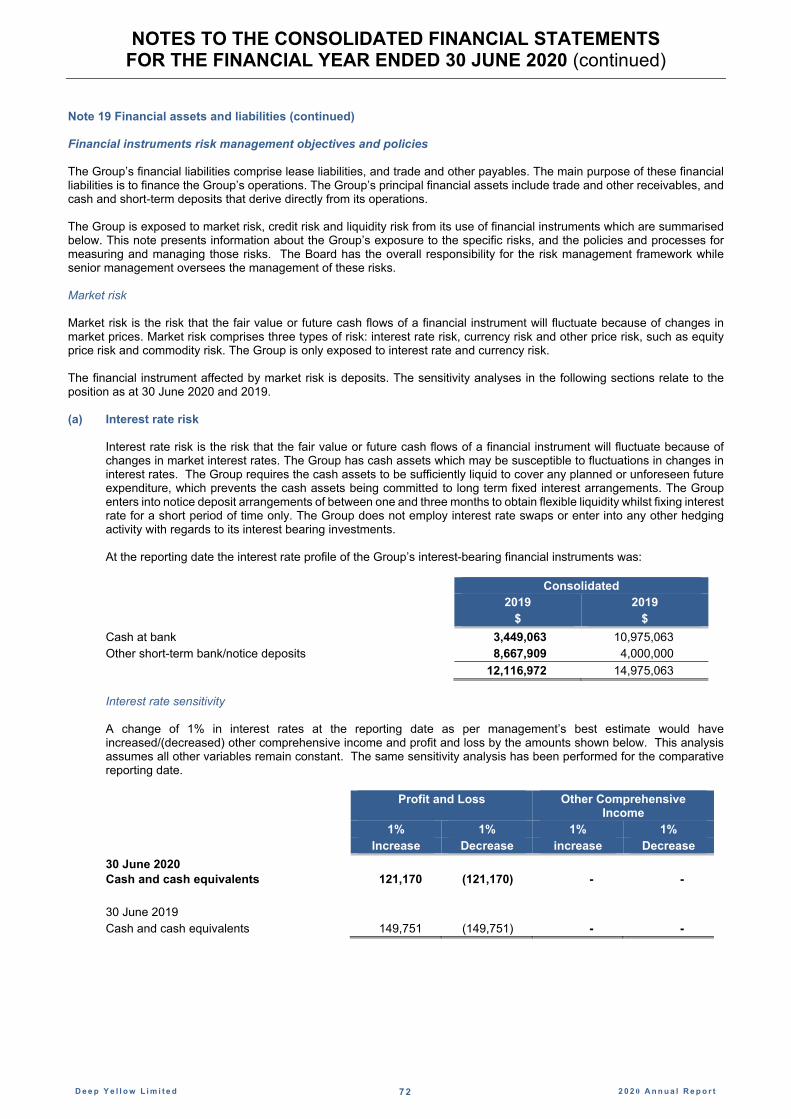
NOTES TO THE CONSOLIDATED FINANCIAL STATEMENTS FOR THE FINANCIAL YEAR ENDED 30 JUNE 2020 (continued)
D e e p Y e l l o w L i m i t e d 7 2 2 0 2 0 A n n u a l R e p o r t
Note 19 Financial assets and liabilities (continued) Financial instruments risk management objectives and policies The Group’s financial liabilities comprise lease liabilities, and trade and other payables. The main purpose of these financial liabilities is to finance the Group’s operations. The Group’s principal financial assets include trade and other receivables, and cash and short-term deposits that derive directly from its operations. The Group is exposed to market risk, credit risk and liquidity risk from its use of financial instruments which are summarised below. This note presents information about the Group’s exposure to the specific risks, and the policies and processes for measuring and managing those risks. The Board has the overall responsibility for the risk management framework while senior management oversees the management of these risks. Market risk Market risk is the risk that the fair value or future cash flows of a financial instrument will fluctuate because of changes in market prices. Market risk comprises three types of risk: interest rate risk, currency risk and other price risk, such as equity price risk and commodity risk. The Group is only exposed to interest rate and currency risk. The financial instrument affected by market risk is deposits. The sensitivity analyses in the following sections relate to the position as at 30 June 2020 and 2019. (a) Interest rate risk
Interest rate risk is the risk that the fair value or future cash flows of a financial instrument will fluctuate because of changes in market interest rates. The Group has cash assets which may be susceptible to fluctuations in changes in interest rates. The Group requires the cash assets to be sufficiently liquid to cover any planned or unforeseen future expenditure, which prevents the cash assets being committed to long term fixed interest arrangements. The Group enters into notice deposit arrangements of between one and three months to obtain flexible liquidity whilst fixing interest rate for a short period of time only. The Group does not employ interest rate swaps or enter into any other hedging activity with regards to its interest bearing investments. At the reporting date the interest rate profile of the Group’s interest-bearing financial instruments was:
Consolidated 2019 2019 $ $
Cash at bank 3,449,063 10,975,063 Other short-term bank/notice deposits 8,667,909 4,000,000
12,116,972 14,975,063
Interest rate sensitivity A change of 1% in interest rates at the reporting date as per management’s best estimate would have increased/(decreased) other comprehensive income and profit and loss by the amounts shown below. This analysis assumes all other variables remain constant. The same sensitivity analysis has been performed for the comparative reporting date.
Profit and Loss Other Comprehensive
Income 1% 1% 1% 1% Increase Decrease increase Decrease
30 June 2020 Cash and cash equivalents
121,170
(121,170)
-
-
30 June 2019 Cash and cash equivalents 149,751 (149,751) - -

NOTES TO THE CONSOLIDATED FINANCIAL STATEMENTS FOR THE FINANCIAL YEAR ENDED 30 JUNE 2020 (continued)
D e e p Y e l l o w L i m i t e d 7 3 2 0 2 0 A n n u a l R e p o r t
Note 19 Financial assets and liabilities (continued) (b) Currency risk
Foreign currency risk is the risk that the fair value or future cash flows of a financial instrument will fluctuate because of changes in foreign exchange rates. Financial assets in overseas Group companies are not generally material in the context of financial instruments entered into by the Group as a whole, as they generally relate to funds advanced to fund short term exploration and administration activities of the overseas operations. Once the funds are expended, they are no longer classified as financial assets. Advancing of funds to overseas operations on a needs basis, is an effective method for the management of currency risk. The Group’s investments in overseas subsidiary companies are not hedged as they are considered to be long term in nature. As a result of significant investment in Namibia, the Group’s Statement of Financial Position can be affected by movements in the Namibian dollar/Australian dollar/US dollar exchange rates. The Group does not consider there to be a significant exposure to the Namibian dollar or US dollar as they represent the functional currencies of controlled entities.
Foreign currency sensitivity A change of 5% in the Namibian dollar at the reporting date as per management’s best estimate would have increased/(decreased) profit and loss before tax and pre-tax equity by the amounts shown below. This analysis assumes all other variables remain constant. The same sensitivity analysis has been performed for the comparative reporting date. The Group’s exposure to foreign currency changes for all other currencies is not material. Change in Namibian dollar +5% -5% +5% -5% Decrease Increase Increase Decrease
Profit and Loss before tax Pre-tax Equity
30 June 2020 (31,188) 34,471 - - 30 June 2019 31,992 (28,945) - -
Credit risk Credit risk is the risk of financial loss to the Group if a customer or counterparty to a financial instrument fails to meet its contractual obligations, and arises principally from transactions with customers. The Group is exposed to credit risk from its operating activities and from its financing activities, including deposits with banks and foreign exchange transactions. Trade and other receivables
The majority of the receivables that materialise through the Group’s normal course of business is in relation to the NJV, for which Reptile Mineral Resources and Exploration (Pty) Ltd, a controlled entity, is the appointed Manager and has during the term of the Joint Venture always received funds timeously from the major funding partner, JOGMEC. The risk of non-recovery of receivables is therefore considered to be negligible. The Board does not consider there to be a significant exposure to credit risk in relation to trade and other receivables.
Cash at bank
Credit risk from balances with banks and financial institutions is managed by the Group Financial Controller and reviewed by the Board. Investments of surplus funds are made only with approved counterparties. The Group’s primary banker is Westpac Banking Corporation Limited (Westpac). At reporting date all current accounts are with this bank, other than funds transferred to Namibia to meet the working capital needs of the controlled entity, Reptile Mineral Resources and Exploration (Pty) Ltd. The cash needs of the controlled entity’s operations are monitored by the parent company and funds are advanced to the Namibian operations as required.
The Directors believe this is the most efficient method of combining the monitoring and mitigation of potential credit risks arising out of holding cash assets in overseas jurisdictions, and the funding mechanisms required by the Group.
Deposits at call
In addition, the Group has cash assets on notice (30 and 90-day) deposit with Westpac. The Board considers this financial institution, which have a short-term credit rating of A-1+ and long-term rating of AA- from Standard & Poor’s, to be appropriate for the management of credit risk with regards to funds on deposit.
Except for the matters above, the Group currently has no significant concentrations of credit risk.

NOTES TO THE CONSOLIDATED FINANCIAL STATEMENTS FOR THE FINANCIAL YEAR ENDED 30 JUNE 2020 (continued)
D e e p Y e l l o w L i m i t e d 7 4 2 0 2 0 A n n u a l R e p o r t
Note 19 Financial assets and liabilities (continued) The carrying amount of the Group’s financial assets represents the maximum credit exposure. The Group’s maximum exposure to credit risk at the reporting date was:
Consolidated 2020 2019 $ $
Cash and cash equivalents 3,449,063 10,975,063 Other short-term bank/notice deposits 8,667,909 4,000,000 Other receivables 298,265 461,989
12,415,237 15,437,052
Liquidity risk Liquidity risk is the risk that the Group will not be able to meet its financial obligations as they fall due. The Group’s only liabilities are short term trade and other payables and lease liabilities. The Group’s approach to managing liquidity is to ensure, as far as possible, that it will always have sufficient liquidity to meet its liabilities when due, under both normal and stressed conditions, without incurring unacceptable losses or risking damage to the Group’s reputation. Management manages its liquidity risk by monitoring its cash reserves and forecast spending, and is cognisant of the future demands for liquid financial resources to finance the Group’s current and future operations, and consideration is given to the liquid assets available to the Group before commitment is made to future expenditure or investment. The Group’s expenditure commitments are taken into account before entering into notice deposit investments and short and medium term exploration programs are tailored within current cash resources. The Group’s trade and other payables of $492,605 (2019: $509,661) are settled on 30-day trading terms. The maturity analysis for contractual undiscounted cash flows of lease liabilities are indicated in Note 2(d)(i). Note 20 Share-based payment plans (a) Types of share-based payments Performance Rights Under the Awards Plan, Performance Rights can be granted to Executives and other qualifying employees in order to align remuneration with shareholder wealth over the long-term and assist in attracting and retaining talented employees. These are granted for no consideration and each right upon vesting entitles the holder to one fully paid ordinary share in the capital of the Company if certain time and market price measures are met in the measurement period. During the 2020 financial year, The Group continued to issue Performance Rights to employees which were subject to time-based vesting conditions which prescribe periods of time that the employee must stay employed by the Company prior to automatic vesting. Prior year issues also included market price vesting conditions which measures the increase in share price of the Company. Unvested Performance Rights subject to the Market Price Condition will vest if, at the end of the measurement period, the share price of the Company has reached a pre-determined market price. If at any time prior to the Vesting Date an employee voluntarily resigns from employment with the Group or is terminated, the Performance Rights automatically lapse and are forfeited, subject to the discretion of the Board. The Board can at any time make a determination, including amended vesting conditions, that Performance Rights for which performance hurdles have not been met, continue as Unvested Performance Rights. They will lapse, if they have not already lapsed or vested for any other reason, 15 years after the date of grant.

NOTES TO THE CONSOLIDATED FINANCIAL STATEMENTS FOR THE FINANCIAL YEAR ENDED 30 JUNE 2020 (continued)
D e e p Y e l l o w L i m i t e d 7 5 2 0 2 0 A n n u a l R e p o r t
Note 20 Share-based payment plans (continued) Loan Plan Shares During the 2020 financial year shares were granted to the Managing Director, Executive Director, employees and contractors under the Deep Yellow Limited Loan Share Plan (Loan Share Plan). The Loan Share Plan rewards and incentivises employees (including Directors who are employees of the Company) and contractors (Participant), where shareholder approval has been granted (if required), through an arrangement where Participants are offered shares subject to long term performance conditions. The shares are offered at market value such that the incentive is linked to the increase in value over and above the purchase price and so aligns the Participants to the risks and rewards of a shareholder. The purchase price payable by the Participant for the ordinary shares is lent to the Participant under an interest free limited recourse loan, with the loan secured against the shares. A Participant may not trade shares acquired under the Loan Share Plan until the shares have vested, any imposed dealing restrictions have ended and the limited recourse loan in respect to those shares has been paid in full. For so long as there is an outstanding loan balance, the Participant irrevocably and unconditionally directs the Company to withhold all after tax dividends in respect of the Participants Loan Plans Shares and apply all amounts so withheld in repayment of the outstanding loan balance. The loan can be repaid at any time, however to avoid compulsory divestment of Loan Plan Shares, the loan must be repaid on the earlier of periods ranging between 5-10 years (determined with each issue) after the issuance of the shares and the occurrence of: (a) in the case of vested shares, the date being 12 months after cessation of employment or service contract for any
reason; or (b) pre-determined occurrences as per the Loan Share Plan including but not limited to a Control Event or material breach
by the Participant. The shares vest if certain Company share price targets and clearly defined business goals (where applicable) covering non-financial performance measures are met and the holder of the awards remains employed with the Company during the measurement period. If these conditions are not met the shares are forfeited and the forfeited shares are treated as full consideration for the repayment of the loan. The fair value at grant date is estimated using a Black Scholes option pricing model for shares with non-market based vesting conditions and a Monte-Carlo model for those with market based vesting conditions. (a) Summaries of Performance Rights and Loan Plan Shares granted The table below illustrates the number (No.) and weighted average exercise price (WAEP) of, and movements in, Loan Plan Shares during the year:
2020 2020 2019 2019 No. WAEP (cents) No. WAEP (cents) Outstanding at the start of the year 14,283,941 32.4 9,050,000 25.4 Granted during the year 8,631,205 27.0 6,283,941 46.5 Forfeited during the year (978,346) - (1,050,000) -
Outstanding at the end of the year 21,936,800 31.9 14,283,941 32.4
The table below illustrates the number (No.) and movements in Performance Rights during the year:
2020 2019 No. No. Outstanding at the start of the year 750,048 837,934 Granted during the year 531,363 447,437 Expired during the year (105,000) (121,000) Exercised during the year (571,850) (414,323)
Outstanding at the end of the year 604,561 750,048
(b) Summaries of Loan Plan Shares exercised during the year No Loan Plan Shares were exercised during the year. The limited recourse loans outstanding in relation to Loan Plan Shares at 30 June 2020 was $7,089,087 (2019: $5,219,033). 8,631,205 Loan Plan Shares were granted and 746,624 vested during the year. (c) Weighted average remaining contractual life The Loan Plan Shares outstanding at the end of the year have exercise prices between 22.0 and 46.5 cents. The weighted average remaining contractual life for the limited recourse loans outstanding in relation to Loan Plan Shares at 30 June 2019 is 5.45 years (2019: 6.83 years) The weighted average remaining contractual life for the Performance Rights outstanding as at 30 June 2020 is 10.78 months (2019: 7.05 months).

NOTES TO THE CONSOLIDATED FINANCIAL STATEMENTS FOR THE FINANCIAL YEAR ENDED 30 JUNE 2020 (continued)
D e e p Y e l l o w L i m i t e d 7 6 2 0 2 0 A n n u a l R e p o r t
Note 20 Share-based payment plans (continued) (d) Recognised share-based payment expenses The expense recognised for employee services during the year, arising from equity-settled share-based payment transactions in the form of Performance Rights and Loan Plan Shares is shown in the table below:
Consolidated 2020 2019 $ $
Amount recognised as employee expenses in the Consolidated Statement of Comprehensive Income
1,503,178 1,083,945
Amount recognised as capitalised mineral exploration and evaluation expenditure
58,460 72,139
1,561,638 1,156,084
There have been no modifications to share-based payment arrangements during the 2020 financial year. (e) Loan Plan Shares and Performance Rights pricing models The fair value of the Performance Rights and Loan Plan Shares granted under their respective plans are estimated as at the grant date. The following tables lists the inputs to the models used for the years ended 30 June 2020 and 30 June 2019.
Loan Plan Shares Grants 2020 2019 18 Dec 19 19 Nov 18 Pricing model Black Scholes (i)
Monte-Carlo simulation using
hybrid pricing model (ii)
Black Scholes (i) Monte-Carlo
simulation using hybrid pricing model
(ii)
Black Scholes (i) Monte-Carlo
simulation using hybrid pricing model
(ii)
Dividend yield (%) Zero Zero Zero Expected volatility (%) 70 70 100 Risk-free interest rate (%) 0.86 0.86 2.32 Expected repayment term of limited recourse loan in relation to Loan Plan Shares (years)
7 5 5
Closing share price at grant date (cents) 27.5 27.5 49.5 Fair value per right at grant date (cents) - Time-based vesting conditions 18.1 15.9 37.6 - Time and non-market price vesting conditions - 15.9 - Time and market price vesting conditions 12.9 12.3 32.4
The expected life of the limited recourse loan in relation to Loan Plan Shares is based on current expectations and is not necessarily indicative of repayment patterns that may occur. The expected volatility reflects the assumption that the historical volatility over a period similar to the life of the rights and repayment term of the limited recourse loan in relation to the Loan Plan Shares is indicative of future trends, which may not necessarily be the actual outcome.

NOTES TO THE CONSOLIDATED FINANCIAL STATEMENTS FOR THE FINANCIAL YEAR ENDED 30 JUNE 2020 (continued)
D e e p Y e l l o w L i m i t e d 7 7 2 0 2 0 A n n u a l R e p o r t
Note 20 Share-based payment plans (continued)
Performance Rights Grants 2020 2019 11 Oct 19 17 May 19 19 Nov 18 Pricing model
Black Scholes (i)
Black Scholes (i)
Black Scholes (i) Dividend yield (%) Zero Zero Zero Expected volatility (%) - - - Risk-free interest rate (%) - - - Expected life of rights 15 15 5 Closing share price at grant date (cents) 27.5 34.5 49.5 Fair value per right at grant date (cents)
Time-based vesting conditions 27.5 34.5 49.5
Time and market price vesting conditions N/A N/A N/A (i) Share-based payments subject to non-market based vesting conditions; and (ii) Share-based payments subject to market-based vesting conditions. Note 21 Commitments and contingencies (a) Exploration The Group has certain obligations to perform minimum exploration work on mineral leases held. These obligations may vary over time, depending on the Group’s exploration programs and priorities and may be reduced by the surrendering of tenements. These obligations are also subject to variations by farm-out arrangements or sale of the relevant tenements. This commitment does not include the expenditure commitments which are the responsibility of the joint venture partners. As at balance date, the Group has no outstanding commitment for exploration expenditure. (b) Contractual commitments There are no contracted commitments other than those disclosed above. (c) Contingent liabilities There were no material contingent liabilities as at 30 June 2020. Note 22 Related party disclosures Compensation of Key Management Personnel
Consolidated 2020 2019 $ $
Short-term employee benefits 1,091,428 1,096,733 Post-employment benefits 7,830 8,242 Share-based payment 724,338 566,345
Total compensation paid to Key Management Personnel 1,823,596 1,671,320
The amounts disclosed in the table are the amounts recognised as a cost during the reporting period related to Key Management Personnel.
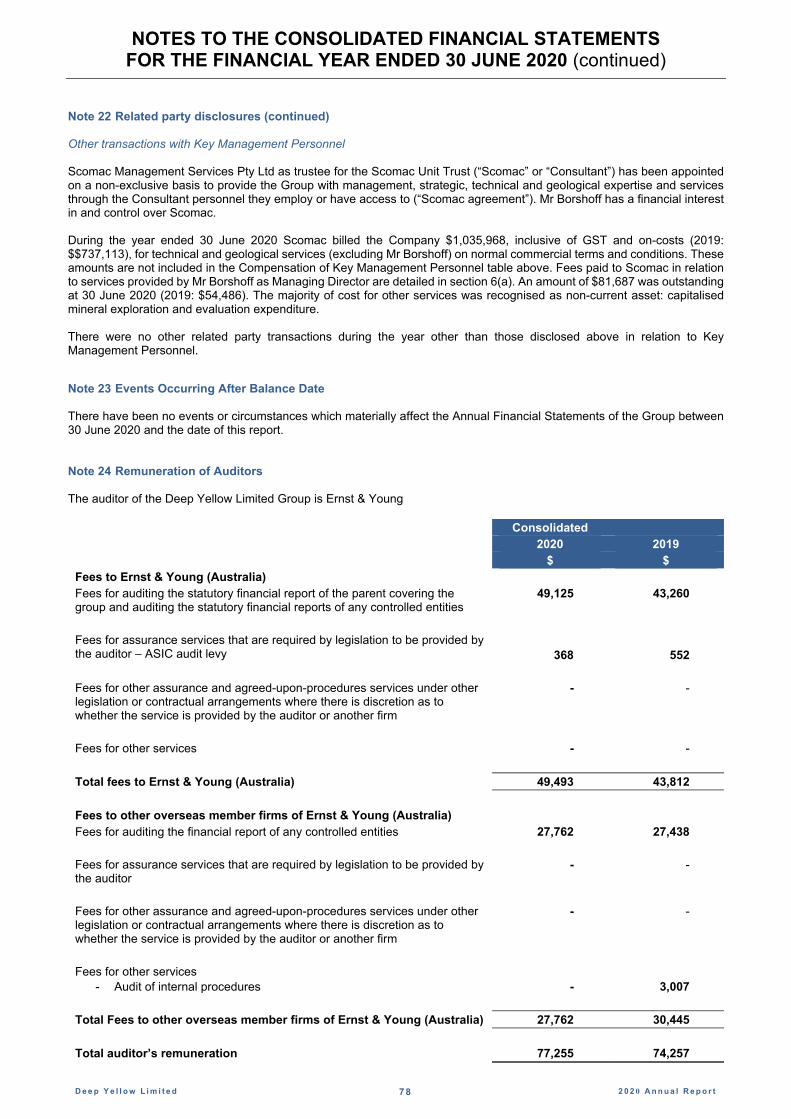
NOTES TO THE CONSOLIDATED FINANCIAL STATEMENTS FOR THE FINANCIAL YEAR ENDED 30 JUNE 2020 (continued)
D e e p Y e l l o w L i m i t e d 7 8 2 0 2 0 A n n u a l R e p o r t
Note 22 Related party disclosures (continued) Other transactions with Key Management Personnel Scomac Management Services Pty Ltd as trustee for the Scomac Unit Trust (“Scomac” or “Consultant”) has been appointed on a non-exclusive basis to provide the Group with management, strategic, technical and geological expertise and services through the Consultant personnel they employ or have access to (“Scomac agreement”). Mr Borshoff has a financial interest in and control over Scomac. During the year ended 30 June 2020 Scomac billed the Company $1,035,968, inclusive of GST and on-costs (2019: $$737,113), for technical and geological services (excluding Mr Borshoff) on normal commercial terms and conditions. These amounts are not included in the Compensation of Key Management Personnel table above. Fees paid to Scomac in relation to services provided by Mr Borshoff as Managing Director are detailed in section 6(a). An amount of $81,687 was outstanding at 30 June 2020 (2019: $54,486). The majority of cost for other services was recognised as non-current asset: capitalised mineral exploration and evaluation expenditure. There were no other related party transactions during the year other than those disclosed above in relation to Key Management Personnel.
Note 23 Events Occurring After Balance Date There have been no events or circumstances which materially affect the Annual Financial Statements of the Group between 30 June 2020 and the date of this report. Note 24 Remuneration of Auditors The auditor of the Deep Yellow Limited Group is Ernst & Young
Consolidated 2020 2019 $ $ Fees to Ernst & Young (Australia) Fees for auditing the statutory financial report of the parent covering the group and auditing the statutory financial reports of any controlled entities
49,125 43,260
Fees for assurance services that are required by legislation to be provided by the auditor – ASIC audit levy
368
552
Fees for other assurance and agreed-upon-procedures services under other legislation or contractual arrangements where there is discretion as to whether the service is provided by the auditor or another firm
- -
Fees for other services - -
Total fees to Ernst & Young (Australia) 49,493 43,812
Fees to other overseas member firms of Ernst & Young (Australia) Fees for auditing the financial report of any controlled entities 27,762 27,438 Fees for assurance services that are required by legislation to be provided by the auditor
- -
Fees for other assurance and agreed-upon-procedures services under other legislation or contractual arrangements where there is discretion as to whether the service is provided by the auditor or another firm
- -
Fees for other services
- Audit of internal procedures
-
3,007
Total Fees to other overseas member firms of Ernst & Young (Australia) 27,762 30,445
Total auditor’s remuneration 77,255 74,257

NOTES TO THE CONSOLIDATED FINANCIAL STATEMENTS FOR THE FINANCIAL YEAR ENDED 30 JUNE 2020 (continued)
D e e p Y e l l o w L i m i t e d 7 9 2 0 2 0 A n n u a l R e p o r t
Note 25 Parent entity Information
2020 2019 Information relating to Deep Yellow Limited: $ $
Current assets 11,882,974 14,993,355 Total assets 48,792,526 48,025,357 Current liabilities (584,727) (509,262) Total liabilities (1,121,390) (509,262)
Issued capital 249,753,196 247,264,524 Accumulated losses (215,558,334) (211,888,770) Equity compensation reserve 13,476,273 12,140,341
Total shareholders’ equity 47,671,135 47,516,095
Loss of the parent entity (3,669,563) (5,372,073) Total comprehensive loss of the parent entity (3,669,563) (5,372,073)
Contingent liabilities of the parent entity Deep Yellow Limited has entered into a Subordination Agreement on 31 March 2017. The agreement has subsequently been updated on 21 August 2018 and recently on 12 August 2020. The effect of the agreement is that Deep Yellow Limited has agreed to assist Reptile Uranium Namibia (Pty) Ltd, a Namibian subsidiary, by subordinating subject to certain terms and conditions, its non-current claims against Reptile Uranium Namibia (Pty) Ltd and in favour and for the benefit of other creditors of Reptile Uranium Namibia (Pty) Ltd. No liability is expected to arise. Note 26 Interests in Joint Operations Joint arrangements have been entered into with third parties, whereby the Group or the third parties can earn an interest in exploration areas by expending specified amounts in the exploration areas. There are no assets employed by these joint operations and the Group’s expenditure in respect of them is brought to account initially as capitalised exploration and evaluation expenditure. The Group is currently in the earn-in phase of its joint operations. The Group’s interest in joint operations is as follows: On 22 January 2013 the Company announced the execution of a Heads of Agreement with Epangelo Mining Company
(Pty) Ltd (Epangelo) to progress the Aussinanis project (Aussinanis) in Namibia. Epangelo, a private company owned by the Government of the Republic of Namibia has acquired 5% of Aussinanis by funding testwork. Epangelo can earn up to 50% of the project by funding the Project through to a bankable feasibility study.

DIRECTORS’ DECLARATION
D e e p Y e l l o w L i m i t e d 8 0 2 0 2 0 A n n u a l R e p o r t
In accordance with a resolution of the Directors of Deep Yellow Limited (‘the Company’), I state that: 1. In the opinion of the Directors: (a) the financial statements and notes of the consolidated entity for the financial year ended 30 June 2020 are in
accordance with the Corporations Act 2001, including:
(i) complying with Australian Accounting Standards (including the Australian Accounting Interpretations) and the Corporations Regulations 2001; and
(ii) giving a true and fair view of the consolidated entity’s financial position as at 30 June 2020 and of its
performance for the year ended on that date; (b) the financial statements and notes also comply with International Financial Reporting Standards as disclosed in Note
1; and (c) there are reasonable grounds to believe that the Company will be able to pay its debts as and when they become due
and payable. 2. This declaration has been made after receiving the declarations to be made to the Directors in accordance with Section
295A of the Corporations Act 2001 for the financial year ended 30 June 2020. On behalf of the Board
John Borshoff Managing Director 25th day of September 2020

A member firm of Ernst & Young Global Limited Liability limited by a scheme approved under Professional Standards Legislation
RK:DA:DYL:009
Ernst & Young 11 Mounts Bay Road Perth WA 6000 Australia GPO Box M939 Perth WA 6843
Tel: +61 8 9429 2222 Fax: +61 8 9429 2436 ey.com/au
Independent auditor’s report to the members of Deep Yellow Limited
Report on the audit of the financial report
Opinion
We have audited the financial report of Deep Yellow Limited (the Company) and its subsidiaries (collectively the
Group), which comprises the consolidated statement of financial position as at 30 June 2020, the
consolidated statement of profit and or loss and other comprehensive income, consolidated statement
of changes in equity and consolidated cash flows statement for the year then ended, notes to the
financial statements, including a summary of significant accounting policies, and the directors’
declaration.
In our opinion, the accompanying financial report of the Group is in accordance with the Corporations
Act 2001, including:
a. Giving a true and fair view of the consolidated financial position of the Group as at 30 June 2020
and of its consolidated financial performance for the year ended on that date; and
b. Complying with Australian Accounting Standards and the Corporations Regulations 2001.
Basis for opinion
We conducted our audit in accordance with Australian Auditing Standards. Our responsibilities under
those standards are further described in the Auditor’s Responsibilities for the Audit of the Financial
Report section of our report. We are independent of the Group in accordance with the auditor
independence requirements of the Corporations Act 2001 and the ethical requirements of the
Accounting Professional and Ethical Standards Board’s APES 110 Code of Ethics for Professional
Accountants (including Independence Standards) (the Code) that are relevant to our audit of the
financial report in Australia. We have also fulfilled our other ethical responsibilities in accordance with
the Code.
We believe that the audit evidence we have obtained is sufficient and appropriate to provide a basis
for our opinion.
Key audit matters
Key audit matters are those matters that, in our professional judgment, were of most significance in
our audit of the financial report of the current year. These matters were addressed in the context of
our audit of the financial report as a whole, and in forming our opinion thereon, but we do not provide
a separate opinion on these matters. For each matter below, our description of how our audit
addressed the matter is provided in that context.
We have fulfilled the responsibilities described in the Auditor’s Responsibilities for the Audit of the
Financial Report section of our report, including in relation to these matters. Accordingly, our audit
included the performance of procedures designed to respond to our assessment of the risks of
material misstatement of the financial report. The results of our audit procedures, including the
procedures performed to address the matters below, provide the basis for our audit opinion on the
accompanying financial report.
81

A member firm of Ernst & Young Global Limited Liability limited by a scheme approved under Professional Standards Legislation
RK:DA:DYL:009
Carrying value of capitalised exploration and evaluation assets
Why significant How our audit addressed the key audit matter
As disclosed in Note 14, at 30 June 2020, the Group held capitalised exploration and evaluation expenditure assets of $35.4 million.
The carrying value of exploration and evaluation expenditure is assessed for impairment by the Group when facts and circumstances indicate that the carrying value of exploration and evaluation expenditure assets may exceed their recoverable amount. Previously recognised impairment write-downs on capitalised mineral exploration and evaluation expenditure are also required to be assessed for reversals of impairment.
The determination as to whether there are any indicators to require an exploration and evaluation asset to be assessed for impairment or for reversals of impairment, involves a number of judgments including whether the Group has tenure, will be able to perform ongoing expenditure and whether there is market evidence to indicate that the fair value of the exploration and evaluation asset has changed substantially from when previous impairment write-downs were recognised.
As at reporting date, the Group concluded that there were indicators that the recoverable amount of the Reptile exploration and evaluation assets had increased from when impairment write-downs were recognised in prior years, due to the discovery of additional resources, increases in uranium prices and overall improved market sentiment for uranium. The Group determined that the fair value less cost of disposal of the Reptile project, as at reporting date, based on comparable transactions resulting in an impairment reversal of $7.1 million being recognised in the statement of profit or loss.
Given the size of the balance, the judgmental nature in identifying indicators of impairment or reversals of impairment and the estimation involved in the determination of the fair value less cost of disposal of exploration and evaluation assets, we considered this a key audit matter.
In performing our procedures, we:
► Considered the Group’s right to explore in therelevant areas of interest, which includedobtaining and assessing supportingdocumentation such as tenure documents
► Considered the Group’s intention to carry outsignificant exploration and evaluation activity inthe relevant areas of interest, which includedassessment of the Group’s cash-flow forecastmodels, discussions with senior managementand directors as to the intentions and strategyof the Group
► Evaluated the scope, competency andobjectivity of the Group’s experts whodetermined resources estimates used inestimating the recoverable amount byconsidering the work that they were engaged toperform, their professional qualifications,experience and use of industry acceptedmethodology
► Involved our valuation specialists in assessingwhether the resource multiples used in theestimation the recoverable amount was within areasonable range based on comparable markettransactions
► Evaluated changes in uranium prices, foreignexchange rates and other external marketconditions in considering the impact that thiswould have on the recoverable amount
► Assessed the adequacy of the disclosureincluded in the financial report
82

A member firm of Ernst & Young Global Limited Liability limited by a scheme approved under Professional Standards Legislation
RK:DA:DYL:009
Performance rights and loan plan shares
Why significant How our audit addressed the key audit matter
As disclosed in Note 20, at 30 June 2020 the Grouphad granted share based payment awards in the formof loan plan shares and performance share rights(both valued as share options). The awards vestsubject to the achievement of certain vestingconditions.
In determining the fair value of the awards and related expense the Group uses assumptions in respect of future market and economic conditions.
The Group used the Black Scholes and Monte Carlo Simulation models in valuing the share-based payment awards.
Due to the complex and judgmental estimates used in determining the valuation of the share based payments and vesting expense, we considered the Group’s calculation of the share based payment expense to be a key audit matter.
In performing our audit procedures, we:
► Assessed the third party expert engaged by theGroup for the purposes of performing anindependent valuation on the awards that haveshare price target vesting conditions. Thisincluded assessing the objectivity andcompetence of the third party expert
► Involved our valuation specialists to assess theassumptions used in the third party expert’svaluation, being the share price of theunderlying equity, interest rate, volatility,dividend yield, time to maturity (expected life)and grant date.
► Recalculated the vesting expense, based onthe service vesting periods of the share basedpayment awards and the likelihood of any nonmarket vesting condition being achieved.
► Assessed the adequacy of the disclosureincluded in the financial report
Information other than the financial report and auditor’s report thereon
The directors are responsible for the other information. The other information comprises the
information included in the Company’s 30 June 2020 Annual Report, but does not include the
financial report and our auditor’s report thereon.
Our opinion on the financial report does not cover the other information and accordingly we do not
express any form of assurance conclusion thereon, with the exception of the Remuneration Report
and our related assurance opinion.
In connection with our audit of the financial report, our responsibility is to read the other information
and, in doing so, consider whether the other information is materially inconsistent with the financial
report or our knowledge obtained in the audit or otherwise appears to be materially misstated.
If, based on the work we have performed, we conclude that there is a material misstatement of this
other information, we are required to report that fact. We have nothing to report in this regard.
Responsibilities of the Directors for the financial report
The directors of the Company are responsible for the preparation of the financial report that gives a
true and fair view in accordance with Australian Accounting Standards and the Corporations Act 2001
and for such internal control as the directors determine is necessary to enable the preparation of the
financial report that gives a true and fair view and is free from material misstatement, whether due to
fraud or error.
83

A member firm of Ernst & Young Global Limited Liability limited by a scheme approved under Professional Standards Legislation
RK:DA:DYL:009
In preparing the financial report, the directors are responsible for assessing the Group’s ability to
continue as a going concern, disclosing, as applicable, matters relating to going concern and using the
going concern basis of accounting unless the directors either intend to liquidate the Group or to cease
operations, or have no realistic alternative but to do so.
Auditor’s responsibilities for the audit of the financial report
Our objectives are to obtain reasonable assurance about whether the financial report as a whole is
free from material misstatement, whether due to fraud or error, and to issue an auditor’s report that
includes our opinion. Reasonable assurance is a high level of assurance but is not a guarantee that an
audit conducted in accordance with the Australian Auditing Standards will always detect a material
misstatement when it exists. Misstatements can arise from fraud or error and are considered material
if, individually or in the aggregate, they could reasonably be expected to influence the economic
decisions of users taken on the basis of this financial report.
As part of an audit in accordance with the Australian Auditing Standards, we exercise professional
judgment and maintain professional scepticism throughout the audit. We also:
► Identify and assess the risks of material misstatement of the financial report, whether due to
fraud or error, design and perform audit procedures responsive to those risks, and obtain audit
evidence that is sufficient and appropriate to provide a basis for our opinion. The risk of not
detecting a material misstatement resulting from fraud is higher than for one resulting from
error, as fraud may involve collusion, forgery, intentional omissions, misrepresentations, or the
override of internal control.
► Obtain an understanding of internal control relevant to the audit in order to design audit
procedures that are appropriate in the circumstances, but not for the purpose of expressing an
opinion on the effectiveness of the Group’s internal control.
► Evaluate the appropriateness of accounting policies used and the reasonableness of accounting
estimates and related disclosures made by the directors.
► Conclude on the appropriateness of the directors’ use of the going concern basis of accounting
and, based on the audit evidence obtained, whether a material uncertainty exists related to
events or conditions that may cast significant doubt on the Group’s ability to continue as a going
concern. If we conclude that a material uncertainty exists, we are required to draw attention in
our auditor’s report to the related disclosures in the financial report or, if such disclosures are
inadequate, to modify our opinion. Our conclusions are based on the audit evidence obtained up
to the date of our auditor’s report. However, future events or conditions may cause the Group to
cease to continue as a going concern
► Evaluate the overall presentation, structure and content of the financial report, including the
disclosures, and whether the financial report represents the underlying transactions and events
in a manner that achieves fair presentation.
► Obtain sufficient appropriate audit evidence regarding the financial information of the entities or
business activities within the Group to express an opinion on the financial report. We are
responsible for the direction, supervision and performance of the Group audit. We remain solely
responsible for our audit opinion.
84

A member firm of Ernst & Young Global Limited Liability limited by a scheme approved under Professional Standards Legislation
RK:DA:DYL:009
We communicate with the directors regarding, among other matters, the planned scope and timing of
the audit and significant audit findings, including any significant deficiencies in internal control that we
identify during our audit.
We also provide the directors with a statement that we have complied with relevant ethical
requirements regarding independence, and to communicate with them all relationships and other
matters that may reasonably be thought to bear on our independence, and where applicable, actions
taken to eliminate threats or safeguards applied.
From the matters communicated to the directors, we determine those matters that were of most
significance in the audit of the financial report of the current year and are therefore the key audit
matters. We describe these matters in our auditor’s report unless law or regulation precludes public
disclosure about the matter or when, in extremely rare circumstances, we determine that a matter
should not be communicated in our report because the adverse consequences of doing so would
reasonably be expected to outweigh the public interest benefits of such communication.
Report on the audit of the Remuneration Report
Opinion on the Remuneration Report
We have audited the Remuneration Report included in pages 26 to 38 of the directors’ report for the
year ended 30 June 2020.
In our opinion, the Remuneration Report of Deep Yellow Limited for the year ended 30 June 2020,
complies with section 300A of the Corporations Act 2001.
Responsibilities
The directors of the Company are responsible for the preparation and presentation of the
Remuneration Report in accordance with section 300A of the Corporations Act 2001. Our
responsibility is to express an opinion on the Remuneration Report, based on our audit conducted in
accordance with Australian Auditing Standards.
Ernst & Young
Robert A Kirkby
Partner
Perth
25 September 2020
85

ASX ADDITIONAL INFORMATION
D e e p Y e l l o w L i m i t e d 8 6 2 0 2 0 A n n u a l R e p o r t
Additional information required by the Australian Stock Exchange Ltd and not shown elsewhere in this report is as follows. The information is current as at 11 September 2020. (a) Distribution of Equity Securities Ordinary share capital 245,052,016 fully paid ordinary shares are held by 6,835 individual shareholders In accordance with the Company’s Constitution, voting rights in respect of ordinary shares are on a show of hands whereby each member present in person or by proxy shall have one vote and upon a poll, each share will have one vote. All issued ordinary shares carry the rights to dividends. Options 62,464,618 Options are held by 414 individual option holders with each option having an exercise price of $0.50 and expiring on the earlier of: (i) 1 June 2022; and (ii) 22 ASX Business Days after the Notification Date
The Notification Date means the date (being any date within 5 ASX Business Days of the Acceleration Trigger Date) on which Option holders are notified of the Acceleration Trigger Date” with such notification to be released on the Exchange. The Acceleration Trigger Date means that date, that the closing price of the Shares on ASX is higher than A$0.78 for any 20 consecutive ASX Business Day period, then on the 20th consecutive ASX Business Day of any such period.
Options do not carry a right to vote. The number of shareholders, by size of holding, in each class are:
Distribution Fully paid ordinary shares Options
1 – 1,000 3,185 84 1,001 – 5,000 2,022 136 5,001 – 10,000 537 46 10,001- 100,000 928 104 More than 100,000 163 44 Totals 6,835 414 Holding less than a marketable parcel 3,906 263
(b) Substantial Shareholders The following information is extracted from the Company’s Register of Substantial Shareholders:
Shareholder Name Issued Ordinary Shares
Number Percentage SPROTT, EXPLORATION CAPITAL PARTNERS 2014 LP AND ASSOCIATED ENTITIES 25,715,898 10.50 COLLINES INVESTMENTS LIMITED 19,680,292 8.54 PARADICE INVESTMENT MANAGEMENT PTY LTD 17,741,935 7.70 Totals 63,138,125 26.74
The above shareholdings are disclosed pursuant to section 671B (3) of the Corporations Act 2001 but the relevant interests shown do not necessarily represent the beneficial interest in the share capital of the Company or the parties concerned.

ASX ADDITIONAL INFORMATION (continued)
D e e p Y e l l o w L i m i t e d 8 7 2 0 2 0 A n n u a l R e p o r t
(c) Twenty Largest Shareholders The names of the twenty largest holders of ordinary shares are listed below:
Shareholder Name Ordinary Shares
Number Percentage CITICORP NOMINEES PTY LIMITED 43,655,875 17.81 J P MORGAN NOMINEES AUSTRALIA PTY LIMITED 38,500,942 15.71 HSBC CUSTODY NOMINEES (AUSTRALIA) LIMITED 31,831,273 12.99 MR JOHN BORSHOFF 9,842,040 4.02 BNP PARIBAS NOMINEES PTY LTD <IB AU NOMS RETAILCLIENT DRP> 8,890,368 3.63 MS GILLIAN SWABY 6,271,093 2.56 SANDHURST TRUSTEES LTD <COLLINS ST VALUE FUND A/C> 4,211,915 1.72 MERRILL LYNCH (AUSTRALIA) NOMINEES PTY LIMITED 4,206,912 1.72 HSBC CUSTODY NOMINEES (AUSTRALIA) LIMITED <EUROCLEAR BANK SA NV A/C> 3,697,570 1.51 MR ED BECKER 2,659,564 1.09 ELEGANT WORLD PTY LTD <M I T PARTNERS A/C> 2,500,000 1.02 MCNEIL NOMINEES PTY LIMITED 2,481,221 1.01 BNP PARIBAS NOMS PTY LTD <DRP> 2,279,739 0.93 RAVELLO GROUP PTY LIMITED <S J MALLYON SUPER FUND A/C> 1,612,904 0.66 URSULA PRETORIUS 1,570,675 0.64 HSBC CUSTODY NOMINEES (AUSTRALIA) LIMITED 1,483,779 0.61 MR JEAN CORBIN 1,369,998 0.56 MR ANDREW WILDE 1,325,981 0.54 MR MERVYN PATRICK GREENE 1,296,858 0.53 TIERRA DE SUENOS SA 870,566 0.36 Totals 170,559,273 69.60
(d) Twenty Largest Option Holders The names of the twenty largest holders of Options are listed below:
Option Holder Name Options
Number Percentage CITICORP NOMINEES PTY LIMITED 28,210,029 45.16 J P MORGAN NOMINEES AUSTRALIA PTY LIMITED 7,637,221 12.23 BNP PARIBAS NOMINEES PTY LTD <IB AU NOMS RETAILCLIENT DRP> 5,015,646 8.03 MR BENJAMIN PETER GRILLS <GRILLSCORP INVESTMENT A/C> 2,550,821 4.08 HSBC CUSTODY NOMINEES (AUSTRALIA) LIMITED 2,142,690 3.43 MR BENJAMIN PETER GRILLS + MRS JESSICA LEE NAY-GRILLS <GRILLSCORP O VIEWS S/F A/C>
1,153,733 1.85
MS MEI-LING FU 1,000,000 1.60 HSBC CUSTODY NOMINEES (AUSTRALIA) LIMITED-GSCO ECA 1,000,000 1.60 MRS CATHERINE JANINE DENTRINOS + MR NICKOLAS DENTRINOS 800,000 1.28 M & K KORKIDAS PTY LTD <M&K KORKIDAS P/L S/FUND A/C> 756,191 1.21 MR PHILIP BOMFORD 660,000 1.06 MR DOMINIC CAELIN TANGNEY 500,000 0.80 TESANO PTY LTD <BAILEY FAMILY A/C> 500,000 0.80 MR GERARD MEEHAN 400,000 0.64 SCARF FAMILY SUPERANNUATION PTY LIMITED <SCARF FAMILY S/F A/C>
400,000 0.64
MR KELVINDER SINGH 370,000 0.59 MR POH SENG TAN 300,000 0.48 PPF ADVISORY PTY LTD 250,000 0.40 MS KIM LIAN CHOO 231,000 0.37 GECKO RESOURCES PTY LTD 210,000 0.34 Totals 54,087,331 86.59
(e) Restricted Securities As at 30 June 2020 there were no restricted securities.

SCHEDULE OF MINERAL TENURE
As at 11 September 2020
D e e p Y e l l o w L i m i t e d 8 8 2 0 1 9 A n n u a l R e p o r t
NAMIBIA
Number Name Interest Expiry Date JV Parties Approx. Area (km2)
EPL 3496#1 Tubas 100% 04.08.2021 - 672 EPL 3497#1 Tumas 100% 04.08.2021 - 287 MDRL 3498#2 Aussinanis 85% 05.01.2025 [5% Epangelo #4 142 10% Oponona#5] EPL 3669 Tumas North 65% 30.03.2022 [25% Nova (Africa) #6 122 EPL 3670 Chungochoab 65% 30.03.2022 10% Sixzone #7] 477 ML 176 #3 Shiyela 95% 05.12.2027 5% Oponona #5 54 EPL 6820#1 Rooikop East 100% 02.08.2023 - 109 #1 5% right granted to Oponona#5 in 2009 to participate in any projects which develop from these EPLs
#2 A MDRL to secure the uranium resource within EPL3498 was granted on 6 January 2020. #3 Located entirely within EPL3496 #4 Epangelo Mining (Pty) Ltd #5 Oponona Investments (Pty) Ltd #6 Nova (Africa) Pty Ltd #7 Sixzone Investments (Pty) Ltd 1,959
AGREEMENTS
Approx. Area (km2) ABM Resources NL - Northern Territory (100% uranium rights stay with DYL) 5,257 5,257

Unit 17, Second Floor, Spectrum Building, 100-104 Railway Road, Subiaco, Western Australia 6008
Tel: +61 8 9286 6999 Email: [email protected]
www.deepyellow.com.au


