11
Growth Committee – February 2021 2020 Rental Market Report

Growth Committee – February 2021
2020 Rental Market Report
• CMHC released their Annual Rental Market Study on January 28th, 2021
• Canada Mortgage and Housing Corporation (CMHC) conducts the Rental Market Survey (RMS) every year in October to estimate the relative strengths in the rental market.
• The survey is conducted on a sample basis in all urban areas with populations of 10,000 or more, and targets only privately initiated structures with at least three rental units, which have been on the market for at least three months.
2
Background
• Vacancy Rates in Saint John CMA dropped from 3.3% to 3.1%
• This is likely triggered by demand from:• Population growth
• People downsizing e.g., empty nesters selling homes to move into rental units with less maintenance.
• We have slightly higher vacancy than Moncton (2.8%) and Fredericton (2.5%)
• Development has not yet kept pace with demand.• This is despite record number of Housing Completions
3
Vacancy Rates
4
Housing Completions
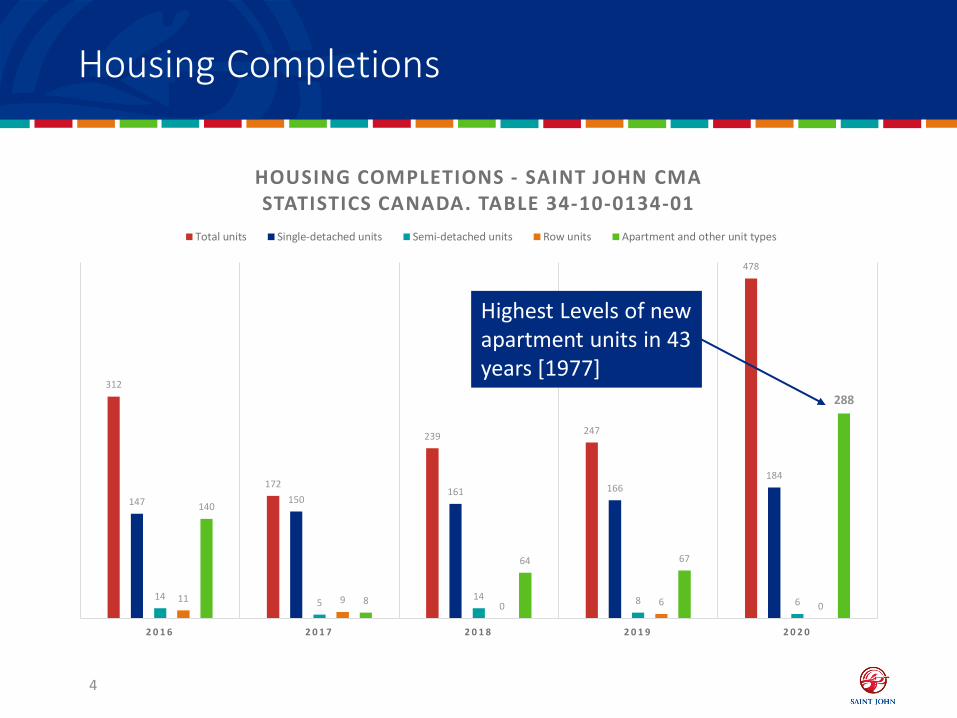
312
172
239 247
478
147 150161 166
184
14 5 14 8 611 9 0 6 0
140
8
64 67
288
2 0 1 6 2 0 1 7 2 0 1 8 2 0 1 9 2 0 2 0
HOUSING COMPLETIONS - SAINT JOHN CMASTATISTICS CANADA. TABLE 34-10-0134-01
Total units Single-detached units Semi-detached units Row units Apartment and other unit types
Highest Levels of new apartment units in 43 years [1977]
Vacancy By Size
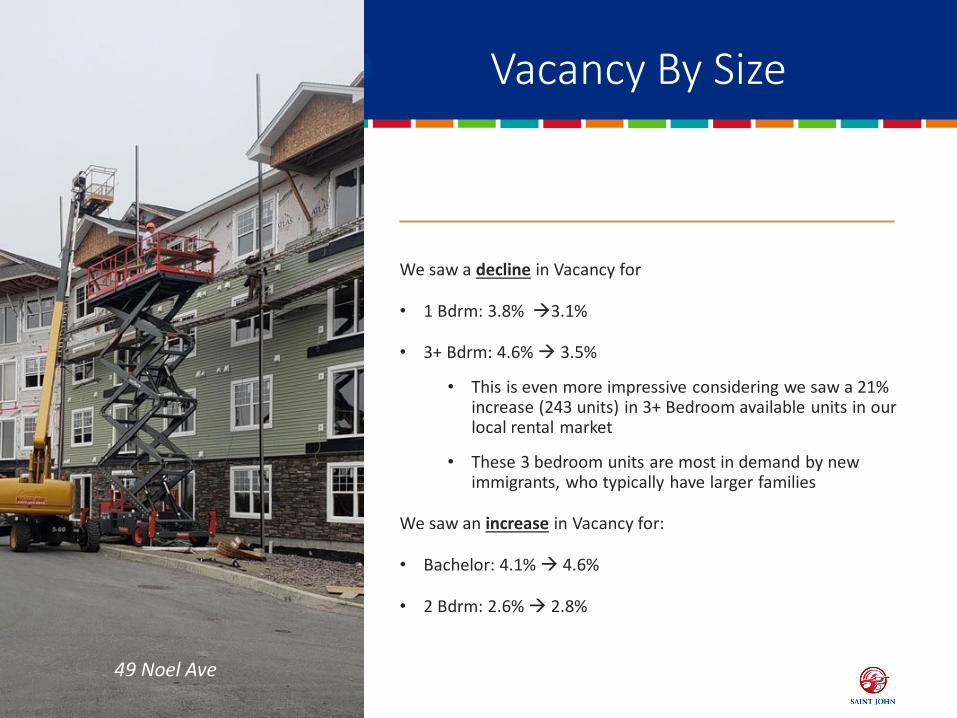
We saw a decline in Vacancy for
• 1 Bdrm: 3.8% 3.1%
• 3+ Bdrm: 4.6% 3.5%
• This is even more impressive considering we saw a 21% increase (243 units) in 3+ Bedroom available units in our local rental market
• These 3 bedroom units are most in demand by new immigrants, who typically have larger families
We saw an increase in Vacancy for:
• Bachelor: 4.1% 4.6%
• 2 Bdrm: 2.6% 2.8%
549 Noel Ave
Rent Cost
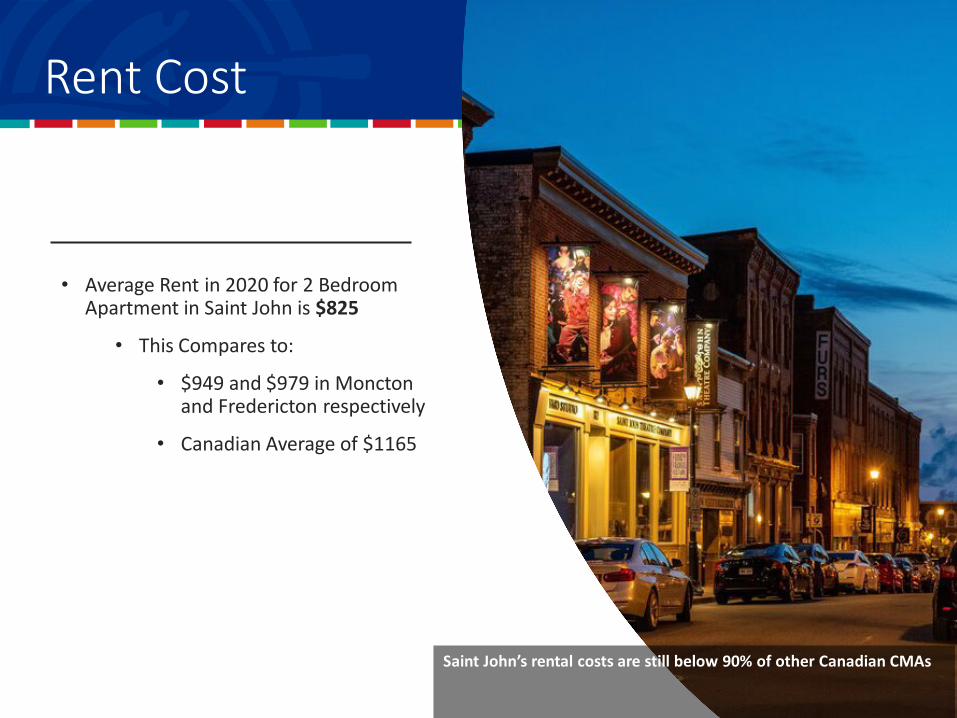
• Average Rent in 2020 for 2 Bedroom Apartment in Saint John is $825
• This Compares to:
• $949 and $979 in Moncton and Fredericton respectively
• Canadian Average of $1165
Saint John’s rental costs are still below 90% of other Canadian CMAs

7
Rent by Area2020 Bachelor 1 Bedroom 2 Bedroom 3 Bedroom + Total
Neighbourhood Avg Rent % Change from 2019 Avg Rent % Change
from 2019 Avg Rent % Change from 2019 Avg Rent % Change
from 2019 Avg Rent % Change from 2019
Central Peninsula $ 563 6.3 $ 721 3.6 $ 875 6.2 $ 1,059 ** $ 798 5.3
West ** ** $ 604 ** $ 716 1.3 $ 815 ** $ 706 2.1
North $ 610 5.1 $ 739 3.3 $ 839 2.7 $ 818 3.7 $ 812 3
East $ 602 ** $ 668 2.5 $ 826 2.1 $ 818 1.4 $ 784 2.4
Saint John City $ 572 5.2 $ 703 3 $ 826 3.4 $ 857 3.3 $ 787 3.5
Outlying Areas ** ** $ 641 ** $ 819 ++ $ 796 ++ $ 803 ++
Saint John CMA $ 572 5.2 $ 701 3.3 $ 825 3.3 $ 854 3.3 $ 788 3.6
O'LEARY COURT RETIREMENT LIVING COMPLEX
8
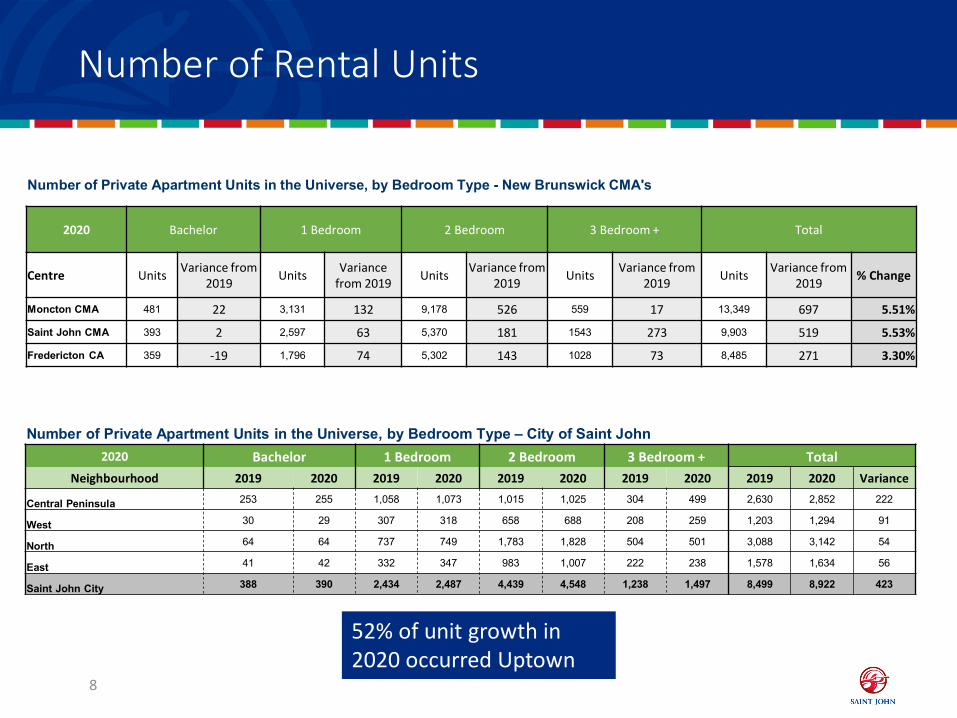
Number of Rental Units
Number of Private Apartment Units in the Universe, by Bedroom Type - New Brunswick CMA's
2020 Bachelor 1 Bedroom 2 Bedroom 3 Bedroom + Total
Centre Units Variance from 2019 Units Variance
from 2019 Units Variance from 2019 Units Variance from
2019 Units Variance from 2019 % Change
Moncton CMA 481 22 3,131 132 9,178 526 559 17 13,349 697 5.51%
Saint John CMA 393 2 2,597 63 5,370 181 1543 273 9,903 519 5.53%
Fredericton CA 359 -19 1,796 74 5,302 143 1028 73 8,485 271 3.30%
Number of Private Apartment Units in the Universe, by Bedroom Type – City of Saint John 2020 Bachelor 1 Bedroom 2 Bedroom 3 Bedroom + Total
Neighbourhood 2019 2020 2019 2020 2019 2020 2019 2020 2019 2020 Variance
Central Peninsula 253 255 1,058 1,073 1,015 1,025 304 499 2,630 2,852 222
West 30 29 307 318 658 688 208 259 1,203 1,294 91
North 64 64 737 749 1,783 1,828 504 501 3,088 3,142 54
East 41 42 332 347 983 1,007 222 238 1,578 1,634 56
Saint John City 388 390 2,434 2,487 4,439 4,548 1,238 1,497 8,499 8,922 423
52% of unit growth in 2020 occurred Uptown

• There is strong demand for rental units, and 90% of all units in the Saint John CMA are located in the City.
• We are seeing decreasing vacancy likely due to population growth from immigration and baby boomers down-sizing
• Decreased vacancy usually correlates with an increase in rent until enough new units come online to reduce market pressure
• Saint John is still very affordable by Canadian Standards with rent being cheaper than 90% of other Canadian CMA’s on average
• The cost of rent is exceeding inflation (.62% in 2020) in every neighbourhood, however this should be seen in context.
• Average % Change in Rent in Saint John CMA: 3.6%• Average % Change in Rent in Canadian CMAs: 3.6%
• Development is not keeping pace with demand.• Despite record housing completions, vacancy is still decreasing.
9
Summary Insights

• Approximately 36% of renters in Saint John are spending 30% of more on shelter costs – approximately 5000 people. Almost 14% are spending 50% or more on shelter costs [2016 Census].
• These renters are most exposed to rent increases.
• Feedback from external stakeholders:• Staff will investigate with CMHC how to account for housing costs that fall outside
rent and its impact on tenants (i.e. heat, electricity, etc).
• Stakeholders shared with staff that they are hearing of increased numbers of evictions and average rents increasing beyond what is portrayed by CMHC
• This is concerning and warrants further investigation
10
Summary Insights -

11
Questions


