FDIC QUARTERLY 51 2020 SUMMARY OF DEPOSITS HIGHLIGHTS Introduction The 2020 Summary of Deposits (SOD) Survey showed a 21.7 percent increase in deposits, the largest one-year percentage increase in nearly 80 years. 1 The increase in deposits held by FDIC-insured institutions from June 2019 to June 2020 occurred primarily in the first two quarters of 2020, and was likely driven by reactions of individuals, businesses, and U.S. fiscal and monetary authorities to the COVID-19 pandemic. 2 The survey also showed a decrease in the number of offices of FDIC-insured institu- tions. The number of bank offices declined nationwide between June 2019 and June 2020, continuing an 11-year trend, but the rate of decline was lower in 2020 than in the three previous years. The lower rate of decline in the number of offices was influenced by both a relatively high rate of office openings and a relatively low rate of office closures. The number of offices declined across all three county types—metropolitan, micropolitan, and rural—and the rate of decline was fastest among offices in metropolitan counties. Total Deposits Grew at a Record Rate Total deposits increased 21.7 percent, from $12.77 trillion to $15.54 trillion, between June 2019 and June 2020 (Chart 1). This one-year rate of deposit growth was the highest in 77 years. In the year ending June 30, 2020, the rate of deposit growth increased for commu- nity banks and noncommunity banks, for small, midsize, and large banks, for banks located in metropolitan, micropolitan, and rural counties, and for all but one lending specialization. The additional funds that individuals and businesses received from programs that were implemented in the first half of 2020 to alleviate financial hardship caused by the pandemic, paired with economic uncertainty resulting from the pandemic, drove individu- als and businesses to save more, leading to the sharp increase in bank deposits. 3 Actions by U.S. fiscal and monetary authorities included the Pandemic Emergency Unemployment Compensation Program, the U.S. Small Business Administration Paycheck Protection Program, the Federal Reserve Paycheck Protection Program Liquidity Facility, Economic Impact Payments (coronavirus stimulus checks), and aggressive interest rate cuts by the Federal Reserve. Additionally, the Federal Reserve purchased U.S. Treasury securities, mortgage-backed securities, and other financial instruments to support the flow of credit to U.S. households and businesses and to promote financial stability. 4 1 “Deposits” refers to deposits in offices of FDIC-insured institutions in the United States, U.S. territories, and possessions. U.S. offices of foreign institutions and their deposits are not included. The FDIC’s 2020 Annual Report shows growth in domestic deposits of 26.2 percent in 1942, 24.2 percent in 1943, and 46 percent in 1989, all of which are higher than the 21.7 percent deposit growth reported in the 2020 SOD survey. The high growth in 1989 is the result of the fact that 1989 was the first year in which deposits of institutions covered under both the Bank Insurance Fund (BIF) and the Savings Association Insurance Fund (SAIF) were included in the domestic deposit totals shown in the Annual Report. According to FDIC Call Report data, if institutions covered under both the BIF and the SAIF are included in the sum of total domestic deposits in 1988, deposit growth in 1989 would be much lower at 2.9 percent. Given that growth in domestic deposits in 1989 was driven by this change in how deposit totals were reported, 1943 is the most recent year in which deposit growth was higher than the growth shown in the 2020 SOD survey. Importantly, the Annual Report shows deposit totals as of December 31 of each year while the SOD survey reports deposit totals as of June 30 of each year, so year-over-year growth rates calculated based on these two sources would be similar but not identical. See FDIC Annual Report 2020: 138-140, https://www.fdic.gov/about/financial-reports/reports/2020annualreport/2020ar-final.pdf. 2 FDIC Call Report data from 2019 and 2020 show that domestic deposits of FDIC-insured institutions increased about 1.8 percent in both the third and fourth quarters of 2019, by 8.2 percent in the first quarter of 2020, and 8.5 percent in the second quarter of 2020. 3 Total personal income increased in the second quarter of 2020, despite a decrease in employment income, because of increased government transfer payments. Savings as a percentage of disposable personal income increased from 7.3 percent in the fourth quarter of 2019 to 26 percent in the second quarter of 2020. See U.S. Bureau of Economic Analysis, “Personal Income and Outlays, November 2020,” news release no. BEA 20-68, December 23, 2020, https://www.bea.gov/sites/default/files/2020-12/pi1120.pdf. 4 See Coronavirus Aid, Relief, and Economic Security Act: H.R. 748 Section 2107; Coronavirus Aid, Relief, and Economic Security Act: H.R. 748 Section 1102; Board of Governors of the Federal Reserve System, “Paycheck Protection Program Liquidity Facility,” https://www.federalreserve.gov/monetarypolicy/ppplf.htm; U.S. Department of the Treasury, “Treasury, IRS Announce Delivery of 159 Million Economic Impact Payments,” June 3, 2020, https://home.treasury. gov/news/press-releases/sm1025; Jane Ihrig, Gretchen Weinbach, and Scott Wolla, “How the Fed Has Responded to the COVID-19 Pandemic,” Federal Reserve Bank of St. Louis, August 12, 2020, https://www.stlouisfed.org/open-vault/2020/ august/fed-response-covid19-pandemic; and Board of Governors of the Federal Reserve System, “Federal Reserve Announces Extensive New Measures to Support the Economy,” March 3, 2020, https://www.federalreserve.gov/ newsevents/pressreleases/monetary20200323b.htm.
Transcript
FDIC QUARTERLY 51
2020 SUMMARY OF DEPOSITS HIGHLIGHTS
Introduction The 2020 Summary of Deposits (SOD) Survey showed a 21.7 percent increase in deposits, the largest one-year percentage increase in nearly 80 years.1 The increase in deposits held by FDIC-insured institutions from June 2019 to June 2020 occurred primarily in the first two quarters of 2020, and was likely driven by reactions of individuals, businesses, and U.S. fiscal and monetary authorities to the COVID-19 pandemic.2
The survey also showed a decrease in the number of offices of FDIC-insured institu-tions. The number of bank offices declined nationwide between June 2019 and June 2020, continuing an 11-year trend, but the rate of decline was lower in 2020 than in the three previous years. The lower rate of decline in the number of offices was influenced by both a relatively high rate of office openings and a relatively low rate of office closures. The number of offices declined across all three county types—metropolitan, micropolitan, and rural—and the rate of decline was fastest among offices in metropolitan counties.
Total Deposits Grew at a Record Rate
Total deposits increased 21.7 percent, from $12.77 trillion to $15.54 trillion, between June 2019 and June 2020 (Chart 1). This one-year rate of deposit growth was the highest in 77 years. In the year ending June 30, 2020, the rate of deposit growth increased for commu-nity banks and noncommunity banks, for small, midsize, and large banks, for banks located in metropolitan, micropolitan, and rural counties, and for all but one lending specialization.
The additional funds that individuals and businesses received from programs that were implemented in the first half of 2020 to alleviate financial hardship caused by the pandemic, paired with economic uncertainty resulting from the pandemic, drove individu-als and businesses to save more, leading to the sharp increase in bank deposits.3 Actions by U.S. fiscal and monetary authorities included the Pandemic Emergency Unemployment Compensation Program, the U.S. Small Business Administration Paycheck Protection Program, the Federal Reserve Paycheck Protection Program Liquidity Facility, Economic Impact Payments (coronavirus stimulus checks), and aggressive interest rate cuts by the Federal Reserve. Additionally, the Federal Reserve purchased U.S. Treasury securities, mortgage-backed securities, and other financial instruments to support the flow of credit to U.S. households and businesses and to promote financial stability.4
1 “Deposits” refers to deposits in offices of FDIC-insured institutions in the United States, U.S. territories, and possessions. U.S. offices of foreign institutions and their deposits are not included. The FDIC’s 2020 Annual Report shows growth in domestic deposits of 26.2 percent in 1942, 24.2 percent in 1943, and 46 percent in 1989, all of which are higher than the 21.7 percent deposit growth reported in the 2020 SOD survey. The high growth in 1989 is the result of the fact that 1989 was the first year in which deposits of institutions covered under both the Bank Insurance Fund (BIF) and the Savings Association Insurance Fund (SAIF) were included in the domestic deposit totals shown in the Annual Report. According to FDIC Call Report data, if institutions covered under both the BIF and the SAIF are included in the sum of total domestic deposits in 1988, deposit growth in 1989 would be much lower at 2.9 percent. Given that growth in domestic deposits in 1989 was driven by this change in how deposit totals were reported, 1943 is the most recent year in which deposit growth was higher than the growth shown in the 2020 SOD survey. Importantly, the Annual Report shows deposit totals as of December 31 of each year while the SOD survey reports deposit totals as of June 30 of each year, so year-over-year growth rates calculated based on these two sources would be similar but not identical. See FDIC Annual Report 2020: 138-140, https://www.fdic.gov/about/financial-reports/reports/2020annualreport/2020ar-final.pdf.2 FDIC Call Report data from 2019 and 2020 show that domestic deposits of FDIC-insured institutions increased about 1.8 percent in both the third and fourth quarters of 2019, by 8.2 percent in the first quarter of 2020, and 8.5 percent in the second quarter of 2020.3 Total personal income increased in the second quarter of 2020, despite a decrease in employment income, because of increased government transfer payments. Savings as a percentage of disposable personal income increased from 7.3 percent in the fourth quarter of 2019 to 26 percent in the second quarter of 2020. See U.S. Bureau of Economic Analysis, “Personal Income and Outlays, November 2020,” news release no. BEA 20-68, December 23, 2020, https://www.bea.gov/sites/default/files/2020-12/pi1120.pdf.4 See Coronavirus Aid, Relief, and Economic Security Act: H.R. 748 Section 2107; Coronavirus Aid, Relief, and Economic Security Act: H.R. 748 Section 1102; Board of Governors of the Federal Reserve System, “Paycheck Protection Program Liquidity Facility,” https://www.federalreserve.gov/monetarypolicy/ppplf.htm; U.S. Department of the Treasury, “Treasury, IRS Announce Delivery of 159 Million Economic Impact Payments,” June 3, 2020, https://home.treasury.gov/news/press-releases/sm1025; Jane Ihrig, Gretchen Weinbach, and Scott Wolla, “How the Fed Has Responded to the COVID-19 Pandemic,” Federal Reserve Bank of St. Louis, August 12, 2020, https://www.stlouisfed.org/open-vault/2020/august/fed-response-covid19-pandemic; and Board of Governors of the Federal Reserve System, “Federal Reserve Announces Extensive New Measures to Support the Economy,” March 3, 2020, https://www.federalreserve.gov/newsevents/pressreleases/monetary20200323b.htm.
Both community and noncommunity banks reported high deposit growth rates in the year ended June 30, 2020 (Table 1). On both a merger-adjusted basis and a non-merger-adjusted basis, deposits increased faster at noncommunity banks than at community banks.5 Noncommunity banks reported year-over-year merger-adjusted growth of 22.6 percent, while community banks reported 16.5 percent growth.6
From 2019 to 2020, deposits at community banks increased much more on a merger-adjusted basis than on a non-merger-adjusted basis. Merger adjustment is a way of measuring the “organic growth” of a cohort of institutions—the portion of growth not attributable to mergers. In this case, the merger-adjusted deposit growth of commu-nity banks reflects changes in deposits over the previous year of the community banks that existed as of June 30, 2020. Non-merger-adjusted growth, by contrast, compares the performance of the 4,874 community banks that existed as of June 30, 2019, to that of the 4,624 community banks that existed as of June 30, 2020.
Deposit Growth Rates Increased More for Community Banks on a Merger-Adjusted Basis Than a Non-Merger-Adjusted Basis
Source: FDIC Summary of Deposits, June 2015 to June 2020.
Table 1
5 In this article, merger-adjusted performance measures the performance of the cohort of institutions as of June 30, 2020. Merger-adjusted performance of institutions segregated by asset size, lending specialization, and community banks versus noncommunity banks all measure the performance of institutions that belonged to each cohort as of June 30, 2020.6 Community banks are identified using criteria in the FDIC Community Banking Study, December 2012:1-2, https://www.fdic.gov/regulations/resources/cbi/report/cbi-full.pdf.
Total Deposits Increased at a Record Rate From 2019 to 2020
Source: FDIC Summary of Deposits, June 2005 to June 2020.
The fact that deposits of community banks grew more slowly on a non-merger-adjusted basis than on a merger-adjusted basis indicates that some community banks either were redesignated as noncommunity banks or were acquired by noncommunity banks.7 During the year ended June 30, 2020, noncommunity banks acquired 57 community banks, while community banks did not acquire any noncommunity banks. Further, 33 community banks were redesignated as noncommunity banks, while only 6 noncommunity banks were redesignated as community banks. In the same period, 161 community banks acquired another community bank, and 14 noncommunity banks acquired another noncommunity bank. In short, over this period it was more common for community banks to be acquired by or be redesignated as noncommunity banks than it was for noncommunity banks to be acquired by or be redesignated as community banks. As a result, deposits moved from community banks to noncommunity banks. Therefore, non-merger-adjusted deposit growth of community banks is less than merger-adjusted growth.
Noncommunity bank deposit growth was similar on a merger-adjusted and non-merger-adjusted basis every year from 2015 to 2020. Over this time, few community banks acquired noncommunity banks and few noncommunity banks were redesignated as community banks, so mergers and redesignations had less impact on deposit growth for noncommu-nity banks than for community banks.8
Large Banks Continue to Increase Deposits and Gain Market Share
On a merger-adjusted basis, total deposits have increased over the past five years for each of the bank asset-size groups in Table 2. From 2015 to 2020, deposits increased on a merger-adjusted basis the most for midsize banks—47.6 percent—followed by large banks at 46.7 percent and small banks at 46.4 percent.9
The difference between the non-merger-adjusted increase and the merger-adjusted increase in deposits for large banks from 2019 to 2020 is heavily influenced by two midsize banks merging to form one large bank, thereby shifting their deposits from the midsize bank category to the large bank category (Table 2). This merger also accounted for a large part of the difference between the non-merger-adjusted gain in market share by large banks and the merger-adjusted gain in market share by large banks, shown in Table 3, as well as the difference between the non-merger-adjusted and merger-adjusted reduction in market share for midsize banks.
Meanwhile, small banks consistently lost market share from 2015 to 2020 on a non-merger-adjusted basis but have maintained a fairly consistent market share on a merger-adjusted basis. Large and midsize bank market shares have fluctuated over the same period. The merger-adjusted versus non-merger-adjusted results for large and midsize banks indicate that banks transferred into and out of these asset size categories from year to year because of organic deposit growth or through mergers and acquisitions.
7 “Redesignation” refers to a change in the designation of a community or a noncommunity bank that the FDIC uses for research purposes as noted in footnote 6. For an explanation of the reasons for and process of merger adjusting bank data, see Eric C. Breitenstein and Derek K. Thieme, “Merger Adjusting Bank Data: A Primer,” FDIC Quarterly 13, no. 1 (2019):31-49, https://www.fdic.gov/bank/analytical/quarterly/2019-vol13-1/fdic-v13n1-4q2018.pdf.8 The tendency of community banks to be acquired by or be redesignated as noncommunity banks at higher rates was evident from 2015 to 2020. Over that period, noncommunity banks acquired 320 community banks and community banks acquired six noncommunity banks. Further, 130 community banks were redesignated as noncommunity banks, while 33 noncommunity banks were redesignated as community banks. Meanwhile, 808 community banks were acquired by other community banks, and 110 noncommunity banks were acquired by other noncommunity banks.9 For this article “midsize banks” refers to banks with total assets between $10 billion and $250 billion. “Small banks” have total assets less than $10 billion, and “large banks” have total assets greater than $250 billion.
On a merger-adjusted basis, deposits increased from 2019 to 2020 for banks in all lending specializations (see Table 4 for definitions of lending specializations). Deposits increased the most—31.3 percent—for banks with a mortgage specialization, followed by banks with an international specialization (27.9 percent) and a consumer lending specialization (27.0 percent), as shown in Table 5.
If an acquisition results in a change in portfolio composition, the resulting organization may no longer meet the concentration thresholds defining a lending specialization cate-gory, without any underlying change in its lending volumes or strategies. Accordingly, the merger-adjusted data in Table 5 better reflects deposit growth by lending specialty.
Total Deposits Increased More for Large Banks on a Non-Merger-Adjusted Basis Than a Merger-Adjusted Basis
Bank Asset Size2015 2016 2017 2018 2019 2020 2015 to 2020
Large: Assets More Than $250B 4.3 5.3 5.6 3.0 2.9 24.5 46.7Midsize: Assets $10B to $250B 8.6 7.7 3.6 4.8 5.6 19.6 47.6Small: Assets Less Than $10B 3.4 5.8 6.3 5.0 5.6 17.5 46.4
Year-Over-Year Deposit Growth, Not Merger Adjusted (Percent)
Large: Assets More Than $250B 10.9 8.8 4.7 2.0 3.9 41.2 70.3Midsize: Assets $10B to $250B 0.2 4.3 8.5 10.5 7.0 3.1 37.9Small: Assets Less Than $10B 2.9 2.4 0.8 -3.0 -0.4 10.8 10.5
Source: FDIC Summary of Deposits, June 2015 to June 2020.
Table 2
Large Banks Gain Deposit Market Share While Small Banks Continue to Lose Market Share
Bank Asset Size2015 2016 2017 2018 2019 2020
Share of Total Domestic Deposits, Merger Adjusted (Percent)
Large: Assets More Than $250B 52.5 52.1 52.3 51.9 51.2 52.4Midsize: Assets $10B to $250B 30.8 31.2 30.8 31.1 31.5 30.9Small: Assets Less Than $10B 16.7 16.7 16.9 17.1 17.3 16.7
Share of Total Domestic Deposits, Not Merger Adjusted (Percent)
Large: Assets More Than $250B 45.0 46.2 46.1 45.3 45.2 52.4Midsize: Assets $10B to $250B 32.8 32.4 33.4 35.5 36.5 30.9Small: Assets Less Than $10B 22.1 21.4 20.5 19.2 18.3 16.7
Source: FDIC Summary of Deposits, June 2015 to June 2020.
Table 3
Deposits Increased Across All Lending Specializations
FDIC QUARTERLY 55
2020 SUMMARY OF DEPOSITS HIGHLIGHTS
Asset Characteristics of Banks With Lending SpecializationsLending Specialization Asset CharacteristicsInternational Assets exceed $10 billion. More than 25 percent of total assets are in foreign offices.Agricultural Agricultural production loans, added to real estate loans that are secured by farmland, exceed
25 percent of total loans and leases.Credit Card The total of credit card loans and securitized receivables exceeds 50 percent of total assets plus
securitized receivables.Commercial Lending The total of commercial and industrial loans, real estate construction and development loans, and
loans secured by commercial real estate properties exceeds 25 percent of total assets.Mortgage Lending The total of residential mortgage loans and mortgage-backed securities exceeds 50 percent of total assets.Consumer Lending The total of residential mortgage loans, credit card loans, and other loans to individuals exceeds
50 percent of total assets.Other Specialized < $1 Billion Assets are less than $1 billion. Loans and leases are less than 40 percent of total assets.All Other < $1 Billion Assets are less than $1 billion, and the institution does not meet any of the definitions above. There is
significant lending activity with no identified asset concentrations.All Other > $1 Billion Assets are greater than $1 billion, and the institution does not meet any of the definitions above. There
is significant lending activity with no identified asset concentrations.
Source: FDIC Statistics on Depository Institutions Glossary.Note: Groups are hierarchical and mutually exclusive.
Table 4
Total Deposits Increased for Every Lending Specialization on a Merger-Adjusted Basis
Source: FDIC Summary of Deposits, June 2015 to June 2020.
Table 5
2021 • Volume 15 • Number 1
56 FDIC QUARTERLY
As shown in Table 6, total deposits have increased for bank offices in all three county types—metropolitan, micropolitan, and rural.10 Table 6 also shows that an overwhelming majority of deposits—roughly $14.53 trillion (93.5 percent) out of $15.54 trillion—are held by bank offices in metropolitan counties. The share of total domestic deposits in metropol-itan counties ranged from 92.4 percent in 2015 to the five-year high of 93.5 percent in 2020. Not surprisingly, bank offices in metropolitan counties accounted for most of the increase in domestic deposits in the United States.
Metropolitan counties had the most pronounced increase in total deposits in 2020—22.3 percent year-over-year. Between 2015 and 2019, the year-over-year percentage change in total deposits in metropolitan counties ranged from 3.9 percent to 6.2 percent.
Total deposits in micropolitan counties also grew rapidly in 2020. Micropolitan county year-over-year percentage increases in total deposits ranged from 2.3 percent to 3.4 percent between 2015 and 2019, but deposits increased 15.3 percent in 2020. The share of domestic deposits in micropolitan counties declined from 4.3 percent in 2015 to 3.8 percent in 2020.
Total deposits increased the least in rural counties: 22.6 percent between 2015 and 2020, compared with a 48.1 percent increase in metropolitan counties and a 28.6 percent increase in micropolitan counties. Between 2015 and 2019, rural counties’ year-over-year percentage change in total deposits ranged from 1.4 percent to 3.1 percent, but in 2020, total deposits in rural counties increased 11.6 percent. The percentage increase in deposits in rural coun-ties was less than the percentage increase in metropolitan and micropolitan counties, and consequently the share of total domestic deposits in rural counties declined slightly, from 3 percent in 2019 to 2.7 percent in 2020. The share of domestic deposits in rural offices declined slightly each year from 2015 to 2020, from 3.2 percent in 2015 to 2.7 percent in 2020.
Total Deposits and Year-Over-Year Percent Change Increased for Every County Type
County Type 2015 2016 2017 2018 2019 2020Percent Change
Source: FDIC Summary of Deposits, June 2015 to June 2020.
Table 6
10 Counties are labeled metropolitan, micropolitan, or rural depending on whether they are in areas designated by the U.S. Census Bureau as metropolitan statistical areas or as micropolitan statistical areas. Metropolitan statistical areas have a core urban area with more than 50,000 inhabitants. Micropolitan statistical areas have urban clusters with 10,000 to 50,000 inhabitants. All other areas are considered rural.
Metropolitan Domestic Deposits Lead Deposit Surge
FDIC QUARTERLY 57
2020 SUMMARY OF DEPOSITS HIGHLIGHTS
Average Deposits of FDIC-Insured Institutions and Offices Increased
The number of FDIC-insured institutions decreased from 5,303 to 5,066 between June 2019 and June 2020, and the number of offices decreased from 86,382 to 85,040. Average deposits per institution and office increased from 2019 to 2020 at higher rates than they did from 2018 to 2019. From 2015 to 2020, the number of FDIC-insured institutions declined 20.2 percent while the number of offices declined 8.8 percent. These declines increased the average number of offices per institution from 14.7 offices in 2015 to 16.8 offices in 2020 (Table 7). Similarly, the number of institutions declined at a higher rate than the number of offices from 2019 to 2020. As a result, deposits per institution increased at a higher rate than did deposits per office.
From 2015 to 2019, average deposits per office increased at an average rate of 6.8 percent, and in 2020 average deposits per office increased 23.6 percent. The average annual increase in deposits per institution from 2015 to 2019 was 9.6 percent, and in 2020 average depos-its per institution increased 27.4 percent. Average deposits per institution in 2020 was $3.1 billion, and average deposits per office was $182.8 million (Table 7).
Deposits per Institution and Office Increased in 2020
Source: FDIC Summary of Deposits, June 2015 to June 2020.
Table 7
Using SOD Deposit Data for Geographic Research Requires CautionThe Summary of Deposits (SOD) is a unique source of information about the number and physical locations of the tens of thousands of bank offices across the United States. The SOD data also include a dollar amount of deposits for each bank office. Methods used by banks for attributing deposits to bank offices may differ considerably from bank to bank, as described below. Accordingly, researchers should be cautious about using SOD data to draw firm conclusions about the geographical distribution of banking activity.
The full reporting instructions for the SOD can be found at https://www.fdic.gov/regulations/resources/call/sod/2020-06-sod-instructions.pdf.
The relevant reporting instructions are below.
Institutions should assign deposits to each office in a manner consistent with their existing internal record-keeping prac-tices. The following are examples of procedures for assigning deposits to offices:
· Deposits are assigned to the office in closest proximity to the account holder’s address.
· Deposits are assigned to the office where the account is most active.
· Deposits are assigned to the office where the account was opened.
· Deposits are assigned to offices for branch manager compensation or similar purposes.
Other methods that logically reflect the deposit gathering activity of the financial institution’s branch offices may also be used. It is recognized that certain classes of deposits and deposits of certain types of customers may be assigned to a single office for reasons of convenience or efficiency. However, deposit allocations that diverge from the financial institu-tion’s internal record-keeping systems and grossly misstate or distort the deposit gathering activity of an office should not be utilized.
The number of offices of FDIC-insured institutions declined 1.6 percent between June 2019 and June 2020, a slower rate than the past few years (Chart 2). The number of offices declined 2.7 percent among community banks and 0.9 percent among noncommu-nity banks. On a merger-adjusted basis, between 2019 and 2020, 471 banks (9.3 percent) increased their number of offices, 4,259 banks (84.1 percent) maintained the same number of offices, and 336 banks (6.6 percent) decreased their number of offices. Banks that increased their number of offices had a total increase of 668 offices, and banks that decreased their number of offices had a total decrease of 1,945 offices, for an aggregate net decrease of 1,277 offices on a merger-adjusted basis.11
75,000
80,000
85,000
90,000
95,000
100,000
105,000
2005 2010 2015 2020-3
-2
-1
0
1
2
3
4
Total O�ices Declined at a Slower Rate Than in Recent Years
Source: FDIC Summary of Deposits, June 2005 to June 2020.
O�ices PercentTotal O�ices (Le� Axis)Percent Change From the Previous Year (Right Axis)
Chart 2
As shown in Table 8, full-service brick-and-mortar offices represent almost 92 percent of all banking offices, and this office type accounted for most of the total decrease in the number of offices, with a net decrease of 977 offices in the 12 months ending June 30, 2020. Full-service brick-and-mortar offices had the lowest rate of decline (1.2 percent) among all office types. The rate of decline in full-service brick-and-mortar offices was the lowest since 2013, and the relatively low rate of decline in this office type drove the slower overall pace of decline in bank offices nationwide in 2020. The rate of decline in limited-service offices was only slightly lower than in 2019. Home banking and full-service retail office types declined at faster rates in 2020 than in 2019.12 The rate of decline in the number of full-service retail offices was the highest of all office types at 5.8 percent. Full-service retail offices represent a little less than 5 percent of bank offices.
11 The number of offices declined by 1,277 on a merger-adjusted basis and by 1,342 on a non-merger-adjusted basis. The difference is because 65 offices belonged to banks that were acquired by nonbanks between June 2019 and June 2020. Those offices could not be counted in merger-adjusted analysis since they could not be assigned to an acquiring bank in the 2020 SOD data.12 The SOD survey collects information on the service type of each office:
∙ Full-service brick-and-mortar—locations owned or leased by a bank at which customers can open and close accounts, apply for loans, deposit and withdraw funds, and receive other banking services.
∙ Full-service retail—full-service offices in a retail facility such as a store or supermarket.∙ Home banking—full-service offices that customers can access on a website or by telephone.∙ Limited-service—offices that exist for the sole purpose of cashing payroll checks or conducting administrative
services for the bank, or that accept deposits but do not provide any other services. See pages 31-32 of the Summary of Deposits Reporting Instructions, https://www.fdic.gov/regulations/resources/call/sod/2020-06-sod-instructions.pdf.
The Number of Bank Offices Declined at a Slower Rate Than in Recent Years
The Low Rate of Decline in the Number of Full-Service Brick-and-Mortar Offices Drove the Overall Rate of Decline in the Number of Offices to a Four-Year Low
Source: FDIC Summary of Deposits, June 2015 to June 2020.*Home banking offices are sometimes called “cyber offices” since they are typically accessed online.
Table 8
Office Closings Are Widespread Although Relatively Less Frequent in Rural Counties
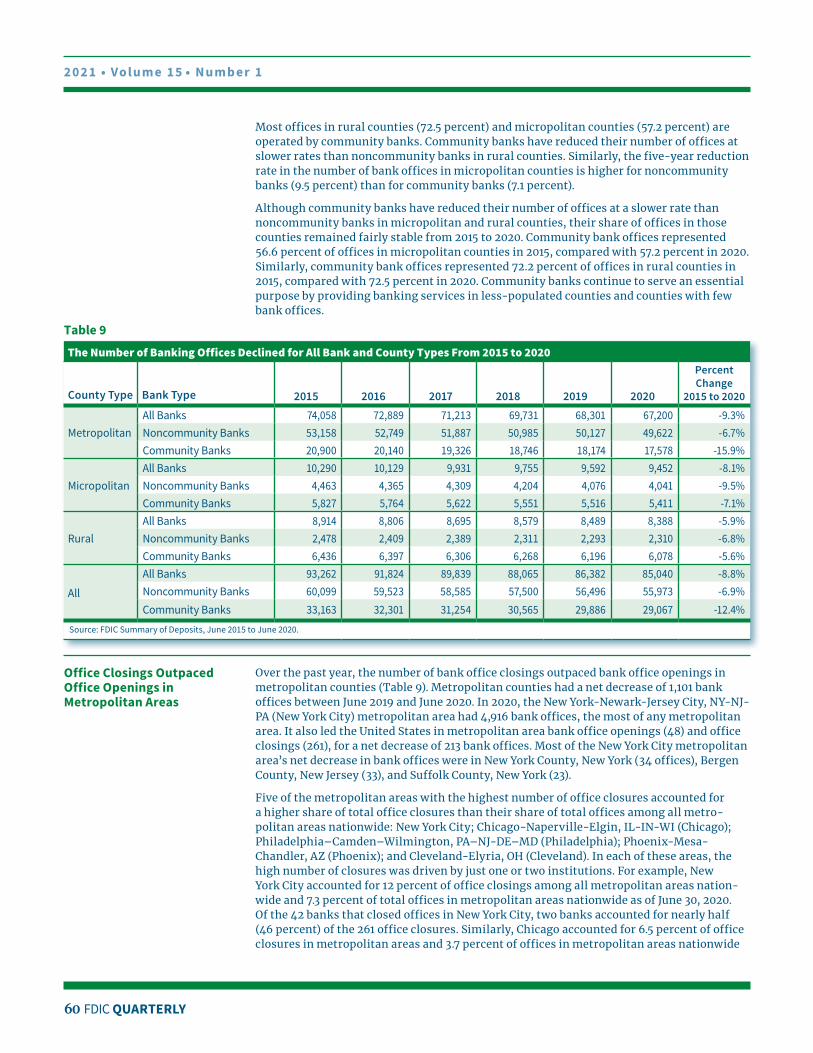
As shown in Table 9, the total number of bank offices declined across all three county types—metropolitan, micropolitan, and rural. Table 9 also shows that an overwhelm-ing majority of bank offices—roughly 67,000 out of 85,000—are in metropolitan counties. Between 2015 and 2020, the number of offices in metropolitan counties declined 9.3 percent and accounted for most of the total reduction in the number of offices in the United States.
The ongoing office reduction trend has been particularly pronounced for community banks in metropolitan counties, with a decrease of 3,322 in the past five years. While noncom-munity banks operating in metropolitan counties reduced their number of offices by 3,536, this amounted to a 6.7 percent decrease over the past five years, less than half the 15.9 percent decrease for community banks.
The difference in office reduction rates between community banks and noncommunity banks in metropolitan counties is considerably different on a merger-adjusted basis. On a merger-adjusted basis, the number of community bank offices increased 4.1 percent from June 2015 to June 2020, while the number of noncommunity bank offices decreased 13 percent. This result indicates that the declining number of community bank offices in metropolitan counties is heavily influenced by the relatively high rate at which community banks were acquired by, or redesignated as, noncommunity banks from 2015 to 2020.
The number of bank offices has declined the least in rural counties: 526 (5.9 percent) between 2015 and 2020. The number of community bank offices in rural counties declined 5.6 percent, while the number of noncommunity bank offices in rural counties declined 6.8 percent (Table 9). While the smallest decline in office numbers occurred in rural coun-ties, office closures in rural counties are felt more keenly by those communities than are closures in metropolitan counties, since rural bank offices are fewer in number and often serve large geographic areas.13
13 For a discussion of closures of banking offices in rural areas, see Board of Governors of the Federal Reserve System, “Perspectives From Main Street: Bank Branch Access in Rural Communities,” November 2019, https://www.federalreserve.gov/publications/files/bank-branch-access-in-rural-communities.pdf.
Most offices in rural counties (72.5 percent) and micropolitan counties (57.2 percent) are operated by community banks. Community banks have reduced their number of offices at slower rates than noncommunity banks in rural counties. Similarly, the five-year reduction rate in the number of bank offices in micropolitan counties is higher for noncommunity banks (9.5 percent) than for community banks (7.1 percent).
Although community banks have reduced their number of offices at a slower rate than noncommunity banks in micropolitan and rural counties, their share of offices in those counties remained fairly stable from 2015 to 2020. Community bank offices represented 56.6 percent of offices in micropolitan counties in 2015, compared with 57.2 percent in 2020. Similarly, community bank offices represented 72.2 percent of offices in rural counties in 2015, compared with 72.5 percent in 2020. Community banks continue to serve an essential purpose by providing banking services in less-populated counties and counties with few bank offices.
The Number of Banking Offices Declined for All Bank and County Types From 2015 to 2020
County Type Bank Type 2015 2016 2017 2018 2019 2020
Source: FDIC Summary of Deposits, June 2015 to June 2020.
Table 9
Office Closings Outpaced Office Openings in Metropolitan Areas
Over the past year, the number of bank office closings outpaced bank office openings in metropolitan counties (Table 9). Metropolitan counties had a net decrease of 1,101 bank offices between June 2019 and June 2020. In 2020, the New York-Newark-Jersey City, NY-NJ-PA (New York City) metropolitan area had 4,916 bank offices, the most of any metropolitan area. It also led the United States in metropolitan area bank office openings (48) and office closings (261), for a net decrease of 213 bank offices. Most of the New York City metropolitan area’s net decrease in bank offices were in New York County, New York (34 offices), Bergen County, New Jersey (33), and Suffolk County, New York (23).
Five of the metropolitan areas with the highest number of office closures accounted for a higher share of total office closures than their share of total offices among all metro-politan areas nationwide: New York City; Chicago-Naperville-Elgin, IL-IN-WI (Chicago); Philadelphia–Camden–Wilmington, PA–NJ-DE–MD (Philadelphia); Phoenix-Mesa-Chandler, AZ (Phoenix); and Cleveland-Elyria, OH (Cleveland). In each of these areas, the high number of closures was driven by just one or two institutions. For example, New York City accounted for 12 percent of office closings among all metropolitan areas nation-wide and 7.3 percent of total offices in metropolitan areas nationwide as of June 30, 2020. Of the 42 banks that closed offices in New York City, two banks accounted for nearly half (46 percent) of the 261 office closures. Similarly, Chicago accounted for 6.5 percent of office closures in metropolitan areas and 3.7 percent of offices in metropolitan areas nationwide
FDIC QUARTERLY 61
2020 SUMMARY OF DEPOSITS HIGHLIGHTS
in 2020. While 22 banks closed offices in Chicago, one bank accounted for 34 percent of the closures. Philadelphia accounted for 3.2 percent of closures in metropolitan areas nation-wide and 2.4 percent of offices in metropolitan areas in 2020. Nineteen banks closed offices in Philadelphia and one bank accounted for 32.8 percent of closures. Similarly, Phoenix accounted for 1.5 percent of closures in metropolitan areas nationwide and 1.1 percent of offices in metropolitan areas in 2020. Of the 11 banks that closed offices in Phoenix, two banks accounted for 54.5 percent of office closures. Finally, Cleveland accounted for 1.3 percent of closures in metropolitan areas and 0.9 percent of offices in metropolitan areas in 2020. Eight banks closed offices in Cleveland, and one bank accounted for 51.7 percent of the closures.
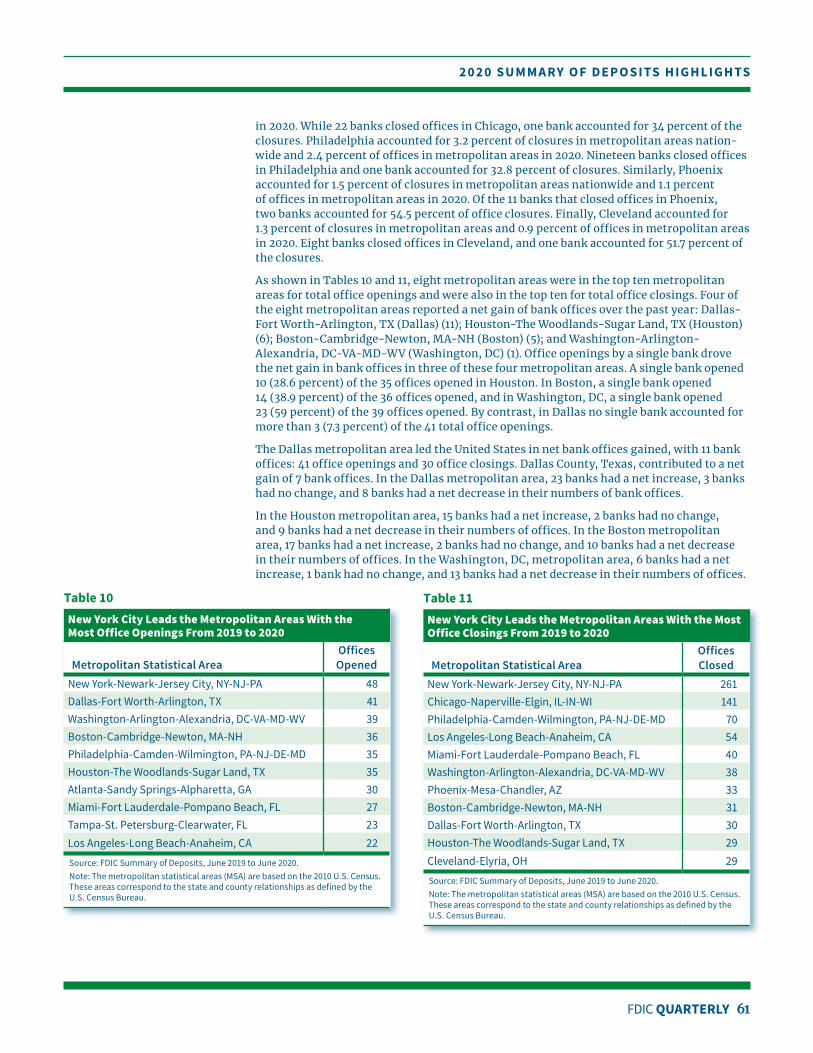
As shown in Tables 10 and 11, eight metropolitan areas were in the top ten metropolitan areas for total office openings and were also in the top ten for total office closings. Four of the eight metropolitan areas reported a net gain of bank offices over the past year: Dallas-Fort Worth- Arlington, TX (Dallas) (11); Houston-The Woodlands-Sugar Land, TX (Houston) (6); Boston-Cambridge-Newton, MA-NH (Boston) (5); and Washington-Arlington- Alexandria, DC-VA-MD-WV (Washington, DC) (1). Office openings by a single bank drove the net gain in bank offices in three of these four metropolitan areas. A single bank opened 10 (28.6 percent) of the 35 offices opened in Houston. In Boston, a single bank opened 14 (38.9 percent) of the 36 offices opened, and in Washington, DC, a single bank opened 23 (59 percent) of the 39 offices opened. By contrast, in Dallas no single bank accounted for more than 3 (7.3 percent) of the 41 total office openings.
The Dallas metropolitan area led the United States in net bank offices gained, with 11 bank offices: 41 office openings and 30 office closings. Dallas County, Texas, contributed to a net gain of 7 bank offices. In the Dallas metropolitan area, 23 banks had a net increase, 3 banks had no change, and 8 banks had a net decrease in their numbers of bank offices.
In the Houston metropolitan area, 15 banks had a net increase, 2 banks had no change, and 9 banks had a net decrease in their numbers of offices. In the Boston metropolitan area, 17 banks had a net increase, 2 banks had no change, and 10 banks had a net decrease in their numbers of offices. In the Washington, DC, metropolitan area, 6 banks had a net increase, 1 bank had no change, and 13 banks had a net decrease in their numbers of offices.
New York City Leads the Metropolitan Areas With the Most Office Openings From 2019 to 2020
Metropolitan Statistical AreaOffices Opened
New York-Newark-Jersey City, NY-NJ-PA 48Dallas-Fort Worth-Arlington, TX 41Washington-Arlington-Alexandria, DC-VA-MD-WV 39Boston-Cambridge-Newton, MA-NH 36Philadelphia-Camden-Wilmington, PA-NJ-DE-MD 35Houston-The Woodlands-Sugar Land, TX 35Atlanta-Sandy Springs-Alpharetta, GA 30Miami-Fort Lauderdale-Pompano Beach, FL 27Tampa-St. Petersburg-Clearwater, FL 23Los Angeles-Long Beach-Anaheim, CA 22
Source: FDIC Summary of Deposits, June 2019 to June 2020.Note: The metropolitan statistical areas (MSA) are based on the 2010 U.S. Census. These areas correspond to the state and county relationships as defined by the U.S. Census Bureau.
Table 10
New York City Leads the Metropolitan Areas With the Most Office Closings From 2019 to 2020
Metropolitan Statistical AreaOffices Closed
New York-Newark-Jersey City, NY-NJ-PA 261Chicago-Naperville-Elgin, IL-IN-WI 141Philadelphia-Camden-Wilmington, PA-NJ-DE-MD 70Los Angeles-Long Beach-Anaheim, CA 54Miami-Fort Lauderdale-Pompano Beach, FL 40Washington-Arlington-Alexandria, DC-VA-MD-WV 38Phoenix-Mesa-Chandler, AZ 33Boston-Cambridge-Newton, MA-NH 31Dallas-Fort Worth-Arlington, TX 30Houston-The Woodlands-Sugar Land, TX 29Cleveland-Elyria, OH 29
Source: FDIC Summary of Deposits, June 2019 to June 2020.Note: The metropolitan statistical areas (MSA) are based on the 2010 U.S. Census. These areas correspond to the state and county relationships as defined by the U.S. Census Bureau.
Table 11
2021 • Volume 15 • Number 1
62 FDIC QUARTERLY
As discussed earlier, the rate of decline in the number of offices was lower in 2020 than in the three previous years because the rate of office openings was relatively high and the rate of closures was relatively low (Table 12). While the percentage decrease in the number of offices was lower in 2020 than in the previous three years, it was slightly higher than the average percentage decrease from 2010 to 2020 (1.4 percent).
A Higher Rate of Office Openings, and a Lower Rate of Office Closings, Contributed to the Lower Rate of Decline in the Number of Offices
2009 to
2010
2010 to
2011
2011 to
2012
2012 to
2013
2013 to
2014
2014 to
2015
2015 to
2016
2016 to
2017
2017 to
2018
2018 to
2019
2019 to
2020Starting Number of Offices 99,540 98,510 98,184 97,331 96,330 94,715 93,262 91,824 89,839 88,065 86,382Offices Opened 2,406 5,160 1,556 1,462 1,272 1,100 1,121 972 1,027 1,180 1,213
Percent Change in Number of Offices -1.0% -0.3% -0.9% -1.0% -1.7% -1.5% -1.5% -2.2% -2.0% -1.9% -1.6%
Source: FDIC Summary of Deposits, June 2015 to June 2020.
Table 12
One factor that influenced the lower rate of decline in the number of offices in 2020 compared with previous years is that a smaller percentage of offices that were acquired through mergers subsequently closed. As shown in Table 13, 4.5 percent of offices that were acquired through mergers between June 2019 and June 2020 closed before June 30, 2020. By comparison, from 2010 to 2019, 28,939 offices were acquired in mergers and 3,559 (12.3 percent) of those offices closed before the next SOD filing. The average annual closure rate for offices acquired in a merger from 2010 to 2019 was 11.7 percent.
Offices Acquired in Mergers Closed at Lower Rates in 2020 Than in Previous Years2009
Source: FDIC Summary of Deposits, June 2015 to June 2020.
Table 13
The Rate of Decline in the Number of Offices Was Lower in 2020
FDIC QUARTERLY 63
2020 SUMMARY OF DEPOSITS HIGHLIGHTS
The rate of growth in total deposits of domestic offices of FDIC-insured institutions between June 2019 and June 2020 was the highest in nearly 80 years. This increase occurred primarily as a result of consumer, business, and fiscal and monetary policy responses to the coronavirus pandemic. Deposits increased for community banks and noncom-munity banks; for small, midsize, and large banks; for banks with a wide variety of lend-ing specializations; and for banks in metropolitan, micropolitan, and rural counties. On a merger-adjusted basis, the largest increases in deposits occurred among offices of noncommunity banks and midsize banks, and among offices of banks with a mortgage, international, or consumer lending specialization. Offices in metropolitan counties had higher rates of deposit growth than offices in micropolitan or rural counties.
The trend of net decreases in the number of bank offices nationwide that began more than a decade earlier continued, albeit at a slower rate than in recent years, as fewer offices that were acquired through mergers closed before the next SOD survey. The number of commu-nity bank offices declined at a higher rate than the number of noncommunity bank offices from 2015 to 2020. This trend was driven by a reduction in the number of community bank offices in metropolitan counties. Decreases in the number of community bank offices have also been influenced by the tendency of community banks to be acquired by noncommunity banks or be redesignated as noncommunity banks at relatively high rates.
Community banks operate more offices than noncommunity banks in rural and micropoli-tan counties, and have closed offices at slower rates in those counties. The relatively large presence of community banks in rural and micropolitan counties reflects their important role in serving their local communities.
Authors: Joseph R. Harris III Economic Analyst Division of Insurance and Research
Caitlyn R. Kasper Economic Analyst Division of Insurance and Research
Camille A. Keith Economic Analyst Division of Insurance and Research
Derek K. Thieme Financial Economist Division of Insurance and Research