1 2020/21 COMP4801 Final Year Project Individual Final Report Body Temperature Measuring System with Smart Patrol Robot Submitted by Tse Man Kit 3035477757 Supervisor Dr. T.W. Chim Members Lee Ka Fun, Katherine 3035474925 Leung Lok Yi, Harper 3035473359 Tse Man Kit, Jacky 3035477757 Date of submission: 18/4/2021
Transcript
1
2020/21 COMP4801 Final Year Project
Individual Final Report
Body Temperature Measuring System
with Smart Patrol Robot
Submitted by Tse Man Kit 3035477757
Supervisor Dr. T.W. Chim
Members Lee Ka Fun, Katherine 3035474925
Leung Lok Yi, Harper 3035473359
Tse Man Kit, Jacky 3035477757
Date of submission: 18/4/2021
2
Abstract
The rampant COVID-19 is threatening the normal way of life in many countries. To curb
the spread of this disease, different public health and social measures are implemented.
As air travel places a major role in the global transmission of COVID-19[1], the Hong
Kong Airport Authority intends to strengthen its capabilities in identifying potential
COVID-19 patients. In this project, a body-temperature measurement system will be
developed for the Hong Kong Airport Authority Smart Patrol Robots. Infra-red cameras
will be installed on these patrol robots. Through image segmentation and object selection
algorithms, infra-red radiation emitted from the human head area can be isolated out and
analysed. Therefore the body temperature of the subject can be evaluated. When a
potential fever case is spotted, airport staff will be notified with the location and the
picture of the suspected fevering passenger, and further appropriate actions can be taken.
Face recognition technology is also incorporated to process the images so that double
counting of fever cases from a single patient can be avoided. The final processed data is
then presented on an interactive web portal, where the users can view and manage these
suspected cases with ease. The main purpose of this system is to effectively screen out
fevering airport users, which may in turn help prevent international transmission of
COVID-19. Since most infectious diseases have fever as one of their symptoms, this
system could also be used in the future for aiding the containment of any future
pandemics.
Acknowledgement
I would like to express my sincere gratitude to my project supervisor Dr. T.W. Chim, for
his patient guidance and constructive advice. His assistance has been vital to the progress
of this project. I would also like to thank the Hong Kong Airport Authority for providing
advice and input to facilitate this project.
3
Table of Contents
Abstract and Acknowledgements 2
List of Figures and Tables 4
List of Abbreviations 5
1. Introduction 6
1.1 Background 6
1.2 Motivation 7
1.3 Outlines 7
2. Methodology 8
2.1 System Architecture of the System 8
2.2 Infra-red Thermography 9
2.3 Object Selection 10
2.4 Face Recognition 11
3. Results 12
3.1 Installation of thermal camera 12-14
3.2 Map drawing and Automatic Patrol Task 15-16
3.3 Verbal Alert 17
3.4 Mask Detection 17
4.
3.5 Email Alert
3.6 Robot Location Capture
3.7 Face Identification
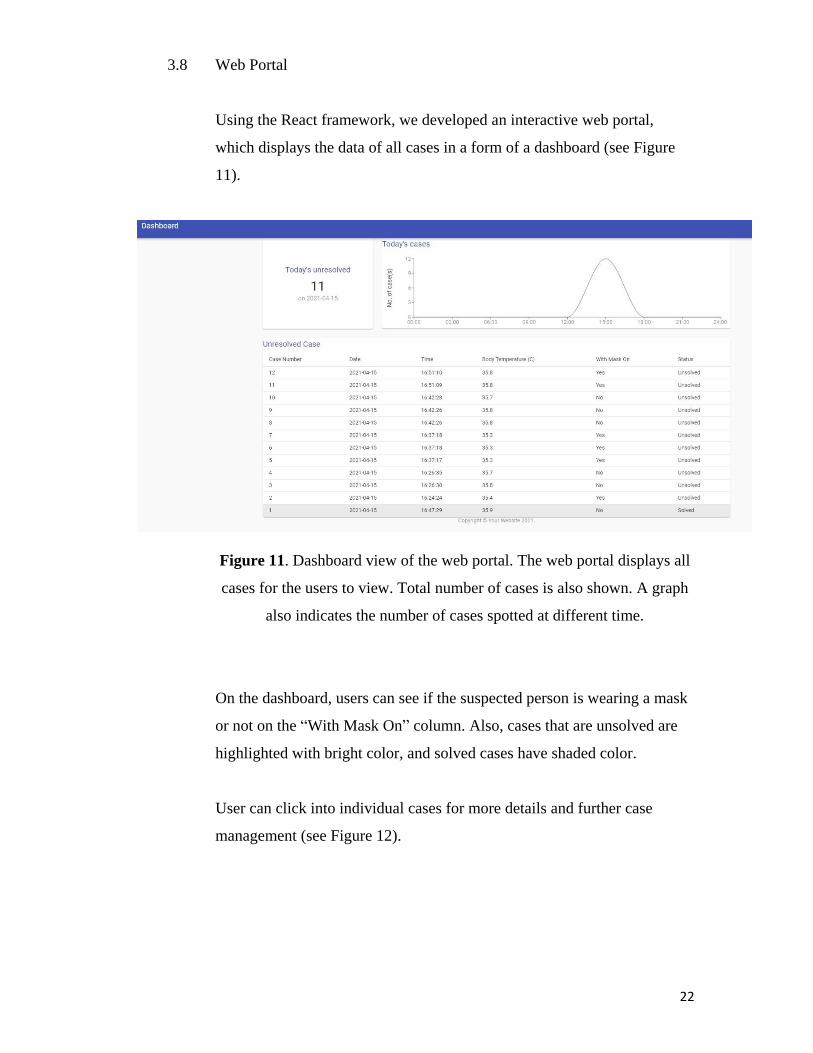
3.8 Web Portal
3.9 Workflow Summary
Future Work
18
19
20-21
22-24
25-26
5.
6.
4.1 Improvement on Data Upload Method
4.2 Improvement of face recognition
Conclusion
Reference
27
28
29
30-32
4
List of Figures and Tables
Figure 1 System Architecture of the system p. 7
Figure 2 Thermograms of human faces. p. 8
Figure 3 Demonstration of object selection for body temperature evaluation. p. 9
Figure 4 Demonstration of facial recognition p.11
Figure 5 The patrol robot after the thermal camera is installed p.13
Figure 6 Live view of the camera can be accessed by the robot computer p.14
Figure 7 The map of the innovation Wing open area drawn in Unodopo Navi Studio p.15
Figure 8 Task chain of the patrol p.15
Figure 9 Email alert sample p.18
Figure 10 Zonal layout of the indoor patrol area p.19
Figure 11 Dashboard view of the web portal p.22
Figure 12 Web portal page of an individual fever case p.22
Figure 13 Web portal page of a combined case p.23
5
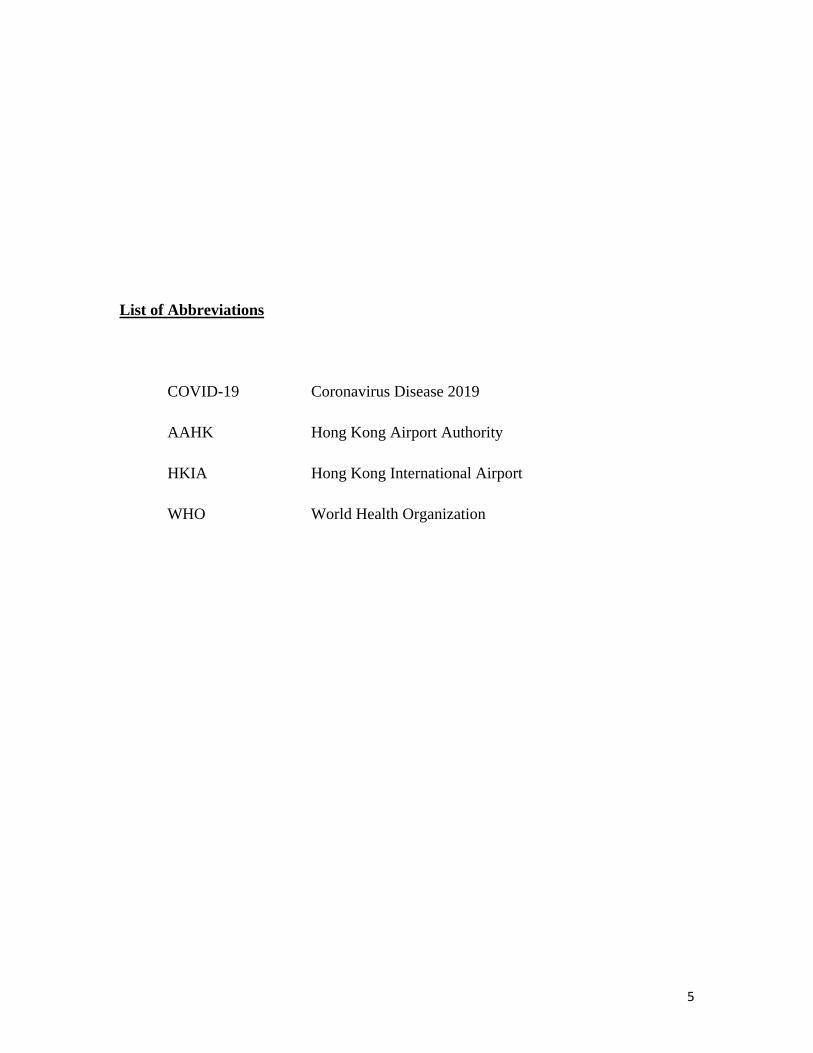
List of Abbreviations
COVID-19 Coronavirus Disease 2019
AAHK Hong Kong Airport Authority
HKIA Hong Kong International Airport
WHO World Health Organization
6
1. Introduction
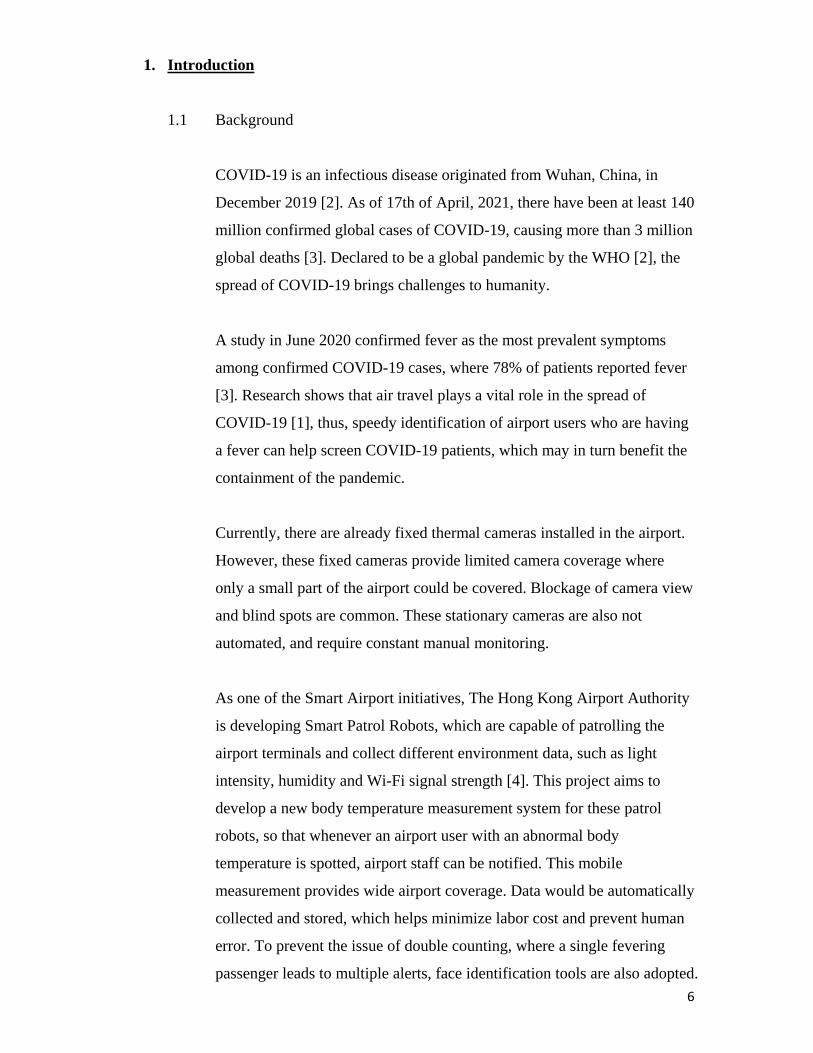
1.1 Background
COVID-19 is an infectious disease originated from Wuhan, China, in
December 2019 [2]. As of 17th of April, 2021, there have been at least 140
million confirmed global cases of COVID-19, causing more than 3 million
global deaths [3]. Declared to be a global pandemic by the WHO [2], the
spread of COVID-19 brings challenges to humanity.
A study in June 2020 confirmed fever as the most prevalent symptoms
among confirmed COVID-19 cases, where 78% of patients reported fever
[3]. Research shows that air travel plays a vital role in the spread of
COVID-19 [1], thus, speedy identification of airport users who are having
a fever can help screen COVID-19 patients, which may in turn benefit the
containment of the pandemic.
Currently, there are already fixed thermal cameras installed in the airport.
However, these fixed cameras provide limited camera coverage where
only a small part of the airport could be covered. Blockage of camera view
and blind spots are common. These stationary cameras are also not
automated, and require constant manual monitoring.
As one of the Smart Airport initiatives, The Hong Kong Airport Authority
is developing Smart Patrol Robots, which are capable of patrolling the
airport terminals and collect different environment data, such as light
intensity, humidity and Wi-Fi signal strength [4]. This project aims to
develop a new body temperature measurement system for these patrol
robots, so that whenever an airport user with an abnormal body
temperature is spotted, airport staff can be notified. This mobile
measurement provides wide airport coverage. Data would be automatically
collected and stored, which helps minimize labor cost and prevent human
error. To prevent the issue of double counting, where a single fevering
passenger leads to multiple alerts, face identification tools are also adopted.
7
1.2 Motivation
HKIA is currently using stationary thermal cameras for checking the body
temperature of travellers. Airport users are instructed to walk past these
fixed thermal cameras, so that their temperature can be assessed. However,
since there is usually a large number of passengers walking past the
stationary cameras at the same time, measurement may be obstructed due
to blockage of the camera view. Additionally, these fixed thermal cameras
require a human operator to constantly look at the display screen in order
to spot fever cases. This measurement method may not be very cost-
effective, and is usually prone to a large degree of human error. To tackle
these issues, we target to add mobile thermal cameras. When mobile
thermal cameras are added for monitoring, thermal images of airport users
can be captured from different angles. Since the robot is patrolling to
different locations of the airport, it would be unlikely to have camera blind
spots. Therefore, adding mobile thermal cameras to the existing stationary
ones can provide the airport with better monitor coverage. In addition, our
enhanced system enables thermal images to be analysed programmatically
without staff involvement. When a fever case is spotted, the relevant data
and images are stored in our database automatically. Staffs are
subsequently alerted. This effectively diminishes the need for human
involvement as well as the risk of human error. This new and enhanced
mobile body temperature measuring system can act as the second line of
defense against fevering passengers on top of the existing fixed cameras.
1.3 Outlines
Section 2 of this paper covers the methodology in terms of our system
architecture, infra-red thermography, image object selection, and face
recognition. Section 3 covers the results and achievements of the group.
Section 4 talks about any potential future work and section 5 concludes the
report.
8
2. Methodology
This section introduces the technical concepts involved in this project.
2.1 System Architecture of the System
This project aims to develop an end-to-end automatic body temperature
measurement system. Figure 1 shows the workflow of our system.
Figure 1. System Architecture of the system
The developed system would enable the patrol robot to patrol along certain
designated routes, and while patrolling, make use of the thermal camera to
measure the body temperature of nearby airport users. If a fever case is
spotted, images would be taken by the camera, and along with other
relevant data such as the location of the fever case, time of the event,
whether the patient is wearing a mask or not, would all be sent
automatically as an email to our target email address. The data from these
emails are subsequently automatically extracted by our Python script, and
will then be uploaded to our Firebase data storage. The data from Firebase
will be further processed by our data cleaning script and then face
identification will be carried out by the Azure face identification API.
Cases that belong to the same patient will be combined as a single case to
avoid the issue of double counting. The processed data will then finally be
displayed on our web portal.
9
2.2 Infra-red Thermography
According to the black body radiation law, all objects of temperature
above absolute zero emit infrared radiation [5]. The amount of radiation
emitted by an object increases with its temperature. Infrared thermography
allows infra-red radiation emitted from objects to be captured with thermal
cameras, in the form of a thermogram (see Figure 2), where the surface
temperature of the measuring subjects can be monitored [6]. Since there is
great correlation between thermal physiology and skin temperature, in the
medical field, infrared thermography is used to diagnose breast cancer,
diabetes neuropathy and peripheral vascular disorders, etc. [7]. With
COVID-19 going on a rampage, we utilize infra-red thermography as a
means for monitoring human body temperature, in order to screen
potential fevering patients.
Figure 2 [8]. Thermograms of human faces. The left shows the
thermogram of the facial area of a person with normal body temperature,
while the right shows raised temperature around the eyes and nose,
indicating a possible fever.
10
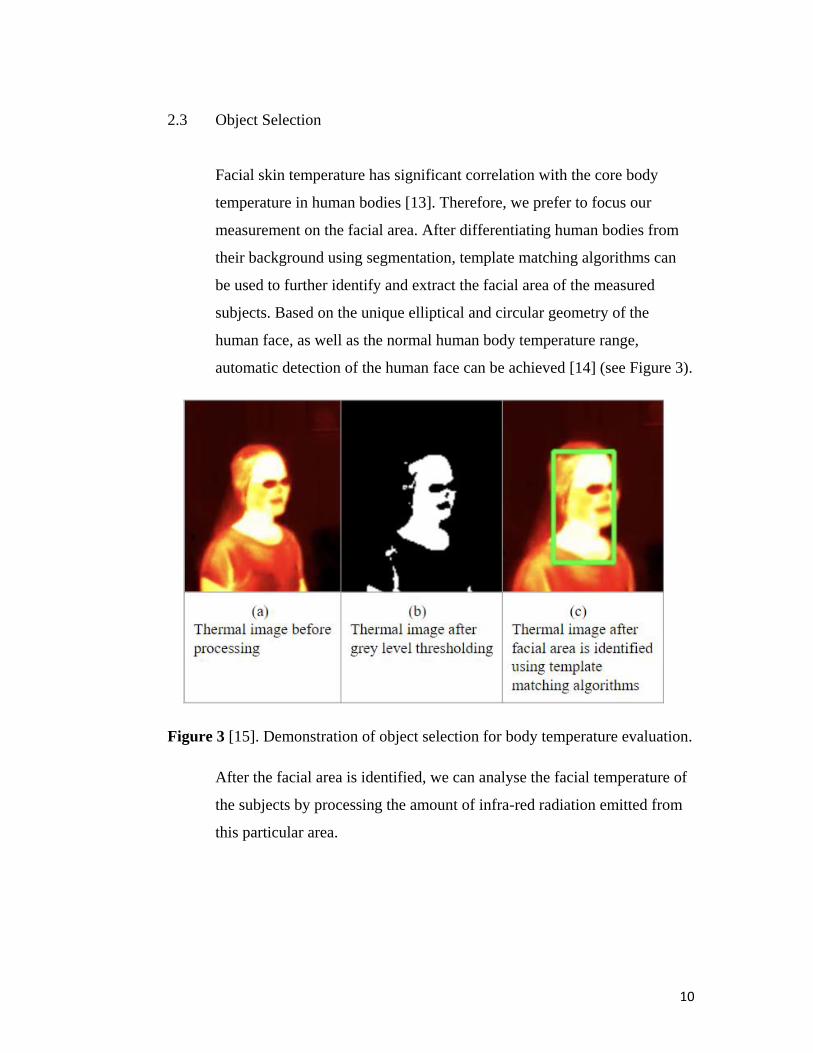
2.3 Object Selection
Facial skin temperature has significant correlation with the core body
temperature in human bodies [13]. Therefore, we prefer to focus our
measurement on the facial area. After differentiating human bodies from
their background using segmentation, template matching algorithms can
be used to further identify and extract the facial area of the measured
subjects. Based on the unique elliptical and circular geometry of the
human face, as well as the normal human body temperature range,
automatic detection of the human face can be achieved [14] (see Figure 3).
Figure 3 [15]. Demonstration of object selection for body temperature evaluation.
After the facial area is identified, we can analyse the facial temperature of
the subjects by processing the amount of infra-red radiation emitted from
this particular area.
11
2.4 Face Recognition
Since the robot patrols along the same route repeatedly, it is possible that a
fevering passenger is spotted by the robot for multiple times. This leads to
multiple fever cases generated by a single fever patient. To deal with this
issue of double counting, we adopt facial recognition technology. Facial
recognition algorithms analyse an image and extract the face of the person
within the image. Then, the facial features of the person will be quantified
and stored as a face vector. Face vectors of other images are compared and
those images that have similar face vectors will be identified as from the
same face (see Figure 4).
Figure 4[16]. Demonstration of facial recognition. The facial features of a
person is extracted and compared with other sample images from other
faces. If a face vector is not similar enough, it is considered as from
another person.
After adopting facial recognition technology, cases that are repeatedly
generated by the same person can be identified, and combined as one
single case. This effectively eliminates the issue of double counting and
improves the reliability and accuracy of our system. However, a limitation
for existing facial recognition technology is that the majority of the facial
area needs to be captured in the image, otherwise, if there is any
obstruction of the facial area, the algorithm cannot extract enough details
of the facial area, and thus no meaningful analysis can be carried out.
Therefore, when a person is wearing a mask, his or her nose and mouth
area cannot be identified and their faces cannot be analysed.
12
3. Result
This section discusses the results and the achievements of this project.
3.1 Installation of thermal camera
At the start of the project, we carried out research to look for a thermal
camera that is suitable for our use. The cheaper cameras were mostly
designed to be used as stand-alone hand-held cameras, and have poor
compatibility with a computer. For example, the model C2 manufactured
by Flir is a hand-held thermal camera, but it cannot provide a live stream
of thermal data when connected to a computer [17], which does not fit our
requirements. Other cheaper models are designed for mobile phone usage,
and have low thermal pixel density, thus would not provide a reliable
result. Also, these mobile phone thermal cameras are not designed to be
integrated with computers (namely Windows machines), and may lead to
certain unexpected exceptions. After comparing different models from
different manufacturers, we chose the HikVision DS-2TD1217B-3/PA
Thermographic Turret Body Temperature Measurement Camera. It is
specifically designed to be used for temperature monitoring, and comes
with Windows supported SDK. It fits our needs and purposes, and
therefore we picked this model.
13
The purchase and installation work of this thermal camera was completed
in the middle of the first semester. To install the camera onto the robot, we
first removed the original top camera of the robot, and replaced it with our
new thermal camera (See Figure 5). The existing DC 12V power supply,
which was originally used to power the old top camera, is now used to
power the newly mounted thermal camera.
Figure 5. The patrol robot after the thermal camera is installed.
14
The thermal camera is now entirely powered by the internal battery of the
patrol robot. After the physical installation, we then moved on to
integrating the camera with the robot’s computer. We assigned the camera
with an IP address which is on the same subnet of the router of the robot.
The camera is connected to the existing router of the robot via LAN, and
thus the thermal camera is connected to the robot computer through this
Ethernet connection. With this connection, the live view of the camera can
be fed to the robot’s computer, and though the SDK provided by the
camera manufacturer, the live view of the camera can be accessed by the
robot computer (See Figure 6).
Figure 6. Live view of the camera can be accessed by the robot computer.
Both the normal vision and thermal vision of the thermal camera can be
accessed by the robot computer in real-time.
15
3.2 Map drawing and Automatic Patrol Task
Using the navigation software provided by the vendor of the robot, namely
Unodopo Navi Studio, a map of the indoor open area of the Innovation
Wing is drawn (See Figure 7)
Figure 7. The map of the innovation Wing open area drawn in Unodopo Navi Studio.
The green rectangle is the patrol robot. The black dots and red lines represent the
obstacles. The small green dots are target navigation points for the patrol route.
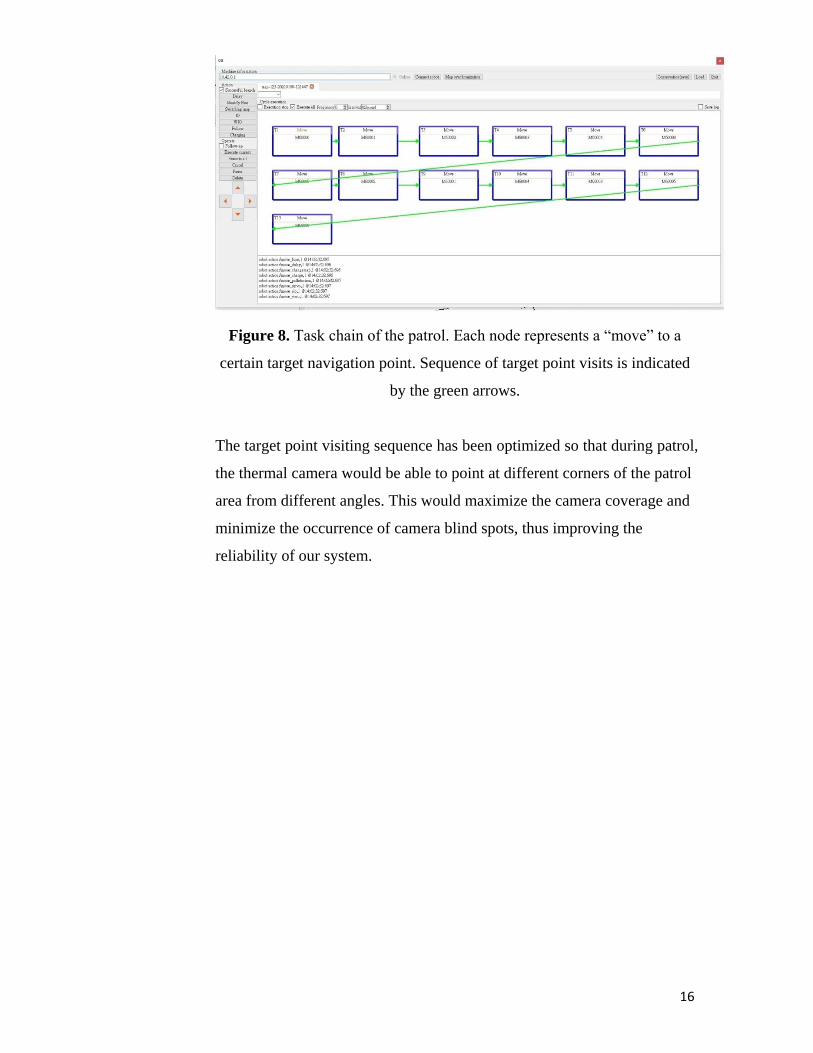
Using the same software, we placed a number of target navigation points
onto the map drawn. We then created a series of patrol tasks, and put these
tasks into an automatic task chain. Under the instructions of this task chain,
the robot would be automatically guided to visit the target navigation point
sequentially (See Figure 8).
16
Figure 8. Task chain of the patrol. Each node represents a “move” to a
certain target navigation point. Sequence of target point visits is indicated
by the green arrows.
The target point visiting sequence has been optimized so that during patrol,
the thermal camera would be able to point at different corners of the patrol
area from different angles. This would maximize the camera coverage and
minimize the occurrence of camera blind spots, thus improving the
reliability of our system.
17
3.3 Verbal Alert
We have managed to configure the camera to perform verbal alert when an
abnormal body temperature is measured. Whenever the camera finds a
measuring subject to have a surface temperature above the measurement
threshold, it will automatically play a verbal alert “temperature is
abnormal, please check”.
3.4 Mask Detection
The thermal camera has built-in mask detection algorithms. We have
incorporated the built-in mask detection function with our temperature
measurement system. When an abnormal temperature event is triggered,
images taken are also processed by the mask detection algorithms. The
results of this mask detection are then extracted as additional information
for the reference of the users.
18
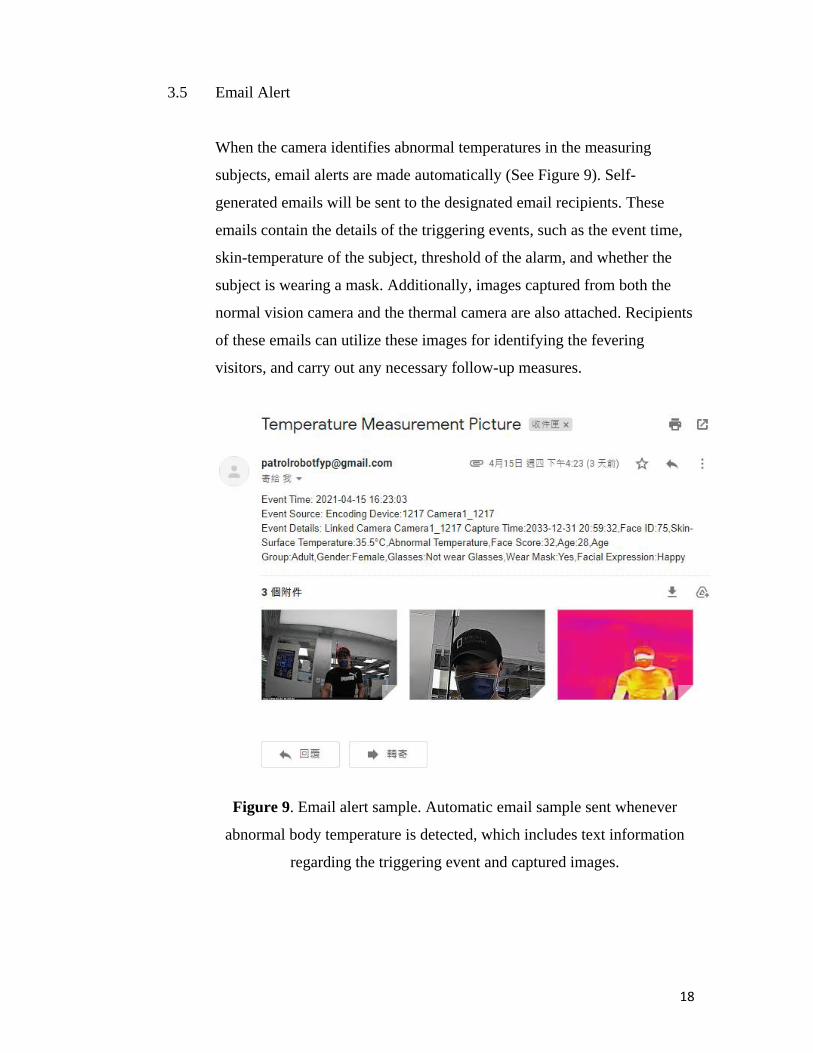
3.5 Email Alert
When the camera identifies abnormal temperatures in the measuring
subjects, email alerts are made automatically (See Figure 9). Self-
generated emails will be sent to the designated email recipients. These
emails contain the details of the triggering events, such as the event time,
skin-temperature of the subject, threshold of the alarm, and whether the
subject is wearing a mask. Additionally, images captured from both the
normal vision camera and the thermal camera are also attached. Recipients
of these emails can utilize these images for identifying the fevering
visitors, and carry out any necessary follow-up measures.
Figure 9. Email alert sample. Automatic email sample sent whenever
abnormal body temperature is detected, which includes text information
regarding the triggering event and captured images.
19
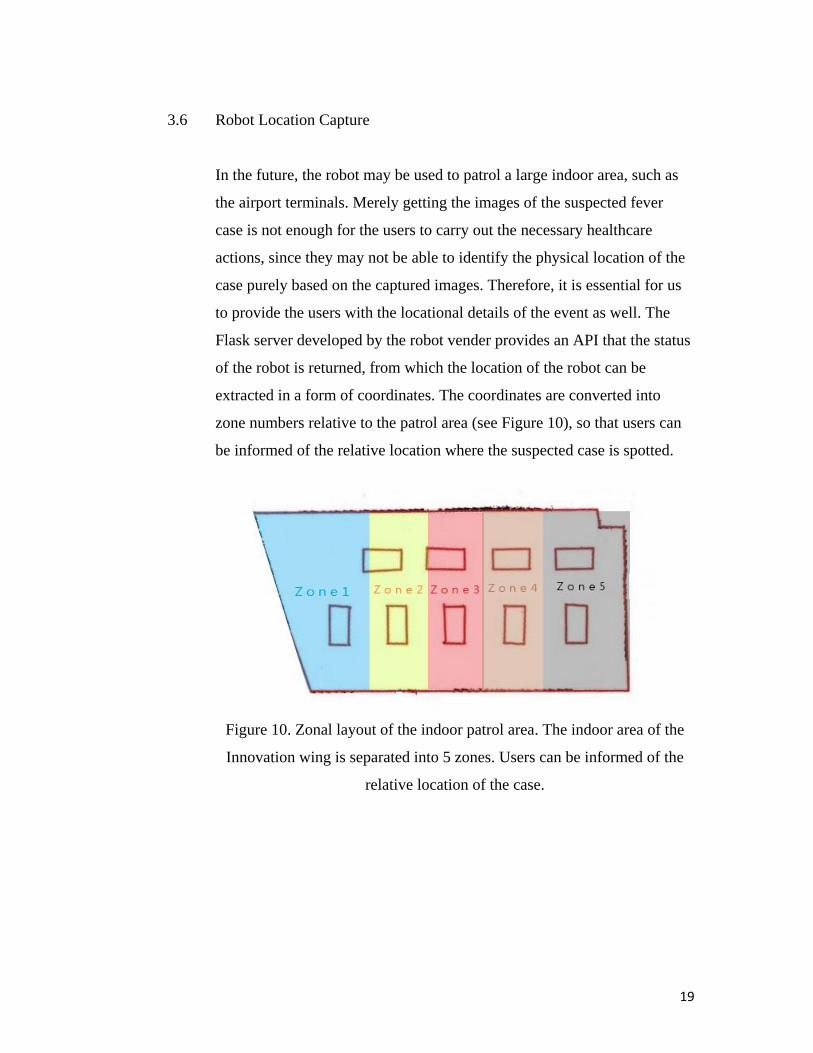
3.6 Robot Location Capture
In the future, the robot may be used to patrol a large indoor area, such as
the airport terminals. Merely getting the images of the suspected fever
case is not enough for the users to carry out the necessary healthcare
actions, since they may not be able to identify the physical location of the
case purely based on the captured images. Therefore, it is essential for us
to provide the users with the locational details of the event as well. The
Flask server developed by the robot vender provides an API that the status
of the robot is returned, from which the location of the robot can be
extracted in a form of coordinates. The coordinates are converted into
zone numbers relative to the patrol area (see Figure 10), so that users can
be informed of the relative location where the suspected case is spotted.
Figure 10. Zonal layout of the indoor patrol area. The indoor area of the
Innovation wing is separated into 5 zones. Users can be informed of the
relative location of the case.
20
3.7 Face Identification
Since the robot patrols along a same path repeatedly, a single fever patient
may trigger the abnormal temperature alarm time after time, creating
multiple cases. This double counting issue can be solved if the facial
identity of the person can be obtained. If a new case has the same facial
identity as one of the previous cases, we can conclude that the case is
already recorded. Instead of creating a new case, we can add the new data
to an existing case.
To task the reliability of face recognition on masked faces, the group tried
three methods of face recognition in total, including Openface toolkit,
Azure Face API, and the python library face_recognition. We tested the
accuracy of these tools with a dataset of masked faces (obtained from
https://github.com/X-zhangyang/Real-World-Masked-Face-Dataset). All
three methods failed to detect the presence of human faces in the images.
Therefore, similarity of different faces cannot be compared. In particular,
when using the Openface toolkit, only 1066 faces can be detected out of a
sample of a total 2466 masked faces. A model is then trained to match
faces, using the labeled data and known identities from the same dataset.
The trained model is subsequently tested with new data of masked faces,
and the result is highly inaccurate, nearing a 0% accuracy. For the Azure
Face API and the face_recognition python library, when masked faces are
passed as input, both of these tools failed to locate any human faces, and
thus do not provide any meaningful analysis. We thus concluded that we
failed to run face recognition tools with masked faces.