34
BACKGROUND AND METHODOLOGY 2021 Jan Burck Ursula Hagen Christoph Bals Niklas Höhne Leonardo Nascimento

BACKGROUND AND METHODOLOGY
2021
Jan BurckUrsula HagenChristoph BalsNiklas Höhne
Leonardo Nascimento
CCPI Background and Methodology GERMANWATCH
2
Imprint Authors: Jan Burck, Ursula Hagen, Christoph Bals, Niklas Höhne and Leonardo Nascimento
With the Support of: Björk Lucas and Sophia Binz
Layout: Dietmar Putscher, Björk Lucas
Editing: Janina Longwitz and Hanna Fuhrmann
Publishers:
Germanwatch e.V. Bonn Office: Berlin Office: Kaiserstrasse 201 Stresemannstrasse 72 D-53113 Bonn, Germany D-10693 Berlin, GermanyPhone +49 (0)228 / 60 492-0, Fax -19 Phone +49 (0)30 / 28 88 356-0, Fax -1
Internet: www.germanwatch.org E-mail: [email protected]
NewClimate Institute Cologne Office: Berlin Office: Clever Str. 13-15 Schönhauser Allee 10-11 D-50668 Cologne, Germany D-10119 Berlin, GermanyPhone +49 (0)221 / 99 983 300, Fax -19 Phone +49 (0)30 / 20 849 27 00Internet: www.newclimate.orgE-mail: [email protected]
Climate Action Network-International Rmayl, Nahr Street, Jaara Building, 4th floor P.O.Box: 14-5472, Beirut, Lebanon Phone: +96 (0)11 447 192 Internet: www.climatenetwork.org
December 2020
This publication can be downloaded at: www.ccpi.org/methodology
This publication is financially supported by the Barthel Foundation and Stiftung Mercator. Germanwatch is responsible for the content of this publication.

CCPI Background and Methodology GERMANWATCH
3
Content
Foreword: Enhancing Transparency in International Climate Politics .............................................. 4
1 Methodology ................................................................................................................................. 5
1.1 GHG Emissions (40% of Overall Score) ............................................................................................................... 8
1.2 Renewable Energy (20% of Overall Score) ...................................................................................................... 12
1.3 Energy Use (20% of Overall Score) ..................................................................................................................... 16
1.4 Climate Policy (20% of Overall Score) ............................................................................................................... 19
2 Calculation and Results ............................................................................................................... 21
3 Data Sources and Literature ....................................................................................................... 23
4 Annex ............................................................................................................................................ 25
Summary The Climate Change Performance Index (CCPI) is an independent monitoring tool for tracking countries' climate protection performance. It aims to enhance transparency in international climate politics and enables comparison of climate protection efforts and progress made by individual countries. This publication explains how the CCPI 2021 is calculated. Furthermore, it lists the literature and data sources used for these calculations.

CCPI Background and Methodology GERMANWATCH
4
Foreword: Enhancing Transparency in International Climate PoliticsGetting a clear understanding of national and international climate policy is difficult, as the numerous countries which need to be taken stock of, each have various initial po-sitions and interests. To untangle the knot of differentiated responsibilities as well as kept and broken promises and to encourage steps towards an effective international cli-mate policy, Germanwatch developed the Climate Change Performance Index (CCPI). As of now, the index compares 57 countries + the European Union (EU) that together are responsible for more than 90% of global greenhouse gas (GHG) emissions.
The climate change performance is evalu-ated according to standardised criteria and the results are ranked. With reaching the Paris Agreement in 2015, every country has put forward own mitigation targets and the global community emphasised the need to limit global temperature rise well below 2°C or even 1.5°C. The CCPI evaluates how far countries have come in achieving this goal. It helps to access and judge the countries' cli-mate policy, their recent development, cur-rent levels and well-below-2°C compatibility of GHG emissions, renewable energies, en-ergy use (as an indication of their perfor-mance in increasing energy efficiency) and their targets for 2030.
The component indicators provide all actors with an instrument to probe in more detail the areas that need to see movement. As an independent monitoring tool of countries' climate protection performance, it aims at enhancing transparency in international cli-mate politics and enables the comparability of climate protection efforts and progress made by individual countries. With this in mind, the NewClimate Institute, the Climate Action Network and Germanwatch present
the CCPI every year at the UN Climate Change Conference, thus creating as much attention as possible in the observed coun-tries and pushing forward the discussion on climate change. The astounding press echo to the CCPI shows its relevance: Both at the national and international level, numerous media report about the outcomes and on how well their country performed in the lat-est edition of the index. Awareness was also raised in politics. Many delegates at the cli-mate conferences as well as national gov-ernment institutions inform themselves on ways of increasing their countries’ rank.
By simplifying complex data, the index does not only address experts, but everyone. We would like to emphasise that so far no coun-try has received the overall rating “very high”. That is why, up until now, the first three ranks of the CCPI have been left open. We want to use the picture of an empty po-dium to stress that not one country in the listed in the CCPI has done enough to pre-vent dangerous climate change. We hope that the index provides an incentive to sig-nificantly change that and step up efforts. As a tool for climate protection information and communication, the index is also available online for general public interest at: www.ccpi.org
The following publication explains the back-ground and the methodology of the Climate Change Performance Index.
As has been the case with the previous edi-tions, the CCPI 2021 would not have been possible without the help of about 350 cli-mate experts from all over the world, who evaluated their countries’ climate policy. We would like to express our deep gratitude and thank all of them.

CCPI Background and Methodology GERMANWATCH
5
1 MethodologyThe climate change performance is as-sessed in four categories:
1. "GHG Emissions" (40% of overall score); 2. "Renewable Energy" (20% of overall
score); 3. "Energy Use" (20% of overall score); 4. "Climate Policy" (20% of overall score).
A country's performance in each of the cat-egories 1-3 is defined by its performance re-garding four different equally weighted indi-cators, reflecting four different dimensions of the category: "Current Level", "Past Trend (5-year trend)", "2°C-Compatibility of the
Current Level" and the "2°C-Compatibility of 2030 Target". These twelve indicators are complemented by two indicators under the category "Climate Policy", measuring the country's performance regarding its national climate policy framework and implementa-tion as well as regarding international cli-mate diplomacy.
Figure 1 gives an overview of the composi-tion and weighting of the four categories and 14 indicators defining a country's overall score in the CCPI. For details on the consti-tution of a country's scoring, please see chapter 3 "Calculation and Results".
Figure 1: Components of the CCPI: Fourteen indicators (outer circle) in four categories (inner circle)
CCPI Background and Methodology GERMANWATCH
6
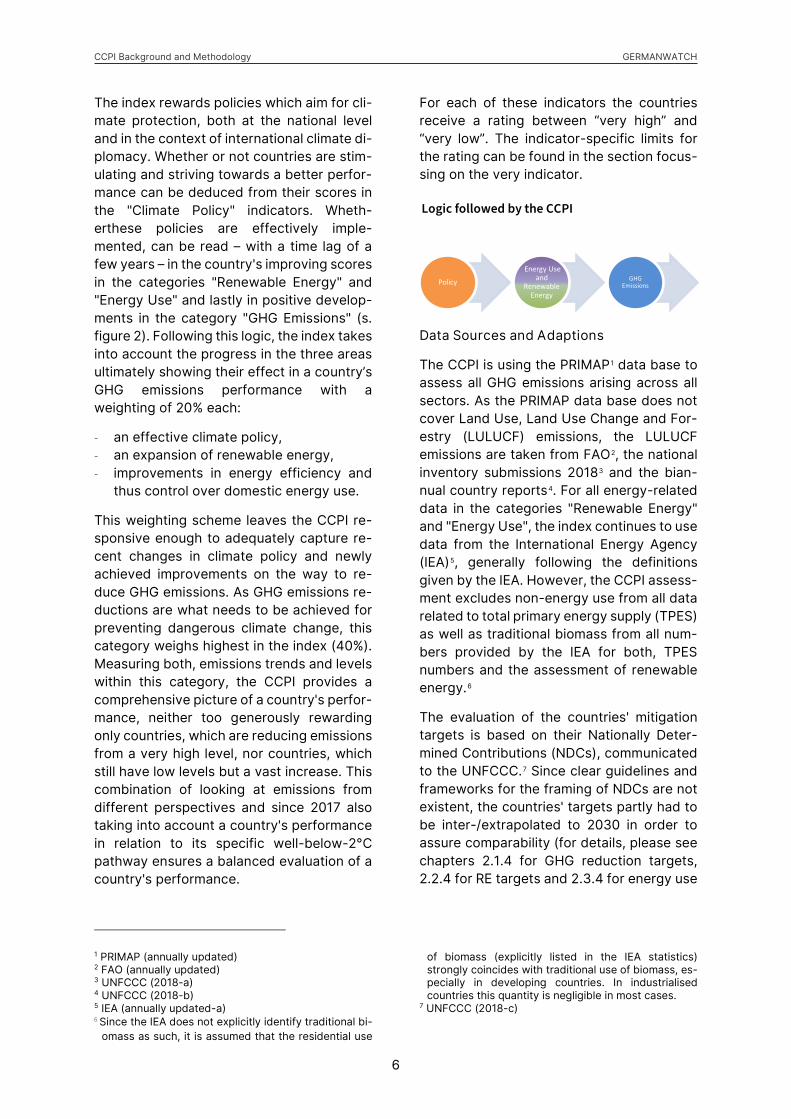
The index rewards policies which aim for cli-mate protection, both at the national level and in the context of international climate di-plomacy. Whether or not countries are stim-ulating and striving towards a better perfor-mance can be deduced from their scores in the "Climate Policy" indicators. Wheth-erthese policies are effectively imple-mented, can be read – with a time lag of a few years – in the country's improving scores in the categories "Renewable Energy" and "Energy Use" and lastly in positive develop-ments in the category "GHG Emissions" (s. figure 2). Following this logic, the index takes into account the progress in the three areas ultimately showing their effect in a country’s GHG emissions performance with a weighting of 20% each:
- an effective climate policy, - an expansion of renewable energy, - improvements in energy efficiency and
thus control over domestic energy use.
This weighting scheme leaves the CCPI re-sponsive enough to adequately capture re-cent changes in climate policy and newly achieved improvements on the way to re-duce GHG emissions. As GHG emissions re-ductions are what needs to be achieved for preventing dangerous climate change, this category weighs highest in the index (40%). Measuring both, emissions trends and levels within this category, the CCPI provides a comprehensive picture of a country's perfor-mance, neither too generously rewarding only countries, which are reducing emissions from a very high level, nor countries, which still have low levels but a vast increase. This combination of looking at emissions from different perspectives and since 2017 also taking into account a country's performance in relation to its specific well-below-2°C pathway ensures a balanced evaluation of a country's performance.
1 PRIMAP (annually updated) 2 FAO (annually updated) 3 UNFCCC (2018-a) 4 UNFCCC (2018-b) 5 IEA (annually updated-a) 6 Since the IEA does not explicitly identify traditional bi-
omass as such, it is assumed that the residential use
For each of these indicators the countries receive a rating between “very high” and “very low”. The indicator-specific limits for the rating can be found in the section focus-sing on the very indicator.
Data Sources and Adaptions
The CCPI is using the PRIMAP1 data base to assess all GHG emissions arising across all sectors. As the PRIMAP data base does not cover Land Use, Land Use Change and For-estry (LULUCF) emissions, the LULUCF emissions are taken from FAO2, the national inventory submissions 20183 and the bian-nual country reports4. For all energy-related data in the categories "Renewable Energy" and "Energy Use", the index continues to use data from the International Energy Agency (IEA)5, generally following the definitions given by the IEA. However, the CCPI assess-ment excludes non-energy use from all data related to total primary energy supply (TPES) as well as traditional biomass from all num-bers provided by the IEA for both, TPES numbers and the assessment of renewable energy.6
The evaluation of the countries' mitigation targets is based on their Nationally Deter-mined Contributions (NDCs), communicated to the UNFCCC.7 Since clear guidelines and frameworks for the framing of NDCs are not existent, the countries' targets partly had to be inter-/extrapolated to 2030 in order to assure comparability (for details, please see chapters 2.1.4 for GHG reduction targets, 2.2.4 for RE targets and 2.3.4 for energy use
of biomass (explicitly listed in the IEA statistics) strongly coincides with traditional use of biomass, es-pecially in developing countries. In industrialised countries this quantity is negligible in most cases.
7 UNFCCC (2018-c)
Policy
Energy Use and
Renewable Energy
GHG Emissions
Logic followed by the CCPI

CCPI Background and Methodology GERMANWATCH
7
targets). Evaluations of countries' perfor-mance in climate policy is based on an annu-ally updated survey among national climate
and energy experts from the country's civil societies (for details, please see chapter 2.4).
Box 1: Comparability of Different Editions of the CCPI An index that compares the climate change performance of different countries over several years encourages comparing a country’s ranking position to the past years. We need to point out that three factors limit the comparability across CCPI editions.
Revision of Historic Data in Databases
The first reason is limited comparability of the underlying data. The calculation of the CCPI is partly based on different databases by the International Energy Agency (IEA) and from PRIMAP. In many cases the IEA and others have revised historic data retroactively in later editions, if it needed to complete former results, e.g. due to new measuring sources. Con-sequently, it might not be possible to reproduce the exact results of one year with updated data from the same year but taken from a later edition of the databases.
Survey Respondents
The second factor that leads to limited comparability is that our expert pool providing the data basis for the “Climate Policy” category is continuously being extended and altered. We strive to increase the number of experts so that new evaluations of the countries’ policies depict a more differentiated result. At the same time, some experts are not available any-more, e.g. due to a change of job. When the people acting as the judges of a country’s policy change, differences in judgements can occur.
Methodological Changes
Thirdly, in 2017, the underlying methodology of the CCPI has been revised and adapted to the new climate policy landscape of the Paris Agreement. Even though the new methodol-ogy is based on similar ranking categories and data sources, some indicators as well as its weighting scheme have been adapted. With its new composition, the CCPI was extended to measuring a country's progress towards the globally acknowledged goal of limiting temper-ature rise well below 2°C. Furthermore, the index now also evaluates the country's 2030 targets. And finally, the former scope of looking at energy-related CO2 emissions has been extended to GHG emissions.
The CCPI G20 Edition of July 2017 and the CCPI 2018 were the first index publications based on the new methodology. The CCPI 2021 edition (for 57 selected countries and the EU) ensures a comparability with the previous editions (CCPI 2018, CCPI 2019, CCP! 2020).

CCPI Background and Methodology GERMANWATCH
8
1.1 GHG Emissions (40% of Overall Score)The greenhouse gas (GHG) emissions of each country are what ultimately influences the climate. Therefore, they may be per-ceived as the most significant measure in the success of climate policies. That is why the “GHG Emissions” category contributes 40% to the overall score of a country.
However, the diversity of countries evalu-ated in the CCPI is enormous. It is therefore indispensable that more than just one per-spective be taken on the emissions level and how the GHG emissions of a given country have developed in the recent past.
The “GHG Emissions” category thus is com-posed of four indicators: "Current Level" and "Past Trend" of per capita GHG emissions are complemented by two indicators, com-paring the countries' current level and 2030 emissions reduction targets to its country-specific well-below-2°C pathway. All of these indicators are weighted equally with 10% each.
8 PRIMAP (annually updated) 9 FAO (annually updated)
Since the CCPI edition 2018, the index co-vers all major categories of GHG emissions. This includes energy-related CO2 emissions, CO2 emissions from land use, land use change and forestry (LULUCF), methane (CH4), nitrous oxide (N2O), and the so-called F-gases hydrofluorocarbons (HFCs), per-fluorocarbons (PFCs) and sulphur hexafluo-ride (SF6) for which we use data from PRIMAP provided by the Potsdam Institute for Climate Impact Research (PIK)8. As the PRIMAP data base does not cover LULUCF emissions, the LULUCF emissions are taken from FAO9, the national inventory submis-sions 201810 and the biannual country re-ports11 submitted to UNFCCC. With using overall GHG-related instead of only energy-related CO2 emissions as in pre-vious editions of the CCPI, the index now re-flects a more comprehensive picture of the actual mitigation performance of a country, taking into account that emissions from other sectors play a crucial role in some of the evaluated countries.
10 UNFCCC (2018-a) 11 UNFCCC (2018-b)

CCPI Background and Methodology GERMANWATCH
9
Box 2: Emissions Accounting and Trade The currently prevailing way of accounting for national emissions encompasses all emissions emerging from domestic production using a territorial system boundary while excluding in-ternational trade. In this sense, the nation producing the emissions is also the one held ac-countable, no matter if those emissions are closely connected to an outflow of the produced goods to other countries. Considering that national governments can only exert political in-fluence on domestic production but have no power over production-related emissions abroad, this conception seems plausible at first sight.
In the course of globalisation, international trade has caused an increasing spatial separation between the production and consumption of goods. Thus, on the one hand, China, Thailand and South Africa, who belong to the group of high-producers and greenhouse gas exporters, currently report emission levels that are considered too high. On the other hand, France, Switzerland and the USA are large importers of CO2-intensive goods but the emissions im-ported are not charged to their account.
With increasing international trade influencing national economies as well as related emis-sions, an alternative emission accounting approach has emerged from scientific research. In contrast to the production-based approach, it is focused on emissions caused by national consumption. As a basis for calculating nation-level emissions this account uses the total of national consumption as the sum of all goods produced, less the ones exported, plus the ones imported by a country. Measuring emissions based on what is consumed would lead to an increase of the absolute amount of CO2 for several of the industrialised countries, in-duced by their emission intensive trade record. In contrast, countries like China and other emerging economies have proactively attracted production industries and continue to do so. In general, those countries also profit from their exports of emission intensive goods and should therefore not be entirely relieved of their responsibility.
The evaluation of emission data from the production and consumption of goods and services as presented in the graph in figure 3 by Caldeira and Davis (2011: 8533) shows significant differences between consumption-based and production-based data, while their develop-ment is clearly related. Generally, the amount of emissions embodied in global trade is con-stantly growing, increasing the importance of understanding and acknowledging consump-tion-based emission data. At the same time, the graph implies a high level of aggregation, wiping away diversity within the aggregate groups of developed and developing countries. Acknowledging this diversity, however, would require far more detailed analyses.
This CCPI is calculated with production emissions only.

CCPI Background and Methodology GERMANWATCH
10
1.1.1 Current Level of GHG Emissions per Capita
Even with an ambitious climate policy, the level of current per capita GHG emissions usually only changes in a longer-term per-spective. Thus, it is less an indicator of re-cent performance of climate protection than an indicator of the respective starting point of the countries being investigated. From an equity perspective, it is not fair to use the same yardstick of climate protection perfor-mance on countries in transition and on de-
veloped countries. The level of current emis-sions therefore is a means of taking into ac-count each country’s development situation and thus addressing the equity issue.
For a maximum of 2.5 CO2te/Capita, a coun-try receives a “very high” ranking for this in-dicator. Emissions of up to 5.5 or 8 CO2te/Capita receive either a “high” or “me-dium” rating, while more than 11 CO2te/Cap-ita represent a “very low” rating.
1.1.2 Past Trend of GHG Emissions per Capita
The indicator describing the recent develop-ment of GHG emissions accounts for 10% of a country’s overall score in the CCPI. To re-flect the development in this category, the CCPI evaluates the trend over a five-year period of greenhouse gases per capita. The indicator measuring recent development in emissions is comparatively responsive to ef-fective climate policy, and is therefore an im-portant indicator of a country’s performance.
Only countries with a decrease of emissions by more than 7% over the past 5 years will receive a “high” rating, while only a decrease of at least 20% means a “very high rating”. If emissions are even increasing, a country re-ceives a ”low” rating whereas countries are categorized/rated “very low”, if emissions have increased by more than 5% over the past 5 years.
1.1.3 Current Level of GHG Emissions per Capita Compared to a Well-Below-2°C Compatible Pathway
The benchmark for a well-below-2°C com-patible pathway in the index category “GHG Emissions” is based on a global scenario of
GHG neutrality in the second half of the cen-tury, which is in close alignment with the long-term goals of the Paris Agreement. To stay within these limits, GHG emissions need
Figure 4: GHG emissions: Actual pathway (green) vs. well-below-2°C target pathway (orange). Example of an over-performing country. Illustration: Germanwatch| NewClimate Institute

CCPI Background and Methodology GERMANWATCH
11
to be drastically reduced, a peak needs to be reached by 2020 and CO2 emissions need to decline to net zero by around 2050.12
The calculation of individual country target pathways is based on the common but dif-ferentiated convergence approach (CDC).13 It is based on the principle of “common but differentiated responsibilities and respective capabilities” laid forth in the Framework Convention on Climate Change. “Common” because all countries need to reduce their per capita emissions to the same level (here net zero) within the same time-period. “Dif-ferentiated” because developed countries
start on this path as of 1990, while develop-ing countries do so once they reach the global average per capita emissions. Hence, some developing countries can temporarily increase their emissions without letting the overall limit of well below 2°C out of sight.
For this indicator we measure the distance of the country's current (2018) level of per capita emissions to this pathway. If a country undercuts its pathway, it will receive a “high” rating or even a “very high” if the difference is above 3 CO2te/Capita. “Medium” and “low” ratings are defined by a difference of up to 2 and 4 CO2te/Capita to the pathway. Any-thing above is a “very low” performance.
1.1.4 GHG Emissions Reduction 2030 Target Compared to a Well-Below-2°C Compatible Pathway
The CCPI also evaluates a country's 2030 mitigation target, i.e. its emissions reduction plans for 2030. We do so by measuring the distance between this target and the coun-try's pathway determined using the common but differentiated convergence approach (see 2.1.3). This year for the first time, this difference is measured in relative terms ra-ther than in absolute terms. Thus, countries with high per capita emissions (e.g. Aus-tralia) are scoring worse than last year in this indicator. On the other hand, countries with low per capita emissions score better than last year as a smaller absolute gap to their pathway can mean a higher relative gap to their target.
GHG targets are usually not presented in ab-solute terms when communicated by coun-tries in their NDCs, or other formal commit-ments. Targets must often be interpreted to arrive at absolute GHG emission limits for 2030. We take other studies, which have done this interpretation, as a starting point for our quantification. We take absolute emissions from the sources (Climate Action Tracker (CAT)14 or NDC & INDC Factsheets by PIK and the University of Melbourne15), di-vide this by the population in both target and
12 IPCC (2018) 13 Höhne, N. et al. (2006)
base year to obtain the emissions per capita in both years – that allows for the calculation of growth factors. The CAT country assess-ments are updated up to twice a year, so it is the preferred source. If a country is not in-cluded in the CAT analysis the respective factsheet is used to quantify the emissions. We apply the resulting growth factors to the CCPI tool emission values in the base year, to arrive at a target value that is consistent with the emissions dataset used in the other CCPI indicators.
We apply the growth rates from the CAT and factsheets, which exclude LULUCF, to emis-sions from CCPI, which include LULUCF. We choose this approach due to the lack of con-sistent LULUCF projections across all the countries in the index. LULUCF emissions estimates vary strongly between different datasets and the methodologies used for those estimates. Our current approach has the underlying assumption that the growth of the LULUCF sector is equivalent to the growth in the other sectors of the economy.
14 Climate Action Tracker (2019) 15 Meinshausen, M. and Alexander, R. (2017)

CCPI Background and Methodology GERMANWATCH
12
Both the CAT and the factsheets use UN population medium fertility variant projec-tions, which we use to adjust the absolute emissions to per capita.
Some countries have updated their targets but are not analysed separately by the CAT: France, Germany, Portugal, United Kingdom and Chinese Taipei. In these cases, we quantify the absolute emissions level in 2030 individually using the respective target definitions as described in the annex. In countries where the LULUCF sector is re-sponsible for a large share of emissions, we
calculate targets including LULUCF. This is the case for Brazil and Indonesia.
A “high“ or “very high” rating can be achieved with a target below the country’s pathway. If the difference is even above 1 CO2te/Capita, a country will receive the best rating. Targets with a difference of up to 2.5 CO2te/Capita to the pathway are assessed as a “medium” performance and a difference of up to 5 CO2te/Capita or even above as “low” and “very low”.
1.2 Renewable Energy (20% of Overall Score) Since 2016 was the first year with a constant CO2 concentration in the atmosphere above 400 parts per million, swift action is re-quired.16 Most of the researchers anticipate that a permanent transgression of this threshold will lead to a temperature rise above 2°C.17 Therefore, a constant expan-sion of renewable energies and a decline in fossil fuel combustion are essential.
Substituting fossil fuels with renewable en-ergies is one of the most prominent strate-gies towards a transformed economic sys-tem that is compatible with limiting global warming well below 2°C. It is equally im-portant to increase energy efficiency, lead-ing to a reduction in global energy use. For example, in the year 2015, renewable ener-gies in Germany accounted for approxi-mately 14.9% of total final energy consump-tion. Calculations show that deployment of renewable energies resulted in a net avoid-ance of 156 mt CO2 in 2015.18 This shows that a targeted increase in the share of renewa-ble energies can make a vital contribution to climate change protection efforts. The “Re-newable Energy” category assesses whether a country is making use of this po-
16 Betts, R.A. et al. (2016) 17 OECD (2012)
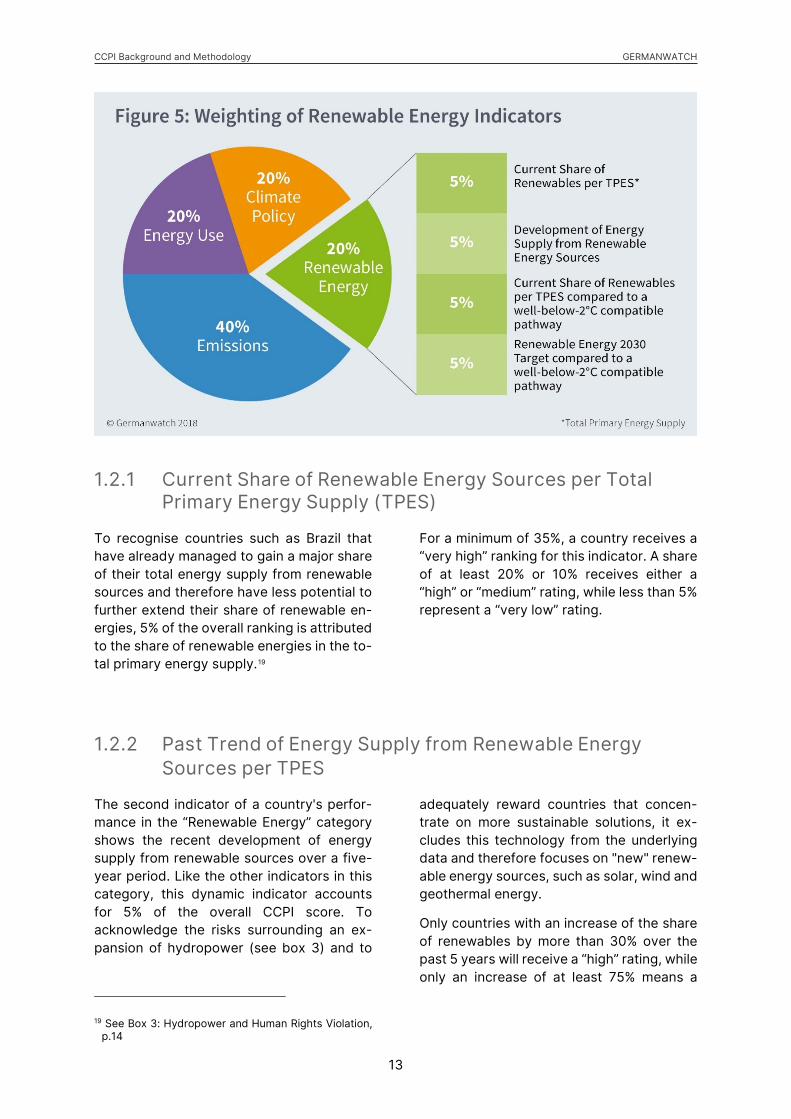
tential for emissions reduction. This cate-gory, therefore, contributes with 20% to the overall rating of a country, within which each of the four indicators accounts for 5%.
In the absence of data assessing traditional biomass only, all renewable energy data are calculated without residential biomass for heat production, in order to prevent disad-vantages for countries increasing their ef-forts to replace the unsustainable use of tra-ditional biomass in their energy mix.
The recent developments and the 2°C com-patibility of the current level exclude hydro-power, while values for the current level and the 2°C compatibility of the 2030 target in-clude hydropower (see Box 3).
Furthermore, all values for total primary en-ergy supply (TPES) integrated in the CCPI exclude non-energy use, such as oil usage for other reasons than combustion, in order not to distort the picture and avoid disad-vantages for countries with e.g. a larger chemical industry which is usually predomi-nantly export-oriented, leading to the alloca-tion problems mentioned in Box 2.
18 BMWi (2015)
CCPI Background and Methodology GERMANWATCH
13
1.2.1 Current Share of Renewable Energy Sources per Total Primary Energy Supply (TPES)
To recognise countries such as Brazil that have already managed to gain a major share of their total energy supply from renewable sources and therefore have less potential to further extend their share of renewable en-ergies, 5% of the overall ranking is attributed to the share of renewable energies in the to-tal primary energy supply.19
For a minimum of 35%, a country receives a “very high” ranking for this indicator. A share of at least 20% or 10% receives either a “high” or “medium” rating, while less than 5% represent a “very low” rating.
1.2.2 Past Trend of Energy Supply from Renewable Energy Sources per TPES
The second indicator of a country's perfor-mance in the “Renewable Energy” category shows the recent development of energy supply from renewable sources over a five-year period. Like the other indicators in this category, this dynamic indicator accounts for 5% of the overall CCPI score. To acknowledge the risks surrounding an ex-pansion of hydropower (see box 3) and to
19 See Box 3: Hydropower and Human Rights Violation, p.14
adequately reward countries that concen-trate on more sustainable solutions, it ex-cludes this technology from the underlying data and therefore focuses on "new" renew-able energy sources, such as solar, wind and geothermal energy.
Only countries with an increase of the share of renewables by more than 30% over the past 5 years will receive a “high” rating, while only an increase of at least 75% means a

CCPI Background and Methodology GERMANWATCH
14
“very high rating”. If the share of renewables is even decreasing, a country receives a ”very low” rating. “Medium” and ”low” ratings
mean an increase in the share of renewables of at least 15% or 5%.
Box 3: Hydropower and Human Rights Violation One of the largest contributors to renewable energy supply is the generation of hydropower. However, many large hydropower projects are considered to be not sustainable. Large hy-dropower projects often have profound negative impacts on local communities, wildlife and vegetation in the river basins and sometimes even produce additional greenhouse gas emis-sions where water catchments are particularly shallow.
This causes a double challenge to the CCPI. Firstly, countries that already meet a large share of their energy demand with supply from renewable energies – often old and potentially non-sustainable hydropower – can hardly raise their production in relative terms as easily as a country that starts with near-zero renewable energy supply. On the contrary, if a country already covers nearly 100% of its demand via renewable energy supply and at the same time increases efficiency, the total renewable energy supply might even fall. In such an extreme case a country would receive a very low CCPI score in the “Renewable Energy” category while demonstrating exemplary climate change performance.
Secondly, if the CCPI fully included large hydropower, it would reward to some degree the development of unsustainable dam projects when an increase in renewable energy supply is solely driven by such projects. Such an approach is not regarded as adequate climate protection by the authors of the CCPI.
Unfortunately, data availability on the structure or even sustainability of hydropower gener-ation and a distinction between large non-sustainable projects and sustainable small-scale hydropower generation is insufficient. In its attempt to balance the extent of rewarding countries for expanding large-scale hydropower, the CCPI excludes all hydropower from two of four indicators in the “Renewable Energy” category. As a result, the recent develop-ments in renewable energy as well as the indicator that measures the current level of re-newables to a country's well-below-2°C pathway exclude hydropower, while the total val-ues of the current level and the indicator evaluating the 2030 renewably energy target in-clude hydropower.
If data availability on large-scale and non-sustainable hydropower changes in the future, we will include these data and therefore exclude non-sustainable hydropower only from all four indicators.
Non-sustainable approaches and human rights violations related to the expansion of renew-able energy are also increasingly affecting other renewable energy technologies. The drain of land resources for energy generation from biomass and the resulting conflict with land resources for food production is only one example of the complexity surrounding the nec-essary expansion of renewable energies. Also, both fields of conflict are increasingly being seen in reaction to the expansion of onshore wind power generation. The authors of the CCPI are well aware of the increasing importance of these developments and will continu-ously examine possibilities to acknowledge them in future editions of the ranking.
CCPI Background and Methodology GERMANWATCH
15
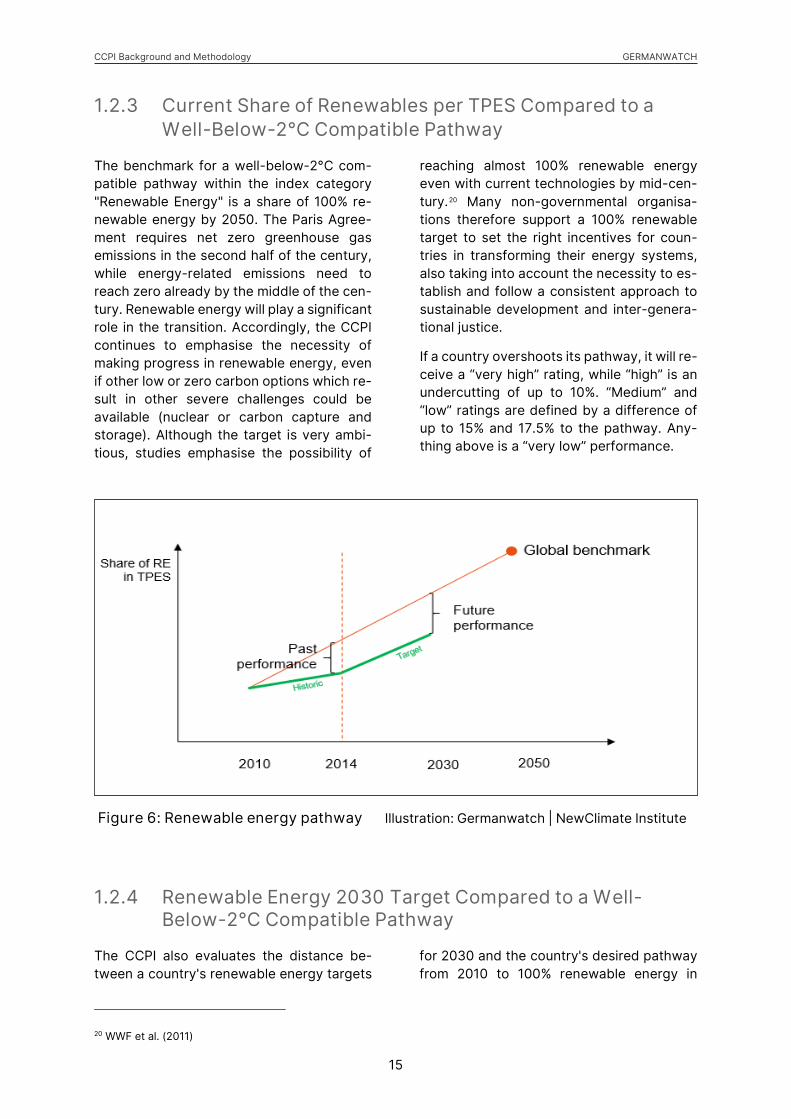
Figure 6: Renewable energy pathway Illustration: Germanwatch | NewClimate Institute
1.2.3 Current Share of Renewables per TPES Compared to a Well-Below-2°C Compatible Pathway
The benchmark for a well-below-2°C com-patible pathway within the index category "Renewable Energy" is a share of 100% re-newable energy by 2050. The Paris Agree-ment requires net zero greenhouse gas emissions in the second half of the century, while energy-related emissions need to reach zero already by the middle of the cen-tury. Renewable energy will play a significant role in the transition. Accordingly, the CCPI continues to emphasise the necessity of making progress in renewable energy, even if other low or zero carbon options which re-sult in other severe challenges could be available (nuclear or carbon capture and storage). Although the target is very ambi-tious, studies emphasise the possibility of
reaching almost 100% renewable energy even with current technologies by mid-cen-tury.20 Many non-governmental organisa-tions therefore support a 100% renewable target to set the right incentives for coun-tries in transforming their energy systems, also taking into account the necessity to es-tablish and follow a consistent approach to sustainable development and inter-genera-tional justice.
If a country overshoots its pathway, it will re-ceive a “very high” rating, while “high” is an undercutting of up to 10%. “Medium” and “low” ratings are defined by a difference of up to 15% and 17.5% to the pathway. Any-thing above is a “very low” performance.
1.2.4 Renewable Energy 2030 Target Compared to a Well-Below-2°C Compatible Pathway
The CCPI also evaluates the distance be-tween a country's renewable energy targets
20 WWF et al. (2011)
for 2030 and the country's desired pathway from 2010 to 100% renewable energy in

CCPI Background and Methodology GERMANWATCH
16
2050 (using a linear pathway for methodo-logical reasons).
Comparing renewable energy targets is a substantial challenge because countries put forward their renewable energy targets in many ways, as there is an absence of uni-form rules for such target setting. Some countries only have targets for subnational states, others have national targets. Some define their targets in terms of installed ca-pacity rather than the share of renewables in the TPES.
In order to convert these different types of targets into a future share of renewable en-ergy in the TPES, we proceeded as follows:
- Targets provided as renewable energy targets as share of the TPES are taken directly.
- Generation targets are converted to share of renewable energy in the TPES according to the method described in the appendix. In case only installed capacity targets are available, country-specific capacity factors are used to
convert capacity targets into generation targets, before the conversion to TPES.
- Whenever a target is formulated for a year other than 2030, a 2030 value is calculated by linear interpolation of the target share.
- All numbers for the current share of renewables in a country's energy supply are taken from the IEA energy balances.
The table in the annex explains the approach chosen for each individual country including the main assumptions (see also the legend below the annex table for an explanation of assumptions a to e).
A “very high“ rating can be achieved with a target above the country’s pathway. If the difference is only up to 10%, a country will receive the second best rating. Targets with a difference of up to 30% to the pathway are assessed as a “medium” performance and a difference of up to 40% or even above as “low” and “very low”.
1.3 Energy Use (20% of Overall Score) Besides an expansion of renewable ener-gies, a vast increase in energy efficiency is crucial to achieving global decarbonisation
and overall greenhouse gas neutrality by mid-century. The more efficient energy can be used, the faster and easier countries can

CCPI Background and Methodology GERMANWATCH
17
reach net-zero emissions. Therefore, one major step in combatting the global climate crisis is to reduce the energy needed to pro-vide for products and services.
Increases in energy efficiency in its strict sense are complex to measure and would re-quire a sector-by-sector approach, for which there are no comparable data sources available across all countries at the present time. The CCPI therefore assesses the per capita energy use of a country and measures progress in this category.21 As in the catego-ries "GHG Emissions" and "Renewable En-
ergy", the CCPI aims to provide a compre-hensive picture and balanced evaluation of each country, acknowledging the different development stages of countries and thus basing their performance evaluation in per capita energy use on four different dimen-sions: current level, recent development and the 2°C compatibility of both the current level and the 2030 target.
As in the “Renewable Energy” category, TPES data excludes values for non-energy use and traditional biomass (see chapter 2.2).
1.3.1 Current Level of Energy Use Measured as TPES per Capita
To recognise some countries increasing their per capita energy use but doing so from a still very low level, this indicator gives the current TPES/capita values, which account for 5% in the overall index ranking.
For a maximum of 60 UnitTPES/Capita, a country receives a “very high” ranking for this indicator. Energy Use of up to 90 or 120 UnitTPES/Capita receives either a “high” or “medium” rating, while more than 160 UnitTPES/Capita represent a “very low” rat-ing.
1.3.2 Past Trend of Energy Use measured as TPES per Capita
In accordance with the categories “Renewa-ble Energy” and “GHG Emissions”, the indi-cator measuring recent developments in per capita energy use describes the trend in the period of the last five years for which there is data available that allows for comparison across all evaluated countries. This indicator also accounts for 5% of the overall CCPI ranking.
Countries with a decrease of energy use by more than 5% over the past 5 years will re-ceive a “high” rating, while only a decrease of at least 15% means a “very high rating”. If energy use is even increasing, a country re-ceives a ”low” or “very low” rating, if energy use has increased by more than 10% over the past 5 years.
1.3.3 Current Level of TPES per Capita Compared to a Well-Below-2°C Compatible Pathway
For 2°C and 1.5°C scenarios, a decrease in emissions by reducing the (growth in) en-ergy use is as crucial as deploying renewable (or other low-carbon) technologies. The
21 Rebound effects can diminish positive effects of in-creased efficiency or even reverse them. Still, we
IPCC carried out a scenario comparison us-ing a large number of integrated assessment models.22
cannot forgo these efficiency improvements, but ra-ther must complement them with adequate measures that limit rebound effects.
22 Clarke, L.et al. (2014)

CCPI Background and Methodology GERMANWATCH
18
Figure 8: Energy use pathway Illustration: Germanwatch/NewClimate Institute
From the scenarios available, we observe that the total amount of global energy use in 2050 has to be roughly the same level or a bit higher than it is today, with a margin of uncertainty. At the same time population will grow slightly between today and 2050. We therefore pragmatically chose the well-be-low-2° compatible benchmark to be “same energy use per capita in 2050 as the current global average”, which is 80 gigajoules per capita in total primary energy supply (TPES).
Current energy use per capita is very di-verse. At the present time, the value for India is only a third of the global average, while for the United States it is more than three times higher than the global average. Conse-quently, the chosen benchmark would allow
India to triple its energy use per capita by 2050, while absolute energy demand can grow even further due to population growth. The United States would need to cut per capita energy use to one third by 2050.
We calculate a linear pathway from 1990 to the described benchmark in 2050 and meas-ure the distance of the country's current level to this pathway.
If a country undercuts its pathway, it will re-ceive a “high” rating or even a “very high” if the difference is above 30%. “Medium” and “low” ratings are defined by a difference of up to 10% and 30% to the pathway. Anything above is a “very low” performance.
1.3.4 Energy Use TPES per Capita 2030 Target Compared to a Well-Below-2°C Compatible Pathway
The CCPI also evaluates the distance be-tween the country's energy targets for 2030 along the country's pathway to the 2050 benchmark. This year for the first time, this distance is measured in absolute terms ra-ther than in relative terms. This leads to countries with a lower TPES per capita to have a higher score in this category, as long as their TPES per Capita target for 2030 is above their pathway.
Energy efficiency and energy use targets are not formulated in standardised units. Some countries present targets as efficiency gains compared to a baseline scenario, whereas others announce reduction targets for the economy energy intensity.
We combined various data sources to trans-form all targets expressed in different units into a targeted future per capita energy use.

CCPI Background and Methodology GERMANWATCH
19
For this purpose, we relied on population projections by the United Nations.23
Since 2020, when no explicit economy-wide target was available, we assume the trend in per capita energy use of the previous five years is maintained until 2030.
Whenever a target is indicated for a year other than 2030, we interpolated or extrap-olated the result linearly to obtain a value for 2030. The table in the annex specifies the
approach we chose for each individual coun-try. All historical data on TPES are taken from the IEA energy balances.24
A “very high“ or “high” rating can be achieved with a target undercutting the country’s pathway. If the difference is only up to 30% to its pathway, a country will re-ceive the second best rating. Targets with a difference of up to 10% difference to the pathway are assessed as a “medium” perfor-mance and a difference of up to 40% differ-ence or even above as “low” and “very low”.
1.4 Climate Policy (20% of Overall Score)The “Climate Policy” category in the CCPI considers the fact that measures taken by governments to reduce greenhouse gases often take several years to show their effect on the categories “GHG Emissions”, “Energy Use” and “Renewable Energy”. On top of this, the most current greenhouse gas emissions data enumerated in sectors of origin, pro-vided by PRIMAP and the IEA, is about two years old. However, the assessment of cli-mate policy includes much more recent de-velopments. The effect that current govern-ments benefit or suffer from the conse-quences of the preceding administration’s climate actions is thereby reduced.
The data for the category “Climate Policy” is assessed annually in a comprehensive re-search study. Its basis is the performance rating by climate and energy policy experts from non-governmental organisations, uni-versities and think tanks within the countries that are evaluated. In a questionnaire, they give a rating on a scale from one (“weak”) to five (“strong”) on the most important measures of their government. In order to obtain more differentiated results, there is also the possibility to further evaluate and comment on single aspects. Both the na-tional and international efforts and impulses
23 UN (2017)
of climate policies are scored (s. 2.4.1 and 2.4.2).
To compensate the absence of independent experts in some countries (due to the lack of functioning civil society or research struc-tures), the national policy of such countries is flatly rated as scoring average points. The goal is to close these gaps in the future and steadily expand the network of experts. For the CCPI 2021, about 380 national climate experts contributed to the evaluation of the 57 countries plus the EU. They each evalu-ated their own country’s national and inter-national policy. The latter is also rated by cli-mate policy experts who closely observe the participation of the respective countries at climate conferences.
Climate policy has an overall weight of 20%, with national and international policy making up 10% each. Despite the apparently low in-fluence of climate policy, this category has quite a considerable influence on short-term changes in the overall ranking. Unlike the ra-ther “sluggish” categories of “Emissions”, “Renewable Energy” and “Energy Use”, a positive change in climate policy can lead a country to jump multiple positions. On the other hand, the “sluggish” categories can only be changed through successful climate change mitigation – policy therefore plays a
24 IEA (annually updated-c)
CCPI Background and Methodology GERMANWATCH
20
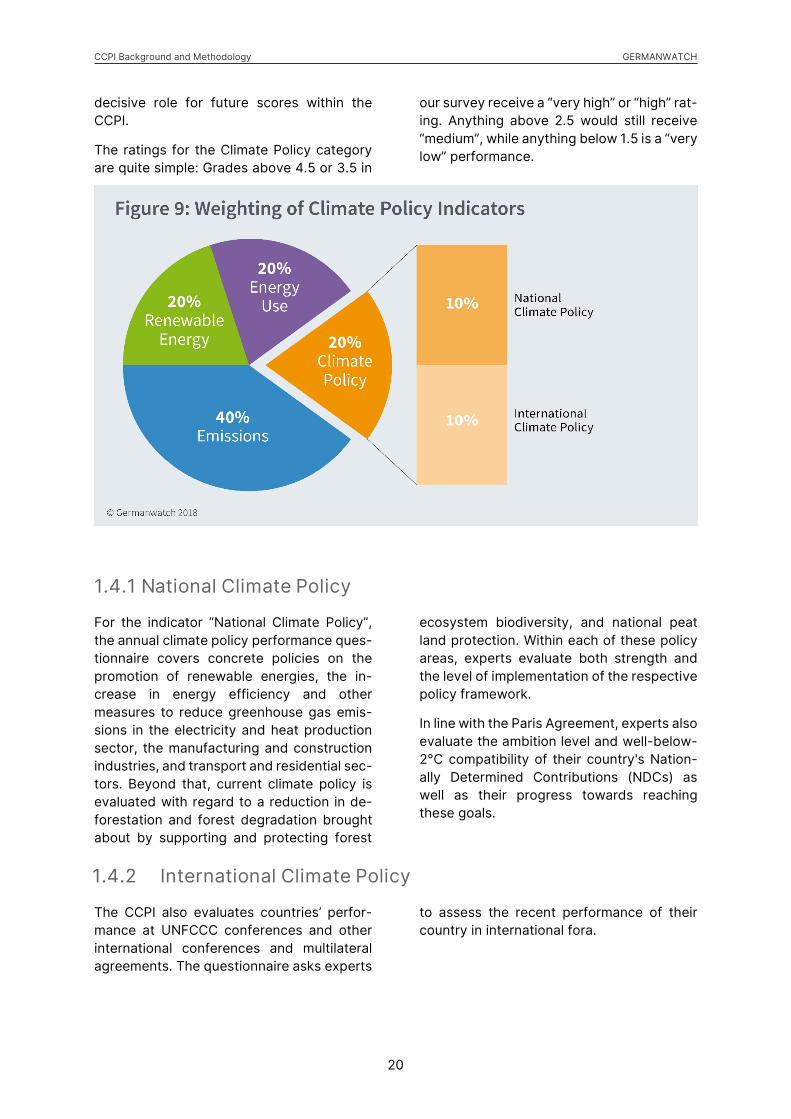
decisive role for future scores within the CCPI.
The ratings for the Climate Policy category are quite simple: Grades above 4.5 or 3.5 in
our survey receive a “very high” or “high” rat-ing. Anything above 2.5 would still receive “medium”, while anything below 1.5 is a “very low” performance.
1.4.1 National Climate Policy
For the indicator “National Climate Policy”, the annual climate policy performance ques-tionnaire covers concrete policies on the promotion of renewable energies, the in-crease in energy efficiency and other measures to reduce greenhouse gas emis-sions in the electricity and heat production sector, the manufacturing and construction industries, and transport and residential sec-tors. Beyond that, current climate policy is evaluated with regard to a reduction in de-forestation and forest degradation brought about by supporting and protecting forest
ecosystem biodiversity, and national peat land protection. Within each of these policy areas, experts evaluate both strength and the level of implementation of the respective policy framework.
In line with the Paris Agreement, experts also evaluate the ambition level and well-below-2°C compatibility of their country's Nation-ally Determined Contributions (NDCs) as well as their progress towards reaching these goals.
1.4.2 International Climate Policy
The CCPI also evaluates countries’ perfor-mance at UNFCCC conferences and other international conferences and multilateral agreements. The questionnaire asks experts
to assess the recent performance of their country in international fora.

CCPI Background and Methodology GERMANWATCH
21
1.4.3 Green Economic Recovery
For the CCPI 2021, the Climate Policy survey was extended by a brief stocktake of green stimulus interventions and harmful actions to avoid in response to the COVID-19 pan-demic. The questions correspond largely to the above-mentioned categories of Climate
Policy and aim to establish an understanding of the countries’ prioritization in their eco-nomic stimulus packages, assessing whether low-carbon development strategies are promoted or not.
2 Calculation and ResultsThe current evaluation method sets zero as the bottom cut off, and 100 points are the maximum that can be achieved. A country that performed best in one indicator re-ceives full points (in that indicator). Im-portant for interpretation is the following: 100 points are possible in principle, but for each partial indicator, and for the overall score, this still only means the best relative performance, which is not necessarily the optimal climate protection effort.
The CCPI’s final ranking is calculated from the weighted average of the achieved scores in the separate indicators with the following formula:
𝐼𝐼 = �𝑤𝑤𝑖𝑖
𝑛𝑛
𝑖𝑖=1
𝑋𝑋𝑖𝑖
I: Climate Change Performance Index, Xi: normalised Indicator, wi: weighting of Xi,
�𝑤𝑤𝑖𝑖 = 1 𝑎𝑎𝑎𝑎𝑎𝑎 0 ≤ 𝑤𝑤𝑖𝑖 ≤ 1𝑛𝑛
𝑖𝑖=1
i: 1,…., n: number of partial indicators (cur-rently 14)
Score = 100 � 𝑎𝑎𝑎𝑎𝑎𝑎𝑎𝑎𝑎𝑎𝑎𝑎 𝑣𝑣𝑎𝑎𝑎𝑎𝑎𝑎𝑣𝑣−𝑚𝑚𝑖𝑖𝑛𝑛𝑖𝑖𝑚𝑚𝑎𝑎𝑚𝑚 𝑣𝑣𝑎𝑎𝑎𝑎𝑎𝑎𝑣𝑣𝑚𝑚𝑎𝑎𝑚𝑚𝑖𝑖𝑚𝑚𝑎𝑎𝑚𝑚 𝑣𝑣𝑎𝑎𝑎𝑎𝑎𝑎𝑣𝑣−𝑚𝑚𝑖𝑖𝑛𝑛𝑖𝑖𝑚𝑚𝑎𝑎𝑚𝑚 𝑣𝑣𝑎𝑎𝑎𝑎𝑎𝑎𝑣𝑣
�
The differences between countries’ efforts to protect the climate are only to be seen clearly in the achieved score, not in the rank-ing itself. When taking a closer look at the top position of the CCPI 2021, one can see that Sweden as the highest-ranking country was not at the top in all indicators, let alone has it achieved 100 points. This example shows that failures and weak points of a country can only be recognised within the separate categories and indicators.
The current version of the Climate Change Performance Index including model calcula-tions and the press review can be down-loaded from:
www.ccpi.org
CCPI Background and Methodology GERMANWATCH
22
Development and Prospects
The CCPI was first introduced to a profes-sional audience at the COP11 – Montreal Cli-mate Conference in 2005.
Since the beginning CAN International sup-ports the index through its international net-work of experts working on the issue of cli-mate protection.
Following a methodological evaluation of the seventh edition of the CCPI, we began to in-clude the carbon emissions data from defor-
estation. However, due to the lack of com-parable data for various other sectors, like agriculture, peatland or forest degradation, the corresponding emissions could not be taken into account until 2017.
Due to the methodological revision in 2017, we are able to assess all GHG emissions aris-ing across all sectors. The index also in-cludes assessments of the countries' current performance and own targets set for the fu-ture in relation to their country-specific well-below-2°C pathway.

CCPI Background and Methodology GERMANWATCH
23
3 Data Sources and Literature • Baumert, D. A.; Herzog, T.; Pershing, J. (2005): Navigating the Numbers, World Resources
Institute. http://pdf.wri.org/navigating_numbers.pdf.
• Betts, R.A.; Jones, C.D.; Knight, J.R.; Keeling, R.F.; Kennedy, J.J. (2016): El Niño and a record CO2 rise. Nature Climate Change 6, 806-810. www.nature.com/nclimate/jour-nal/v6/n9/full/nclimate3063.html.
• Burck, J.; Bals, C. et al. (annually updated): The Climate Change Performance Index. www.ccpi.org.
• Caldeira, K.; Davis, S. (2011): Accounting for carbon dioxide emissions: A matter of time, PNAS, Vol.108, No. 21, 8533-8534.
• Clarke L.; Jiang, K.; Akimoto, K.; Babiker, M.; Blanford, G.; Fisher-Vanden, K.; Hourcade, J.-C.; Krey, V.; Kriegler, E.; Löschel, A.; McCollum, D.; Paltsev, S.; Rose, S.; Shukla, P. R.; Tavoni, M.; van der Zwaan, B. C.; van Vuuren, D.P. (2014): Assessing Transformation Pathways. In: Climate Change 2014: Mitigation of Climate Change. Contribution of Working Group III. to the Fifth Assessment Report of the Intergovernmental Panel on Climate Change [Edenhofer, O.; Pichs-Madruga, R.; Sokona, Y.; Farahani, E.; Kadner, S.; Seyboth, K.; Adler, A.; Baum, I.; Brun-ner, S.; Eickemeier, P.; Kriemann, B.; Savolainen, J.; Schlömer, S.; von Stechow, C.; Zwickel, T. and J.C. Minx (eds.)]. Cambridge University Press, Cambridge, United Kingdom and New York, NY, USA. http://www.ipcc.ch/pdf/assessment-report/ar5/wg3/ipcc_wg3_ar5_chap-ter6.pdf
• Climate Action Tracker (2020): Tracking NDC. www.climateactiontracker.org.
• FAO (annually updated): Global Forests Resources Assessment. www.fao.org/3/a-i4808e.pdf.
• Freudenberg, M. (2003): Composite Indicators of Country Performance: A Critical Assess-ment. STI Working Paper, 2003/16. Paris.
• Gütschow, J.; Jeffery, L.; Gieseke, R.; Gebel, R.; Stevens, D.; Krapp, M.; Rocha, M. (2016): The PRIMAP-hist national historical emissions time series, Earth Syst. Sci. Data, 8, 571-603.
• Gütschow, J.; Jeffery, L.; Gieseke, R. (2019): The PRIMAP-hist national historical emissions time series (1850-2018). v2.0. GFZ Data Services. https://doi.org/10.5880/pik.2019.018
• Griscom, B.; Ganz, D.; Virgilio, N.; Price, F.; Hayward, J.; Cortez, R.; Dodge, G.; Hurd, J.; Low-enstein, F. L.; Stanley, B. (2009): The Hidden Frontier of Forest Degradation: A Review of the Science, Policy and Practice of Reducing Degradation Emissions. The Nature Conservancy.
• Höhne, N.; Elzen, den, M.; Weiss, M. (2006): Common but Differentiated Convergence (CDC): A New Conceptual Approach to Long-term Climate Policy. In: Climate Policy, 6/2, 181-199.
• IEA (annually updated-a): CO2 Emissions from Fuel Combustion. Paris.
• IEA (annually updated-b): World Energy Outlook. Paris.
• IEA (annually updated-c): World Energy Balances. Paris.
• IPCC (1997): Revised 1996 IPCC Guidelines for National Greenhouse Gas Inventories. www.ipcc-nggip.iges.or.jp/public/gl/invs1.html.
• IPCC (1999): Aviation and the Global Atmosphere. www.ipcc.ch/ipccreports/sres/aviation/in-dex.php?idp=0.
• IPCC (2018): IPCC special report on the impacts of global warming of 1.5°C - Summary for policy makers. Global Warming of 1.5°C. An IPCC Special Report on the impacts of global warming of 1.5°C above pre-industrial levels and related global greenhouse gas emission pathways, in the context of strengthening the global response to the threat of climate change: Intergovernmental Panel on Climate Change (IPCC). http://www.ipcc.ch/report/sr15/.
• Meinshausen, M.; Alexander, R. (2017): ‘NDC & INDC Factsheets | Climate and Energy College. Update October 2017. University of Melbourne.

CCPI Background and Methodology GERMANWATCH
24
• OECD (2012): The OECD Environmental Outlook to 2050. www.oecd.org/env/cc/Out-look%20to%202050_Climate%20Change%20Chapter_HIGLIGHTS-FINA-8pager-UP-DATED%20NOV2012.pdf.
• OECD (2018): GDP long-term forecast. https://data.oecd.org/gdp/gdp-long-term-fore-cast.htm
• UN (2019): World Population Prospects 2019. https://esa.un.org/unpd/wpp/.
• UNFCCC (2020): National Inventory Submissions 2020 https://unfccc.int/ghg-inventories-annex-i-parties/2020.
• UNFCCC (2020-b): Biennial Update Report submissions from Non-Annex I Parties. https://un-fccc.int/BURs.
• UNFCCC (2018-c): NDC Registry. https://www4.unfccc.int/sites/ndcstag-ing/Pages/LatestSubmissions.aspx.
• WWF; Ecofys; OMA (2011): The Energy Report: 100% Renewable Energy by 2050. www.ecofys.com/files/files/ecofys-wwf-2011-the-energy-report.pdf.

CCPI Background and Methodology GERMANWATCH
25
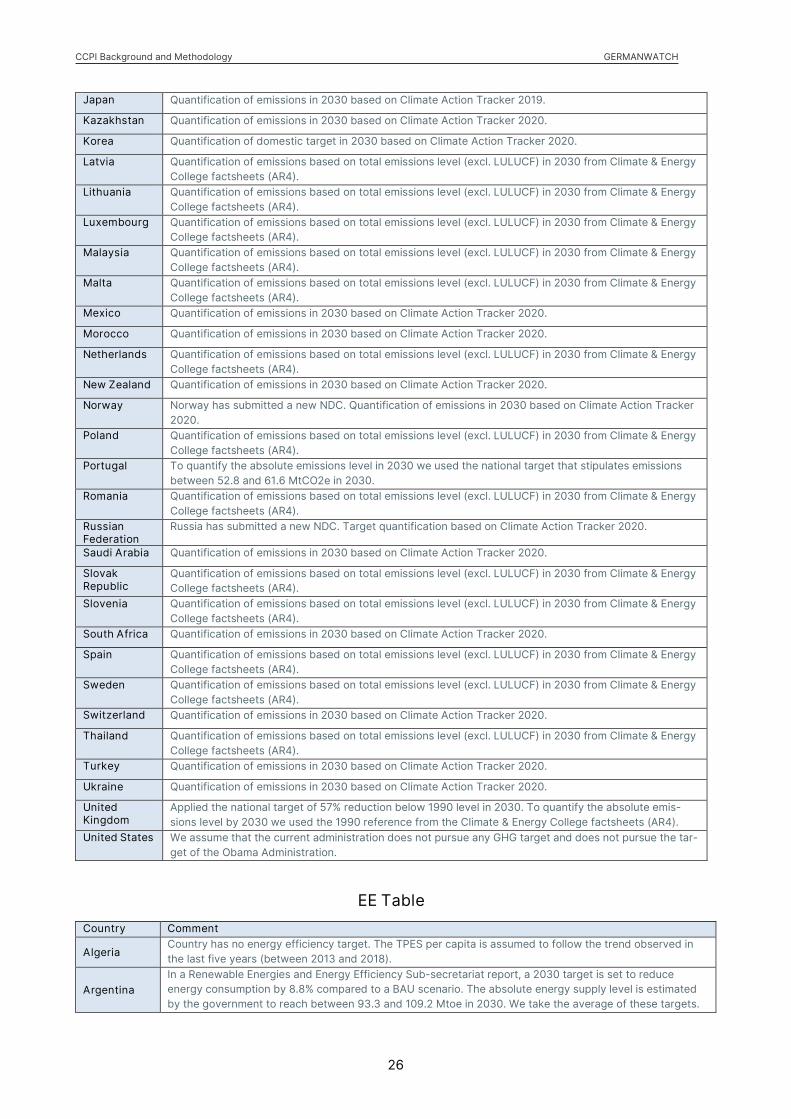
4 Annex GHG Table
Country Comment
Algeria Quantification of emissions based on total emissions level (excl. LULUCF) in 2030 from Climate & Energy College factsheets (AR4).
Argentina Quantification of emissions in 2030 based on Climate Action Tracker 2020.
Australia Quantification of emissions in 2030 based on Climate Action Tracker 2020.
Austria Quantification of emissions based on total emissions level (excl. LULUCF) in 2030 from Climate & Energy College factsheets (AR4).
Belarus Quantification of emissions based on total emissions level (excl. LULUCF) in 2030 from Climate & Energy College factsheets (AR4).
Belgium Quantification of emissions based on total emissions level (excl. LULUCF) in 2030 from Climate & Energy College factsheets (AR4).
Brazil In the case of Brazil, we consider both target and historical emissions including LULUCF due to the high contribution of the sector to total emissions. Quantification of emissions in 2030 based on NDC.
Bulgaria Quantification of emissions based on total emissions level (excl. LULUCF) in 2030 from Climate & Energy College factsheets (AR4).
Canada Quantification of emissions in 2030 based on Climate Action Tracker 2020.
Chile Quantification of emissions in 2030 based on Climate Action Tracker 2020. Chile is one of the few coun-tries to have submitted a new NDC in 2020.
China Quantification of emissions in 2030 based on Climate Action Tracker 2020.
Chinese Taipei
Chinese Taipei has a national target of 50% reduction below business-as-usual level of 428 MtCO2e in 2030.
Croatia Quantification of emissions based on total emissions level (excl. LULUCF) in 2030 from Climate & Energy College factsheets (AR4).
Cyprus Quantification of emissions based on total emissions level (excl. LULUCF) in 2030 from Climate & Energy College factsheets (AR4).
Czech Republic
Quantification of emissions based on total emissions level (excl. LULUCF) in 2030 from Climate & Energy College factsheets (AR4).
Denmark Quantification of emissions based on total emissions level (excl. LULUCF) in 2030 from Climate & Energy College factsheets (AR4).
Egypt Quantification of emissions based on total emissions level (excl. LULUCF) in 2030 from Climate & Energy College factsheets (AR4).
Estonia Quantification of emissions based on total emissions level (excl. LULUCF) in 2030 from Climate & Energy College factsheets (AR4).
European Union (28)
Under the European Climate Law, the EU proposed to reduce its GHG emissions by 60% below 1990 lev-els by 2030. However, to date the EU target is related to its NDC.
Finland Quantification of emissions based on total emissions level (excl. LULUCF) in 2030 from Climate & Energy College factsheets (AR4).
France The French national target is a 40% reduction below 1990 level in 2030. The quantification is based on the reference values presented in the Low Carbon Strategy.
Germany The German national target is a 55% reduction below 1990 level in 2030. The quantification is based on the 2030 total emissions level as presented in the Climate Action Plan.
Greece Quantification of emissions based on total emissions level (excl. LULUCF) in 2030 from Climate & Energy College factsheets (AR4).
Hungary Quantification of emissions based on total emissions level (excl. LULUCF) in 2030 from Climate & Energy College factsheets (AR4).
India Quantification of emissions in 2030 based on Climate Action Tracker 2020.
Indonesia Quantification of emissions in 2030 based on NDC. In the case of Indonesia, we consider both target and historical emissions including LULUCF due to the high contribution of the sector to total emissions.
Ireland Quantification of emissions based on total emissions level (excl. LULUCF) in 2030 from Climate & Energy College factsheets (AR4).
Islamic Republic of Iran
Quantification of emissions based on total emissions level (excl. LULUCF) in 2030 from Climate & Energy College factsheets (AR4).
Italy Quantification of emissions based on total emissions level (excl. LULUCF) in 2030 from Climate & Energy College factsheets (AR4).
CCPI Background and Methodology GERMANWATCH
26
Japan Quantification of emissions in 2030 based on Climate Action Tracker 2019.
Kazakhstan Quantification of emissions in 2030 based on Climate Action Tracker 2020.
Korea Quantification of domestic target in 2030 based on Climate Action Tracker 2020.
Latvia Quantification of emissions based on total emissions level (excl. LULUCF) in 2030 from Climate & Energy College factsheets (AR4).
Lithuania Quantification of emissions based on total emissions level (excl. LULUCF) in 2030 from Climate & Energy College factsheets (AR4).
Luxembourg Quantification of emissions based on total emissions level (excl. LULUCF) in 2030 from Climate & Energy College factsheets (AR4).
Malaysia Quantification of emissions based on total emissions level (excl. LULUCF) in 2030 from Climate & Energy College factsheets (AR4).
Malta Quantification of emissions based on total emissions level (excl. LULUCF) in 2030 from Climate & Energy College factsheets (AR4).
Mexico Quantification of emissions in 2030 based on Climate Action Tracker 2020.
Morocco Quantification of emissions in 2030 based on Climate Action Tracker 2020.
Netherlands Quantification of emissions based on total emissions level (excl. LULUCF) in 2030 from Climate & Energy College factsheets (AR4).
New Zealand Quantification of emissions in 2030 based on Climate Action Tracker 2020.
Norway Norway has submitted a new NDC. Quantification of emissions in 2030 based on Climate Action Tracker 2020.
Poland Quantification of emissions based on total emissions level (excl. LULUCF) in 2030 from Climate & Energy College factsheets (AR4).
Portugal To quantify the absolute emissions level in 2030 we used the national target that stipulates emissions between 52.8 and 61.6 MtCO2e in 2030.
Romania Quantification of emissions based on total emissions level (excl. LULUCF) in 2030 from Climate & Energy College factsheets (AR4).
Russian Federation
Russia has submitted a new NDC. Target quantification based on Climate Action Tracker 2020.
Saudi Arabia Quantification of emissions in 2030 based on Climate Action Tracker 2020.
Slovak Republic
Quantification of emissions based on total emissions level (excl. LULUCF) in 2030 from Climate & Energy College factsheets (AR4).
Slovenia Quantification of emissions based on total emissions level (excl. LULUCF) in 2030 from Climate & Energy College factsheets (AR4).
South Africa Quantification of emissions in 2030 based on Climate Action Tracker 2020.
Spain Quantification of emissions based on total emissions level (excl. LULUCF) in 2030 from Climate & Energy College factsheets (AR4).
Sweden Quantification of emissions based on total emissions level (excl. LULUCF) in 2030 from Climate & Energy College factsheets (AR4).
Switzerland Quantification of emissions in 2030 based on Climate Action Tracker 2020.
Thailand Quantification of emissions based on total emissions level (excl. LULUCF) in 2030 from Climate & Energy College factsheets (AR4).
Turkey Quantification of emissions in 2030 based on Climate Action Tracker 2020.
Ukraine Quantification of emissions in 2030 based on Climate Action Tracker 2020.
United Kingdom
Applied the national target of 57% reduction below 1990 level in 2030. To quantify the absolute emis-sions level by 2030 we used the 1990 reference from the Climate & Energy College factsheets (AR4).
United States We assume that the current administration does not pursue any GHG target and does not pursue the tar-get of the Obama Administration.
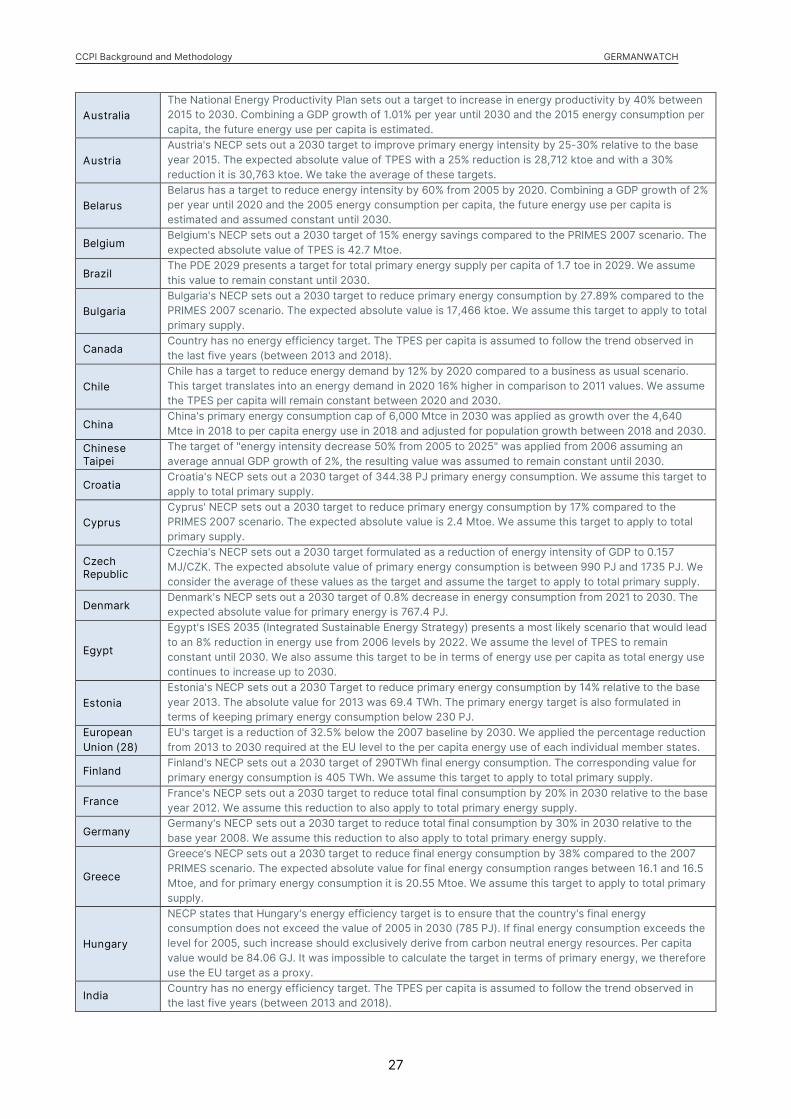
EE Table Country Comment Algeria
Country has no energy efficiency target. The TPES per capita is assumed to follow the trend observed in the last five years (between 2013 and 2018).
Argentina In a Renewable Energies and Energy Efficiency Sub-secretariat report, a 2030 target is set to reduce energy consumption by 8.8% compared to a BAU scenario. The absolute energy supply level is estimated by the government to reach between 93.3 and 109.2 Mtoe in 2030. We take the average of these targets.
CCPI Background and Methodology GERMANWATCH
27
Australia The National Energy Productivity Plan sets out a target to increase in energy productivity by 40% between 2015 to 2030. Combining a GDP growth of 1.01% per year until 2030 and the 2015 energy consumption per capita, the future energy use per capita is estimated.
Austria Austria's NECP sets out a 2030 target to improve primary energy intensity by 25-30% relative to the base year 2015. The expected absolute value of TPES with a 25% reduction is 28,712 ktoe and with a 30% reduction it is 30,763 ktoe. We take the average of these targets.
Belarus Belarus has a target to reduce energy intensity by 60% from 2005 by 2020. Combining a GDP growth of 2% per year until 2020 and the 2005 energy consumption per capita, the future energy use per capita is estimated and assumed constant until 2030.
Belgium Belgium's NECP sets out a 2030 target of 15% energy savings compared to the PRIMES 2007 scenario. The expected absolute value of TPES is 42.7 Mtoe.
Brazil The PDE 2029 presents a target for total primary energy supply per capita of 1.7 toe in 2029. We assume this value to remain constant until 2030.
Bulgaria Bulgaria's NECP sets out a 2030 target to reduce primary energy consumption by 27.89% compared to the PRIMES 2007 scenario. The expected absolute value is 17,466 ktoe. We assume this target to apply to total primary supply.
Canada Country has no energy efficiency target. The TPES per capita is assumed to follow the trend observed in the last five years (between 2013 and 2018).
Chile Chile has a target to reduce energy demand by 12% by 2020 compared to a business as usual scenario. This target translates into an energy demand in 2020 16% higher in comparison to 2011 values. We assume the TPES per capita will remain constant between 2020 and 2030.
China China's primary energy consumption cap of 6,000 Mtce in 2030 was applied as growth over the 4,640 Mtce in 2018 to per capita energy use in 2018 and adjusted for population growth between 2018 and 2030.
Chinese Taipei
The target of "energy intensity decrease 50% from 2005 to 2025" was applied from 2006 assuming an average annual GDP growth of 2%, the resulting value was assumed to remain constant until 2030.
Croatia Croatia's NECP sets out a 2030 target of 344.38 PJ primary energy consumption. We assume this target to apply to total primary supply.
Cyprus Cyprus' NECP sets out a 2030 target to reduce primary energy consumption by 17% compared to the PRIMES 2007 scenario. The expected absolute value is 2.4 Mtoe. We assume this target to apply to total primary supply.
Czech Republic
Czechia's NECP sets out a 2030 target formulated as a reduction of energy intensity of GDP to 0.157 MJ/CZK. The expected absolute value of primary energy consumption is between 990 PJ and 1735 PJ. We consider the average of these values as the target and assume the target to apply to total primary supply.
Denmark Denmark's NECP sets out a 2030 target of 0.8% decrease in energy consumption from 2021 to 2030. The expected absolute value for primary energy is 767.4 PJ.
Egypt
Egypt's ISES 2035 (Integrated Sustainable Energy Strategy) presents a most likely scenario that would lead to an 8% reduction in energy use from 2006 levels by 2022. We assume the level of TPES to remain constant until 2030. We also assume this target to be in terms of energy use per capita as total energy use continues to increase up to 2030.
Estonia Estonia's NECP sets out a 2030 Target to reduce primary energy consumption by 14% relative to the base year 2013. The absolute value for 2013 was 69.4 TWh. The primary energy target is also formulated in terms of keeping primary energy consumption below 230 PJ.
European Union (28)
EU's target is a reduction of 32.5% below the 2007 baseline by 2030. We applied the percentage reduction from 2013 to 2030 required at the EU level to the per capita energy use of each individual member states.
Finland Finland's NECP sets out a 2030 target of 290TWh final energy consumption. The corresponding value for primary energy consumption is 405 TWh. We assume this target to apply to total primary supply.
France France's NECP sets out a 2030 target to reduce total final consumption by 20% in 2030 relative to the base year 2012. We assume this reduction to also apply to total primary energy supply.
Germany Germany's NECP sets out a 2030 target to reduce total final consumption by 30% in 2030 relative to the base year 2008. We assume this reduction to also apply to total primary energy supply.
Greece
Greece’s NECP sets out a 2030 target to reduce final energy consumption by 38% compared to the 2007 PRIMES scenario. The expected absolute value for final energy consumption ranges between 16.1 and 16.5 Mtoe, and for primary energy consumption it is 20.55 Mtoe. We assume this target to apply to total primary supply.
Hungary
NECP states that Hungary's energy efficiency target is to ensure that the country's final energy consumption does not exceed the value of 2005 in 2030 (785 PJ). If final energy consumption exceeds the level for 2005, such increase should exclusively derive from carbon neutral energy resources. Per capita value would be 84.06 GJ. It was impossible to calculate the target in terms of primary energy, we therefore use the EU target as a proxy.
India Country has no energy efficiency target. The TPES per capita is assumed to follow the trend observed in the last five years (between 2013 and 2018).
CCPI Background and Methodology GERMANWATCH
28
Indonesia Target of Reduction of intensity of 1% per year between 2009-2025 is applied between 2009 and 2025 combined with a GDP growth of 3.76% per year. Between 2025 and 2030 no further reduction is assumed, and the emission intensity grows proportional to the GDP.
Ireland EU's target is a reduction of 32.5% below the 2007 baseline by 2030. We applied the percentage reduction from 2013 to 2030 required at the EU level to the per capita energy use of each individual member states. Ireland's NECP sets out to contribute to the EU target without setting a country target.
Islamic Republic of Iran
Target to reduce energy intensity by 50% from 2010 to 2020. Combining a GDP growth of 2.97% per year until 2020 and the 2010 energy consumption per capita, the future energy use per capita is estimated and assumed constant until 2030.
Italy Italy’s NECP sets out a 2030 target to reduce primary energy consumption by 43% compared to the 2007 PRIMES scenario. The expected absolute value for primary energy consumption is 158 Mtoe. We assume this target to apply to total primary supply.
Japan Japan's Energy Outlook projects its 2030 energy demand to be 9.69% below 2013 levels due to energy efficiency improvements.
Kazakhstan Target of reducing energy intensity of GDP by 30% until 2030 compared to 2008 levels. Assumed an annual average GDP growth rate of 1.5% from 2010 to 2030.
Korea
The South Korean energy efficiency target is given as reduction of final energy consumption by 13% from relative to a scenario value by 2035. Combining a GDP growth of 2.47% per year until 2030 and the 2015 energy consumption per capita, the future energy use per capita is estimated. 2030 value is linearly interpolated.
Latvia Latvia's NECP sets out a 2030 target of cumulative final energy savings of 1.76 Mtoe in the period 2021-2030. The expected absolute value of primary energy consumption ranges between 165 and 170 PJ. We assume this target to apply to total primary supply.
Lithuania Lithuania's NECP sets out a 2030 target of achieving a 1.5 times reduction of energy intensity below 2017 levels. The expected absolute value of primary energy consumption is 5461 ktoe. We assume this target to apply to total primary supply.
Luxembourg
Luxembourg's NECP sets out a 2030 target of 40-44% compared to the PRIMES 2007 scenario. In the absence of a baseline or target in terms of primary energy consumption we use the EU target instead. EU's target is a reduction of 32.5% below the 2007 baseline by 2030. We applied the percentage reduction from 2013 to 2030 required at the EU level to the per capita energy use of each individual member states.
Malaysia We could not quantify the country's National Energy Efficiency Action Plan 2016-2025 which sets a target for electricity of 8% against a BAU scenario in terms of primary energy. The TPES per capita is assumed to follow the trend observed in the last five years (between 2013 and 2018).
Malta
Malta's NECP sets a target of new savings each year from 1 January 2021 to 31 December 2030 equivalent to 0.24% of annual final energy consumption averaged over the most recent three-year period prior to 1 January 2019. The expected absolute values of primary energy and final energy consumption are 1051 ktoe and 786 ktoe respectively. We assume this target to apply to total primary supply.
Mexico Mexico's Transition Strategy to Promote the use of Cleaner Fuels and Technologies sets out a target of 2.2% annual improvement in final energy consumption from 2020 to 2035, compared to a BAU scenario. The expected absolute value of final energy consumption is 5363 PJ in 2030.
Morocco Target of "reducing energy consumption by 15% by 2030" was evaluated as a reduction below an increase in energy consumption that follows the GDP growth.
Netherlands
The Netherland's NECP sets out a target of cumulative energy savings in the 2021-2030 period based on 0.8 % savings per year of average final energy consumption in the years 2016, 2017 and 2018 (the reference consumption). The expected absolute value of primary energy consumption is 1950 PJ. We assume this target to apply to total primary supply.
New Zealand Country has no energy efficiency target. The TPES per capita is assumed to follow the trend observed in the last five years (between 2013 and 2018).
Norway Norway's White Paper on energy policy sets out a 2030 target of reducing energy intensity (energy consumption/GDP) by 30% by 2030 compared to 2016.
Poland Poland's NECP sets out a 2030 target of improving primary energy consumption by 23% compared to the PRIMES 2007 scenario. The expected absolute value for primary energy consumption is 91.3 Mtoe. We assume this target to apply to total primary supply.
Portugal Portugal's NECP sets out a 2030 target of improving primary energy consumption by 35% compared to the PRIMES 2007 scenario. The expected absolute value for primary energy consumption ranges between 15.6 and 21.5 Mtoe. We assume this target to apply to total primary supply.
Romania
Country's NECP sets EE target of 45.1% decrease in energy consumption based on PRIMES 2007 scenario. Primary energy consumption target is 32.3 Mtoe and final energy consumption is 25.7 Mtoe. PRIMES 2007 scenario values are 58.7 Mtoe primary energy and 43.2 Mtoe final energy. We assume this target to apply to total primary supply.
Russian Federation
The Russian Federation has a target to reduce energy intensity by 40% between 2007 and 2020. Combining a GDP growth of 0.06% per year until 2020 and the 2007 energy consumption per capita, the future energy use per capita is estimated and assumed constant until 2030.

CCPI Background and Methodology GERMANWATCH
29
Saudi Arabia Country has no energy efficiency target. The TPES per capita is assumed to follow the trend observed in the last five years (between 2013 and 2018).
Slovak Republic
Slovakia's NECP sets out a 2030 target of improving primary energy consumption between 28.36 and 30.32% compared to the PRIMES 2007 scenario. The expected absolute value for primary energy consumption ranges between 15.7 and 16.5 Mtoe. We consider the average of these values as the target and we assume it to apply to total primary supply.
Slovenia Slovenia's NECP sets out a 2030 target of improving primary energy consumption by 35% compared to the PRIMES 2007 scenario. The expected absolute value for primary energy consumption is 6356 ktoe. We assume this target to apply to total primary supply.
South Africa
The Post-2015 National Energy Efficiency Plan Draft Includes a target of 29% reduction in final energy consumption to be achieved in 2030 below 2015 levels. Even though the legislation is mentioned in many policy documents, it has to date not been adopted. We therefore consider that South Africa has no energy efficiency target for the year 2030. Furthermore, the target is in terms of final energy consumption, instead of primary energy. The TPES per capita is assumed to follow the trend observed in the last five years (between 2013 and 2018).
Spain Spain's NECP sets out a 2030 target of improving primary energy consumption by 39.5% compared to the PRIMES 2007 scenario. The expected absolute value for primary energy consumption is 98.5 Mtoe. We assume this target to apply to total primary supply.
Sweden
Sweden's NECP sets out a 2030 target of 50% improvement in energy efficiency compared to 2005. This target is also expressed as energy supplied (primary energy) in relation to real GDP. Assuming the economy grows at 2% a year, the primary energy consumption on meeting the target in 2030 will be 461 TWh and the final energy consumption will be 339 TWh. 2007 PRIMES scenario values for primary and final energy are 516 TWh and 384 TWh.
Switzerland Target to reduce average per capita energy consumption by 43% below 2000 values in 2035 was applied and then a linear interpolation was used to obtain the 2030 approximate value.
Thailand Target of 30% reduction in energy intensity (energy per unit GDP) by 2036, as compared to 2010 was applied assuming a linear interpolation between 2030 and 2036 and an annual growth rate of GDP of 2.7%.
Turkey The Turkish target given as energy intensity reduction of 20% from 2008 to 2023 was converted into an energy use per capita by combining it with GDP forecasts. The value for 2023 was assumed to remain constant until 2030.
Ukraine The target of "energy intensity reduction of 50% by 2030" was applied to 2013 assuming the average annual GDP growth of the past 5 years.
United Kingdom
The British target given in TPES of 177.6 MTOE which is similar to current levels. Energy intensity was assumed to remain at 2015 values.
United States
We assume that the current administration does not support any energy efficiency target and does not pursue the target of the Obama Administration to double U.S. energy productivity over 2010 levels by 2030.
RE Table Country Comment
Algeria
Target of 27% share of renewable electricity by 2030 was translated to renewables share in TPES assuming renewables input increases proportionally to share in electricity production and that replacing fossil electricity reduces TPES by a factor one to two (approximately 1kWh from renewables instead of 1kWh coal (produced with efficiency 1 to 3) reduces TPES by (-3+1) kWh).
Argentina
Target of 20% share of renewable electricity by 2025 was combined with current share of large hydro power, which is assumed to follow the scenarios from the Energy Secretariat, and translated to renewables share in TPES assuming renewables input increases proportionally to share in electricity production and that replacing fossil electricity reduces TPES by a factor one to two (approximately 1kWh from renewables instead of 1kWh coal (produced with efficiency 1 to 3) reduces TPES by (-3+1) kWh). Share is assumed to remain constant from 2025 and 2030.
Australia Australia does not have a national target. We therefore assume no target. We recognize national projections lead to 48% renewable electricity in 2030. These projections would result in a share of TPES in the range 13% according to our estimates. However, these figures are driven by sub-national targets.
Austria
The EU's target is 32% in gross final energy demand, which is 15 percentage points above the 2015 level. We applied this 15 percentage-point increase to each member state's 2015 level. Many EU member states present targets in their NCEPs, these targets have not been quantified due to insufficient data for the con-version between final energy consumption and total primary energy supply for all countries.
Belarus No quantifiable national target.
Belgium The EU's target is 32% in gross final energy demand, which is 15 percentage points above the 2015 level. We applied this 15 percentage-point increase to each member state's 2015 level. Many EU member states
CCPI Background and Methodology GERMANWATCH
30
present targets in their NCEPs, these targets have not been quantified due to insufficient data for the con-version between final energy consumption and total primary energy supply for all countries.
Brazil The NDC document presents a target of 45% share in TPES by 2030, and the new Ten-Year Energy Expan-sion Plan (PDE 2029) projects 48% by 2029. We take the NDC figures as the official targets.
Bulgaria
The EU's target is 32% in gross final energy demand, which is 15 percentage points above the 2015 level. We applied this 15 percentage-point increase to each member state's 2015 level. Many EU member states present targets in their NCEPs, these targets have not been quantified due to insufficient data for the con-version between final energy consumption and total primary energy supply for all countries.
Canada No quantifiable national target.
Chile
Target of at least 60% share of renewable electricity by 2035 was translated to renewables share in TPES in 2030 assuming renewables input increases proportionally to share in electricity production and that replacing fossil electricity reduces TPES by a factor one to two (approximately 1kWh from renewables instead of 1kWh coal (produced with efficiency 1 to 3) reduces TPES by (-3+1) kWh).
China China has a target of 20% non-fossil share in total primary energy supply by 2030. We quantify renewable share using the average value of current policy projections presented in the Climate Action Tracker as a proxy to exclude non-renewable sources.
Chinese Tai-pei
Target of 20% share of renewable electricity by 2025 was translated to renewables share in TPES in 2030 assuming renewables input increases proportionally to share in electricity production and that replacing fossil electricity reduces TPES by a factor one to two (approximately 1kWh from renewables instead of 1kWh coal (produced with efficiency 1 to 3) reduces TPES by (-3+1) kWh).
Croatia
The EU's target is 32% in gross final energy demand, which is 15 percentage points above the 2015 level. We applied this 15 percentage-point increase to each member state's 2015 level. Many EU member states present targets in their NCEPs, these targets have not been quantified due to insufficient data for the con-version between final energy consumption and total primary energy supply for all countries.
Cyprus
The EU's target is 32% in gross final energy demand, which is 15 percentage points above the 2015 level. We applied this 15 percentage-point increase to each member state's 2015 level. Many EU member states present targets in their NCEPs, these targets have not been quantified due to insufficient data for the con-version between final energy consumption and total primary energy supply for all countries.
Czech Republic
The EU's target is 32% in gross final energy demand, which is 15 percentage points above the 2015 level. We applied this 15 percentage-point increase to each member state's 2015 level. Many EU member states present targets in their NCEPs, these targets have not been quantified due to insufficient data for the con-version between final energy consumption and total primary energy supply for all countries.
Denmark
The EU's target is 32% in gross final energy demand, which is 15 percentage points above the 2015 level. We applied this 15 percentage-point increase to each member state's 2015 level. Many EU member states present targets in their NCEPs, these targets have not been quantified due to insufficient data for the con-version between final energy consumption and total primary energy supply for all countries.
Egypt Egypt’s Vision 2030 sets out a 2030 target of 12% share of RE in primary energy.
Estonia
The EU's target is 32% in gross final energy demand, which is 15 percentage points above the 2015 level. We applied this 15 percentage-point increase to each member state's 2015 level. Many EU member states present targets in their NCEPs, these targets have not been quantified due to insufficient data for the con-version between final energy consumption and total primary energy supply for all countries.
European Union (28)
The EU's target is 32% in gross final energy demand, which is 15 percentage points above the 2015 level. We applied this 15 percentage-point increase to each member state's 2015 level. Many EU member states present targets in their NCEPs, these targets have not been quantified due to insufficient data for the con-version between final energy consumption and total primary energy supply for all countries.
Finland
The EU's target is 32% in gross final energy demand, which is 15 percentage points above the 2015 level. We applied this 15 percentage-point increase to each member state's 2015 level. Many EU member states present targets in their NCEPs, these targets have not been quantified due to insufficient data for the con-version between final energy consumption and total primary energy supply for all countries.
France
Target of 40% share of renewable electricity by 2030, incl. hydro, was translated to renewables share in TPES assuming renewables input increases proportionally to share in electricity production and that replac-ing fossil electricity reduces TPES by a factor one to two (approximately 1kWh from renewables instead of 1kWh coal (produced with efficiency 1 to 3) reduces TPES by (-3+1) kWh).
Germany
Target of 65% share of renewable electricity by 2030, incl. hydro, was translated to renewables share in TPES assuming renewables input increases proportionally to share in electricity production and that replac-ing fossil electricity reduces TPES by a factor one to two (approximately 1kWh from renewables instead of 1kWh coal (produced with efficiency 1 to 3) reduces TPES by (-3+1) kWh).
Greece
The EU's target is 32% in gross final energy demand, which is 15 percentage points above the 2015 level. We applied this 15 percentage-point increase to each member state's 2015 level. Many EU member states present targets in their NCEPs, these targets have not been quantified due to insufficient data for the con-version between final energy consumption and total primary energy supply for all countries.

CCPI Background and Methodology GERMANWATCH
31
Hungary
The EU's target is 32% in gross final energy demand, which is 15 percentage points above the 2015 level. We applied this 15 percentage-point increase to each member state's 2015 level. Many EU member states present targets in their NCEPs, these targets have not been quantified due to insufficient data for the con-version between final energy consumption and total primary energy supply for all countries.
India
The expected renewable installed capacity and power generation under the current policy scenario of the WEO 2018 was translated to renewables share in TPES assuming renewables input increases proportionally to share in electricity production and that replacing fossil electricity reduces TPES by a factor one to two (approximately 1kWh from renewables instead of 1kWh coal (produced with efficiency 1 to 3) reduces TPES by (-3+1) kWh). Share is assumed to remain constant from 2026 and 2030.
Indonesia Target of 23% of Total Primary Energy Supply by 2025. Share is assumed to remain constant until 2030.
Ireland
The EU's target is 32% in gross final energy demand, which is 15 percentage points above the 2015 level. We applied this 15 percentage-point increase to each member state's 2015 level. Many EU member states present targets in their NCEPs, these targets have not been quantified due to insufficient data for the con-version between final energy consumption and total primary energy supply for all countries.
Islamic Republic of Iran
Target of 5GW renewable power (excl. hydro) installed by 2020 is translated into 8% renewable electricity, adding a third of capacity (5 GW) and share to the currently 10 GW hydro / 5% share in electricity produc-tion. This was translated to renewables share in TPES assuming renewables input increases proportionally to share in electricity production and that replacing fossil electricity reduces TPES by a factor one to two (approximately 1kWh from renewables instead of 1kWh coal (produced with efficiency 1 to 3) reduces TPES by (-3+1) kWh).
Italy
Target of 55% share of renewable electricity by 2030, incl. hydro, was translated to renewables share in TPES assuming renewables input increases proportionally to share in electricity production and that replac-ing fossil electricity reduces TPES by a factor one to two (approximately 1kWh from renewables instead of 1kWh coal (produced with efficiency 1 to 3) reduces TPES by (-3+1) kWh).
Japan
The long-term electricity demand and supply outlook (i.e. energy mix target underlying the NDC) presents a target for TPES of 13-14%. The 2030 electricity mix assumed in Japan’s NDC is based on the 2015 Long-Term Energy Demand and Supply Outlook that foresees 20–22% of electricity being supplied by nuclear energy, 22–24% by renewable energy and the remaining 56% by fossil fuel sources. The electricity targets are not considered individually in the index calculation.
Kazakhstan
Target of 30% share of alternative and renewable electricity by 2030 was translated to renewables share in TPES assuming renewables input increases proportionally to share in electricity production and that replac-ing fossil electricity reduces TPES by a factor one to two (approximately 1kWh from renewables instead of 1kWh coal (produced with efficiency 1 to 3) reduces TPES by (-3+1) kWh). We assume the share of nuclear energy to remain zero.
Korea
Target of 20% share of renewable electricity by 2030, incl. hydro, was translated to renewables share in TPES assuming renewables input increases proportionally to share in electricity production and that replac-ing fossil electricity reduces TPES by a factor one to two (approximately 1kWh from renewables instead of 1kWh coal (produced with efficiency 1 to 3) reduces TPES by (-3+1) kWh). Share is assumed to remain constant until 2030.
Latvia
The EU's target is 32% in gross final energy demand, which is 15 percentage points above the 2015 level. We applied this 15 percentage-point increase to each member state's 2015 level. Many EU member states present targets in their NCEPs, these targets have not been quantified due to insufficient data for the con-version between final energy consumption and total primary energy supply for all countries.
Lithuania
The EU's target is 32% in gross final energy demand, which is 15 percentage points above the 2015 level. We applied this 15 percentage-point increase to each member state's 2015 level. Many EU member states present targets in their NCEPs, these targets have not been quantified due to insufficient data for the con-version between final energy consumption and total primary energy supply for all countries.
Luxembourg
The EU's target is 32% in gross final energy demand, which is 15 percentage points above the 2015 level. We applied this 15 percentage-point increase to each member state's 2015 level. Many EU member states present targets in their NCEPs, these targets have not been quantified due to insufficient data for the con-version between final energy consumption and total primary energy supply for all countries.
Malaysia
Target of 20% share of renewable electricity by 2030 was translated to renewables share in TPES assum-ing renewables input increases proportionally to share in electricity production and that replacing fossil electricity reduces TPES by a factor one to two (approximately 1kWh from renewables instead of 1kWh coal (produced with efficiency 1 to 3) reduces TPES by (-3+1) kWh).
Malta
The EU's target is 32% in gross final energy demand, which is 15 percentage points above the 2015 level. We applied this 15 percentage-point increase to each member state's 2015 level. Many EU member states present targets in their NCEPs, these targets have not been quantified due to insufficient data for the con-version between final energy consumption and total primary energy supply for all countries.
Mexico
No quantifiable national target. The Revised Energy Transition Law, published in February 2020, includes clean energy targets for Mexico for the year 2033 (39,9% of electricity generation) and 2050 (50%). Clean energy according to Mexican law includes renewable energy sources, nuclear power, CCS as well as effi-cient cogeneration.
CCPI Background and Methodology GERMANWATCH
32
Morocco
Target of 52 % of installed electricity production capacity from renewable sources by 2030 was translated into 35% share of renewables assuming factor 1.5 for capacity of the renewables over average production. This was translated to renewables share in TPES assuming renewables input increases proportionally to share in electricity production and that replacing fossil electricity reduces TPES by a factor one to two (ap-proximately 1kWh from renewables instead of 1kWh coal (produced with efficiency 1 to 3) reduces TPES by (-3+1) kWh).
Netherlands
The EU's target is 32% in gross final energy demand, which is 15 percentage points above the 2015 level. We applied this 15 percentage-point increase to each member state's 2015 level. Many EU member states present targets in their NCEPs, these targets have not been quantified due to insufficient data for the con-version between final energy consumption and total primary energy supply for all countries.
New Zealand
Target of 90% share of renewable electricity by 2025 was translated to renewables share in TPES in 2030 assuming renewables input increases proportionally to share in electricity production and that replacing fossil electricity reduces TPES by a factor one to two (approximately 1kWh from renewables instead of 1kWh coal (produced with efficiency 1 to 3) reduces TPES by (-3+1) kWh).
Norway Target of 67.5% share of renewable in gross final energy consumption in 2020 was assumed to apply for TPES.
Poland
The EU's target is 32% in gross final energy demand, which is 15 percentage points above the 2015 level. We applied this 15 percentage-point increase to each member state's 2015 level. Many EU member states present targets in their NCEPs, these targets have not been quantified due to insufficient data for the con-version between final energy consumption and total primary energy supply for all countries.
Portugal
The EU's target is 32% in gross final energy demand, which is 15 percentage points above the 2015 level. We applied this 15 percentage-point increase to each member state's 2015 level. Many EU member states present targets in their NCEPs, these targets have not been quantified due to insufficient data for the con-version between final energy consumption and total primary energy supply for all countries.
Romania
The EU's target is 32% in gross final energy demand, which is 15 percentage points above the 2015 level. We applied this 15 percentage-point increase to each member state's 2015 level. Many EU member states present targets in their NCEPs, these targets have not been quantified due to insufficient data for the con-version between final energy consumption and total primary energy supply for all countries.
Russian Federation
Target of 4.5% share of renewable electricity by 2024 was combined with current share of large hydro power, which is assumed to remain constant, and translated to renewables share in TPES assuming renew-ables input increases proportionally to share in electricity production and that replacing fossil electricity reduces TPES by a factor one to two (approximately 1kWh from renewables instead of 1kWh coal (pro-duced with efficiency 1 to 3) reduces TPES by (-3+1) kWh). Share is assumed to remain constant from 2025 and 2030. Share is assumed to remain constant until 2030.
Saudi Arabia
In early 2019, the Ministry of Energy announced an updated “Vision 2030” renewable energy target of 27.3 GW by 2023 and 57.8 GW by 2030. Considering the uncertainty associated with a installed capacity target and the changes in the target seen in the previous years we assume the share of renewables in TPES will remain 1% up to 2030.
Slovak Republic
The EU's target is 32% in gross final energy demand, which is 15 percentage points above the 2015 level. We applied this 15 percentage-point increase to each member state's 2015 level. Many EU member states present targets in their NCEPs, these targets have not been quantified due to insufficient data for the con-version between final energy consumption and total primary energy supply for all countries.
Slovenia
The EU's target is 32% in gross final energy demand, which is 15 percentage points above the 2015 level. We applied this 15 percentage-point increase to each member state's 2015 level. Many EU member states present targets in their NCEPs, these targets have not been quantified due to insufficient data for the con-version between final energy consumption and total primary energy supply for all countries.
South Africa
The power generation share from the Integrated Resource Electricity Plan (IRP) published in 2019 was translated to renewables share in TPES assuming renewables input increases proportionally to share in electricity production and that replacing fossil electricity reduces TPES by a factor one to two (approxi-mately 1kWh from renewables instead of 1kWh coal (produced with efficiency 1 to 3) reduces TPES by (-3+1) kWh).
Spain
The EU's target is 32% in gross final energy demand, which is 15 percentage points above the 2015 level. We applied this 15 percentage-point increase to each member state's 2015 level. Many EU member states present targets in their NCEPs, these targets have not been quantified due to insufficient data for the con-version between final energy consumption and total primary energy supply for all countries.
Sweden
The EU's target is 32% in gross final energy demand, which is 15 percentage points above the 2015 level. We applied this 15 percentage-point increase to each member state's 2015 level. Many EU member states present targets in their NCEPs, these targets have not been quantified due to insufficient data for the con-version between final energy consumption and total primary energy supply for all countries.
Switzerland Target of increasing renewable electricity from non-hydro sources to 11,400 GWh and hydro up to 37,400 GWh in 2035, was translated into share in electricity generation. The share was linearly interpolated be-tween 2016 values and 2035. The electricity share was converted to renewables share in TPES assuming
CCPI Background and Methodology GERMANWATCH
33
renewables input increases proportionally to share in electricity production and that replacing fossil elec-tricity reduces TPES by a factor one to two (approximately 1kWh from renewables instead of 1kWh coal (produced with efficiency 1 to 3) reduces TPES by (-3+1) kWh).
Thailand The Alternative Energy Development Plan (AEDP2015) sets a 2036 target of 30% RE share in final energy consumption.
Turkey
Target of 38% share of renewable electricity by 2023 was translated to renewables share in TPES assum-ing renewables input increases proportionally to share in electricity production and that replacing fossil electricity reduces TPES by a factor one to two (approximately 1kWh from renewables instead of 1kWh coal (produced with efficiency 1 to 3) reduces TPES by (-3+1) kWh). Share is assumed to remain constant until 2030.
Ukraine Ukraine has a 2030 target of 18% RE share in primary energy.
United Kingdom
Target of 30% share of renewable electricity by 2020, incl. hydro, was translated to renewables share in TPES assuming renewables input increases proportionally to share in electricity production and that replac-ing fossil electricity reduces TPES by a factor one to two (approximately 1kWh from renewables instead of 1kWh coal (produced with efficiency 1 to 3) reduces TPES by (-3+1) kWh). Share is assumed to remain constant until 2030.
United States
We assume that the current administration does not pursue any of the renewable energy targets that were set by the Obama Administration.
Legend for general assumptions used for many countries:
a) The share of electric energy remains constant in the total final consumption.
b) The average efficiencies of transforming primary energy into secondary energy (before losses and energy industry own use) remain constant for
energy from renewable and from fossil sources with respect to today.
c) The "energy industry own use" is distributed between the electric and non-electric energy sector according to the share they hold in the TPES – in
both sectors renewable energy generation is assumed not to consume any energy for energy generation.
d) Within the non-electric sector, the share of renewable energy remains constant in TPES and TFC respectively.
e) The share of renewable energy in the final consumption of electricity is the same as the share of renewable energy in electricity generation, i.e.
losses affect equally electricity from renewable and fossil sources.
GermanwatchFollowing the motto of Observing. Analysing. Acting. Germanwatch has been actively promoting global equi-ty and liveli-hood preservation since 1991. We focus on the politics and economics of the Global North and their worldwide consequences. The situation of marginalised people in the Global South is the starting point for our work. Together with our members and supporters, and with other actors in civil society, we strive to serve as a strong lobbying force for sustainable development. We aim at our goals by advocating for prevention of dangerous climate change and its negative impacts, for guaranteeing food security, and for corporate compliance with human rights standards.
Germanwatch is funded by membership fees, donations, programme funding from Stiftung Zukunftsfaehigkeit (Foundation for Sustainability), and grants from public and private donors.
You can also help us to achieve our goals by becoming a member or by making a donation via the following account:
Bank fuer Sozialwirtschaft AG BIC/Swift: BFSWDE33BER IBAN: DE33 1002 0500 0003 2123 00
www.germanwatch.org
NewClimate InstituteThe NewClimate Institute for Climate Policy and Global Sustainability is a Germany-based research institute gen-erating ideas on climate change and driving their imple-mentation. They do research, policy design and know-ledge sharing on raising ambition for action against climate change and supporting sustainable development. Their core expertise lies in the areas of climate policy analysis, climate action tracking, climate finance, carbon markets, and sustainable energy.
www.newclimate.org
Climate Action NetworkCAN members work to achieve this goal through informa-tion exchange and the coordinated development of NGO strategy on international, regional, and national climate issues. CAN has regional network hubs that coordinate these eff orts around the world.
CAN members place a high priority on both a healthy en-vironment and development that “meets the needs of the present without compromising the ability of future genera-tions to meet their own needs” (Brundtland Commission). CAN’s vision is to protect the atmosphere while allowing.
www.climatenetwork.org


