38


Cost and Cost Savings of the RPS Program
A digital copy of this report can be found at:
https://www.cpuc.ca.gov/RPS_Reports_Data/
Thanks to:
Amanda Singh – Analyst
Mallory Albright – Analyst
Cheryl Lee – Supervisor, Renewable Procurement and Market Development Section
Judith Iklé – Program Manager, Procurement Strategy and Oversight, Energy Division

Cost and Cost Savings of the RPS Program

Cost and Cost Savings of the RPS Program
About this Report
The purpose of this annual Report is to comply with Public Utilities Code § 913.3. Each May 1, the California Public Utilities Commission is required to report to the
Legislature the aggregated costs and cost savings of renewable energy expenditures and contracts for the
previous year.
Cost and Cost Savings of the RPS Program
TABLE OF CONTENTS 1. EXECUTIVE SUMMARY .... . . . . . . . . . . . . . . . . . . . . . . . . . . . . . . . . . . . . . . . . . . . . . . . . . . . . . . . . . . . . . . . . . . . . . 1
2. BACKGROUND ..... . . . . . . . . . . . . . . . . . . . . . . . . . . . . . . . . . . . . . . . . . . . . . . . . . . . . . . . . . . . . . . . . . . . . . . . . . . . . . . 3
3. RENEWABLES PROGRAM COSTS .... . . . . . . . . . . . . . . . . . . . . . . . . . . . . . . . . . . . . . . . . . . . . . . . . . . . . . . 4 A. RPS Procurement Expenditures .......................................................................... 5 B. Comparison of RPS Procurement Expenditures to Revenue Requirements ..... 11 C. RPS Aggregated Contract Prices ..................................................................... 13
4. RENEWABLES PROGRAM COST PREMIUMS AND/OR SAVINGS ..... . . . . . . . . 17 A. Large Investor-Owned Utilities’ Cost Premiums / Savings .............................. 18 B. Small and Multi-Jurisdictional Investor-Owned Utilities’ Cost Premiums / Savings…… 19
5. APPENDICES .. ... . . . . . . . . . . . . . . . . . . . . . . . . . . . . . . . . . . . . . . . . . . . . . . . . . . . . . . . . . . . . . . . . . . . . . . . . . . . . . . . 20 Appendix A: California Public Utilities Commission RPS Activities and Milestones…20 Appendix B: RPS Procurement Expenditures per Public Utilities Code § 913.3 .... 22 Appendix C: Contract Price Data per Senate Bill 836 (Public Utilities Code § 913.3)….. 27 Appendix D: Public Utilities Code § 913.3(a)–(d) ................................................. 31 Appendix E: California’s Load Serving Entities Operating in 2020 ....................... 32

Cost and Cost Savings of the RPS Program
Index of Tables & Figures Table 1: Small and Multi-Jurisdiction Investor-Owned Utilities’ Total RPS Expenditures in 2020 ……… 8
Table 2: Comparison of Community Choice Aggregator RPS Procurement and Procurement Expenditures between 2019 and 2020 …………………………………....…………………………… 10
Table 3: Comparison of Electric Service Provider RPS Procurement and Procurement Expenditures between 2019 and 2020 …………………………………....…………………………………..……… 10
Table 4: Comparison of Large Investor-Owned Utilities’ RPS Procurement to Revenue Requirements
in 2020 ………………………………………………………………………………………………… 11
Table 5: Large Investor-Owned Utilities’ 2020 BioMAT Procurement Summary ……………….……... 15
Table 6: Community Choice Aggregator Procurement Summary of Facilities 3 MW or Less ………….. 16
Table 7: Large Investor-Owned Utilities’ 2020 Average Non-RPS Eligible Procurement Expenditure.... 18
Table 8: Large Investor-Owned Utilities’ 2020 RPS Cost Savings: Non-RPS Eligible Comparison .......... 18
Table 9: Small and Multi-Jurisdictional Investor-Owned Utilities’ 2020 Average Non-RPS Eligible Procurement Expenditure ……………………………………………………………………….…….. 19
Table 10: Small and Multi-Jurisdictional Investor-Owned Utilities’ 2020 RPS Cost Savings: Non-RPS Eligible Comparison …………………………………………………………………………….……... 19
Figure 1: Weighted Average RPS Procurement Expenditures of Investor-Owned Utilities’ Bundled Renewable Energy from 2003-2025 ……………………………………………………………………... 6
Figure 2: RPS Program Expenditures and Contract Costs from 2003-2025 …………………………….. 7
Figure 3: Historical Trend of All Load Serving Entities’ RPS Contract Costs by Technology and Year
of Execution from 2003-2025 …………………………………………………………………………. 14

1. Executive Summary In compliance with Public Utilities Code § 913.3,1 this report summarizes 2020 Renewables Portfolio Standard (RPS) program procurement expenditure and contract cost data. In 2020, RPS procurement expenditures increased for all load-serving entities on a per gigawatt-hour basis, with the exception of
the small and multi-jurisdictional utilities (SMJUs).2 Because it generally takes several years after contract execution for RPS procurement expenditures to occur, as less expensive contracts start delivering energy and more expensive contracts begin to expire, overall expenditures are expected to trend downward. However, contract costs increased from 2019 to 2020 due to increased procurement of more diverse technologies.
Key conclusions from this report include the following:
The large investor-owned utilities’ (IOUs) total annual RPS procurement expenditures increased slightly from $5.4 billion in 2019 to $5.5 billion in 2020 while increasing total renewables generation from 51,599 GWh to 53,366 GWh, resulting in a 2020 RPS percentage of retail load of 43%. This reflects an increase in renewables expenditures on a per GWh basis.
For small and multi-jurisdictional utilities (SMJUs), total annual RPS procurement expenditures increased from $14.1 million in 2019 to $21.7 million in 2020 while total renewables generation increased from 328 GWh to 540 GWh, resulting in a 2020 RPS percentage of retail load of 29%. This reflects a decrease in renewables expenditures on a per GWh basis.
Community choice aggregators’ (CCAs) total annual RPS procurement expenditures increased from $385 million in 2019 to $491 million in 2020 while renewables generation increased from 19,593 GWh in 2019 to 23,928 GWh in 2020, resulting in a 2020 RPS percentage of retail load of 41%. This reflects a slight increase in renewables expenditures on a per GWh basis.
1 The full text of California Public Utilities Code (hereinafter Pub. Util. Code) § 913.3 can be found in Appendix D.
2 This report addresses 2020 RPS expenditures and contract prices for Community Choice Aggregators (CCAs) and Electric Service Providers (ESPs) in 2020, but it does not address their RPS compliance. This report does not address Publicly Owned Utilities (POUs) as compliance for the POUs is determined by the California Energy Commission (CEC). See the CEC’s RPS page: https://www.energy.ca.gov/programs-and-topics/programs/renewables-portfolio-standard.
2 02 1 P A D I L L A R E P O R T
C A L I F O RN IA P U B L I C UT I L I T I E S C O M MI S S I O N 2
Renewables generation under contract to electric service providers (ESPs) decreased from 9,648 GWh in 2019 to 7,086 GWh in 2020, resulting in a 2020 RPS percentage of retail load of 32%, and total annual RPS procurement expenditures by ESPs decreased from $127 million in 2019 to $115 million in 2020. This reflects an increase in renewables expenditures on a per GWh basis.
RPS expenditures as a percent of total generation costs are on par with non-renewables. For instance, 43% of the large investor-owned utilities’ retail load was generated from RPS-eligible resources and expenditures on renewable generation was 44% of the large investor-owned utilities’ total generation costs.
The large investor-owned utilities’ average procurement expenditure for all RPS contracts online increased slightly from 10.23 cents per kilowatt-hour (¢/kWh) in 2019 to 10.37 ¢/kWh in 2020. In contrast, the average cost for non-RPS energy was 9.94 ¢/kWh. This represents a 0.43 ¢/kWh cost premium compared to their average non-RPS procurement expenditure.
The average price of RPS contracts that were executed in 2020 was 3.5 ¢/kWh compared to 2.8 ¢/kWh in 2019. This increase is due to more diversified procurement of renewable generation from technologies such as bioenergy, geothermal, small hydro, and wind, and are higher in price compared to solar PV, which was the primary technology procured in 2019.

2 02 1 P A D I L L A R E P O R T
C A L I F O RN IA P U B L I C UT I L I T I E S C O M MI S S I O N 3
2. Background Senate Bill (SB) 836 (Padilla, 2011) requires the California Public Utilities Commission (CPUC) to report on the Renewables Portfolio Standard (RPS) program to the Legislature regarding “the costs of all electricity procurement contracts for eligible renewable energy resources, including unbundled renewable energy credits, and all costs for utility-owned generation approved by the CPUC.”3
The California RPS program was established in 2002 by Senate Bill (SB) 1078 (Sher, 2002) with the initial requirement that 20% of electricity retail sales must be served by renewable resources by 2017. The program was accelerated in 2006 under SB 107 (Simitian, 2006), which required that the 20% mandate be met by 2010. In April 2011, SB 2 (1X) (Simitian, 2011) codified a 33% RPS requirement to be achieved by 2020. In 2015, SB 350 (de León, 2015) mandated a 50% RPS by December 31, 2030. On September 10, 2018, SB 100 (de León, 2018) was signed into law, which further increased the RPS to 60% by December 31, 2030, with interim targets of 44% by December 31, 2024, and 52% by December 31, 2027 and sets the goal for all the state’s electricity to come from carbon-free resources by 2045.4
The 2020 RPS procurement cost figures in this report were compiled from all CPUC jurisdictional load serving entities (LSEs): Pacific Gas and Electric Company (PG&E), Southern California Edison Company (SCE), and San Diego Gas & Electric Company (SDG&E); 3 SMJUs; 23 CCAs; and 13 ESPs.5
Because the Renewable Energy Credits (RECs) associated with generation can be applied in later years for RPS program compliance purposes, the cost of procuring renewable energy might occur in one year and the RECs associated with generation may be applied in a later year.6 Accordingly, the annual procurement costs for generation in this report may not correspond precisely with the LSEs’ RPS compliance cost for the same year.
3 Pub. Util. Code § 913.3(a). SB 697 (Hertzberg, 2015) changed the numbering of the Pub. Util. Code sections, and specifically changed § 910 to Pub. Util. Code § 913.3. None of the original reporting requirements that were required under Pub. Util. § 910 were modified by SB 697. SB 1222 (Hertzberg, 2016) modified the reporting date for this report among other minor changes.
4 See the CPUC’s RPS website for more information about RPS program requirements and legislative history: http://www.cpuc.ca.gov/renewables/.
5 See Appendix E for a list of California’s Active Load Serving Entities.
6 See Commission Decision (D.)12-06-038; D.17-06-026.

2 02 1 P A D I L L A R E P O R T
C A L I F O RN IA P U B L I C UT I L I T I E S C O M MI S S I O N 4
3. Renewables Program Costs
This section addresses the costs associated with renewable resource procurement in 2020, consistent with the requirements of § 913.3(a)(1)-(2) and (b).
Section 913.3(a)(1)
For power purchase contracts, the commission shall release costs in an aggregated form categorized according to the year the procurement transaction was approved by the commission, the eligible renewable energy resource type, including bundled renewable energy credits, the average executed contract price, and average actual recorded costs for each kilowatt-hour of production. Within each renewable energy resource type, the commission shall provide aggregated costs for different project size thresholds.
Section 913.3(a)(2)
For each utility-owned renewable generation project, the commission shall release the costs forecast by the electrical corporation at the time of initial approval and the actual recorded costs for each kilowatt-hour of production during the preceding calendar year.
Section 913.3(b)
The commission shall report all electrical corporation revenue requirement increases associated with meeting the renewables portfolio standard, as defined in § 399.12, including direct procurement costs for eligible renewable energy resources and renewable energy credits.
The 2020 costs and cost savings discussed in this section include:
RPS Procurement Expenditures
Comparison of RPS Procurement Expenditures with Revenue Requirements (for IOUs and
SMJUs only)
RPS Aggregated Contract Prices

2 02 1 P A D I L L A R E P O R T
C A L I F O RN IA P U B L I C UT I L I T I E S C O M MI S S I O N 5
A. RPS Procurement Expenditures
This section provides information on total RPS procurement expenditures, weighted average expenditures, and RPS cost trends for all categories of LSEs. Generally, RPS expenditures7 for LSEs have trended down on a per GWh basis and this trend is expected to continue8 despite a unit cost increase in 2020 due to more diversified procurement.9
Large Investor-Owned Util i ty Procurement Expenditures for 2020 The large IOUs’ total annual RPS procurement expenditures increased from $5.4 billion in 2019 to $5.5 billion in 2020. This reflects a slight increase in renewables expenditures on a per GWh basis. Compiled, detailed large IOU 2020 RPS procurement information is summarized in Appendix B of this report. The data is expressed as weighted averages for RPS procurement expenditures in cents per kilowatt-hour (¢/kWh) categorized by IOU, technology, and size.10
Weighted Average Expenditures for Large IOUs
Based on the compiled 2020 data, the weighted average RPS procurement expenditure was approximately 10.37 ¢/kWh across all RPS contracts, including REC-only contracts. This 2020 average is slightly higher than the 10.23 ¢/kWh average in 2019.
Figure 1 illustrates the weighted average RPS procurement expenditures for bundled renewable energy in ¢/kWh for each of the large IOUs from 2003 through 2025. The changes in weighted average expenditures over time for each large IOU are similar, and the key factors driving the cost differences between the large IOUs are the resource mixes and contract vintages.
7 Procurement Expenditures for 2020 include costs for all procurement from online RPS-eligible facilities that generated electricity in 2020. Large IOU procurement expenditures include payments for curtailment volumes which generally increases the unit price of energy reported. See California ISO’s Managing Oversupply page for more information on curtailment: http://www.caiso.com/informed/Pages/ManagingOversupply.aspx. Additionally, Procurement Expenditures for 2020 do not include costs from contracts that were approved by the CPUC in 2020 unless the contracted deliveries also began in 2020.
8 See also Lazard, Levelized Cost of Energy Analysis – Version 14.0 (October 2020) at 13: Certain renewable energy generation technologies are already cost-competitive with conventional generation technologies; a key factor regarding the continued cost decline of renewable energy generation technologies is the ability of technological development and industry scale to continue lowering operating expenses and capital costs for renewable energy generation technology.
9 Near-term mandated procurement, including resource-specific requirements, is being contemplated in the IRP proceeding (R.20-05-003). The impact of any forthcoming procurement order on RPS expenditures is unknown at this time. Additional information on the IRP Procurement Track can be accessed at https://www.cpuc.ca.gov/General.aspx?id=6442463413.
10 The cost of RPS procurement expenditures is weighted based on actual quantities of energy delivered.

2 02 1 P A D I L L A R E P O R T
C A L I F O RN IA P U B L I C UT I L I T I E S C O M MI S S I O N 6
Figure 1: Weighted Average RPS Procurement Expenditures of Investor-Owned Utilities’ Bundled Renewable Energy from 2003-2025 (Real Dollars)
As shown in Figure 1, initial average annual RPS expenditures were lower than current expenditures for the program. This is due to the fact that in 2003, at the beginning of the RPS program, the large IOUs’ RPS resources consisted primarily of heavily depreciated wind and small hydroelectric facilities. Starting in 2010, new resources from contracts that were signed around 2007 finished construction and began coming online, which increased average RPS expenditures.
Because it takes several years from when a contract is executed to when the project delivers energy, and a large volume of contracts were signed between 2007 and 2010, there was a lag between the year of execution and the resulting increase in expenditures. Similarly, the forecast of average annual RPS expenditures decreases to reflect the fact that lower cost contracts entered into in the past several years will not be reflected as lower actual RPS expenditures until after those projects begin delivering energy. This is true even though 2020 RPS contract prices were higher than 2019 contracts. The average price of RPS contracts that were executed in 2020 was 3.5 ¢/kWh compared to 2.8 ¢/kWh in 2019. This increase is due to more diversified procurement of renewable generation from technologies such as bioenergy, geothermal, small hydro, and wind, which are higher in price compared to solar PV, which was the primary technology procured in 2019. Historic contract price trends for the RPS program can be seen in Figures 2 and 3, which show that executed contract prices peaked in 2007 and have been falling for RPS-eligible resources.
4.0
6.0
8.0
10.0
12.0
14.0
2003 2004 2005 2006 2007 2008 2009 2010 2011 2012 2013 2014 2015 2016 2017 2018 2019 2020 2021 2022 2023 2024 2025
¢/kW
h
PG&E Average Annual RPS ExpendituresSCE Forecast--Average Annual RPS ExpendituresSDG&E
CPUC Report on RPS Costs and Cost Savings, May 2021

2 02 1 P A D I L L A R E P O R T
C A L I F O RN IA P U B L I C UT I L I T I E S C O M MI S S I O N 7
Figure 2: RPS Program Expenditures and Contract Costs from 2003-202511 (Real Dollars)
To approximate the impact of decreasing contract prices on future expenditures, Figures 1 and 2 include a forecasted decline in average annual RPS expenditures at a rate of 2.5% per year between 2020 and 2025. The forecasted 2.5% drop in total RPS expenditures is significantly less than the historic 9.6% annual decrease in contract prices.12 This forecast was selected because the impact of falling contract prices in future years is dampened by the cumulative RPS expenditures, since each year’s newly generating contracts represent a relatively small part of the IOUs’ entire renewable portfolio. Figure 2 includes RPS contract costs executed in 2020 for all LSEs versus previous years’ reports which only reported IOUs’ contract costs. See Appendix C for 2020 contract price data.
Total Expenditures for Large IOUs
The changes in total expenditures over time corresponds with the large IOUs’ increase in renewable procurement. The large IOUs’ total combined direct RPS procurement expenditures increased slightly from $5.4 billion in 2019 to $5.5 billion in 2020.13 The IOUs’ renewable procurement increased
slightly from 51,599 GWh to 53,366 GWh, or 37% to 43% of their retail load, from 2019 to 2020.14
11 All values in this report have been adjusted for inflation using the U.S. Bureau of Labor Statistics’ Producer Price Index (PPI) for the Electric Power Generation, Transmission, and Distribution Industry. This PPI was chosen as an effective method for capturing price movement specific to a given industry prior to retail level price changes.
12 See Figure 3 at 14.
13 See Table 4 at 11.
14 The IOUs’ 2020 RPS percentage may differ from the forecast reported in the 2020 RPS Annual Report which does not account for RPS sales in 2020 that reduce the IOUs’ overall RPS percentage. The IOUs' RPS percentage for 2020 will be verified and reported in the 2021 RPS Annual Report to the Legislature in November 2021 following the IOUs compliance filings for the 2020 calendar year.
2.04.06.08.0
10.012.014.016.018.0
2003 2004 2005 2006 2007 2008 2009 2010 2011 2012 2013 2014 2015 2016 2017 2018 2019 2020 2021 2022 2023 2024 2025
¢/kW
h
RPS Contract Cost Average Annual RPS ExpendituresForecast - Average Annual RPS Expenditures
CPUC Report on RPS Costs and Cost Savings, May 2021

2 02 1 P A D I L L A R E P O R T
C A L I F O RN IA P U B L I C UT I L I T I E S C O M MI S S I O N 8
Small and Multi-Jurisdictional Investor-Owned Ut il i ty Procurement Expenditures for 2020
In 2020, Liberty Utilities (Liberty), PacifiCorp, and Bear Valley Electric Service (BVES) spent approximately $21.7 million on RPS procurement as shown in Table 1 below. The SMJUs’ RPS resources include biomass, geothermal, hydroelectric, solar photovoltaic, and wind.
Weighted SMJU Average Expenditures
In 2020, the weighted average RPS procurement expenditure for all Liberty contracts was 4.3 ¢/kWh,
4.4 ¢/kWh for PacifiCorp, and 0.9 ¢/kWh for BVES.15
Total SMJU Expenditures
For 2020, Liberty, PacifiCorp, and BVES had a total combined RPS procurement expenditure of $21.7 million compared to $14.1 million in 2019. The SMJUs’ total renewable procurement increased by approximately 212 GWh from 2019 to 2020 and their average RPS procurement percentage increased
from 25% to 29%.16
Table 1: Small and Multi-Jurisdictional Investor-Owned Utilities’ Total RPS Expenditures in 2020
Liberty PacifiCorp Bear Valley Electric
Service
Total (millions)
$15.7 $5.5 $0.5
Community Choice Aggregator and Electric Service Provider Procurement Expenditures for 2020
In 2020, there were 23 operating Community Choice Aggregators (CCAs) and 13 Electric Service Providers (ESPs) that procured RPS-eligible energy. The CCAs’ and ESPs’ RPS resources include bioenergy, geothermal, small hydroelectric, solar photovoltaic, wind, and unbundled RECs. Tables 2 and 3 provide a summary of RPS procurement in 2019 and 2020 for CCAs and ESPs. The CCAs’ total expenditures increased in 2020 primarily due to the launch of new CCAs, expansions of existing
15 BVES’s 2020 procurement expenditure data includes strictly REC-only contracts; therefore, it is not comparable to the other utilities’ 2020 expenditures as they procured significant quantities of contracts that include the cost of acquiring RECs, capacity, and energy.
16Supra note 15.

2 02 1 P A D I L L A R E P O R T
C A L I F O RN IA P U B L I C UT I L I T I E S C O M MI S S I O N 9
CCAs, and additional CCA phasing in of customers, which ramped up CCA procurement to meet the RPS requirements in 2020.17 Meanwhile, ESPs’ total expenditures and total procurement decreased from 2019 to 2020.18
It is important to note that the CCA and ESP RPS expenditures reported below cannot be directly compared to the IOUs’ RPS procurement expenditures because the vast majority of delivered energy in 2020 for CCAs and ESPs originated from “Index plus Renewable Energy Credit (REC)” contracts.19 The price for energy in these contracts is variable and changes depending on when energy is delivered to the electricity grid pursuant to the contract. 20 Index plus REC contracts differ significantly from “all-in” price RPS contracts for energy, RECs, and capacity, which make up the entirety of the IOUs’ RPS portfolios.
While Index plus REC contracts do not include a set price for energy and the buyer must pay the spot price on the market at the time the energy is generated, the REC price for these contracts is set at a negotiated amount in dollars per megawatt-hour ($/MWh). In contrast, “all-in” price RPS contracts may include annual escalation factors or other price adjustments over the term of the contract, but the price is otherwise “fixed” or set over the term of the contract.21
In addition, it is important to distinguish between the vintage of the IOUs’ contracts and the vintages of the CCAs’ and ESPs’ contracts. The IOUs executed a majority of their RPS procurement contracts when technology prices were higher overall compared to CCA and ESP contracts executed in the last several years.
17 For information regarding CCAs’ forecasted RPS compliance, see CCAs’ average actual and forecasted RPS percentages in the 2020 RPS Annual Report to the Legislature at 13.
18 For information regarding ESPs’ forecasted RPS compliance, see ESPs’ average actual and forecasted RPS percentages in the 2020 RPS Annual Report to the Legislature at 16.
19 Index plus REC contracts generally define “Index” energy as the CAISO Integrated Forward Market Day Ahead Price for CAISO SP-15 or NP-15 when the energy is delivered.
20 In the CAISO’s most recently released Annual Report on Market Issues and Performance, the average Index price for energy in 2019 was $38/MWh.(See CAISO’s 2019 Annual Report on Market Issues and Performance, p. 4, http://www.caiso.com/Documents/2019AnnualReportonMarketIssuesandPerformance.pdf). The average Index price for energy varies depending on grid conditions and market supply and demand. Real-time prices in 2019 were more variable than in 2018. According to the report, “most high prices in 2019 occurred as a result of high bids in the market and congestion within the ISO. Real-time market price spikes occurred most frequently in the second quarter rather than the third quarter when there was higher demand.” p. 102.
21 Approximately 83% of renewable energy delivered to CCAs and 90 percent of renewable energy delivered to ESPs in 2020 originated from Index plus REC contracts. In addition, 17 percent of energy was derived from fixed price contracts for CCAs, and 2 percent was derived from fixed price contracts for ESPs in 2020.

2 02 1 P A D I L L A R E P O R T
C A L I F O RN IA P U B L I C UT I L I T I E S C O M MI S S I O N 10
The weighted average expenditures and total expenditures for CCAs and ESPs detailed in Table 2 and Table 3 below do not incorporate the Index energy price for the Index plus REC contracts.
Table 2: Comparison of Community Choice Aggregator RPS Procurement and Procurement Expenditures between 2019 and 2020
2019 2020
Weighted Average Expenditures (¢/kWh)22 3.5 5.2
Total Expenditures (millions) 23 $385 $491
Total Renewable Energy Delivered (GWh)24 19,593 23,928
Average RPS Procurement Percentage25 55% 41%
Table 3: Comparison of Electric Service Provider RPS Procurement and Procurement Expenditures between 2019 and 2020
2019 2020
Weighted Average Expenditures (¢/kWh) 1.0 1.526
Total Expenditures (millions) 27 $127 $115
Total Renewable Energy Delivered (GWh)28 9,648 7,086
Average RPS Procurement Percentage29 41% 32%
22 For CCAs, the weighted average procurement expenditures in 2020 was 2 ¢/kWh and varied based on IOU territory: CCAs
in PG&E’s territory spent 2.3 ¢/kWh, SCE’s territory spent 1.7 ¢/kWh, and SDG&E’s territory spent 0.7 ¢/kWh.
23 Total expenditures are derived from CCA responses to Energy Division’s RPS-PCIA Quarterly Data Report, submitted March 1, 2021.
24 Total renewable energy delivered is derived from CCA responses to Energy Division’s RPS-PCIA Quarterly Data Report, submitted March 1, 2021.
25 See Table 4 in the 2020 RPS Annual Report to the Legislature.
26 The ESPs’ RPS procurement expenditures only represent the Index plus REC expenditures. Please refer to Appendix B-4 for more information.
27 Total expenditures are derived from ESP responses to Energy Division’s RPS-PCIA Quarterly Data Report, submitted March 1, 2021.
28 Total renewable energy delivered is derived from ESP responses to Energy Division’s RPS-PCIA Quarterly Data Report, submitted March 1, 2021.
29 See Table 6 in the 2020 RPS Annual Report to the Legislature.

2 02 1 P A D I L L A R E P O R T
C A L I F O RN IA P U B L I C UT I L I T I E S C O M MI S S I O N 11
B. Comparison of RPS Procurement Expenditures to Revenue Requirements (Large IOUs and SMJUs Only)
Large Investor-Owned Util i t ies
Table 4 compares RPS procurement expenditures to revenue requirements for the large IOUs. Specifically, the table shows the percentage of RPS procurement compared to total procurement for these IOUs’ generation portfolios, as well as the RPS procurement costs as a portion of the total revenue requirement. Additionally, Table 4 shows the large IOUs’ RPS generation percentages for 2020.
Table 4 also shows that in 2020, RPS procurement expenditures on average were less than 19% of the IOUs’ total revenue requirements. Compared to the total generation revenue requirements, the RPS expenditures make up a significantly smaller portion of the total revenue requirements, since total revenue requirements contain many large line items such as transmission expenditures, reliability costs, wildfire safety and mitigation programs, administrative costs, and capital expenses.
Table 4: Comparison of Large Investor-Owned Utilities' RPS Procurement to Revenue Requirements in 202030,31
IOU RPS
Generation
RPS Procurement Expenditures
(billions)
Total Generation
Revenue Requirement
(billions)
RPS Procurement Expenditures
to Total Generation
Revenue Requirement
(%)
Total Revenue
Requirement (billions)
RPS Procurement Expenditures
to Total Revenue
Requirement (%)
PG&E 47.0% $2.58 $5.51 46.8% $14.09 18.3%
SCE 41.5% $2.31 $5.50 42.0% $12.00 19.3%
SDG&E 38.2% $0.64 $1.56 41.0% $4.14 15.5%
30 Revenue requirement numbers have been taken from the CPUC’s “California Electric and Gas Utility Cost Report” pursuant to Public Utilities Code § 913, April 2021.
31 RPS generation percentages are calculated by dividing the IOUs’ RPS generation serving retail load by the IOUs’ total generation.

2 02 1 P A D I L L A R E P O R T
C A L I F O RN IA P U B L I C UT I L I T I E S C O M MI S S I O N 12
As LSEs – including the large IOUs – are required to procure increasingly higher percentages of RPS-eligible energy, and are procuring less non-RPS-eligible energy for their electric portfolios. Calculating the increase in revenue requirement as a result of increased RPS procurement is difficult, particularly as RPS expenditures are largely in-line with non-RPS expenditures on a kilowatt-hour (kWh) basis. However, considering that RPS energy is replacing fossil fuel energy, one approximation is to compare the average cost of RPS energy to non-RPS energy, which is explored in the next section.
In 2020, the large IOUs’ average cost of renewable energy was 10.37 ¢/kWh and the average cost of non-RPS energy was 9.94 ¢/kWh.32 Using this metric, large IOUs’ renewable energy procurement likely added a premium of 0.43 ¢/kWh on average for the renewable energy procured to meet their RPS requirements.33 However, as explained in Section 4, this is an imperfect comparison, since it does not reflect savings that likely result from the reduced demand for non-renewable energy.
Small and Multi-Jurisdictional Investor-Owned Uti l it ies
The 2020 revenue requirement information for Liberty, BVES, and PacifiCorp is currently
confidential pursuant to CPUC confidentiality rules.34 Consequently, the CPUC is not able to publicly release an analysis of SMJU costs compared to their revenue requirements for 2020.
32 See Table 7 at 18.
33 The average RPS cost premium compared to non-RPS energy on a kilowatt-hour basis is represented by the following equation:
10.37 ¢/kWh (RPS Energy) - 9.94 ¢/kWh (Non-RPS Energy) = 0.43 ¢/kWh.
34 See D.06-06-066 for confidentiality rules related to revenue requirements.

2 02 1 P A D I L L A R E P O R T
C A L I F O RN IA P U B L I C UT I L I T I E S C O M MI S S I O N 13
C. RPS Aggregated Contract Prices
The CPUC examined the IOUs’, CCAs’, and ESPs’ 2019 and 2020 executed contract prices.35 Moreover, the CPUC also reviewed IOUs’ RPS contracts executed between 2003 and 2018 to provide historic contract cost trends.36
RPS Contract Prices for Resources Greater than 3 MW
Figure 3 below shows that RPS contract prices, in real dollars, decreased an average of 8.3% annually between 2007 and 2020. CCAs executed the majority of new RPS procurement contracts in 2020. The overall downward trend in contract prices can be attributed to falling prices for wind and solar technologies, which together make up 86% of the large IOUs’ collective RPS generating capacity.
In 2020, RPS contract prices increased slightly due to the execution of large bioenergy projects, which also precipitated the 2016 spike in RPS contract prices as a result of mandated biomass procurement.37 To remove non-representational trends, contracts with a nameplate capacity of 3 MW or less and those reported as net cost instead of total contract price were not included in Figure 3.38
35 2020 Contract price data for IOUs, CCAs and ESPs were obtained through a joint data request pursuant to PU Code Section 913.3 and the Power Charge Indifference Adjustment (PCIA) proceeding. Contract data for 2003-2019 was reported by the IOUs through the CPUC’s RPS Executed Projects Database, which contains self-reported information by the IOUs on their RPS contracts.
36 See id.
37 BioRAM is the Bioenergy Renewable Auction Mechanism program which mandates High Hazard Zone (HHZ) biomass contracts as a part of the state’s response to Governor Brown’s October 30, 2015, Emergency Proclamation and SB 859 (2016) intended to protect public safety and property from dead or dying trees and wildfires. Governor Edmund G. Brown Jr., Proclamation of a State of Emergency (October 30, 2015). BioRAM contracts were required to be extended in response to SB 901 (Dodd, 2018). https://www.gov.ca.gov/wp-content/uploads/2017/09/10.30.15_Tree_Mortality_State_of_Emergency.pdf.
38 Projects with a capacity of 3 MW or less made up roughly 2% of all of the IOUs’ contracted RPS capacity, and removing these figures eliminated non-representative trends from the data. As a result of this size exclusion, feed-in-tariff projects were not considered in the analysis above. In California, feed-in-tariff programs offer projects with a capacity of 3 MW or less a predetermined price ($/MWh) to encourage market transformation for projects at these sizes. Additionally, contracts identified as REC-only payments were excluded as these values are not comparable to all-in energy, capacity, and REC contract prices.

2 02 1 P A D I L L A R E P O R T
C A L I F O RN IA P U B L I C UT I L I T I E S C O M MI S S I O N 14
Figure 3: Historical Trend of All Load Serving Entities’ RPS Contract Costs by Technology and Year of Execution from 2003-2025 (Real Dollars)39
The average price of IOU, CCA and ESP contracts executed in 2019 that were greater than 3 MW was 2.8 ¢/kWh compared to 3.5 ¢/kWh in 2020. The IOUs executed RPS contracts for biomass and solar. The CCAs executed mostly solar and wind contracts, with two joint CCA contracts for geothermal capacity. One ESP executed a contract with a new solar facility. Following the historical trend shown in Figure 3, contract prices for RPS resources are expected to decline and stabilize in the future.40
39 See Appendix C for all RPS contracts signed in 2020, including those with a nameplate capacity below 3 MW.
40 See also Lazard, Levelized Cost of Energy Analysis – Version 14.0 (October 2020) at 13: Certain renewable energy generation technologies are already cost-competitive with conventional generation technologies; a key factor regarding the continued cost decline of renewable energy generation technologies is the ability of technological development and industry scale to continue lowering operating expenses and capital costs for renewable energy generation technology.
2.0
4.0
6.0
8.0
10.0
12.0
14.0
16.0
18.0
2003 2004 2005 2006 2007 2008 2009 2010 2011 2012 2013 2014 2015 2016 2017 2018 2019 2020 2021 2022 2023 2024 2025
¢/kW
h
All Technologies Solar + Wind Small Hydro + GeothermalAll Technologies Forecast Bioenergy
CPUC Report on RPS Costs and Cost Savings, May 2021
2 02 1 P A D I L L A R E P O R T
C A L I F O RN IA P U B L I C UT I L I T I E S C O M MI S S I O N 15
RPS Contract Prices for Resources 3 MW and Less
IOU Bioenergy Market Adjusting Tariff (BioMAT) Contracts
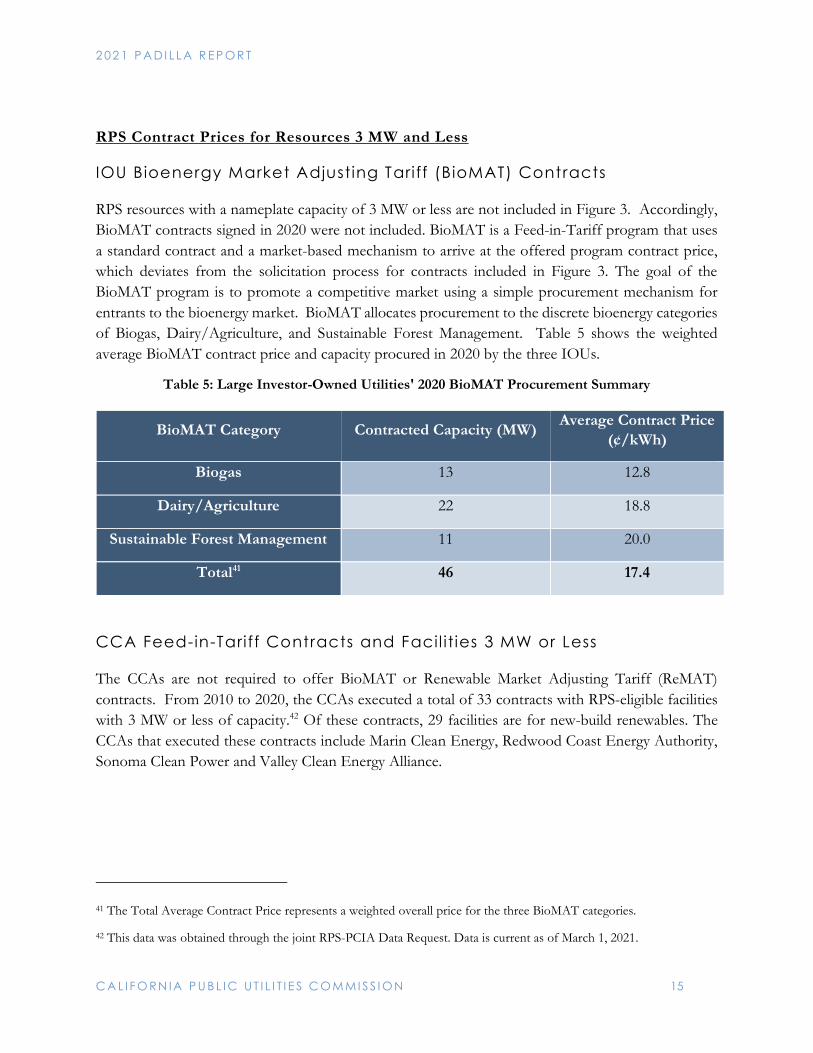
RPS resources with a nameplate capacity of 3 MW or less are not included in Figure 3. Accordingly, BioMAT contracts signed in 2020 were not included. BioMAT is a Feed-in-Tariff program that uses a standard contract and a market-based mechanism to arrive at the offered program contract price, which deviates from the solicitation process for contracts included in Figure 3. The goal of the BioMAT program is to promote a competitive market using a simple procurement mechanism for entrants to the bioenergy market. BioMAT allocates procurement to the discrete bioenergy categories of Biogas, Dairy/Agriculture, and Sustainable Forest Management. Table 5 shows the weighted average BioMAT contract price and capacity procured in 2020 by the three IOUs.
Table 5: Large Investor-Owned Utilities' 2020 BioMAT Procurement Summary
BioMAT Category Contracted Capacity (MW) Average Contract Price
(¢/kWh)
Biogas 13 12.8
Dairy/Agriculture 22 18.8
Sustainable Forest Management 11 20.0
Total41 46 17.4
CCA Feed-in-Tariff Contracts and Facil it ies 3 MW or Less
The CCAs are not required to offer BioMAT or Renewable Market Adjusting Tariff (ReMAT) contracts. From 2010 to 2020, the CCAs executed a total of 33 contracts with RPS-eligible facilities with 3 MW or less of capacity.42 Of these contracts, 29 facilities are for new-build renewables. The CCAs that executed these contracts include Marin Clean Energy, Redwood Coast Energy Authority, Sonoma Clean Power and Valley Clean Energy Alliance.
41 The Total Average Contract Price represents a weighted overall price for the three BioMAT categories.
42 This data was obtained through the joint RPS-PCIA Data Request. Data is current as of March 1, 2021.

2 02 1 P A D I L L A R E P O R T
C A L I F O RN IA P U B L I C UT I L I T I E S C O M MI S S I O N 16
Table 6: Community Choice Aggregator Procurement Summary of Facilities 3 MW or Less (Contracts Executed Between 2010 and 2020)
Technology Type Contracted Capacity
(MW) Weighted Average Contract Price
¢/kWh
Biogas/Landfill 3.2 Only 2 Contracts
Small Hydro 7.9 7.5
Solar PV – Ground Mount
29.2 7.6
Solar PV - Rooftop 3.0 11.3
Total 43.3 7.9
Bioenergy Renewable Auction Mechanism (BioRAM) Contracts
Pursuant to the Governor’s Emergency Order Addressing Tree Mortality, Senate Bill (SB) 859 and SB 901, the BioRAM program requires the large IOUs to procure 146 MWs of bioenergy from High Hazard Zones to aid in mitigating the threat of wildfires. Since 2016, the IOUs have executed contracts with seven biomass facilities to meet their BioRAM procurement requirements.43
To date, the total capacity and average contract price of existing BioRAM contracts is 178 MW and 12.0 ¢/kWh, respectively.
43 CCAs and ESPs are not required to execute BioRAM contracts but are allocated a proportional cost through a non-bypassable charge.

2 02 1 P A D I L L A R E P O R T
C A L I F O RN IA P U B L I C UT I L I T I E S C O M MI S S I O N 17
4. Renewables Program Cost Premiums and/or Savings
This section addresses the cost premiums and/or savings associated with the large IOU and SMJU procurement of renewable resources in 2020, consistent with the requirements of § 913.3(c).
Section 913.3(c)
The commission shall report all cost savings experienced, or costs avoided, by electrical corporations as a result of meeting the renewables portfolio standard.
It is difficult to quantify the cost savings, or avoided costs, associated with the RPS program because this would require assessing to what extent the RPS program deferred construction of alternative generation facilities and the theoretical cost of those alternative resources. The CPUC also cannot estimate the impacts that increased renewables and the resulting reduction of natural gas demand has had on the cost of natural gas in California. Further, non-RPS resource costs, such as Resource Adequacy, are based on the preexisting supply of facilities and capacity need that are not tethered to the same market considerations as RPS contracts. This challenge is also reflected in the previous section’s assessment of RPS expenditures as part of utilities’ revenue requirements, in which the variables that inform the cost savings analysis are described as imperfect because they are not narrowly tailored to capture the benefits and costs of the RPS program.
Consequently, there is no perfect counterfactual to assess the RPS program’s cost savings. For the purposes of this report, the utilities’ 2020 RPS procurement costs are compared to non-RPS procurement costs, because in the absence of RPS procurement, non-RPS resources would still be procured. This comparison likely exaggerates RPS procurement costs, since any premiums for avoided construction of new, and therefore more expensive, non-RPS resources and any gas cost savings resulting from lower gas demand are not reflected in this comparison.

2 02 1 P A D I L L A R E P O R T
C A L I F O RN IA P U B L I C UT I L I T I E S C O M MI S S I O N 18
A. Large Investor-Owned Util it ies’ Cost Premiums / Savings
In 2020, the large IOUs’ average annual RPS procurement expenditure represented a weighted average 0.43 ¢/kWh cost premium compared to their average non-RPS procurement expenditure.44 On an individual basis, as deduced from Table 7, SCE and SDG&E paid a premium for RPS energy—compared to non-RPS energy—of 0.19 ¢/kWh and 1.11¢/kWh, respectively. Conversely, PG&E experienced a cost savings of 0.10 ¢/kWh.
Table 7: Large Investor-Owned Utilities' 2020 Average RPS and Non-RPS Eligible Procurement Expenditure (¢/kWh)
Method PG&E SCE SDG&E Average
2020 Non-RPS 12.66 8.65 8.53 9.94
2020 RPS 12.56 8.84 9.64 10.37
Based on total volumes of RPS and non-RPS eligible procurement expenditures, the large IOUs realized the following cost savings (positive figures) or premiums (negative figures):
Table 8: Large Investor-Owned Utilities' 2020 RPS Cost Savings: Non-RPS Eligible Comparison45
Cost Savings Compared to 2020 Average Non-RPS Expenditure (millions)
PG&E $20
SCE ($49)
SDG&E ($74)
Cost savings are displayed as positive figures while cost premiums are displayed as negative figures.
44 Supra, note 33 at 12.
45 Cost savings or premiums are calculated by multiplying each IOU’s average 2020 non-RPS eligible expenditure (Table 7) by its total volume of RPS procurement in 2020 then subtracting that value from the IOUs’ 2020 RPS procurement expenditure (Table 4).

2 02 1 P A D I L L A R E P O R T
C A L I F O RN IA P U B L I C UT I L I T I E S C O M MI S S I O N 19
B. Small and Multi-Jurisdictional Investor-Owned Util ities’ Cost Premiums / Savings
In 2020, the RPS procurement expenditure for SMJUs represented a 1.0 ¢/kWh cost savings compared to their average non-RPS-eligible expenditure. The cost savings for RPS energy compared to non-RPS energy for Liberty and PacifiCorp was 1.0 ¢/kWh and 0.2 ¢/kWh, respectively. BVES’s RPS procurement consisted solely of REC-only products and represented a cost premium of 0.9 ¢/kWh. However, BVES’ RPS expenditures are not directly comparable to their non-RPS expenditures, which include additional costs for obtaining energy and capacity benefits.
Table 9: Small and Multi-Jurisdictional Investor-Owned Utilities’ 2020 Average Non-RPS Eligible Procurement Expenditure (¢/kWh)
Method Liberty PacifiCorp Bear Valley
Electric Service
Average
2020 Non-RPS 5.3 4.6 6.2 5.0
2020 RPS 4.3 4.4 0.9 4.046
Based on total volumes of RPS generation procured and non-RPS eligible procurement expenditures, the large SMJUs realized the following cost savings (positive figures) or premiums (negative figures):
Table 10: Small and Multi-Jurisdictional Investor-Owned Utilities’ 2020 RPS Cost Savings: Non-RPS Eligible Comparison47
Cost Savings Compared to 2020 Average Non-RPS Expenditure (millions)
Liberty $13.8
PacifiCorp $4.9
Bear Valley Electric Service N/A
Cost savings are displayed as positive figures while cost premiums are displayed as negative figures.
46 The SMJUs’ 2020 average RPS procurement expenditure calculation includes BVES’ RPS procurement expenditures consisting solely of REC-only products.
47 Cost savings or premiums are calculated by multiplying each SMJU’s average 2020 non-RPS eligible expenditure (Table 9) by its total volume of RPS procurement in 2020 then subtracting that value from the SMJUs’ 2020 RPS procurement expenditure (Table 1).

2 02 1 P A D I L L A R E P O R T
C A L I F O RN IA P U B L I C UT I L I T I E S C O M MI S S I O N 20
5. Appendices Appendix A: California Public Util ities Commission RPS Activities and Milestones
California Public Utilities Commission RPS Activities and Milestones in 2020
January Energy Division issued three disposition letters in response to each large IOU’s
information-only advice letter regarding Air Pollution Control Information on Tree Mortality Contracts in compliance with D.18-12-003.
February
Energy Division issued three disposition letters in response to each large IOU’s advice letters complying with D.19-12-004 to modify the BioMAT Fuel Resource Category 2 definition.
CPUC Staff Proposal on confidentiality rules for the RPS program issued.
March
CPUC BioMAT Staff Proposal seeking comments on recommended program changes issued.
CPUC adopted D.20-02-044 clarifying the eligibility of directed biogas under the BioMAT program.
April CPUC issued the California Electric and Gas Utility Cost Annual Report to the Governor and Legislature (AB 67; PU Code 913).
May
CPUC issued the 2020 Padilla Report on Costs and Cost Savings for the RPS Program to the Legislature, pursuant to Public Utilities Code § 913.3.
Assigned Commissioner and Assigned Administrative Law Judge’s Ruling issued identifying issues and schedule of review for 2020 RPS Procurement Plans.
CPUC adopted D.20-05-006 approving a new standard offer contract for qualifying facilities 20 MW or less.
June CPUC Staff Proposal on ReMAT program modifications issued.
July
IOUs, CCAs, and ESPs submitted Draft 2020 RPS Procurement Plans. Energy Division issued three disposition letters in response to each large IOU’s
information-only advice letter regarding Air Pollution Control Information on Tree Mortality Contracts in compliance with Decision 18-12-003.
Energy Division approved PG&E Advice Letter 5844-E extending Burney BioRAM contract by 5 years.
August IOUs, CCAs, and ESPs submitted annual RPS Compliance Reports. Energy Division issued disposition letters accepting the Joint IOU Effective Load
Carrying Capacity (ELCC) values for RPS procurement
September
CPUC adopted D.20-08-043 implementing changes in the BioMAT program and extending the program to 2025.
Energy Division issued disposition letter accepting PG&E’s Advice Letter 5906-E for two RPS sales agreements.
CPUC adopted D.20-09-022 accepting CCAs and PacifiCorp 2019 RPS Plans. CPUC staff proposal on alignment of RPS Procurement Plans and Integrated Resource
Planning filings issued.
October CPUC adopted D.20-10-005 implementing changes to ReMAT program.

2 02 1 P A D I L L A R E P O R T
C A L I F O RN IA P U B L I C UT I L I T I E S C O M MI S S I O N 21
Energy Division issued disposition letter accepting PG&E’s Advice Letter 5955-E, amending the BioRAM standard contract.
Energy Division issued letters to all retail sellers that are at risk of not meeting their RPS compliance requirements, pursuant to Senate Bill 155 (Bradford, 2019).
November CPUC issued the 2020 Annual RPS Report to the Legislature: https://www.cpuc.ca.gov/RPS_Reports_Data/
December CPUC issued a Proposed Decision on 2020 RPS Procurement Plans.
2 02 1 P A D I L L A R E P O R T
C A L I F O RN IA P U B L I C UT I L I T I E S C O M MI S S I O N 22
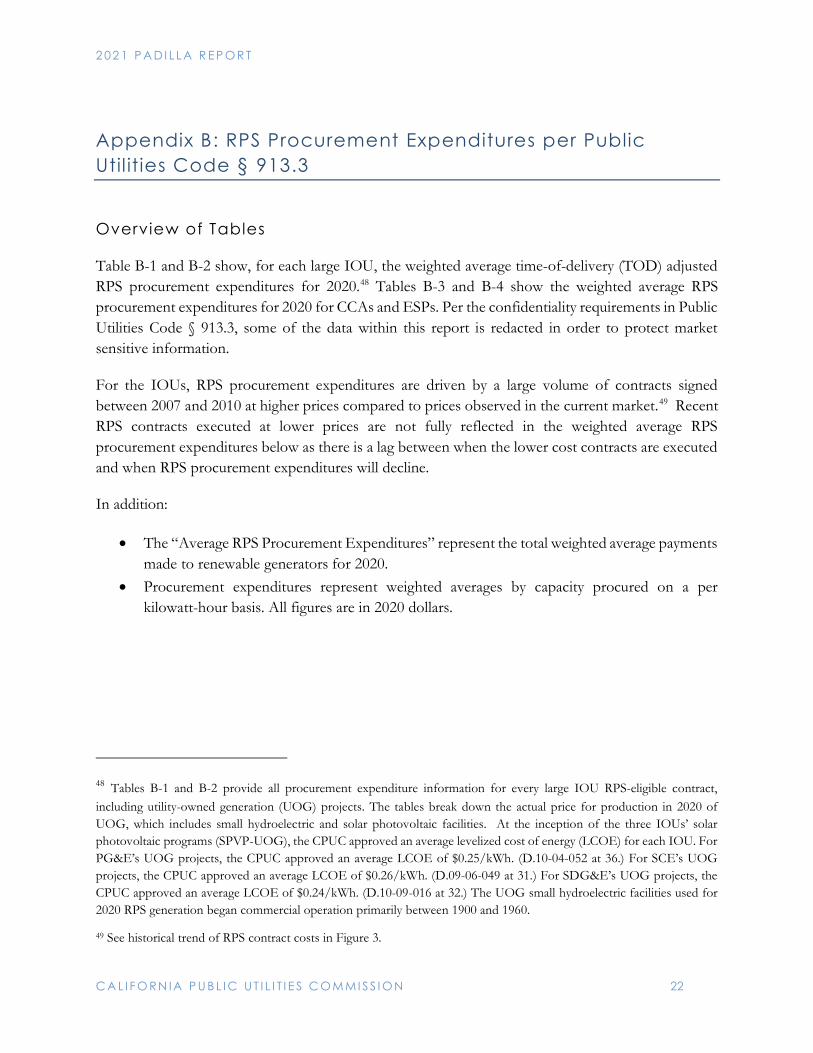
Appendix B: RPS Procurement Expenditures per Public Util ities Code § 913.3
Overview of Tables
Table B-1 and B-2 show, for each large IOU, the weighted average time-of-delivery (TOD) adjusted RPS procurement expenditures for 2020.48 Tables B-3 and B-4 show the weighted average RPS procurement expenditures for 2020 for CCAs and ESPs. Per the confidentiality requirements in Public Utilities Code § 913.3, some of the data within this report is redacted in order to protect market sensitive information.
For the IOUs, RPS procurement expenditures are driven by a large volume of contracts signed between 2007 and 2010 at higher prices compared to prices observed in the current market.49 Recent RPS contracts executed at lower prices are not fully reflected in the weighted average RPS procurement expenditures below as there is a lag between when the lower cost contracts are executed and when RPS procurement expenditures will decline.
In addition:
The “Average RPS Procurement Expenditures” represent the total weighted average payments made to renewable generators for 2020.
Procurement expenditures represent weighted averages by capacity procured on a per kilowatt-hour basis. All figures are in 2020 dollars.
48 Tables B-1 and B-2 provide all procurement expenditure information for every large IOU RPS-eligible contract, including utility-owned generation (UOG) projects. The tables break down the actual price for production in 2020 of UOG, which includes small hydroelectric and solar photovoltaic facilities. At the inception of the three IOUs’ solar photovoltaic programs (SPVP-UOG), the CPUC approved an average levelized cost of energy (LCOE) for each IOU. For PG&E’s UOG projects, the CPUC approved an average LCOE of $0.25/kWh. (D.10-04-052 at 36.) For SCE’s UOG projects, the CPUC approved an average LCOE of $0.26/kWh. (D.09-06-049 at 31.) For SDG&E’s UOG projects, the CPUC approved an average LCOE of $0.24/kWh. (D.10-09-016 at 32.) The UOG small hydroelectric facilities used for 2020 RPS generation began commercial operation primarily between 1900 and 1960.
49 See historical trend of RPS contract costs in Figure 3.

2 02 1 P A D I L L A R E P O R T
C A L I F O RN IA P U B L I C UT I L I T I E S C O M MI S S I O N 23
Table B-1. Weighted Average RPS Procurement Expenditures for IOUs (All Projects – Including REC-only transactions) for 2020 (¢/kWh)
PG&E SCE SDG&E Total Biogas
0-3 MW 15.9 12.8 10.3 13.9 +3-20 MW 12.2 7.1 5.2 10.1
Biogas Total 13.3 9.9 7.0 11.4 Biomass
+3-20 MW 11.0 10.7 +20-50 MW 12.5 10.7 Only 1 Contract 12.5 +50-200 MW 9.3 9.3
Biomass Total 11.6 10.7 Only 1 Contract 11.4 Geothermal
+3-20 MW 9.0 4.8 7.6 +20-50 MW 7.8 7.8 +200 MW 8.0 6.9 7.5
Geothermal Total 8.1 7.3 0.0 7.6 Small Hydro
0-3 MW 8.6 9.2 6.9 8.7 +3-20 MW 5.4 5.4 +20-50 MW 11.4 11.4
Small Hydro Total 9.8 9.2 6.9 9.7 Solar Photovoltaic
0-3 MW 11.9 12.4 11.9 12.2 +3-20 MW 10.0 9.0 8.6 9.4 +20-50 MW 14.1 7.6 14.4 12.8 +50-200 MW 11.6 6.4 12.3 9.3
+200 MW 16.3 12.1 13.9 Solar Photovoltaic Total 13.6 9.5 12.1 11.3
Solar Thermal +50-200 MW 16.2 16.3 16.2
+200 MW 20.8 20.8 Solar Thermal Total 19.3 16.3 0.0 18.7
Wind 0-3 MW 7.6 7.6
+3-20 MW 6.4 4.3 8.0 6.2 +20-50 MW 10.1 9.8 5.5 8.7 +50-200 MW 7.8 8.6 6.1 7.9
+200 MW 8.3 10.5 8.6 Wind Total 7.8 8.5 6.9 8.0
UOG Small Hydro 0-3 MW 114.6 3.4 41.5
+3-20 MW 39.3 1.4 29.2 +20-50 MW 12.3 0.2 4.6
UOG Small Hydro Total 38.1 1.1 0.0 23.9 UOG Solar Photovoltaic
0-3 MW 35.6 0.6 5.2 5.0 +3-20 MW 19.6 0.6 67.7 18.4
UOG Solar Photovoltaic Total 19.8 0.6 61.5 17.2 Average of All Resources 12.6 8.8 9.6 10.4

2 02 1 P A D I L L A R E P O R T
C A L I F O RN IA P U B L I C UT I L I T I E S C O M MI S S I O N 24
Table B-2. Weighted Average RPS Procurement Expenditures for IOUs (Bundled Energy Only) for 2020 (¢/kWh)
PG&E SCE SDG&E Total Biogas
0-3 MW 15.9 12.8 10.3 13.9 +3-20 MW 12.2 7.1 5.2 10.1
Biogas Total 13.3 9.9 7.0 11.4 Biomass
+3-20 MW 11.0 10.7 +20-50 MW 12.5 10.7 Only 1 Contract 12.5 +50-200 MW 9.3 9.3
Biomass Total 11.6 10.7 Only 1 Contract 11.4 Geothermal
+3-20 MW 9.0 4.8 7.6 +20-50 MW 7.8 7.8 +200 MW 8.0 6.9 7.5
Geothermal Total 8.1 7.3 0.0 7.6 Small Hydro
0-3 MW 8.6 9.2 6.9 8.7 +3-20 MW 5.4 5.4 +20-50 MW 11.4 11.4
Small Hydro Total 9.8 9.2 6.9 9.7 Solar Photovoltaic
0-3 MW 11.9 12.4 11.9 12.2 +3-20 MW 10.0 9.0 8.6 9.4 +20-50 MW 14.1 7.6 14.4 12.8 +50-200 MW 11.6 6.4 12.3 9.3
+200 MW 16.3 12.1 13.9 Solar Photovoltaic Total 13.6 9.5 12.1 11.3
Solar Thermal +50-200 MW 16.2 16.3 16.2
+200 MW 20.8 20.8 Solar Thermal Total 19.3 16.3 0.0 18.7
Wind 0-3 MW 7.6 7.6
+3-20 MW 6.4 4.3 8.0 6.2 +20-50 MW 10.1 9.8 5.5 8.7 +50-200 MW 7.8 8.6 7.4 8.1
+200 MW 8.3 10.5 8.6 Wind Total 7.8 8.5 8.0 8.2
UOG Small Hydro 0-3 MW 114.6 3.4 41.5
+3-20 MW 39.3 1.4 29.2 +20-50 MW 12.3 0.2 4.6
UOG Small Hydro Total 38.1 1.1 0.0 23.9 UOG Solar Photovoltaic
0-3 MW 35.6 0.6 5.2 5.0 +3-20 MW 19.6 0.6 67.7 18.4
UOG Solar Photovoltaic Total 19.8 0.6 61.5 17.2 Average of All Resources 12.6 8.8 10.4 10.5

2 02 1 P A D I L L A R E P O R T
C A L I F O RN IA P U B L I C UT I L I T I E S C O M MI S S I O N 25
Table B-3. Weighted Average RPS Procurement Expenditures for CCAs (Bundled Energy and REC-Only Transactions) for 2020 (¢/kWh)
Total50 REC Total Biogas
0-3 MW Only 1 Contract Biogas Total Only 1 Contract
Biomass 3-20 MW Only 2 Contracts
Index + REC - 1.5 Biomass Total Only 2 Contracts 1.5
Geothermal 0-3 MW Only 2 Contracts
15-50 MW 6.9 Index + REC 1.8
Geothermal Total 6.4 1.8 Landfill Gas
0-3 MW Only 2 Contracts 3-20 MW Only 2 Contracts
Landfill Gas Total Only 2 Contracts Small Hydro
0-3 MW 4.6 3-20 MW 4.9
Index + REC 1.4 Small Hydro Total 4.7 1.4
Solar Photovoltaic 0-3 MW 11.4
3-20 MW 20-50 MW
6.8 6.9
50-200 MW 3.7 Index + REC 1.5
Solar Photovoltaic Total 4.3 1.5 Various/REC-Only51
Index + REC REC Only
1.5 0.3
Wind 3-20MW 4.9
20-50 MW 5.0 50-200 MW Only 1 Contract
>200 MW Only 1 Contract Index + REC 1.6
Wind Total 4.9 1.6 Weighted Average of All Resources 5.2 1.5 52
50 Totals for each technology type exclude expenditures from Index + REC contracts. 51 The “Various” technology type indicates energy plus REC contracts where the technology type of the procurement is not yet known by the buyer. This arrangement occurs when an LSE procures energy and RECs from multiple facilities in a seller’s portfolio. The technology type is known to the buyer after the energy and RECs are delivered to the electricity grid. 52 Excludes Various/REC-only expenditures.

2 02 1 P A D I L L A R E P O R T
C A L I F O RN IA P U B L I C UT I L I T I E S C O M MI S S I O N 26
Table B-4. Weighted Average RPS Procurement Expenditures for ESPs (Bundled Energy and REC-Only Transactions) for 2020 (¢/kWh)
Total Index + REC Total Biogas
Index + REC Only 1 Contract Biogas Total Only 1 Contract
Biomass Index + REC 1.4
Biomass Total 1.4 Geothermal
Index + REC 1.9 Geothermal Total 1.9
Small Hydro Index + REC Only 2 Contracts
Small Hydro Total Only 2 Contracts Solar Photovoltaic
15-60 MW Only 2 Contracts Index + REC 1.7
Solar Photovoltaic Total Only 2 Contracts 1.7 Wind
Index + REC 1.6 Wind Total 1.6
Various/REC Only Index + REC 1.5
REC-Only 0.3 Weighted Average of All Resources Only 2 Contracts 1.5 53
53 Excludes Various/REC-Only expenditures.

2 02 1 P A D I L L A R E P O R T
C A L I F O RN IA P U B L I C UT I L I T I E S C O M MI S S I O N 27
Appendix C: Contract Price Data per Senate Bill 836 (Public Util it ies Code § 913.3)
Overview of Contract Pr ice Data
Table C-1 shows the weighted average time-of-delivery (TOD) adjusted contract price for all of the large IOUs’ RPS contracts approved by the CPUC in 2020. Tables C-2 and C3 show the weighted average contract prices for the CCA and ESP RPS contracts executed in 2020.
Per the confidentiality requirements in Public Utilities Code § 913.3, some of the data within this appendix is redacted. Contract prices are redacted if a) the power purchase agreement (PPA) is not already public on the CPUC’s website per the CPUC’s confidentiality rules, and b) there are fewer than three facilities in each category. If there is only one facility in a category and its PPA is publicly available on the CPUC’s website, then the price information for that facility is reported. In addition, the following contracts are public and reported: all qualifying facility (QF) contracts that do not require CPUC approval, feed-in tariff contracts, contracts with municipal governments, affiliate entities, and utility-owned generation (UOG) costs. Weighted average contract prices represent contract prices weighted by capacity procured on a per kilowatt-hour basis. All figures are in 2020 dollars. All IOU contracts with TOD-adjusted prices have been adjusted by those TOD factors because generators are paid based on the time that the facility delivers electricity. TOD factors are intended to pay a premium on generation that occurs during peak demand hours when electricity is more valuable.

2 02 1 P A D I L L A R E P O R T
C A L I F O RN IA P U B L I C UT I L I T I E S C O M MI S S I O N 28
Table C-1. Weighted Average TOD-Adjusted Price of All Renewable Energy Contracts Approved for 2020 for IOUs (¢/kWh)
PG&E SCE SDG&E Total
Biogas 0-3 MW 19.2 19.2
Biogas Total 19.2 Biomass
20-50 MW Only 2 Contracts Only 2 Contracts Biomass Total Only 2 Contracts Only 2 Contracts
Small Hydro 0-3 MW Only 2 Contracts Only 2 Contracts
Small Hydro Total Only 2 Contracts Only 2 Contracts Solar Photovoltaic
0-3 MW Only 1 Contract Only 1 Contract 3-20 MW Only 1 Contract Only 1 Contract
Solar Photovoltaic Total Only 1 Contract Only 1 Contract Only 2 Contracts Weighted Average of All
Resources 18.4 Only 1 Contract Only 1 Contract 12.054
54 The weighted average contract price of all resources contracted with IOUs excludes two small hydro contracts as they are priced at short-run avoided cost (SRAC). SRAC reflects the IOU’s costs that would be incurred at that instant to provide power if the QF did not exist as an alternate power source. For more details on the SRAC pricing structure, see: https://www.cpuc.ca.gov/General.aspx?id=5131.

2 02 1 P A D I L L A R E P O R T
C A L I F O RN IA P U B L I C UT I L I T I E S C O M MI S S I O N 29
Table C-2. Weighted Average Contract Price of All Renewable Energy Contracts for 2020 for CCAs (¢/kWh)
Executed in 2020 for CCAs (¢/kWh)
Total Index + REC Total
Biomass Index + REC Only 1 Contract
Biomass Total Only 1 Contract Geothermal
0-3 MW Only 1 Contract 3-20 MW Only 2 Contracts
50-100 MW Only 2 Contracts Geothermal Total 6.4 Only 1 Contract
Small Hydro 3-20 MW 4.8
Index + REC Only 1 Contract Small Hydro Total 4.8 Only 1 Contract
Solar Photovoltaic 0-3 MW 7.6
3-20 MW 4.3 20-50 MW 2.9
50-150 MW 2.8 150-500 MW 2.6 Index + REC 1.4
Solar Photovoltaic Total 2.7 1.4 Various/REC-Only55
Index + REC 1.2 REC-Only 0.4
Wind 3-30 MW Only 2 Contracts
30-65 MW 5 65-250 MW Only 2 Contracts
Index + REC 1.0 Wind Total 4.5 1.0
Weighted Average of All Resources
4.0 1.256
55 The “Various” technology type indicates energy and REC contracts where the technology type of the procurement is not yet known by the buyer. This arrangement occurs when an LSE procures energy and RECs from multiple facilities in a seller’s portfolio. The technology type is known to the buyer when the energy and RECs are delivered to the electricity grid.
56 Excludes Various/REC-Only contracts.

2 02 1 P A D I L L A R E P O R T
C A L I F O RN IA P U B L I C UT I L I T I E S C O M MI S S I O N 30
Table C-3. Weighted Average Contract Price of All Renewable Energy Contracts for 2020 for ESPs (¢/kWh)
Executed in 2020 for ESPs (¢/kWh)
Total Index + REC Total
Biomass
Index + REC 1.2
Biomass Total 1.2
Geothermal
Index + REC 1.0
Geothermal Total 1.0
Small Hydro
Index + REC Only 1 Contract
Small Hydro Total Only 1 Contract
Solar Photovoltaic
0-3 MW Only 1 Contract
Index + REC 1.4
Solar Photovoltaic Total Only 1 Contract 1.4
Various/REC-Only57
Index + REC 1.4
REC-Only 0.4
Wind
Index + REC 1.0
Wind Total 1.0
Weighted Average of All Resources
Only 1 Contract 1.058
57 The “Various” technology type indicates energy and REC contracts where the technology type of the procurement is not yet known by the buyer. This arrangement occurs when an LSE procures energy and RECs from multiple facilities in a seller’s portfolio. The technology type is known to the buyer when the energy and RECs are delivered to the electricity grid.
58 Excludes Various/REC-Only contracts.

2 02 1 P A D I L L A R E P O R T
C A L I F O RN IA P U B L I C UT I L I T I E S C O M MI S S I O N 31
Appendix D: Public Util it ies Code § 913.3(a)–(d)
Text of Public Uti l i t ies Code § 913.3(a)–(d) 913.3. (a) Notwithstanding subdivision (g) of § 454.5 and § 583, no later than May 1 of each year, the commission shall release to the Legislature for the preceding calendar year the costs of all electricity procurement contracts for eligible renewable energy resources, including unbundled renewable energy credits, and all costs for utility-owned generation approved by the commission.
(1) For power purchase contracts, the commission shall release costs in an aggregated form categorized according to the year the procurement transaction was approved by the commission, the eligible renewable energy resource type, including bundled renewable energy credits, the average executed contract price, and average actual recorded costs for each kilowatt-hour of production. Within each renewable energy resource type, the commission shall provide aggregated costs for different project size thresholds.
(2) For each utility-owned renewable generation project, the commission shall release the costs forecast by the electrical corporation at the time of initial approval and the actual recorded costs for each kilowatt-hour of production during the preceding calendar year.
(b) The commission shall report all electrical corporation revenue requirement increases associated with meeting the renewables portfolio standard, as defined in § 399.12, including direct procurement costs for eligible renewable energy resources and renewable energy credits.
(c) The commission shall report all cost savings experienced, or costs avoided, by electrical corporations as a result of meeting the renewables portfolio standard.
(d) This section does not require the release of the terms of any individual electricity procurement contracts for eligible renewable energy resources, including unbundled renewable energy credits, approved by the commission. The commission shall aggregate data to the extent required to ensure protection of the confidentiality of individual contract costs even if this aggregation requires grouping contracts of different energy resource type. The commission shall not be required to release the data in any year when there are fewer than three contracts approved.

2 02 1 P A D I L L A R E P O R T
C A L I F O RN IA P U B L I C UT I L I T I E S C O M MI S S I O N 32
Appendix E: California’s Load Serving Entit ies Operating in 2020
Investor- Owned Utilities (IOUs)
• Pacific Gas and Electric Company (PG&E)
• Southern California Edison (SCE)
• San Diego Gas & Electric (SDG&E)
Small and Multi-Jurisdictional
Utilities (SMJUs)
• Bear Valley Electric Service (BVES)
• Liberty Utilities (formerly CalPeco Electric)
• PacifiCorp
Community Choice Aggregators (CCAs)
•Apple Valley Choice Energy (AVCE)
•Central Coast Community Energy (CCCE)
•City of Baldwin Park•City of Pomona•Clean Energy Alliance•Clean Power Alliance (CPA)
•CleanPowerSF (CPSF)•Desert Community Energy (DCE)
•East Bay Community Energy (EBCE)
•King City Community Power (KCCP)
•Lancaster Choice Energy (LCE)
•Marin Clean Energy (MCE)
•Peninsula Clean Energy (PCE)
•Pico Rivera Innovative Municipal Energy (PRIME)
•Pioneer Community Energy (Pioneer)
•Rancho Mirage Energy Authority (RMEA)
•Redwood Coast Energy Authority (RCEA)
•San Jacinto Power (SJP)•San Jose Clean Energy (SJCE)
•Silicon Valley Clean Energy (SVCE)
•Sonoma Clean Power (SCP)
•Valley Clean Energy Alliance (VCEA)
•Western Community Energy (WCE)
Electric Service Providers (ESPs)
• 3 Phases Renewables
• American PowerNet
• Calpine Energy Solutions
• Calpine Power America
• Commercial Energy of CA
• Constellation New Energy
• Direct Energy Business
• EDF Industrial Power Services
• Just Energy Solutions
• Pilot Power Group
• Shell Energy North America
• Tiger Natural Gas
• UC Regents


