48
2021 Tennessee Maternal Mortality Annual Report Data in this report reflect deaths occurring in calendar years 2017 -2019

2021 Tennessee Maternal Mortality Annual Report
Data in this report reflect deaths occurring in calendar years 2017 -2019

2 | P a g e
TABLE OF CONTENTS
Dedication _______________________________________________________________________________ 4 Acknowledgments 2019 __________________________________________________________________ 5
Members ______________________________________________________________________________ 5 Executive Summary _____________________________________________________________________ 6
Key Findings from 2019 Cases _________________________________________________________ 6 Key Findings from 2017- 2019 combined data __________________________________________ 6
Summary of 2021 Recommendations_____________________________________________________ 8 Maternal Mortality Overview ______________________________________________________________ 9
Objective ______________________________________________________________________________ 9 Background ___________________________________________________________________________ 9 Maternal Mortality in Tennessee Prior to 2017 __________________________________________ 9 The Maternal Mortality Review and Prevention Act_____________________________________ 10 Definitions ____________________________________________________________________________ 10
Maternal Mortality Review Program Process _____________________________________________ 11 Case Identification ____________________________________________________________________ 11 Case Verification _____________________________________________________________________ 11 Case Abstraction _____________________________________________________________________ 14
Pregnancy-Associated Deaths __________________________________________________________ 16 Demographic Highlights ______________________________________________________________ 16 Pregnancy-Associated Mortality Ratio by Region ______________________________________ 17 Timing of Pregnancy-Associated Deaths in Relation to Pregnancy _____________________ 18 Committee Decisions for All Pregnancy-Associated Deaths ____________________________ 19 Pregnancy-Relatedness ______________________________________________________________ 19 Preventability _________________________________________________________________________ 19 Health and Social Conditions Contributing to Maternal Death___________________________ 20
Substance Use Disorder (SUD) _____________________________________________________ 20 Mental Health Conditions ___________________________________________________________ 20 Obesity ____________________________________________________________________________ 20 Violent Deaths _____________________________________________________________________ 21
PREGNANCY-RELATED DEATHS ______________________________________________________ 23 Demographics of Pregnancy-Related Deaths __________________________________________ 23 Timing of Death of Pregnancy-Related Deaths ________________________________________ 24 Underlying Causes of Pregnancy-Related Deaths _____________________________________ 25 Preventability of Pregnancy-Related Deaths ___________________________________________ 26 Substance Use Disorder ______________________________________________________________ 26

3 | P a g e
Mental Health Conditions _____________________________________________________________ 27 Obesity ______________________________________________________________________________ 27 Contributing Factors of Pregnancy-Related Deaths ____________________________________ 27
PregnancY-Associated, but NOT Related Deaths ________________________________________ 29 Demographics ________________________________________________________________________ 29 Underlying Causes of Pregnancy-Associated, but Not Related Deaths _________________ 30 Preventability of Pregnancy-Associated, but Not Related Deaths _______________________ 31 Timing of Death of Pregnancy-Associated, but Not Related Deaths _____________________ 32 Contributing Factors of Pregnancy-Associated, but not Related Deaths _________________ 32
Substance Use and Mental Health in Pregnancy- associated, but not related Deaths, 2017-2019 ___________________________________________________________________________________ 34 Contributing Factors to maternal death 2019 _____________________________________________ 38 Tennessee 2021 Maternal Mortality Review Recommendations ___________________________ 39
Community and Statewide Agencies __________________________________________________ 39 Healthcare Providers _________________________________________________________________ 40 Women and their Friends and Families ________________________________________________ 40
Tennessee MMR Success Stories _______________________________________________________ 41 APPENDICES __________________________________________________________________________ 45
4 | P a g e
DEDICATION The Tennessee Department of Health expresses its gratitude to the countless advocates and partners who have championed the purpose of the Maternal Mortality Review Committee (MMRC) to generate quality data to prevent maternal mortality. We extend our gratitude to all those already implementing the recommendations of this report. Thank you also to the state MMRC for reviewing every one of the deaths and developing recommendations that can save lives. It is with deepest sympathy and respect that we dedicate this report to the memory of those 62 women, and to their loved ones, who died while pregnant or within one year of pregnancy in 2019. Those are 62 deaths too many. We know our efforts to further understand the causes and contributing factors of maternal mortality in Tennessee will prevent future deaths.

5 | P a g e
ACKNOWLEDGMENTS 2019
Chair Morgan McDonald, MD, FAAP, FACP
Deputy Commissioner for Population Health Tennessee Department of Health
TDH Program Staff Ibitola Asaolu, DrPH, MPH
Linda A. Clayton, MD, MPH
Karen Cole-George, FNP-C, RN
Elizabeth Harvey, PHD, MPH
Rachel Heitmann, MS
Erin Hodson, MPH
Bethany Scalise, BSN, RN
Carla Snodgrass, B.S.W, MPA
Denise Werner, MD
Brittany Willis, BS
Members
Jona Bandyopadhyay, MD, MPH
Kitty Cashion, RN-BC, MSN
Michael Caucci, MD
Senator Rusty Crowe
Gina Moore Williams, MD
Stephanie Devane-Johnson, PhD, CNM
Honorable Glenn Funk
Connie Graves, MD
Kelley Hassencahl, RN
Shawn Hollinger, MD
Terry Holmes, MD
Patti Jacobs, BSN, RN
Adele Lewis, MD
Daina Moran, MS, LMFT
Jackie Moreland BSN, RN, MS
Theresa Morrison, MD
Carrie Polin, MD
Michael Richardson, MD
Beth Shelton, LCSW, PMH-C
Cathleen Suto, MD
Danielle Tate, MD
Gilbert Thayer, MD
Representative Brian Terry
Lynlee Wolfe, MD
Parul Zaveri, MD

6 | P a g e
EXECUTIVE SUMMARY
The Tennessee Maternal Mortality Review Act of 2016 established the TN Maternal Mortality Committee (MMRC) (T.C.A. § 63-3-601). An interdisciplinary team from across the state reviews every death and contributes to the annual recommendations of this report. 2017 was the first year of deaths reviewed and established a baseline of data. This year’s report includes 2019 deaths and a compilation of 2017, 2018, and 2019 death data where appropriate. This report describes maternal deaths in Tennessee and the demographic characteristics of women who died while pregnant or within one year of pregnancy. This report also summarizes causes of death and contributing factors. Through a comprehensive review of deaths by the MMRC, this report identifies specific opportunities for prevention of maternal mortality and promotion of women’s health. Below are the key findings and a summary of the recommendations. A full description of the recommendations can be found on page 39.
Key Findings from 2019 Cases
• A total of 62* deaths occurred in 2019 compared to 82 in 2018 and 78 in 2017.
• Pregnancy-related mortality ratio of 28.6 in 2019 compared to 27.2 in 2018.
• Seventy-four percent of all deaths were determined to be preventable, with 21% having a ‘good chance’ of being prevented and 53% of having some chance of being prevented.
• Thirty-seven percent of all deaths were due to pregnancy-related causes, 53% were
pregnancy-associated, but not related deaths and 10% were unable to determine pregnancy relatedness.
• More than 1 in 3 (34%) deaths had substance use disorder as a contributing factor to the
death.
• Acute overdose was the leading cause of pregnancy-associated, but not related deaths while cardiovascular and coronary conditions were the leading cause of pregnancy-related deaths.
Key Findings from 2017- 2019 combined data
• The Committee found 79% of all deaths were preventable, with 32% having a ‘good
chance’ of being prevented and 47% having ‘some chance’ of being prevented. • The leading cause of pregnancy-related death across the three years was cardiovascular
and coronary conditions. • Substance use contributed to the largest number of deaths and primarily occurred in the
pregnancy-associated, but not related deaths.
a. Overdose has been the leading cause of death for three years. There were 40 cases of overdose in pregnancy-associated, but not related deaths during 2017 to 2019.
b. The most common substance indicated in acute overdoses was fentanyl. c. Almost half (47%) of all pregnancy-associated, but not related deaths with substance
use disorder had a co-occurring mental health diagnosis as a contributing factor to death.

7 | P a g e
• Mental health was determined as a contributing factor in 21% of all deaths. These deaths
mostly occurred in non-Hispanic White women (77%).
• Among all deaths, non-Hispanic Black women were 1.5 times as likely to die during or within a year of pregnancy compared to non-Hispanic White women. The disparity is much greater among pregnancy-related causes of death, where non-Hispanic Black women are 3.9 times as likely to die from pregnancy-related causes compared to non-Hispanic White women.
• Pregnancy is a primary eligibility category for TennCare coverage. Women with lower socioeconomic resources can often face complex medical and mental health needs. These needs may be associated with a higher burden of pregnancy-associated deaths.
• Seventeen percent of all deaths were classified as intentional violent death (i.e. homicide
or suicide). Firearms were involved in 57% of violent deaths.
• Obesity contributed to 24% (n=16) of the pregnancy-related deaths. The leading cause of death in which obesity was a factor was preeclampsia.
• A majority of pregnancy-associated, but not related deaths (77%) occurred between 43-365 days postpartum.
• Over a quarter (27%) of pregnancy-related deaths occurred at 7-42 days postpartum, and a
third (33%) occurred at 43-365 days postpartum.
• The highest risk age group was women forty and older. This group was nearly four times as likely to die within one year of pregnancy compared to women less than 30.

8 | P a g e
SUMMARY OF 2021 RECOMMENDATIONS
Community and Statewide Agencies • Healthcare payors should extend insurance coverage for pregnant women to one year postpartum,
including coverage for case management services and home based services. • Community and state agencies should increase mental health providers and provide training to
recognize and intervene in partner violence. • State agencies should continue to educate the public on substance use and mental health and
seek funding to increase services. • Courts should implement measures to protect individuals and families from domestic violence. • Mental health agencies should continue to provide support to women affected by trauma. • Departments of Health, Safety and Transportation should increase education to the public on the
dangers of driving under the influence and importance of seatbelt use. Clinics and Hospital Systems • Facilities should establish policies and procedures for women with substance use disorder
regarding pain management needs during pregnancy, case management upon discharge and referral to resources.
• Hospitals, mental health facilities, primary care and addiction treatment centers should collaborate in patient care throughout the pregnancy and postpartum period.
• Facilities should offer substance use treatment and naloxone to both patients and significant others.
• Hospitals should establish primary and secondary transfer facilities based on levels of care for high-risk patients.
• Facilities should implement national cardiovascular standards of care in pregnancy and the postpartum period.
• Facilities should implement standardized protocols for follow-up and admission in the postpartum period.
• Facilities should implement diversity training to prevent interpersonal racism and bias. • Clinics and hospital systems should post automobile safety tips on websites and via social media
platforms.
Healthcare Providers • Healthcare providers should obtain a full patient history to utilize trauma-informed interventions
when needed. • Providers should ensure high-risk patients are managed with a multidisciplinary team. • Obstetric, primary care and mental health providers should communicate with each other and
ensure patients continue mental health treatment. • Healthcare providers should educate patients about cardiac conditions in pregnancy and the
warning signs of worsening hypertension in pregnancy. • Healthcare providers should educate patients on the need for continued substance use treatment
and address patient concerns of legal prosecution for substance use during pregnancy. • Healthcare providers should educate staff on trauma-informed care in marginalized populations
with substance use disorder.
Women and their Friends and Families • Women should utilize trusted friends, family and medical team members to facilitate healthy
relationships to disrupt pathways toward partner violence. • Women should contact providers with any unusual symptoms during and after pregnancy. • Women, along with their families and friends, should recognize warning signs related to domestic
violence and alert the healthcare team and authorities. • Women should seek education and resources for smoking cessation and addiction in pregnancy.

9 | P a g e
MATERNAL MORTALITY OVERVIEW Objective The objective of this report is to describe the state of maternal mortality in Tennessee from 2017-2019. This report describes the demographic characteristics of maternal deaths and summarize the causes and contributing factors of these deaths. Through a comprehensive review of these deaths by the Tennessee Maternal Mortality Review Committee (MMRC), this report identifies opportunities for prevention of maternal mortality and promotion of women’s health with specific recommendations at the individual/family, community, provider, facility, and systems perspectives. This report is a requirement of the Tennessee Maternal Mortality Review and Prevention Act of 2016.
Background The death of a woman during pregnancy, childbirth, or within the first year postpartum has immediate adverse impacts on a woman’s family and community. Nationally, it is estimated that each year approximately 700 women in the United States die from pregnancy or pregnancy-related complications.1 Racial disparities persist in these statistics as non-Hispanic Black women are three to four times more likely to die from a pregnancy-related complication than non-Hispanic White women.2 Reducing maternal mortality and improving maternal health are national priorities.3 4 Maternal Mortality in Tennessee Prior to 2017 Prior to the implementation of the MMR Program in Tennessee, the state relied on vital statistics alone to identify all deaths among pregnant women or within one year of pregnancy. In 2012, Tennessee introduced a pregnancy checkbox on the death certificate to aid in identifying maternal deaths. Therefore, data prior to 2012 are not comparable due to different case identification methodologies. Based solely on data from vital statistics, on average, 74 Tennessean women died during or within one year of pregnancy each year during 2012-2016. The pregnancy-associated mortality ratio, or the number of pregnancy-associated deaths per 100,000 live births, was 91.6 in 2016, using vital statistics data alone. These data are not comparable to MMRC data, which is the current gold standard. There are limitations in using only vital statistics data to measure and understand maternal mortality. With the noted changes in case identification on the death certificate through the pregnancy checkbox, it is difficult to determine whether changes seen in maternal mortality statistics reflect better ascertainment or actual changes in risk of death.5 There have been errors in reported pregnancy status documented in the literature, which have potentially led to an overestimation of pregnancy-related deaths.6 Prior to the MMR Program in Tennessee, there was no procedure to confirm a pregnancy within these identified cases. In addition, vital statistics data are unable to capture information on whether these deaths were preventable or recommendations that could help eliminate preventable maternal deaths.
1 Building U.S. Capacity to Review and Prevent Maternal Deaths. (2018). Report from nine maternal mortality review committees. Retrieved from http://reviewtoaction.org/Report_from_Nine_MMRCs 2 Pregnancy Mortality Surveillance System. Centers for Disease Control and Prevention. Available at: https://www.cdc.gov/reproductivehealth/maternalinfanthealth/pmss.html 3 Healthy People 2030 [Internet]. Washington, DC: U.S. Department of Health and Human Services, Office of Disease Prevention and Health Promotion [cited [015 January 2020]]. Available from: https://www.healthypeople.gov/node/4897/data_details. 4 Kogan MD, Dykton C, Hirai AH, et al. A new performance measurement system for maternal and child health in the United States. Matern Child Health J. 2015;19(5):945-57. 5 Creanga AA, Callaghan WM. Recent increases in the U.S. maternal mortality rate: disentangling trends from measurement issues [letter]. Obstet Gynecol 2017;129:206–7 6 Baeva S, Saxton DL, Ruggiero K, Kormondy ML, Hollier LM, Hellerstedt J, Hall M, Archer NP. Identifying maternal deaths in Texas using an enhanced method, 2012. Obstet Gynecol. 2018;131(5),762-769.

10 | P a g e
The Tennessee MMR Program provides an opportunity to address the limitations in measurement of maternal deaths. With its establishment in 2017, each maternal death identified through vital statistics data was verified with a comprehensive, standardized process. Additionally, the review of each death by the MMRC enabled further data collection on cause of death, contributing factors, preventability, and recommendations. Since 2017, the MMR program has reviewed 222 maternal mortality cases.
The Maternal Mortality Review and Prevention Act Tennessee established the Maternal Mortality Review (MMR) Program on January 1, 2017 upon the effective date of the Maternal Mortality Review and Prevention Act of 2016 (T.C.A. § 63-3-601). The act was amended in 2020 to include an annual report rather than biennial (T.C.A 68-3-607). The legislation further created the MMRC to review maternal deaths and make determinations regarding the preventability of maternal deaths. Set forth in legislation, the purpose of the MMR Program is to: Identify and address the factors contributing to poor pregnancy outcomes for women and facilitate state systems changes to improve the health of women before, during and after pregnancy. The MMRC is a multidisciplinary expert panel, with representation from public health, obstetrics-gynecology, maternal and fetal medicine, anesthesiology, neonatology, pediatrics, nurse-midwifery, nursing, mental and behavioral health, domestic violence, Hospital Patient Safety, TennCare/Medicaid, District Attorney’s office, the Department of Mental Health and Substance Abuse Services, the Tennessee Senate and House of Representatives, and the State Chief Medical Examiner. The Committee is tasked to review maternal deaths and report recommendations for changes to any law, rule, and policy that would promote the safety and well-being of women and prevention of maternal deaths. Definitions Categorizations of maternal mortality further specify timing and cause of death. A breakdown of the categories can be seen in Figure 1. While some organizations define maternal mortality as only occurring during or within 42 days of pregnancy, the Tennessee Maternal Mortality Review and Prevention Act of 2016 uses the following definitions, which are aligned with the Centers for Disease Control and Prevention’s (CDC) definition:
Pregnancy-associated deaths: The death of a woman during pregnancy or within one year of the end of pregnancy from any cause. This encompasses all qualifying deaths the MMRC reviews. Pregnancy-associated deaths can further be classified into pregnancy-related deaths or pregnancy-associated but not related deaths. • Pregnancy-related deaths: The death of a
woman during pregnancy or within one year of the end of pregnancy from a pregnancy complication, a chain of events initiated by pregnancy, or the aggravation of an unrelated condition by the physiologic effects of pregnancy.
• Pregnancy-associated, but not related deaths: The death of a woman during pregnancy or within one year of the end of pregnancy from a cause that is not related to pregnancy.
Figure 1. Categorization of all Maternal Deaths

11 | P a g e
MATERNAL MORTALITY REVIEW PROGRAM PROCESS The MMR Program process in TN involves four components: case identification, case verification, case abstraction, and case review. This section describes each of these components in detail.
Case Identification The MMR Program coordinates with the TDH Office of Vital Records and Statistics to identify pregnancy-associated deaths. All deaths of female Tennessee residents aged 10-55 years were screened and considered potential cases if they met any of the following criteria:
1. Presence of an International Classification of Diseases (ICD-10) underlying cause of death code that is indicative of pregnancy or childbirth (A34, O00-O99)
2. Linkage with a live birth or a fetal death record that occurred within one year of the woman’s death
3. Checkbox response on the death certificate indicating that the decedent was either: 1) pregnant at time of death, 2) not pregnant, but pregnant within 42 days of death, or 3) not pregnant, but pregnant 43 days to 365 days before death
In 2019, 83 potential pregnancy-associated deaths were flagged through this case identification methodology. See Figure 2 for the case identification sources for these 83 cases that met the initial criteria described above and were sent on for further verification. Forty-eight cases met only one of the three criteria listed above while the remaining thirty-five cases had multiple sources of identification. The most common source of identification was a linkage of a woman’s death with a live birth or fetal death record.
Figure 2: Case Identification Source for Potential Pregnancy-Associated Cases Sent to
MMR Program for Verification, Tennessee 2019
Data sources: Tennessee Department of Health, Office of Vital Records and Health Statistics, Death Statistical File (2019), Birth Statistical File (2019), Fetal Death Statistical File (2019). Case Verification For a case to be considered eligible for review by the MMRC, it first needed to pass through an in-depth verification process to ensure that the woman in question actually was pregnant within a year of her death. As permitted by the state legislation, upon receipt of the initial list of identified cases, the Maternal Mortality Nurse Abstractor requested medical records for all of the decedents. When appropriate, social media, obituaries, news reports and other data sources were
13
3
6
15
16
30
0 5 10 15 20 25 30 35
All Three fields
Cause of death Only
Pregnancy Checkbox +Birth/Fetal Linkage
Pregnancy Checkbox Only
Cause of Death + PregnancyCheckbox
Birth/Fetal Linkage Only
Cas
e Id
entif
icat
ion
Sour
ce

12 | P a g e
investigated. For example, if a case was a homicide, the nurse abstractor would request any police reports and/or social services records in addition to the usual hospital records, autopsy report, and prenatal care and delivery records. Cases were verified as pregnancy-associated deaths, and therefore eligible for review, if records confirmed that the woman was in fact pregnant within one year of death. If the records obtained demonstrated either: 1) a clear contraindication with pregnancy or recent pregnancy (for example, a stated hysterectomy more than one year prior to death in a medical record) or 2) no indication of pregnancy within one year in any record collected, the Maternal Mortality Nurse Abstractor determined that the death was not verified as a pregnancy-associated death and classified as a false positive. False positive cases did not move forward to the case abstraction or review process. Once a case was determined to be a false positive, the Maternal Mortality Nurse Abstractor notified the Office of Vital Records and Health Statistics. The Office of Vital Records and Health Statistics then contacted the death certifier to further investigate and confirm the error (e.g. a death mistakenly being marked pregnant when in actuality there was no evidence of pregnancy). If a mistake could be confirmed, the amendment process was initiated to correct the erroneous information in the death record that led to the case be falsely identified. In 2019, there were 21 false positives identified and 8 of these cases were amended to reflect that the woman in question was not pregnant within a year of her death. Of the 83 cases identified as potential pregnancy-associated deaths, 75% were verified maternal deaths of women while pregnant or within one year of pregnancy; the remaining 21 (25%) were false positives (Figure 3). These 62 confirmed cases were abstracted and reviewed by the Maternal Mortality Review Committee.
Figure 3: Pregnancy-Associated Death Case Verification, Tennessee 2019
Data sources: Tennessee Department of Health, Division of Family Health and Wellness, Maternal Mortality Review Program. As demonstrated in Figure 4, the various identification sources differed in terms of the likelihood of producing false positives. For 2019 cases, 100% of cases linked to a live birth or fetal death within a year of death were confirmed as true cases. The identification source producing the most false positives for 2019 was the pregnancy checkbox on the death certificate. Fifty of the cases had a response to the pregnancy checkbox indicating pregnancy within a year of death, and 32 (64%) of those were confirmed as true cases. Nine of the fifteen cases that had the pregnancy checkbox as the only source of identification were found to be false positives.
False Positive
25% (n=21)
Verified Maternal Deaths
75% (n=62)
False Positive Verified Maternal Deaths

13 | P a g e
Data sources: Tennessee Department of Health, Office of Vital Records and Health Statistics, Death Statistical File (2019), Birth Statistical File (2018-2019), Fetal Death Statistical File (2018-2019). Because each potential case is verified to ensure a true pregnancy within a year of death, the MMR Program data is the optimal data source to calculate the pregnancy-associated mortality ratio (PAMR) for Tennessee. In 2019, the Tennessee PAMR was 77.1 per 100,000 live births compared to 101.6 per 100,000 live births in 2018 (Figure 5), a difference that is not statistically significant. It is important to note that this is not comparable to estimates for 2014-2016, as data for these years was obtained before the MMR process was in place. These deaths did not go through the verification process and the vital records count is likely to include some proportion of false positives. The effect this verification process has on the overall estimate of the burden of pregnancy-associated mortality is substantial. If the MMR Program did not verify the deaths identified using vital statistics data in 2019, the PAMR would have been 34% higher (77.1 vs. 103.2 per 100,000 live births).
13
6
6
7
30
3
9
9
0 10 20 30 40
All Three fields
Cause of death Only
Pregnancy Checkbox + Birth/FetalLinkage
Pregnancy Checkbox Only
Cause of Death + PregnancyCheckbox
Birth/Fetal Linkage Only
Cas
e Id
entif
icat
ion
Sour
ce
Verified Maternal Deaths False Positives
Figure 4: Number of false positive cases by identification source, Tennessee, 2019

14 | P a g e
Figure 5: Pregnancy-Associated Mortality, Tennessee 2014-2016, 2017-2019
Note: The 2017-2019 number of pregnancy-associated deaths and the 2017-2019 pregnancy-associated ratio are not comparable to estimates from 2014-2016; the 2017-2019 data source is the MMR Program while the 2014-2016 data source is Vital Statistics. Data sources: Tennessee Department of Health, Office of Vital Records and Health Statistics, Death Statistical File. Tennessee Department of Health, Division of Family Health and Wellness, Maternal Mortality Review Program. Population estimates based on interpolated data from the U.S. Census’s Annual Estimates of the Resident Population. Case Abstraction One key aspect of the Tennessee MMR Program is the record collection and abstraction process. Once a death is verified, the Maternal Mortality Nurse Consultant identifies the multiple disciplinary aspects of the decedent’s care, which enables a thorough case review. To align with national recommendations, Tennessee utilizes the Maternal Mortality Review Information Application (MMRIA) database from the CDC to capture critical aspects of each case in a standardized format prior to review by the MMR Committee. Documentation in MMRIA represents a wide variety of data sources, and contains multiple forms including: the death certificate, autopsy report, birth certificate, prenatal care record, social and environmental profile, mental health profile, case narrative, and Committee decisions. After each death is fully abstracted, the team utilizes the CDC’s decision form to ensure case review standardization for every verified pregnancy-associated death. This decision form provides guidance on key decisions required for each case, including: • Was the death pregnancy-related? • What was the underlying cause of death? • Was the death preventable? • What factors contributed to the death? • What recommendations may help prevent future deaths? Figure 6 highlights the full maternal mortality review program process.
6880 74 78 82
62
83.3
98.391.6
96.3101.6
77.1
0
20
40
60
80
100
120
0
20
40
60
80
100
120
2014 2015 2016 2017 2018 2019
Preg
nanc
y-As
soci
ated
Mor
talit
y R
atio
(D
eath
s pe
r 100
,000
Liv
e Bi
rths)
Num
ber o
f Pre
gnan
cy-A
ssoc
iate
d D
eath
s
Number of Deaths Rate per 100,000 Live Births

15 | P a g e
Figure 6: Flow Chart MMR Program Process

16 | P a g e
PREGNANCY-ASSOCIATED DEATHS Pregnancy-associated death is the death of a woman during pregnancy or within one year of the end of pregnancy from any cause. From 2017 to 2019, 222 Tennessean women died within one year of pregnancy. Table 1 provides a description of these women by age, race/ethnicity, educational level, insurance type, and geographic location of residence. The table also includes the pregnancy-associated mortality ratio (PAMR), which is the number of pregnancy-associated deaths per 100,000 live births. The PAMR was not calculated for pregnancy-associated death counts less than 11, as estimates based on numbers below this threshold are unreliable. Demographic Highlights The burden of maternal mortality differs across Tennessee. Several demographic groups were found to have greater risk of dying while pregnant or within a year of pregnancy. 1. Women less than 30 years old had the lowest PAMR. The highest risk group was women age
40 and older, who were nearly four times as likely to die within one year of pregnancy compared to women less than 30.
2. Non-Hispanic Black women were approximately 1.5 times as likely to die while pregnant or within one year of pregnancy compared to non-Hispanic White women.
3. Women with less than a high school education (i.e. no high school diploma or GED) were approximately 3 times as likely to die within one year of pregnancy compared to women who had more than a high school education (i.e. at least some college).
4. Across the state of Tennessee, the PAMR was similar for women living in metro and rural counties. The PAMR varied by grand division. The highest PAMR was seen for women living in West Tennessee grand division. There were variations in the rates of PAMR across health regions of Tennessee. West and Shelby health regions had the two highest PAMR (124.1 and 122.8 respectively) while Mid-Cumberland had the lowest PAMR (57.5).

17 | P a g e
Table 1. Demographic Characteristics of All Pregnancy-Associated Deaths, Tennessee, 2017-2019
Characteristics
Pregnancy-Associated Deaths 2017-2019
Pregnancy-Associated
Mortality Ratio
(PAMR) 2017 2018 2019 Total Age at Death Less than 30 years 43 (55%) 41 (50%) 25 (40%) 109 (49%) 72.7 30-39 years 29 (37%) 34 (41%) 36 (58%) 99 (45%) 113.9 40+ years 6 (8%) 7 (9%) 1 (2%) 14 (6%) 264.6 Race/Ethnicity Non-Hispanic White 55 (71%) 51 (62%) 38 (61%) 144 (65%) 91.2 Non-Hispanic Black 18 (23%) 28 (34%) 20 (32%) 66 (30%) 138.9 Other 5 (6%) 3 (4%) 4 (7%) 12 (5%) ─ Education Less than high school 15 (19%) 19(24%) 13 (21%) 47 (21%) 151.1 High school diploma/GED 31 (40%) 34 (41%) 23 (37%) 88 (40%) 129.3 More than high school 29 (37%) 27 (33%) 26 (40%) 82 (37%) 58.0 Not specified 3 (4%) 2 (2%) 1 (2%) 6 (3%) ─ Insurance at Delivery1
TennCare 40 (69%) 43 (61%) 35 (76%) 118 (68%) 101.6 Private 16 (28%) 16 (23%) 9 (20%) 41 (24%) 40.0 Other 0 (0%) 3 (4%) 0 (0%) 3 (2%) ─ None 0 (0%) 5 (7%) 2 (4%) 7 (4%) ─ Unknown 2 (3%) 3 (4%) 0 (0%) 5 (3%) ─ Area of Residence2
Metropolitan county 34 (44%) 35 (43%) 32 (52%) 101 (45%) 95.6 Rural county 44 (56%) 47 (57%) 30 (48%) 121 (55%) 88.6 Grand Division West TN 23 (29%) 31 (38%) 21 (34%) 75 (34%) 125.6 Middle TN 23 (29%) 26 (32%) 28 (45%) 77 (35%) 72.8 East TN 32 (41%) 25 (30%) 13 (21%) 70 (32%) 91.3 Overall 78 82 62 222 91.7
1. Insurance status defined for women with a live birth. This variable excludes insurance status for women without a live birth, i.e. women who died during pregnancy, following a miscarriage, or after a fetal death. 2. Metropolitan county includes: Davidson, Hamilton, Knox, Madison, Shelby, and Sullivan Counties. Percentages may not add to 100 due to rounding. Data sources: Tennessee Department of Health, Division of Family Health and Wellness, Maternal Mortality Review Program. Tennessee Department of Health, Office of Vital Records and Health Statistics, Birth Statistical File, 2017-2019. Population estimates based on interpolated data from the U.S. Census’s Annual Estimates of the Resident Population. Pregnancy-Associated Mortality Ratio by Region Figure 7 adds a more granular view to the grand divisional data presented in Table 1. This regional map shows the same pattern seen in Table 1, with the regions in the western part of the state having the highest rates, the central regions having the lowest, and the eastern regions at an intermediate level. The three year combined PAMR was highest for the West region (124.1

18 | P a g e
pregnancy-associated deaths per 100,000 live births), closely followed by Shelby County (122.8 pregnancy-associated deaths per 100,000 live births). The lowest PAMR was for the Mid-Cumberland region (57.5 pregnancy-associated deaths per 100,000 live births), a rate less than half that seen for the two highest regions. Data for Knox, Madison, Northeast, and Sullivan regions are suppressed because the number of deaths was too low (<11) to calculate a statistically reliable rate. The PAMR for suppressed regions will be added in future years as the data permits. Figure 7. Pregnancy-Associated Mortality Ratio by Region, Tennessee, 2017-2019
Timing of Pregnancy-Associated Deaths in Relation to Pregnancy The majority of pregnancy-associated deaths (61%) occurred 43 days to one year after pregnancy. Eighteen percent of deaths happened when women were pregnant, while 13% of deaths occurred within 7-42 days postpartum. There was a similar representation of maternal deaths on the day of delivery (4%) and within the first six days postpartum (5%) (Figure 8).
Figure 8. Timing of All Pregnancy-Associated Deaths in Relation to Pregnancy, Tennessee, 2017-2019
Data Source: Tennessee Department of Health, Division of Family Health and Wellness, Maternal Mortality Review Program.
18%
4% 5%13%
61%
0102030405060708090
100
Pregnant at thetime of death
Day of delivery 1-6 dayspostpartum
7-42 dayspostpartum
43-365 dayspostpartum
Perc
enta
ge o
f Dea
th
N=222

19 | P a g e
Committee Decisions for All Pregnancy-Associated Deaths Pregnancy-Relatedness Of the 222 pregnancy-associated deaths, 30% of deaths (n=67) were determined to be pregnancy-related and 61% (n=135) were classified as not pregnancy-related by the Committee, meaning these deaths were not a result of the woman’s pregnancy. The Committee was unable to determine pregnancy-relatedness in 9% (n=20) of all cases (Figure 9).
Figure 9. Committee Determination of Pregnancy-Relatedness, Pregnancy-Associated Deaths, Tennessee, 2017-2019
Preventability Deaths were considered preventable if there was at least some chance of the death being averted by one or more reasonable changes at the patient, community, provider, facility, and/or systems factor levels.7 The Committee found that 79% of all pregnancy-associated deaths were preventable, 16% were not preventable and 5% were unable to determine preventability. After a death is determined to be preventable, the Committee determines the chance the outcome could have been averted. This outcome is determined as ‘good’ or ‘some’ chance. Of the 222 cases analyzed, 32% (n=72) were determined to have a ‘good chance’ and 47% (n=104) of them had ‘some chance’ to alter the outcome (Figure 10).
7 Building U.S. Capacity to Review and Prevent Maternal Deaths. (2018). Report from Nine Maternal Mortality Review Committees. http://reviewtoaction.org/Report_from_Nine_MMRCs
30%(n=67)
61% (n=135)
9%(n=20)
Pregnancy-Related
Pregnancy-Associated, but NOT-Related
Pregnancy-Associated butUnable to DeterminePregnancy-Relatedness
PregnancyAssociated Deaths (N=222)
Data Source: Tennessee Department of Health, Division of Family Health and Wellness, Maternal Mortality Review Program.

20 | P a g e
Figure 10. Preventability of All Pregnancy-Associated Deaths, Tennessee, 2017-2019
N=222
Data Source: Tennessee Department of Health, Division of Family Health and Wellness, Maternal Mortality Review Program. Health conditions contributing to most pregnancy-associated deaths are determined by cases where substance use disorder (SUD), mental health condition, and obesity contributed to the death. Deaths where mental health, SUD or obesity were determined to be a factor in a death were determined to be mostly preventable (90%) by the Committee. Health and Social Conditions Contributing to Maternal Death The MMR Committee was asked to determine whether substance use disorder (SUD), mental health conditions or obesity contributed to each death occurring during pregnancy or within one year of pregnancy. Figure 11 provides the percentage of deaths in which these factors contributed. Substance Use Disorder (SUD) About one in three (34%; n=75) pregnancy-associated deaths from 2017-2019 had SUD as a contributing factor (Figure 11). There was a similar representation of women with SUD who resided in metropolitan areas (48%) and rural areas (52%). Deaths to women with SUD did not occur in isolation; forty-seven percent of all deaths with SUD as a contributing factor also had a co-occurring mental health diagnosis as a contributing factor. Mental Health Conditions The Committee determined that a mental health condition was a contributing factor in 21% (n=47) of all pregnancy-associated deaths (Figure 11). The leading cause of death for all pregnancy-associated deaths with a mental health condition contributing to the death was overdose. These deaths mostly occurred among non-Hispanic White women (77%) with similar representation of women living in metropolitan areas (51%) and (49%) living in rural areas. Obesity Nine percent (n=21) of all pregnancy-associated deaths reviewed were determined to have obesity as a contributing factor (Figure 11). The leading cause of death for pregnancy-associated cases with obesity as a contributing factor was preeclampsia/eclampsia while the leading cause for pregnancy-related cases was cardiovascular and coronary disease. Over three out of five (62%) of these deaths were to non-Hispanic Black women. The majority (71%) of these deaths
32%
47%
16%
5%Preventable - Good ChancePreventable - Some ChanceNot PreventableUnable to Determine

21 | P a g e
occurred to women who resided in metropolitan areas. Ninety-five percent of deaths with obesity as a contributing factor were considered preventable.
Figure 11: Health Conditions Contributing for All Pregnancy-Associated Deaths, Tennessee, 2017-2019
Data Source: Tennessee Department of Health, Division of Family Health and Wellness, Maternal Mortality Review Program. Violent Deaths Of the 222 pregnancy-associated deaths reviewed, there were 37 intentional violent deaths: 27 cases of homicide and 10 cases of suicide. Fourteen of the homicides (52%) were a result of intimate partner violence. About half (57%) of violent deaths occurred among non-Hispanic white women. Also, two-thirds of violent deaths (68%) occurred between 43 days and 365 days postpartum. Most (n=90%) suicide deaths were determined to be preventable by the Committee while almost three-quarters (74%) of homicide deaths were determined to be preventable. Firearms were involved in 57% of violent deaths. Contributing Factor Categories in Pregnancy-Associated Deaths The Committee identified contributing factors and categorized them into one of five factor categories in which change in the outcome could have occurred. These five factor categories were patient/family, provider, facility, systems of care, and community. There were a total of 224 contributing factors identified for 2019 pregnancy- associated deaths. The contributing factor levels helped guide discussion for the Committee’s recommendations to prevent maternal death. On average, the Committee identified 4.0 contributing factors per pregnancy-associated death in Tennessee in 2019. Figure 12 provides the percentage of these contributing factors by level. Major themes have been identified from the review of 2019 deaths. These themes that contributed to the 2019 maternal deaths can be seen on page 38.
9%21%
34%
0102030405060708090
100
Obesity Mental Health SUD
Perc
enta
ge o
f Dea
ths
N=222

22 | P a g e
Data Source: Tennessee Department of Health, Division of Family Health and Wellness, Maternal Mortality Review Program.
40%
23%10% 14% 12%
42%
24%
9%13%
12%
26% 26%
12% 13%
22%
0
20
40
60
80
100
Patient/Family Provider Facility Community System
Perc
enta
ge o
f Con
trib
utin
g Fa
ctor
s
2017 2018 2019
2017: N=2842018: N=3612019: N=224
Figure 12. Contributing Factor Categories for Pregnancy-Associated Deaths, Tennessee, 2017-2019

23 | P a g e
PREGNANCY-RELATED DEATHS Demographics of Pregnancy-Related Deaths Pregnancy-related deaths are deaths to women during pregnancy or within one year of the end of pregnancy from a pregnancy complication, a chain of events initiated by pregnancy, or the aggravation of an unrelated condition by the physiologic effects of pregnancy. Between 2017 and 2019, a total of 67 deaths were classified as pregnancy-related by the Committee, representing 30% of all pregnancy-associated deaths. The pregnancy-related mortality ratio (PRMR), or number of pregnancy-related deaths per 100,000 live births, for the three years combined was 27.7. Table 2 describes the demographic characteristics of the pregnancy-related cases for 2017-2019, including age, race/ethnicity, educational level, insurance type, and geographic location of residence. The table also includes the PRMR estimates for the subgroups shown, based on the combined data for 2017-2019. The PRMR is suppressed (i.e., marked with a dash) when the combined 2017-2019 count was less than 11, as estimates based on counts below this threshold are unreliable. Pregnancy-related mortality was not experienced equally by all groups of women. From 2017-2019, there were substantial differences in the PRMR for women based on their race/ethnicity, age, education level, insurance type, and location of residence.
o Non-Hispanic Black women were about four times as likely to die from a pregnancy-related cause compared to Non-Hispanic White women.
o Women aged 30 to 39 were about three times as likely to die from a pregnancy-related cause compared to women less than 20. The number of cases amongst women 40 and older was too low to allow for a reliable comparison, but future reports with additional years of data will address the increased risk seen nationally for this group.
o Women with a high school education or less were more likely to die from a pregnancy-related cause compared to women who had more than a high school education.
o Across the state of Tennessee, women who lived in the West Grand Division were most likely to die from a pregnancy-related cause.
Location of Death The location of deaths can vary by clinical setting (in-patient vs. outpatient, or nursing home), decedent’s home, or other settings (e.g. road, in motor vehicle crashes). The location of death varied among the 67 cases of pregnancy-related deaths in 2017-2019. Specifically, these deaths took place in:
1. Inpatient clinical settings: 58% percent (n=39) of pregnancy-related deaths occurred in inpatient clinics/hospitals. In this category, the primary cause of death included blood clots, cardiovascular disease, sepsis, cancer and hemorrhage.
2. Outpatient settings/emergency room: Almost 1 in 5 (18%, n=12) pregnancy-related deaths happened in outpatient clinical settings or the emergency room. The main cause of these deaths as determined by Committee included pulmonary embolism, eclampsia, and cardiovascular disease.
3. The remaining proportion occurred at decedent’s home (n=8), nursing home/long-term care facility (n=1), or other location (n=4), or pronounced dead on arrival (n=1).

24 | P a g e
Table 2. Demographic Characteristics of Pregnancy-Related Deaths, Tennessee, 2017-2019
Characteristics
Pregnancy-Related Deaths 2017-2019 Pregnancy-
Related Mortality Ratio (PRMR) 2017 2018 2019 Total
Age at Death Less than 30 years 10 (45%) 8 (36%) 6 (26%) 24 (36%) 16.0 30-39 years 9 (41%) 11 (50%) 17 (74%) 37 (55%) 42.6 40+ years 3 (14%) 3 (14%) 0 (0%) 6 (9%) ─ Race/Ethnicity Non-Hispanic White 12 (55%) 10 (45%) 6 (26%) 28 (42%) 17.7 Non-Hispanic Black 8 (36%) 11 (50%) 14 (61%) 33 (49%) 69.4 Other 2 (9%) 1 (5%) 3 (13%) 6 (9%) ─ Education High school education or less 10 (45%) 12 (55%) 10 (43%) 32 (48%) 32.3 More than high school 12 (55%) 10 (45%) 12 (52%) 34 (51%) 24.1 Not specified 0 (0%) 0 (0%) 1 (4%) 1 (1%) ─ Insurance at Delivery1 TennCare 8 (53%) 10 (48%) 9 (64%) 27 (54%) 23.2 Private 7 (47%) 9 (43%) 4 (29%) 20 (40%) 19.5 Other 0 (0%) 1 (5%) 0 (0%) 1 (2%) ─ None 0 (0%) 0 (0%) 1 (7%) 1 (2%) ─ Unknown 0 (0%) 1 (5%) 0 (0%) 1 (2%) ─ Area of Residence Metropolitan county 11 (50%) 10 (45%) 16 (70%) 37 (55%) 35.0 Rural county 11 (50%) 12 (55%) 7 (30%) 30 (45%) 22.0 Grand Division West TN 6 (27%) 11 (50%) 9 (39%) 26 (39%) 43.5 Middle TN 10 (45%) 6 (27%) 12 (52%) 28 (42%) 26.5 East TN 6 (27%) 5 (23%) 2 (9%) 13 (19%) 17.0 Overall 22 22 23 67 27.7
1. Insurance status defined for women with a live birth. This variable excludes insurance status for women without a live birth, i.e. women who died during pregnancy, following a miscarriage, or after a fetal death. Data Source: Tennessee Department of Health, Division of Family Health and Wellness, Maternal Mortality Review Program. Population estimates based on interpolated data from the U.S. Census’s Annual Estimates of the Resident Population. Timing of Death of Pregnancy-Related Deaths Of the pregnancy-related deaths from 2017 to 2019, 18% occurred during pregnancy, 12% occurred on the day of delivery, 10% occurred 1 to 6 days postpartum, 27% occurred 7 to 42 days postpartum, and 33% occurred 43 to 365 days postpartum (Figure 13).

25 | P a g e
Figure 13: Timing of Pregnancy-Related Deaths, Tennessee, 2017-2019
Data Source: Tennessee Department of Health, Division of Family Health and Wellness, Maternal Mortality Review Program. Underlying Causes of Pregnancy-Related Deaths Underlying causes of pregnancy-related deaths were grouped into eight categories, based on classification from Building U.S. Capacity to Review and Prevent Maternal Deaths.8 Figure 14 provides the number of pregnancy-related deaths by underlying cause of death category. The most common cause of pregnancy-related death was cardiovascular and coronary conditions, followed by preeclampsia and eclampsia. For the categorization of the underlying causes of death, please see Appendix 1.
Figure 14: Leading Underlying Causes of Pregnancy-Related Deaths,
Tennessee, 2017-2019
8 Building U.S. Capacity to Review and Prevent Maternal Deaths. (2018). Report from nine maternal mortality review committees. Retrieved from http://reviewtoaction.org/Report_from_Nine_MMRCs
18%12% 10%
27%33%
0
20
40
60
80
100
Duringpregnancy
Day of delivery 1-6 dayspostpartum
7-42 dayspostpartum
43-365 dayspostpartum
Perc
enta
ge o
f Dea
ths
N=67
7
4
6
7
8
9
10
16
0 5 10 15 20
Other
Violence
Infection
Embolism
Mental health conditions
Hemorrhage
Preeclampsia and eclampsia
Cardiovascular and coronary conditions
Number of Deaths
N=67
Data Source: Tennessee Department of Health, Division of Family Health and Wellness, Maternal Mortality Review Program

26 | P a g e
Preventability of Pregnancy-Related Deaths
The Committee determined that 90% (n=60) of the pregnancy-related deaths for 2017-2019 were potentially preventable (Figure 15). Of these 60 preventable deaths, the Committee determined that there was a ‘good chance’ the death could have been averted for 40% (n=24) of the cases and ‘some chance’ for the remaining 60% (n=36) of the cases (Figure 16).
Figure 15. Preventability of Pregnancy-Related Deaths, Tennessee, 2017-2019
N=67
Data Source: Tennessee Department of Health, Division of Family Health and Wellness, Maternal Mortality Review Program.
Figure 16. Committee’s Determination on Chance to Alter Outcome for Pregnancy-Related Deaths, Tennessee, 2017-2019
Data Source: Tennessee Department of Health, Division of Family Health and Wellness, Maternal Mortality Review Program. Substance Use Disorder The Committee determined that substance use disorder contributed to 16% (n=11) of the pregnancy-related deaths between 2017 and 2019 (Figure 17). Of the 11 cases with substance use disorder as a contributing factor, five involved an acute overdose. Most cases succumbed to
90%(n=60)
9%(n=6)
1%(n=1)
PreventableNot preventableUnable to determine
36%
54%
9%1%
0
20
40
60
80
100
Good chance Some chance No chance Unable todetermine
Perc
enta
ge o
f Dea
ths
N=67

27 | P a g e
chronic health conditions complicated or aggravated by substance use. Seven of the 11 cases also had mental health conditions as a contributing factor to their death. Mental Health Conditions Mental health conditions contributed to 19% (n=13) of the pregnancy-related deaths (Figure 17). Five of these 13 cases were confirmed suicide deaths and one was determined to be a probable suicide. The Committee determined suicide deaths to be pregnancy-related if the pregnancy was demonstrated to be an aggravating factor to the woman’s mental health or to have initiated a chain of events culminating in her suicide. Obesity Obesity contributed to 24% (n=16) of the pregnancy-related deaths (Figure 17). Seven of the 16 cases had preeclampsia or eclampsia as the underlying cause of death.
Figure 17. Health Conditions for Pregnancy-Related Deaths, Tennessee, 2017-2019
Data Source: Tennessee Department of Health, Division of Family Health and Wellness, Maternal Mortality Review Program.
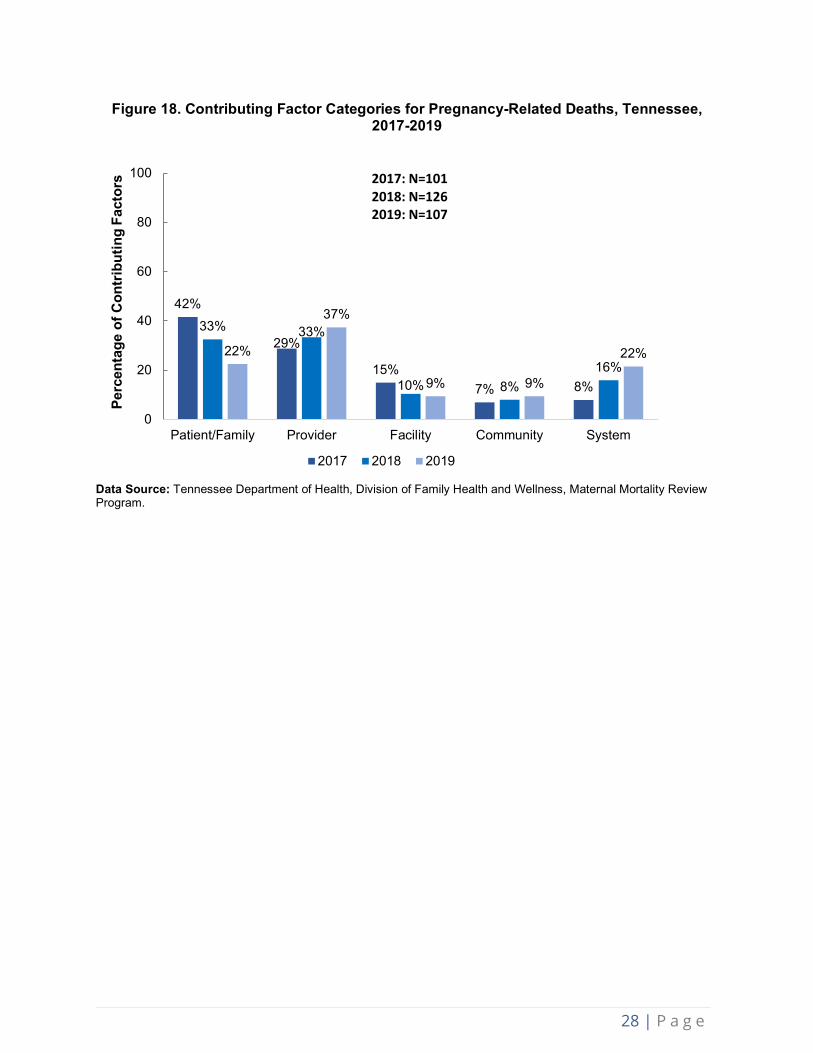
Contributing Factors of Pregnancy-Related Deaths For each pregnancy-related case, the Committee identified specific factors that had contributed to the woman’s death. Contributing factors were identified in five categories: patient/family, provider, facility, system of care and community. Among the 23 pregnancy-related deaths in 2019, the Committee described a total of 107 contributing factors. On average, the Committee identified 4.9 contributing factors for each pregnancy-related death during 2019. The distribution of contributing factors by category among pregnancy-related deaths is shown in Figure 18. In 2019, most contributing factors amongst pregnancy-related deaths were in the provider category, which accounted for 37% of the total factors for this year. The percentage of factors identified at the patient/family level has declined steadily since 2017. Examining contributing factors among each pregnancy-related case fosters the Committee’s discussion on prevention recommendations. Major themes have been identified over the course of the review of 2019 deaths. These themes that contributed to the 2019 maternal deaths can be seen on page 38.
24%19% 16%
0
20
40
60
80
100
Obesity Mental health Substance use disorder
Perc
enta
ge o
f Dea
ths
N=67
28 | P a g e
Figure 18. Contributing Factor Categories for Pregnancy-Related Deaths, Tennessee,
2017-2019
Data Source: Tennessee Department of Health, Division of Family Health and Wellness, Maternal Mortality Review Program.
42%
29%
15%7% 8%
33% 33%
10% 8%16%
22%
37%
9% 9%
22%
0
20
40
60
80
100
Patient/Family Provider Facility Community System
Perc
enta
ge o
f Con
trib
utin
g Fa
ctor
s
2017 2018 2019
2017: N=1012018: N=1262019: N=107
29 | P a g e
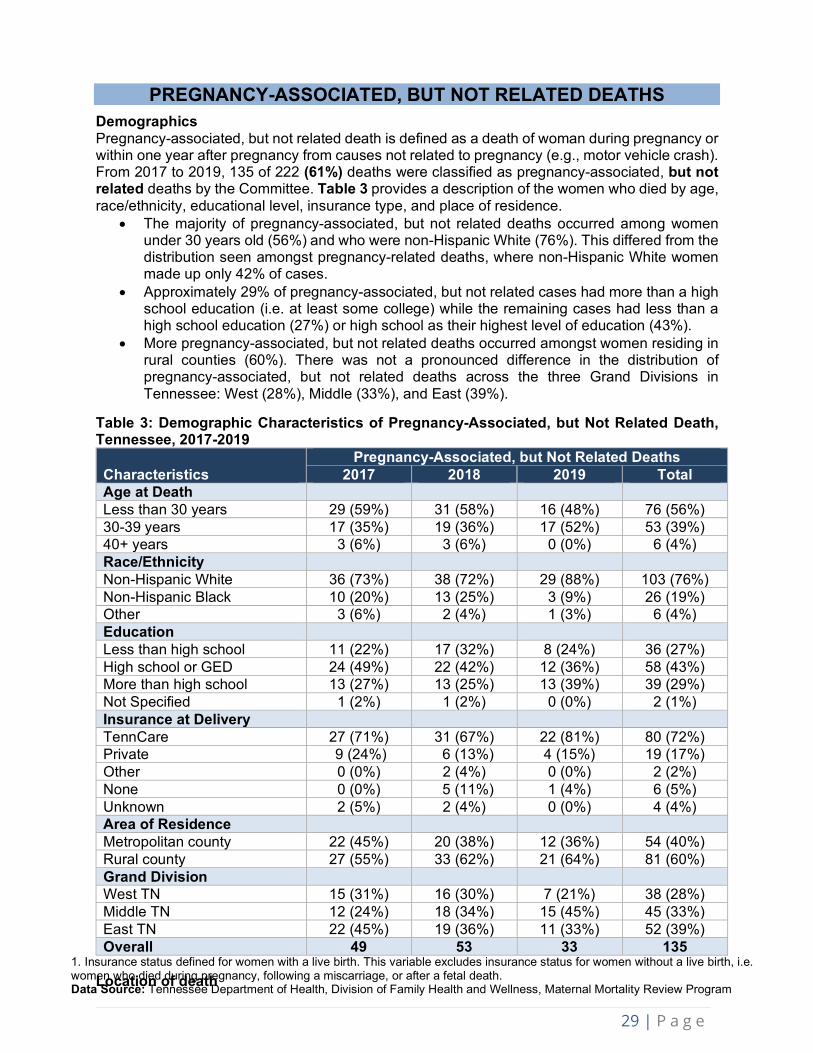
PREGNANCY-ASSOCIATED, BUT NOT RELATED DEATHS Demographics Pregnancy-associated, but not related death is defined as a death of woman during pregnancy or within one year after pregnancy from causes not related to pregnancy (e.g., motor vehicle crash). From 2017 to 2019, 135 of 222 (61%) deaths were classified as pregnancy-associated, but not related deaths by the Committee. Table 3 provides a description of the women who died by age, race/ethnicity, educational level, insurance type, and place of residence.
• The majority of pregnancy-associated, but not related deaths occurred among women under 30 years old (56%) and who were non-Hispanic White (76%). This differed from the distribution seen amongst pregnancy-related deaths, where non-Hispanic White women made up only 42% of cases.
• Approximately 29% of pregnancy-associated, but not related cases had more than a high school education (i.e. at least some college) while the remaining cases had less than a high school education (27%) or high school as their highest level of education (43%).
• More pregnancy-associated, but not related deaths occurred amongst women residing in rural counties (60%). There was not a pronounced difference in the distribution of pregnancy-associated, but not related deaths across the three Grand Divisions in Tennessee: West (28%), Middle (33%), and East (39%).
Table 3: Demographic Characteristics of Pregnancy-Associated, but Not Related Death, Tennessee, 2017-2019
Characteristics Pregnancy-Associated, but Not Related Deaths
2017 2018 2019 Total Age at Death Less than 30 years 29 (59%) 31 (58%) 16 (48%) 76 (56%) 30-39 years 17 (35%) 19 (36%) 17 (52%) 53 (39%) 40+ years 3 (6%) 3 (6%) 0 (0%) 6 (4%) Race/Ethnicity Non-Hispanic White 36 (73%) 38 (72%) 29 (88%) 103 (76%) Non-Hispanic Black 10 (20%) 13 (25%) 3 (9%) 26 (19%) Other 3 (6%) 2 (4%) 1 (3%) 6 (4%) Education Less than high school 11 (22%) 17 (32%) 8 (24%) 36 (27%) High school or GED 24 (49%) 22 (42%) 12 (36%) 58 (43%) More than high school 13 (27%) 13 (25%) 13 (39%) 39 (29%) Not Specified 1 (2%) 1 (2%) 0 (0%) 2 (1%) Insurance at Delivery TennCare 27 (71%) 31 (67%) 22 (81%) 80 (72%) Private 9 (24%) 6 (13%) 4 (15%) 19 (17%) Other 0 (0%) 2 (4%) 0 (0%) 2 (2%) None 0 (0%) 5 (11%) 1 (4%) 6 (5%) Unknown 2 (5%) 2 (4%) 0 (0%) 4 (4%) Area of Residence Metropolitan county 22 (45%) 20 (38%) 12 (36%) 54 (40%) Rural county 27 (55%) 33 (62%) 21 (64%) 81 (60%) Grand Division West TN 15 (31%) 16 (30%) 7 (21%) 38 (28%) Middle TN 12 (24%) 18 (34%) 15 (45%) 45 (33%) East TN 22 (45%) 19 (36%) 11 (33%) 52 (39%) Overall 49 53 33 135
Location of death
1. Insurance status defined for women with a live birth. This variable excludes insurance status for women without a live birth, i.e. women who died during pregnancy, following a miscarriage, or after a fetal death. Data Source: Tennessee Department of Health, Division of Family Health and Wellness, Maternal Mortality Review Program

30 | P a g e
Of the 135 pregnancy-associated but not-related deaths between 2017 and 2019, 97 of them had information on the location of death. These deaths occurred in: 1. Inpatient settings: Twenty-six percent (n=35) of pregnancy-associated, but not related
deaths occurred in inpatient clinic or hospitals. 2. Outpatient settings/ emergency room: Twenty-one percent (n=28) pregnancy associated
but not related deaths took place in the outpatient clinical settings. 3. Home: Seventeen percent (n=23) of pregnancy-associated, but not related deaths
happened in a home. The remaining proportion of pregnancy-associated, but not related deaths happened at hospice (n=3) or other location (n=29). The other pregnancy-associated deaths were declared dead on arrival (n=8) or not specified (n=3).
Underlying Causes of Pregnancy-Associated, but Not Related Deaths Underlying causes of pregnancy-associated, but not related deaths were grouped into eight categories, which are defined in Appendix 2. Figure 19 provides the number of deaths by each of the categories. The three leading causes of pregnancy-associated, but not related deaths were acute overdose (n=40), motor vehicle crashes (n=37), and violence (n=24). Violent deaths include homicides, suicides, and accidental firearm deaths.
Figure 19. Leading Underlying Causes of Pregnancy-Associated, but Not Related Deaths, Tennessee, 2017-2019
Data Source: Tennessee Department of Health, Division of Family Health and Wellness, Maternal Mortality Review Program.
1
5
7
9
12
24
37
40
0 10 20 30 40
Undetermined
Cardiac
Cancer
Other natural causes
Fatal disease related tounderlying substance use
Violence
Motor vehicle crash
Acute overdose
Number of Deaths
N=135

31 | P a g e
Preventability of Pregnancy-Associated, but Not Related Deaths The Committee determined that 79% (n=107) of the pregnancy-associated but not related deaths for 2017-2019 were potentially preventable (Figure 20). Of the 107 preventable deaths, the Committee determined that there was a ‘good chance’ the death could have been averted for 34% (n=46) of the cases cases and some chance for 45% (n=61) of the cases (Figure 21).
Figure 20. Preventability of All Pregnancy-Associated, but Not Related Deaths,
Tennessee, 2017-2019
N=135
Data Source: Tennessee Department of Health, Division of Family Health and Wellness, Maternal Mortality Review Program.
Figure 21. Committee’s Determination on Chance to Alter Outcome for Pregnancy-
Associated, but Not Related Deaths, Tennessee, 2017-2019
Data Source: Tennessee Department of Health, Division of Family Health and Wellness, Maternal Mortality Review Program.
79%(n=107)
19%(n=25)
2%(n=3)
PreventableNot preventableUnable to determine
34%45%
19%
2%0
20
40
60
80
100
Good chance Some chance No chance Unable todetermine
Perc
enta
ge o
f Dea
ths
N=135

32 | P a g e
Timing of Death of Pregnancy-Associated, but Not Related Deaths From 2017 to 2019, over three-fourths (77%) of deaths took place between 43 and 365 days postpartum, compared to just 16% during pregnancy, 1% between one and six days postpartum, and 6% from seven to 42 days postpartum (Figure 22).
Figure 22. Timing of Pregnancy-Associated, but Not Related Deaths, Tennessee, 2017-2019
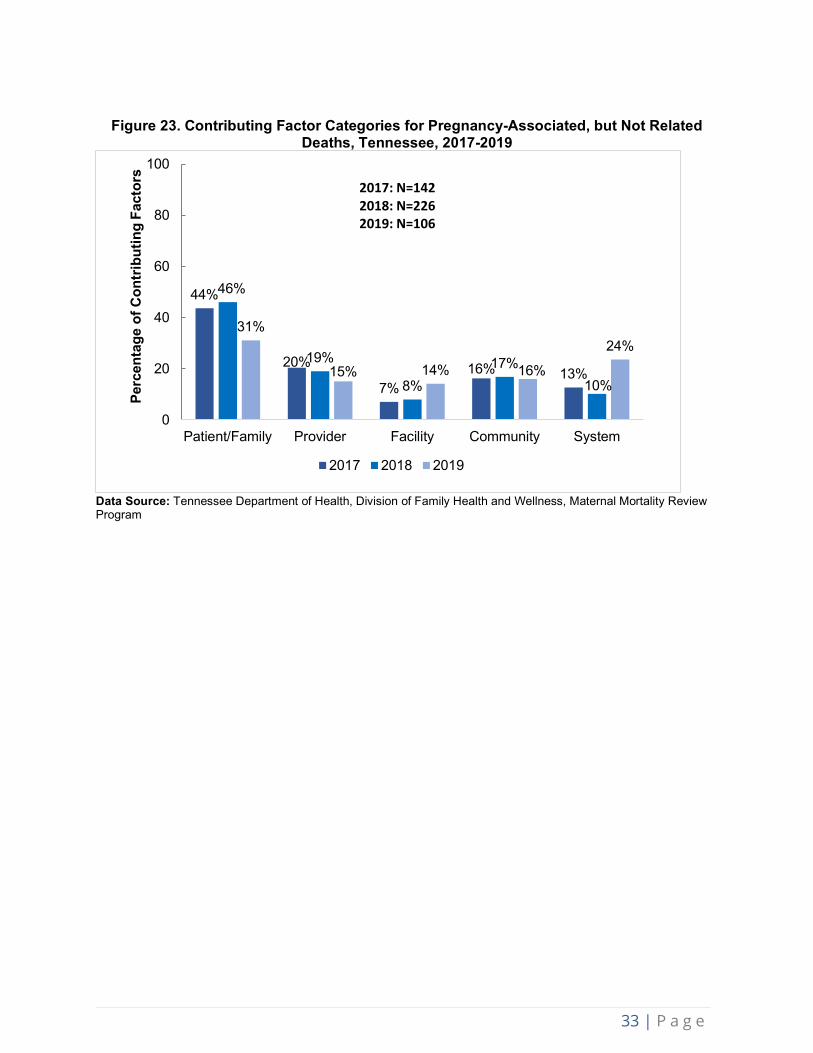
Data Source: Tennessee Department of Health, Division of Family Health and Wellness, Maternal Mortality Review Program. Contributing Factors of Pregnancy-Associated, but not Related Deaths The Committee identified contributing factors among the pregnancy-associated, but not related deaths. Similar to pregnancy-related deaths, these cases were also multi-factorial events, with contributing factors occurring in multiple categories. These categories are individual/family, provider, facility, community, systems of care. In 2019, the Committee identified 106 contributing factors among pregnancy-associated but not related deaths. On average, the Committee found 3.5 factors that contributed to each pregnancy-associated, but not related death in Tennessee. The distribution of contributing factors by category among preventable pregnancy-associated, but not related deaths is shown in Figure 23. The largest proportion of contributing factors among preventable pregnancy-associated, but not related deaths were in the patient/family category (31%), followed by the systems of care category (24%). Compared to pregnancy-related deaths, pregnancy-associated but not related deaths had higher proportions of contributing factors in the patient/family and community categories, and smaller proportions in the provider category. The contributing factors identified for 2019 pregnancy-associated, but not related cases had multiple consistent themes. These themes of contributing factors that played a major role across the 2019 maternal deaths can be seen on page 38.
16%
0% 1%6%
77%
0
20
40
60
80
100
Duringpregnancy
Day of delivery 1-6 dayspostpartum
7-42 dayspostpartum
43-365 dayspostpartum
Perc
enta
ge o
f Dea
ths
N=135
33 | P a g e
Figure 23. Contributing Factor Categories for Pregnancy-Associated, but Not Related Deaths, Tennessee, 2017-2019
Data Source: Tennessee Department of Health, Division of Family Health and Wellness, Maternal Mortality Review Program
44%
20%
7%16% 13%
46%
19%
8%17%
10%
31%
15% 14% 16%
24%
0
20
40
60
80
100
Patient/Family Provider Facility Community System
Perc
enta
ge o
f Con
trib
utin
g Fa
ctor
s
2017 2018 2019
2017: N=1422018: N=2262019: N=106

34 | P a g e
SUBSTANCE USE AND MENTAL HEALTH IN PREGNANCY- ASSOCIATED, BUT NOT RELATED DEATHS, 2017-2019
Substance Use and Mental Health Substance use disorder (SUD) and mental health conditions contributed to substantial percentages of pregnancy-associated deaths from 2017 to 2019 (Figure 24). Although SUD and mental health conditions were also contributing factors in several pregnancy-related cases, these two factors contributed more to the aggregate pregnancy-associated, but not related deaths. The Committee determined that SUD was a contributing factor in 46% of pregnancy-associated, but not related deaths (Figure 24). Table 4 provides a detailed description of the demographic characteristics of these 62 cases. Of this group of pregnancy-associated, but not related cases for which substance use disorder was found to be a contributing factor:
• Seventy-nine percent were non-Hispanic White women. • Fifty-six percent were less than 30 years. • Fourty-eight percent lived in East Tennessee Grand Division.
Figure 24. Health Conditions for Pregnancy-Associated, But Not Related Deaths,
Tennessee, 2017-2019
Data Source: Tennessee Department of Health, Division of Family Health and Wellness, Maternal Mortality Review Program.
2%
22%
46%
0
10
20
30
40
50
60
70
80
90
100
Obesity Mental Health SUD
Perc
enta
ge o
f Dea
ths
N=135

35 | P a g e
Table 4: Demographic Characteristics of SUD in Pregnancy-Associated, But Not Related Deaths, Tennessee, 2017-2019 Pregnancy-Associated, but Not Related Deaths with
Substance Use Disorder as Contributing Factor Characteristics 2017 2018 2019 Total Age at Death Less than 30 years 12 (55%) 14 (61%) 9 (53%) 35 (56%) 30-39 years 9 (41%) 9 (39%) 8 (47%) 26 (42%) 40+ years 1 (5%) 0 (0%) 0 (0%) 1 (2%) Race/Ethnicity Non-Hispanic White 17 (77%) 17 (74%) 15 (88%) 49 (79%) Non-Hispanic Black 4 (18%) 5 (22%) 2 (12%) 11 (18%) Other 1 (5%) 1 (4%) 0 (0%) 2 (3%) Education Less than high school 4 (18%) 10 (44%) 3 (18%) 17 (27%) High school or GED 5 (23%) 9 (39%) 9 (53%) 23 (37%) More than high school 12 (54%) 3 (13%) 5 (29%) 20 (32%) Not Specified 1 (5%) 1 (4%) 0 (0%) 2 (3%) Insurance at Delivery1
TennCare 14 (74%) 15 (71%) 12 (86%) 41 (76%) Private 4 (21%) 1 (5%) 1 (7%) 6 (11%) None 0 (0%) 5 (24%) 1 (7%) 6 (11%) Unknown 1 (5%) 0 (0%) 0 (0%) 1 (2%) Area of Residence Metropolitan County 10 (45%) 11 (48%) 7 (41%) 28 (45%) Rural County 12 (55%) 12 (52%) 10 (59%) 34 (55%) Grand Division West TN 6 (27%) 5 (22%) 4 (24%) 15 (24%) Middle TN 3 (14%) 4 (17%) 10 (59%) 17 (27%) East TN 13 (59%) 14 (61%) 3 (17%) 30 (48%) Overall 22 23 17 62
1. Insurance status defined for women with a live birth. This variable excludes insurance status for women without a live birth, i.e. women who died during pregnancy, following a miscarriage, or after a fetal death. Percentages may not add to 100 due to rounding. Data Source: Tennessee Department of Health, Division of Family Health and Wellness, Maternal Mortality Review Program. Population estimates based on interpolated data from the U.S. Census’s Annual Estimates of the Resident Population. Mental Health: Forty-two percent (n=26) of the 62 pregnancy-associated, but not related cases with a SUD also had a co-occurring mental illness as a contributing factor to the death. In these cases, the Committee noted anxiety, bipolar disorder depression, history of physical and sexual abuse, and suicide attempt as conditions contributing to maternal death. Substances Involved in Overdose Deaths Between 2017 and 2019, there were a total of 40 acute overdose deaths among pregnancy-associated, but not related cases. Figure 25 depicts the substances involved in these 40 cases. All, but seven of these incidents involved multiple substances, meaning that the total number of substances shown in Figure 25 is greater than the number of overdose deaths.

36 | P a g e
• Fentanyl was the single most common substance, present in 26 of the 40 total overdose deaths (65%). Of these 26 cases involving fentanyl, it was the only substance present for three cases and found in combination with other substances for 23 cases.
• Heroin was the next most common opioid, identified in nine of the 40 overdose deaths (23%), as the single substance for three cases and in combination with other substances for six cases.
• Opiates falling into the ‘Other Opioid’ category include oxycodone, oxymorphone, morphine, hydrocodone, hydromorphone, buprenorphine, and U-47700. These substances were involved in 25 total overdose deaths, sometimes in combination with fentanyl or heroin.
• Across the 40 overdose deaths, 34 (85%) involved at least one opiate. • Cocaine and methamphetamine, grouped together into the ‘Stimulants’ category in Figure 16,
were present in 20 of the 40 (50%) overdose deaths. • Alprazolam (brand name Xanax) and ethanol (alcohol) were present in 14 and six of overdose
deaths respectively and always in combination with other substances.
Figure 25. Type of Substances involved in Pregnancy-Associated, but Not Related Acute Overdose Deaths, Tennessee, 2017-2019
Notes: There were a total of 40 acute overdose deaths among pregnancy-associated, but not related cases in 2017 to 2019 combined. Because most of these deaths involved multiple substances, the total number of substances involved in these cases is greater than the number of overdose deaths. Other opioids include oxymorphone, oxycodone, morphine, hydromorphone, hydrocodone, buprenorphine, noroxycodone, and U-47700. Stimulants include methamphetamine and amphetamine (14 polysubstance overdoses) and cocaine (one single substance overdose, 6 polysubstance overdoses). Data Source: Tennessee Department of Health, Division of Family Health and Wellness, Maternal Mortality Review Program. Timing of Death in SUD Deaths The vast majority of pregnancy-associated, but not related deaths with a SUD occurred between 43 and 365 days postpartum (82%) (Figure 26).
3 1 3
23
2025
14
66
0
5
10
15
20
25
30
Fentanyl Stimulants Other Opioids Alprazolam Ethanol Heroin
Num
ber o
f Ove
rdos
e D
eath
s In
volv
ing
Subs
tanc
e U
se
Substance Type
Single Substance Overdose Polysubstance Overdose

37 | P a g e
Figure 26. Timing of Death: SUD in Pregnancy-Associated, Not Related Deaths, 2017-2019
Data Source: Tennessee Department of Health, Division of Family Health and Wellness, Maternal Mortality Review Program.
Contributing factors were identified at five levels: patient/family, provider, facility, system of care and community. Among pregnancy-associated but not related cases with an SUD, the largest proportion of contributing factors was identified at the patient/family level (Figure 27). Examples of these factors included lack of adherence to treatment for SUD, delay in seeking treatment, lack of social support, and history of depression.
Figure 27. Factor-Level Contributing in SUD and Pregnancy-Associated, Not
Related Deaths, 2017-2019
Data Source: Tennessee Department of Health, Division of Family Health and Wellness, Maternal Mortality Review Program
11%
0% 0%6%
82%
0
10
20
30
40
50
60
70
80
90
100
Pregnant at thetime of death
Day of delivery 1-6 dayspostpartum
7-42 dayspostpartum
43-365 dayspostpartum
Perc
enta
ge o
f Dea
ths
44%
21%9% 15% 11%
37%
23%
10%17% 13%
26% 22% 19%13%
20%
0
20
40
60
80
100
Patient/Family Provider Facility Community System
Perc
enta
ge o
f Con
trib
utin
g Fa
ctor
s
2017 2018 2019
2017=1002018=1492019=54
N=62

38 | P a g e
CONTRIBUTING FACTORS TO MATERNAL DEATH 2019 Throughout the maternal mortality review process the MMRC identifies factors that have contributed to each death. Contributing factors are categorized by patient and family, provider, facility, systems, and community. Further discussion occurs by the committee to describe how each factor contributed to the death. Major themes have been identified over the course of the review of 2019 deaths. Themes were identified by calculating the number of similar contributing factors for each level. The themes that contributed to the 2019 maternal deaths include: Pregnancy-Related 1. Community: Lack mental health providers, resources and education in addition to stigma
associated with mental health disorders. 2. Systems: No autopsy ordered for cases related to pregnancy. 3. Facility: Lack of protocols for patient education regarding signs and symptoms of pregnancy
related complications and follow-up care. 4. Provider: Lack of adherence to protocols for appropriate treatment and diagnosis. Gaps in
care for hemorrhage, preeclampsia, mental health and chronic disease noted among providers.
5. Patient/Family: Patient leaving against medical advice.
Pregnancy-Associated, but Not Related 1. Community: Lack of public education on safe driving practices such as adherence to seatbelt
use. 2. Systems: Limited education from public, private, volunteer organizations, and churches on
safe driving practices. 3. Facility: Late and limited prenatal care with positive urine drug screens with no follow up or
referrals indicated. 4. Provider: No referrals to resources or treatment for substance use disorder during pregnancy
or postpartum period. 5. Patient/Family: Driving while impaired and not following traffic safety laws such as seatbelt
adherence.

39 | P a g e
TENNESSEE 2021 MATERNAL MORTALITY REVIEW RECOMMENDATIONS
Community and Statewide Agencies 1. Healthcare payors should assure insurance coverage for women of child bearing age to
include the first trimester of pregnancy up to one year postpartum at a minimum. In addition, healthcare payors should educate providers about case management resources available to patients and implement policies to cover all home visits for high-risk women during pregnancy and the postpartum period.
2. Community and statewide agencies should implement suicide prevention strategies, increase mental health providers trained to facilitate approaches to disrupt pathways towards partner violence, and combat stigma associated with mental health issues.
3. TDH and TDMHSAS should continue to educate the public about the importance of SUD treatment and available resources. TDMHSAS should seek funding to expand access to treatment for women with SUD.
4. Juvenile and family courts should put policies in place to protect individuals and families from domestic violence. These policies should include language about restricting access to guns for felony offenders, maximizing sentencing for repeat offenders, and providing intimate partner violence resources.
5. TDH and TDMHSAS should continue to provide education, treatment, support services, and referrals regarding the long-term effects of trauma to women experiencing domestic violence and substance use throughout pregnancy and the postpartum period
6. TDH and Department of Safety should increase social media messages, webinars and educational materials to reduce driving under the influence, discourage riding with a driver under the influence of drugs or alcohol, and increase seatbelt use. These materials should be available for clinics and hospitals to utilize for patient education.
Clinics and Hospital Systems 1. Facilities should establish substance use policies and protocols to include: substance use
screening upon admission, pain management in the postpartum period for those with substance use disorder and referrals to case management to determine follow up needs during and after pregnancy. Facilities should increase communication, education, and referral to substance use resources.
2. Hospitals, behavioral health facilities and addiction treatment centers should work together with obstetric and primary care providers to ensure adequate communication, care coordination, routine screening, assessments and follow-up throughout pregnancy and the postpartum period for those who have significant substance misuse and mental health issues. Additionally, these systems should improve access to drug and alcohol treatment programs for both inpatient and outpatient settings for pregnant and postpartum women.
3. Facilities should offer treatment for patients, significant others or family to assist them to abstain from substance use. Facilities should educate and supply naloxone upon discharge.
4. Hospitals should establish primary and secondary transfer facilities based on needed levels of care for high-risk patients, bed availability, and specialties. Hospitals should implement protocols for improved communication between facilities for bed capacity and transfer.
5. Facilities should implement national cardiovascular standards of care for women in pregnancy and the postpartum period. Providers should receive education on the physiologic changes in pregnancy that may affect cardiovascular disease and provide thorough education to patients and their families regarding warning signs for acute cardiac decompensation.
6. Facilities should implement protocols to ensure appropriate follow-up care for patients during the postpartum period. Protocols should include standardized instructions for postpartum patients admission.

40 | P a g e
7. Facilities should implement diversity training to prevent interpersonal racism and bias in their health system. Training should address prevention of racism and bias while conducting one-on-one patient care, communicating with colleagues and charting patient records.
8. Clinics and hospital systems should post automobile safety tips on websites and via social media platforms with particular focus on dangers of driving under the influence, risks of riding with a driver under the influence of drugs or alcohol, and benefits to increase seatbelt use.
Healthcare Providers 1. All medical providers should obtain a full patient history to utilize trauma-informed
interventions during and after pregnancy to ensure proper treatment and intervention. Providers should integrate a full assessment of medical, psychiatric and social determinants of health when providing care to include an ACE screening and the Edinburgh Postnatal Depression Scale (EPDS) and other validated tools. Providers should continue to decrease stigma and biases of substance use and mental health disorder at every opportunity.
2. Providers should ensure that high-risk patients have management with a multidisciplinary team including a case coordinator, medical navigator, obstetrician, and maternal fetal medicine specialist to ensure appropriate patient follow up and communication between facilities, clinicians and patients during and after pregnancy.
3. Providers should communicate with each other to determine if patients should continue their mental health medications during and after pregnancy. Clinicians should provide education on accessing help and support for postpartum depression.
4. Providers should educate patients on the risk of worsening hypertension in pregnancy. If a diagnosis of hypertension is given, providers should ensure patients are aware of the full risks of the diagnosis and instruct patients to follow up.
5. Providers should educate patients on the following: the need for continued treatment of substance use disorders during the peripartum period; risks of untreated illness and relapse; and benefits of naloxone to prevent death from overdose.
6. Healthcare providers should educate staff on trauma informed care in marginalized populations with substance use disorders to decrease discrimination, stigma and racism within various potential points of care and engender a sense of trust from the patient.
Women and their Friends and Families 1. Family members, social workers, mental health providers and other trusted adults should
assist women to develop skills that facilitate healthy relationships and disrupt pathways toward partner violence.
2. Women should contact the cardiologist or maternal fetal medicine specialist with increased symptoms during and after pregnancy or anytime they feel something is not right.
3. Women, their family members, and friends should look for domestic violence warning signs, and review any signs they are experiencing with their providers. Consider engaging a trusted family member, social worker or counselor to resolve domestic disputes related to child custody and other conflicts.
4. Women should seek out resources for smoking cessation and addiction in pregnancy. Family and friends should provide support to these women to assist them to quit smoking.

41 | P a g e
TENNESSEE MMR SUCCESS STORIES
Tennessee Hospital Association (THA) Needs Assessment:
Identifying Maternal Health Training Needs
The Tennessee Hospital Association (THA) conducted an assessment to determine training needs with Regional Perinatal Centers and birthing hospitals. Facilities were assessed to determine their educational requirements of staff regarding postpartum hemorrhage, preeclampsia and/or hypertensive disorders of pregnancy, maternal sepsis, venous thromboembolism (VTE), intimate partner violence and mental health. Key findings from the needs assessment are highlighted below.
Regional Perinatal Centers: There are five Regional Perinatal Centers in Tennessee. All five Centers indicated they provided education on postpartum hemorrhage via outreach educators with 40% providing monthly education. Eighty percent of the centers indicated providing training on preeclampsia and/or hypertensive disorders of pregnancy with 40% indicating either quarterly or monthly trainings. Sixty percent indicated never providing education on sepsis. Forty percent indicated quarterly VTE education. A large portion of responses throughout this assessment was indicated in the other categories in which educators responded education was initiated upon request from each facility.
Birthing Hospitals: Out of the 58 birthing hospitals, 38 (65%) responded to the needs assessment. About half (52%, n= 20) of responding hospitals reported annual education regarding postpartum hemorrhage, preeclampsia and/or hypertensive disorders of pregnancy, maternal sepsis and VTE. An average of 15% of hospitals noted semi-annual education practices. Other responses included quarterly, upon hire, and random in-servicing.
Learning Gaps Addressed: Facilities were asked to identify gaps in maternal health training, along with strategies to address those gaps, throughout their facilities. Thirty-six birthing hospitals hospitals responded. Significant gaps in intimate partner violence (IPV) and mental health trainings were reported. Two-thirds (67%) of birthing hospitals reported a gap in IPV and 83% (n=36) in mental health training. Themes from learning gaps and suggested strategies can be seen in this image.
Moving forward: THA has implemented a virtual webinar series
focused on reducing maternal mortality. In 2020 THA hosted
webinars educating healthcare providers on hypertension and cardiovascular disease in
pregnancy along with education on implicit bias. In 2021, a simulation training focused on pre-
eclampsia will be developed for hospitals to utilize.

42 | P a g e
Tennessee Initiative for Perinatal Quality Care (TIPQC):
Providing Best Practices to Hospitals
TIPQC has initiated the Alliance for Innovation on Maternal Health (AIM) patient safety bundle on opioid use disorder (OUD). Throughout this project, TIPQC has implemented quality measures to optimize care for women with OUD in pregnancy. Participating hospitals include:
The hospitals listed participated in the implementation of quality assurance measures to improve maternal and infant outcomes in correlation with opioid use in pregnancy. The quality measures included improvement in treatment plans, preparation for labor and birth, breastfeeding, newborn care and child safety, neonatal abstinence syndrome (NAS) reduction strategies, home safety, domestic violence prevention and Narcan education and distribution for overdose. Strategies included inter-professional teams, policy development, provider education, communication strategies, and multidisciplinary collaboration.
TIPQC has also provided learning sessions to provide best practices to healthcare providers throughout this project. Learning sessions include reducing the stigma associated with OUD, treatment options, child protective services role, early intervention systems, medication assisted treatment (MAT) experts and OUD expert panel discussions. Past learning session recordings can be viewed here: https://tipqc.org/past-learning-sessions/
In addition to the OUD AIM bundle, education was provided directly to hospitals via the Speakers Bureau on top causes of maternal mortality. The Speakers Bureau consists of subject matter experts on key maternal mortality topics. Speakers can be requested by healthcare facilities to educate staff on best practices, furthering the efforts to reduce maternal morbidity and mortality. Topics include OUD in pregnancy, Maternal Hypertension, Postpartum Hemorrhage and Health Equity. Requests can be made by submitting a request here: https://tipqc.org/speakers-bureau/
• Erlanger Health System
• Tennova Harton Tullahoma
• Hardin Medical Center • Tristar Centennial Women’s and Children’s
• Henry County Medical Center
• Tristar Horizon Medical Center
• Jackson-Madison County General
Hospital
• University of Tennessee Medical Center, Knoxville
• Johnson City Medical Center
• Vanderbilt University Medical Center
• Regional One Health
• West Tennessee Healthcare Dyersburg
• St. Thomas Midtown Hospital

43 | P a g e
TDH Provides Community Grants:
Addressing Maternal Mortality Recommendations at the Community Level
In February 2020, the Tennessee Department of Health (TDH) released a request for application seeking innovative projects that would impact the 2019 maternal mortality recommendations. Applicants could apply for a grant up to $20,000 to implement activities within their communities.
With this first round of funding, the Tennessee Primary Care Association (TPCA) was awarded a grant to provide trainings to Federally Qualified Health Center (FQHC) staff on key issues identified by the Maternal Mortality Review Committee. Training sessions were delivered virtually during summer 2020 covering implicit bias, best practices in maternal health care, and domestic violence. The presenters were available for technical assistance sessions after each training. Throughout the course of the training sessions there were 73 participants. The correct responses on the pre/post-test for the implicit bias training increased from 60% to 82%. In the best practices and interpersonal violence post-tests the majority of participants indicated they would utilize what they learned within their practices.
Looking forward
In August 2020, TDH released another request for applications with this round of funding seeking projects to impact the 2020 maternal mortality recommendations. Applicants could apply for up to $20,000 with a proposal that addressed a minimum of one of the recommendations. With this second round of funding, Chattanooga Hamilton Health Authority, East Tennessee State University, St. Thomas Hospital, and Vanderbilt University Medical Center were funded to implement projects addressing the 2020 Maternal Mortality Committee’s recommendations. The projects will start in January 2021 and recommendations being addressed will include: Education on seatbelt use, education on intranasal naloxone, protocols for treatment of substance use, resources for improving maternal mental health, education for gun owners on firearm safety, best practices for provider preeclampsia management, implicit bias training for healthcare staff, provider screening and management of high risk conditions, protocols and treatment of cardiac conditions, preconception counseling and education to women on establishing early pregnancy diagnosis and prenatal care. Health disparities will be addressed within each implemented activity.
To sign up for future funding opportunity notifications please submit your form here: https://www.tn.gov/health/funding-opportunities.html
44 | P a g e
TDH Expands Maternal Health Task Force:
82 Community Members Join Together to Improve Maternal Health
TDH established the Maternal Health Task Force following the release of the first state annual report in February 2019, to continue the process of implementing the Maternal Mortality Review Committee’s (MMRC) recommendations. The mission of the Maternal Health Task Force is to improve and maintain the health of those who are pregnant before, during and after pregnancy, by developing and implementing strategies that align with the MMR Committee recommendations. The vision is to reduce maternal deaths and eliminate disparities in maternal health outcomes. The Tennessee Maternal Health Task Force is comprised of 82 different representatives at the consumer, provider, payer, community, and state level. Through data and recommendations identified from the MMR Annual Report, the Task Force addresses critical gaps in the provision of maternity care services across the state.
Partners from across the state share best practices in their implementation of MMRC’s recommendations. Best practices shared have included bias training, doula training, perinatal mood disorders, and provider training on best practices.
The roles of the task force members include the following:
• Assist with development of strategies to impact the MMRC recommendations
• Attend and actively participate in quarterly webinars
• Provide updates from their organization on the webinars about progress on strategies
• Serve as a subject matter expert
• Promote and disseminate information from the MMR annual report
• Share information on existing practices, resources and programs to improve maternal health
Anyone interest in joinng the Maternal Health Task Force can go to this link to complete the membership information: State of Tennessee (formstack.com)

45 | P a g e
APPENDICES Appendix 1: Pregnancy-Related Cause of Death Categories
Category Specified Cause of Death Indicated on Decision Form
Cardiovascular and Coronary
Conditions
Vascular Aneurysm/Dissection (non-cerebral), other cardiovascular disease, including CHF Cardiac Hypertrophy, Cardiac Fibrosis, Non-Acute Myocarditis/NOS, Other Cardiovascular Disease, including CHF, Cardiomegaly, Cardiac Hypertrophy, Cardiac Fibrosis, Non-Acute Myocarditis/NOS, Postpartum/Peripartum Cardiomyopathy, Postpartum/peripartum cardiomyopathy, Valvular Heart Disease Congenital and Acquired, Cardiomyopathy, Vascular Aneurysm /Dissection (non-cerebral), other cardiovascular disease, including CHF Cardiac Hypertrophy, Cardiac Fibrosis, Non-Acute Myocarditis/NOS, other cardiovascular disease, including CHF Cardiac Hypertrophy, Cardiac Fibrosis, Non-Acute Myocarditis/NOS, Hypertensive cardiovascular disease, Conduction defects/arrhythmias, Cardiomyopathy, other cardiovascular disease, including CHF Cardiac Hypertrophy, Cardiac Fibrosis, Non-Acute Myocarditis/NOS
Embolism Embolism thrombotic, Embolism non-cerebral, Embolism Thrombotic (non-cerebral), Embolism-Thrombotic (non-cerebral)
Hemorrhage
Hemorrhage - Uterine Atony/Postpartum Hemorrhage, Placenta Accreta/Increta/Percreta, Cerebrovascular Accident, Ruptured Ectopic Pregnancy, Hemorrhage-uterine atony/postpartum hemorrhage, hemorrhage due to Primary DIC, Hemorrhage (Excludes Aneurysms or CVA), Ruptured Ectopic Pregnancy, Hemorrhage due to primary DIC (obsolete).
Infection Non-Pelvic Infections (e.g. Pneumonia, TB, Meningitis, HIV), Sepsis/Septic Shock, Sepsis/Septic Shock, Non-Pelvic Infections (e.g. Pneumonia, TB, Meningitis, HIV), Sepsis/septic shock, Other infections/NOS.
Pre-eclampsia and Eclampsia
Chronic Hypertension with Superimposed Preeclampsia, Eclampsia, Eclampsia, Preeclampsia, Chronic Hypertension with Superimposed Preeclampsia, Preeclampsia, Eclampsia.
Mental Health Mental health conditions, Depression, Other psychiatric conditions/NOS, Mental health conditions, Other psychiatric conditions/NOS, Depression, Depression.
Other Cancer, asthma, Neurologic/neurovascular conditions (excluding CVA’s), Obesity, Cancer, Cancer, Cancer

46 | P a g e
Appendix 2: Pregnancy-Associated but Not Related Cause of Death Categories
Category Specified Cause of Death Indicated on Decision Form
Overdose
Probable acute fentanyl intoxication, Acute fentanyl and sertraline intoxication and acute bronchopneumonia, Multiple drug toxicities, fentanyl overdose, combined toxicities, Acute methamphetamine toxicity, heroin overdose, Combined drug toxicity, Acute combined drug intoxication, combined fentanyl and cocaine intoxication, Combined Fentanyl and Alprazolam Intoxication, Fentanyl and Heroin Toxicity, Heroin Overdose, Oxymorphone, Diphenhydramine, and Methamphetamine toxicity, Heroin Overdose, Cocaine Overdose, Acute Combined Drug Overdose (Alprazolam, Hydromorphone, Oxycodone and methamphetamine), Acute Combined Drug Toxicity (Cocaine Methamphetamine, Heroin), Acute Morphine, Fentanyl and Methamphetamine Intoxication, Probable Multi-drug Intoxication (Buprenorphine, Oxycodone, and Ethanol), Acute combined drug toxicity (alprazalom, Fentanyl, and Oxycodone), Acute Fentanyl Toxicity, Combined Fentanyl and Ethanol Intoxication, Combined Drug Overdose, Toxic overdose fentanyl, toxic effects of fentanyl, Overdose fentanyl and methamphetamine, Combined drug toxicity - morphine, fentanyl, methamphetamine, citalopram, Acute overdose, Benzodiazepine and opioid intoxication, Overdose, Acute Overdose, Acute Overdose, Methamphetamine and fentanyl toxicity, Fentanyl and methamphetamine toxicity, Acute overdose.
Fatal Disease Related to Underlying
Substance Use
Dilated cardiomyopathy/polysubstance abuse, acute respiratory failure/septic shock/endocarditis/IV drug use, multi-organ failure/septic shock due to MRSA bacterium/suspect IV drug use, Methicillin-resistant Staphylococcus aureus sepsis due to endocarditis, due to intravenous narcotism/methamphetamine toxicity endocarditis, fungal endocarditis/substance use disorder, acute bronchopneumonia/seizure disorder/substance use disorder, Endocarditis Staph Aureus, Complications of Bacterial Endocarditis with Mobile Vegetation, Complications of Acute Infectious Endocarditis, Sepsis due to Endocarditis, MRSA septicemia with organ injury, Severe lymphocytic myocarditis, pulmonary hypertension /cor pulmonale, pneumonia, acute kidney injury, septic cardiac valve vegetations
Violence
Gunshot wound to the head, Multiple stab wounds, Penetrating gunshot wound to the abdomen, Gunshot Wound to Head, Suicide Attempt by Hanging, Blunt Force injuries to the Head and Sharp Force Injuries, Gunshot wound (homicide), Gunshot Wound of the Neck, Homicide, Multiple Gunshot wounds, Homicide, Homicide, MVC, Multiple Blunt Force Trauma/Homicide

47 | P a g e
Motor Vehicle Accident (MVA)
Motor vehicle collision, Multiple blunt force injuries due to MVA, Blunt trauma to the head, Asphyxia due to drowning, Craniocerebral injuries, Motor Vehicle Crash, Multiple Blunt Force Injuries, Head Injury, Blunt Force Trauma, MVC, MVC, Drowning, Blunt Force Trauma, Multiple Blunt Force Injuries/ATV Crash, MVC, MVC, Blunt force trauma, Blunt force trauma
Cardiac Related Deaths
Cardiac (Dilated Cardiac Hypertrophy ) Fatal arrhythmia
Other Medical Related
Diagnosis
Fulmanent adrenal hemorrhage, Central venous thrombosis, Acute asthma exacerbation, Sepsis, Sudden Unexpected Death in Epilepsy, Uncal Herniation/Effacement Left lateral Ventricular System, Acute Pancreatitis
Cancer Leukocytosis (AML), breast cancer, sarcoma, Metastatic Adenocarcinoma of the Lung
Undetermined Extensive Subarachnoid Hemorrhage with Intraventricular Hemorrhage

48 | P a g e
Appendix 3: Tables 1. Demographic Characteristics of All Pregnancy-Associated Deaths, Tennessee, 2017-2019 2. Demographic Characteristics of Pregnancy-Related Deaths, Tennessee, 2017-2019 3. Demographic Characteristics of Pregnancy-Associated, but Not Related Death, Tennessee, 2017-2019 4. Demographic Characteristics of SUD in Pregnancy-Associated, But Not Related Deaths, Tennessee, 2017-2019 Appendix 4: Figures 1. Categorization of All Maternal Deaths. 2. Case Identification Source for 83 Potential Pregnancy-Associated Cases Sent to MMR
Program for Further Verification, Tennessee 2019 3. Pregnancy-Associated Death Case Verification, Tennessee 2019 4. Number of false positive cases by identification source, Tennessee, 2019 5. Pregnancy-Associated Mortality, Tennessee 2014-2016, 2017-2019 6. Flow Chart MMR Program Process 7. Pregnancy-Associated Mortality Ratio by Region, Tennessee, 2017-2019 8. Timing of All Pregnancy-Associated Deaths in Relation to Pregnancy, Tennessee, 2017-2019 9. Committee Determination of Pregnancy-Relatedness, Pregnancy-Associated Deaths,
Tennessee, 2017-2019 10. Preventability of All Pregnancy-Associated Deaths, Tennessee, 2017-2019 11. Health Conditions Contributing for All Pregnancy-Associated Deaths, Tennessee, 2017-
2019 12. Contributing Factor Categories for Pregnancy-Associated Deaths, Tennessee, 2017-2019 13. Timing of Pregnancy-Related Deaths, Tennessee, 2017-2019 14. Leading Underlying Causes of Pregnancy-Related Deaths, Tennessee, 2017-2019 15. Preventability of Pregnancy-Related Deaths, Tennessee, 2017-2019 16. Committee’s Determination on Chance to Alter Outcome for Pregnancy-Related Deaths,
Tennessee, 2017-2019 17. Health Conditions for Pregnancy-Related Deaths, Tennessee, 2017-2019 18. Contributing Factor Categories for Pregnancy-Related Deaths, Tennessee, 2017-2019 19. Leading Underlying Causes of Pregnancy-Associated, but Not Related Deaths, Tennessee,
2017-2019 20. Preventability of All Pregnancy-Associated, but Not Related Deaths, Tennessee, 2017-2019 21. Committee’s Determination on Chance to Alter Outcome for Pregnancy-Associated, but Not
Related Deaths, Tennessee, 2017-2019 22. Timing of Pregnancy-Associated, but Not Related Deaths, Tennessee, 2017-2019 23. Contributing Factor Categories for Pregnancy-Associated, but Not Related Deaths,
Tennessee, 2017-2019 24. Health Conditions for Pregnancy-Associated, But Not Related Deaths, Tennessee, 2017-
2019 25. Type of Substances involved in Pregnancy-Associated, but Not Related Acute Overdose
Deaths, Tennessee, 2017-2019 26. Timing of Death: SUD in Pregnancy-Associated, Not Related Deaths, 2017-2019 27. Factor-Level Contributing in SUD and Pregnancy-Associated, Not Related Deaths, 2017-
2019
* March 25, 2021 update: An additional case meeting review criteria was identified after publication of this report. Analysis for the 2022 report will include this case with 2019 data.


