2030 Socioeconomic Forecasts By Data Analysis Subzones For the MRCOG Region Methodology and Forecast Summary Population, Housing and Employment Variables Bernalillo, Sandoval, Torrance, Valencia and Southern Santa Fe Counties of Central New Mexico July 2007 Mid-Region Council of Governments of New Mexico Preparation of this document was financed in part through funds made available by the Federal Highway Administration, the Federal Transit Administration, the Economic Development Administration, and U.S. Department of Commerce.
Transcript
2030 Socioeconomic Forecasts By Data Analysis Subzones
For the MRCOG Region
Methodology and Forecast Summary
Population, Housing and Employment Variables
Bernalillo, Sandoval, Torrance, Valencia and Southern Santa Fe Counties of Central New Mexico
July 2007
Mid-Region Council of Governments of New Mexico
Preparation of this document was financed in part through funds made available by the Federal Highway Administration, the Federal Transit Administration, the Economic Development Administration, and U.S.
Department of Commerce.
Mid Region Council of Governments of New Mexico
Lawrence Rael, Executive Director
Principal Author: Kendra Watkins, Senior Data Analyst Contributing Staff: Dave Abrams, Demographer Shohreh Day, GIS/Systems Analyst Carol Earp, GIS Analyst/Cartographer Carol Foster, Research Analyst Jack Lord, Transportation Program Manager Mark Sprick, Transportation Planning Manager Loretta Tollefson, Special Projects Manager Other Key Contributors: Bureau of Business and Economic Research, University of New Mexico New Mexico Department of Workforce Solutions MRCOG Transportation Program Technical Group MRCOG Transportation Coordinating Committee Planning Technologies, LLC Regional Economic Models, Inc. Municipal officials and planners Tribal Governors and planners Land Grant Presidents and planners
Table of Contents Executive Summary ..................................................................................................................... 1
Introduction .................................................................................................................... 1 Data Collection .............................................................................................................. 2 Land Use Model ............................................................................................................ 3 Population Forecast ....................................................................................................... 3 Employment Forecast .................................................................................................... 7
Methodology ................................................................................................................................ 11 Overview ........................................................................................................................ 11 Established Control Totals ............................................................................................. 13
Population ....................................................................................................... 13 Group Quarters Population ............................................................................. 14 Population in Households ................................................................................ 15 Households ..................................................................................................... 16 Housing Units .................................................................................................. 17 Housing Type .................................................................................................. 18 Employment by Sector .................................................................................... 19 Public School Enrollment ................................................................................ 23 UNM Enrollment .............................................................................................. 24 CNM Enrollment .............................................................................................. 25 Kirtland Air Force Base ................................................................................... 25 Tribal Lands ..................................................................................................... 27
Built Land Use Layers ................................................................................................... 30 Existing Land Use ........................................................................................... 31 Known Development ....................................................................................... 32 Planned Development ..................................................................................... 32 Redevelopment ............................................................................................... 33 Undevelopable Lands ...................................................................................... 34
Run the Land Use Allocation Module ............................................................................ 35 Site Suitability Evaluation ................................................................................ 35 LAM Output ..................................................................................................... 36
Develop DASZ Forecast ................................................................................................ 38 Population Variables ....................................................................................... 38 Employment Conversions ............................................................................... 40 Income Quintiles .............................................................................................. 40 Public School Enrollment ................................................................................ 40 UNM and CNM Enrollment .............................................................................. 41
Refine and Finalize Forecast ......................................................................................... 42
FIGURES Figure 1: MRCOG Region ............................................................................................................ 1 Figure 2: Historical and Forecast Population, MRCOG Region ................................................... 4 Figure 3: Forecast Population Distribution by County .................................................................. 5 Figure 4: Subarea Population, 2004 and 2030 ............................................................................ 6 Figure 5: Historical and Forecast Employment, MRCOG Region ................................................ 7 Figure 6: Forecast Employment Distribution by County ............................................................... 8 Figure 7: Subarea Employment, 2004 and 2030 ......................................................................... 9 Figure 8: MRCOG’s Socioeconomic Forecasting Process .......................................................... 11 Figure 9: Sub-Model Integration within the Land Use Modeling Process ..................................... 13 Figure 10: LAM Land Use Layers ................................................................................................ 31 Figure 11: 2030 Land Use Forecast for the Metropolitan Area .................................................... 37 TABLES Table 1: Forecast Population Change by County ........................................................................ 4 Table 2: Forecast Employment Change by County ..................................................................... 7 Table 3: Forecast Population by County ...................................................................................... 14 Table 4: Forecast Group Quarters Population by County ............................................................ 14 Table 5: Forecast Population in Households by County .............................................................. 16 Table 6: Forecast Average Household Size by County ............................................................... 16 Table 7: Forecast Households by County .................................................................................... 17 Table 8: Forecast Occupancy Rates by County ........................................................................... 18 Table 9: Forecast Housing Units by County ................................................................................. 18 Table 10: Forecast Multi-Family Units by County ........................................................................ 19 Table 11: BBER Forecast for Nonagricultural Employment by Sector, Albuquerque MSA .......... 20 Table 12: Short Range Employment Forecast by Sector, MRCOG Region ................................. 21 Table 13: Summary of the Three Employment Forecast Methods ............................................... 22 Table 14: Long Range Employment Forecast by Sector, MRCOG Region ................................. 23 Table 15: Projection Factors for Pubic School Enrollment ........................................................... 24 Table 16: Forecast Public School Enrollment, MRCOG Region .................................................. 24 Table 17: Forecast UNM Enrollment ............................................................................................ 25 Table 18: Forecast CNM Enrollment ............................................................................................ 25 Table 19: Historical Population, Housing and Employment on KAFB .......................................... 26 Table 20: Forecast Population, Housing and Employment on KAFB ........................................... 26 Table 21: Forecast Population, Housing, and Housing Units on Tribal Land ............................... 27 Table 22: Forecast Population and Housing by Pueblo or Reservation Area .............................. 28 Table 23: Forecast Employment by Sector on Tribal Land .......................................................... 29 Table 24: Forecast Employment by Pueblo or Reservation Area ................................................ 29 Table 25: Factors for Household Size .......................................................................................... 39 APPENDICIES Appendix A: Participants in the Forecast Process ....................................................................... 43 Appendix B: 2004 Socioeconomic Estimate by DASZ ................................................................. 45 Appendix C: 2030 Socioeconomic Forecast by DASZ ................................................................. 61 Appendix D: DASZ Maps ............................................................................................................. 77 Appendix E: 2004 Socioeconomic Estimate by Subarea ............................................................. 83 Appendix F: 2030 Socioeconomic Forecast by Subarea ............................................................. 84 Appendix G: Subarea Map ........................................................................................................... 85
1
Executive Summary Introduction MRCOG develops socioeconomic forecasts every 4 years in fulfillment of the federal requirements as a Metropolitan Planning Organization (MPO). While the MPO guides the transportation planning processes for the metropolitan area, socioeconomic forecasts encompass the entire four county area of Bernalillo, Sandoval, Torrance and Valencia, as well as southern Santa Fe County (Figure 1). The primary function of MRCOG’s socioeconomic forecasts is to serve as inputs to MRCOG’s travel demand model in order to plan for future transportation needs. However, they serve a variety of other purposes including informing local plans and land use policy and evaluating transportation project alternatives. MRCOG’s socioeconomic forecasts are also available to member governments and planning agencies for their own use.
2
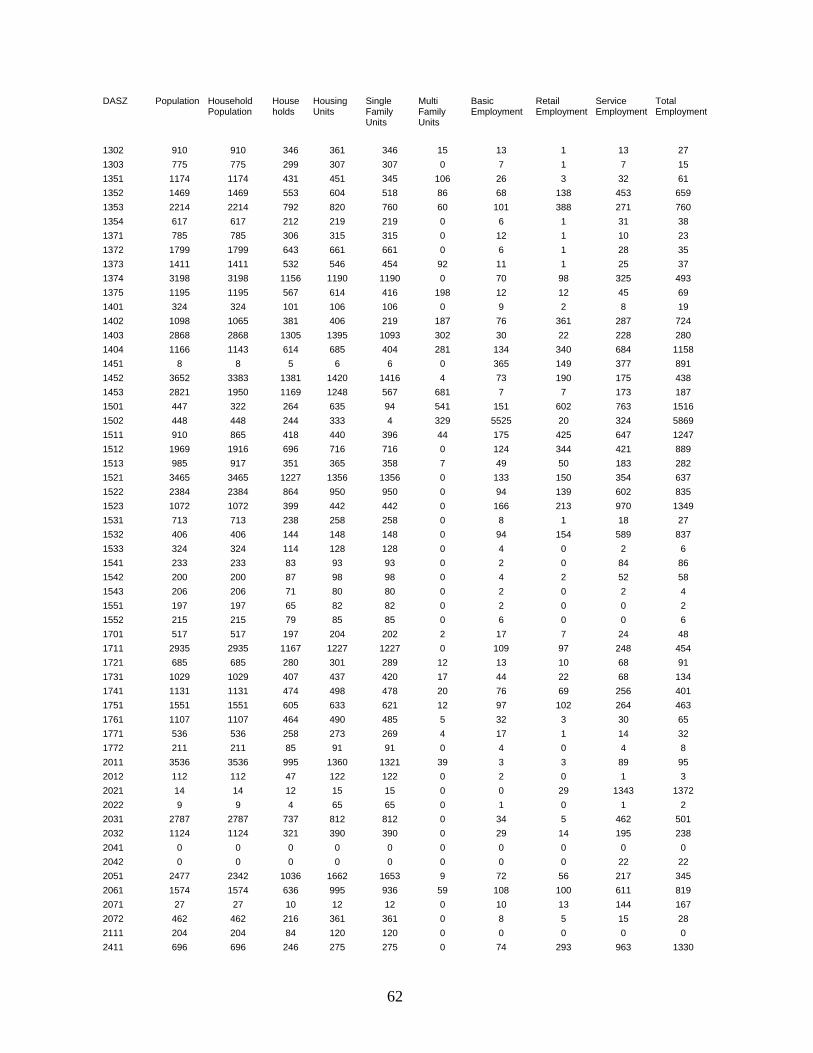
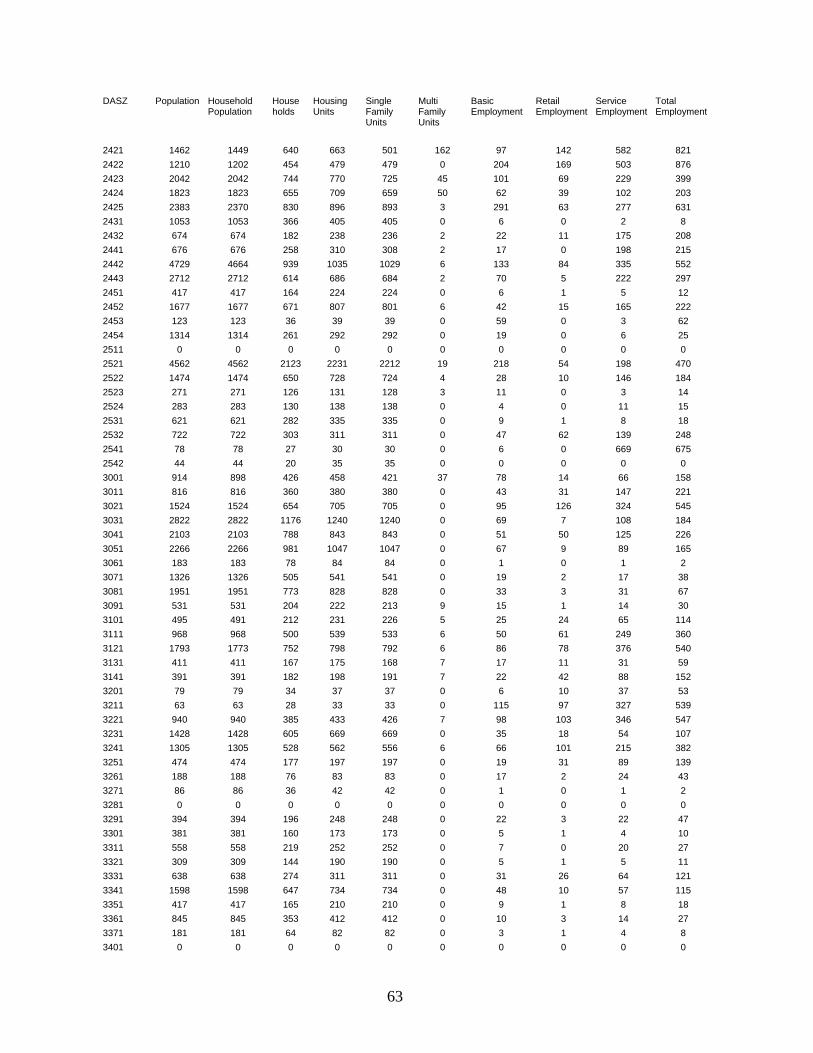
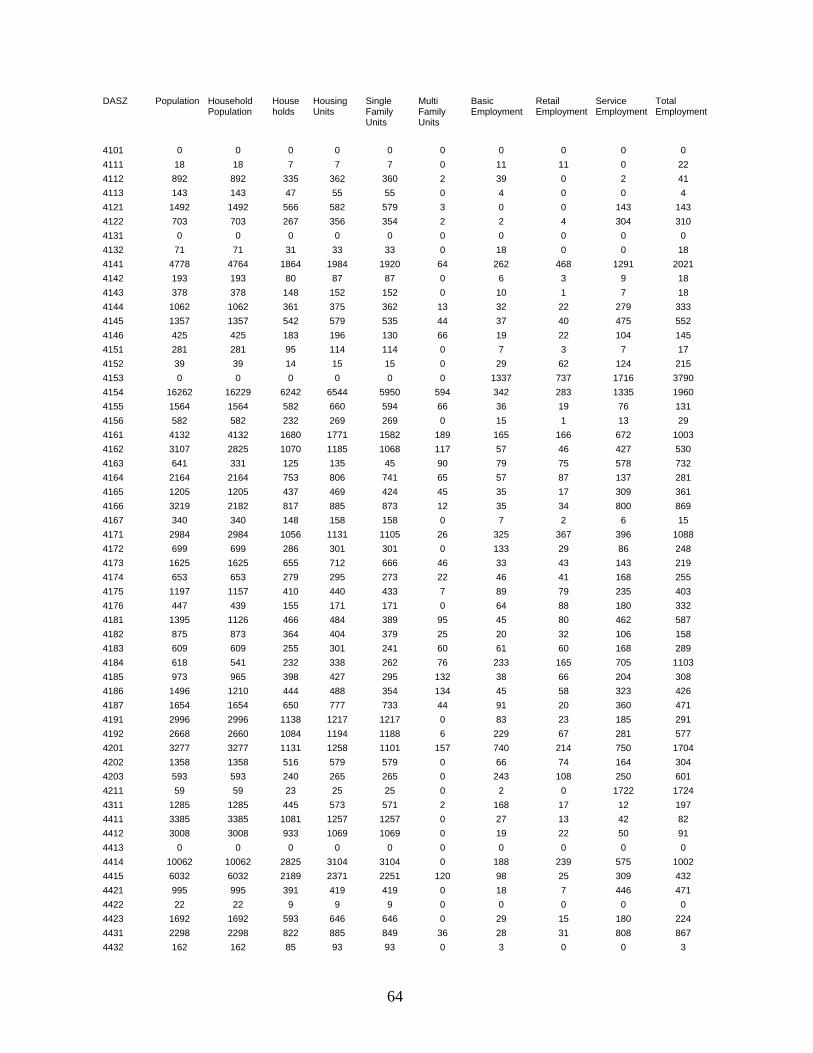
Forecast data include population, housing, and employment. These variables are forecast to small geographic units called Data Analysis Subzones (DASZs). Forecasts are created for DASZs because these are the geographic units required by the travel demand model. The socioeconomic forecasts developed by MRCOG are unique in that they are the only small area forecasts in the region. The socioeconomic forecast by DASZ for 2030 is included in Appendix C and the DASZ Maps are shown in Appendix D. The 2030 Socioeconomic Forecast presented in this document was based on the approved roadway network in the 2030 Metropolitan Transportation Plan (MTP). This served to close the feedback loop between MRCOG’s transportation and land use forecasts. That is, throughout the MTP process socioeconomic forecast data have been fed to the travel demand model, and as the transportation networks evolved, they were fed back into the land use model. This connection ensures that land use and transportation forecasts inform one another. A base year estimate for 2004 was used to create the 2030 Socioeconomic Forecast. Therefore, the forecast period represents the 26 years between 2004 and 2030. This report summarizes the methodology used to create the socioeconomic forecast datasets by DASZ and presents key results. It functions as a stand alone document and an appendix to the 2030 MTP. Data Collection The 2030 Socioeconomic Forecast draws on a variety of different resources. The U.S. Census Bureau was the basis for the 2000 demographics upon which the 2004 base year estimate was built. The 2004 update also relied heavily on locally maintained land use inventories, rural addressing files, aerial photography, and New Mexico Department of Workforce Solutions employer address files. Ongoing development was closely tracked through review of development and subdivision cases, major zoning changes, and tracking local news in various newspapers in the region. New development was also tracked through the collection and geocoding (spatial address matching) of residential and commercial building permits from individual permit issuing entities in the region. County-level population forecasts are generously provided to MRCOG by the Bureau of Business and Economic Research (BBER) at the University of New Mexico. BBER establishes the population “control totals” by county, and then MRCOG allocates that population to create smaller area forecasts. Employment forecasts are also based on forecasts from BBER. However since BBER’s employment forecasts are developed for the near term only, MRCOG supplements them to create a 2030 employment forecast. Other data sources include the New Mexico Department of Workforce Solutions, Bureau of Labor Statistics, and the Regional Economic Models, Inc. Policy Insight Model. Substantial data collection occurred at face-to-face meetings, as MRCOG staff gathered with municipal planners, government officials, school facilities planners and major developers in the region. Others meetings were held with planning and consulting firms in order to gain clarification or assistance regarding specific projects. The public was also consulted at several public outreach meetings. Maps were created and edited according to participant responses regarding current land use, the location of current or near term development, and what might be reasonably expected to occur in the long term. These participants were depended on not only for their initial input, but also for feedback as draft forecasts were developed. A list of contributing individuals and agencies is shown in Appendix A. Data collection also included a review of existing planning policy documents, which are collected by MRCOG and set the parameters for allowable future land uses and densities. Approved comprehensive plans, sector development plans, and area plans were incorporated into the forecast, as well as other policy documents including adopted resolutions from the City of Albuquerque’s Planned Growth Strategy.
3
Information from approved master plans including phasing, land use, and anticipated population and jobs were also considered in the forecasting process. Land Use Allocation Model MRCOG operates a Land Use Allocation Model (LAM) designed specifically for the Middle Rio Grande Region by Planning Technologies in 1996. LAM serves as the engine for the socioeconomic forecast. The major advantage of basing population and employment forecasts on land use is that it ensures that projected densities are reasonable and appropriate. This avoids the potential for forecasting excessive development among small areas, and makes certain that forecast development is consistent with current and proposed zoning and land use plans for a given area. It should be understood however that the location of forecast land uses may be approximate in many cases, and the 2030 forecast should not be used as a forecasting tool for specific parcels of land. In short, LAM automates the process of distributing new housing and employment throughout the region based on three main user defined inputs:
1. ‘Existing’ development – This input layer consists of an inventory of current land use that serves as the base for future allocation.
2. ‘Known’ development – This input layer informs the model regarding what is currently being built, has been permitted, or can reasonably be expected to build in the near term future.
3. ‘Planned’ development – This input layer is allocated last, and contains information regarding land use policy, long term master plans and projects, and expectations from the planning and development communities about the region’s future.
There are several rules imbedded in the model that have been created based on past trends and planner and developer input that guide it in determining site suitability. Some of the factors considered in the allocation process include existing and planned activity centers, places of interest, the planned roadway network, and water service areas. In 2003, MRCOG had identified a number of improvements to enhance the functions of LAM and contracted with Planning Technologies, LLC to implement them. LAM’s allocation process was refined, special modules such as school enrollment and forecasts on pueblo land were modified to work more efficiently, and the model was recalibrated with more recent data about what drives development. By the time draft socioeconomic forecasts were being produced for the 2030 MTP, a significant enhancement process was completed and LAM was a stronger forecasting tool. The 2030 Socioeconomic Forecast is the first to be developed using the new and improved LAM. Population Forecast The region is forecast to grow by just over 327,000 people, or 41%, by 2030. The region is expected to climb to well over a million people over the next 26 years, reaching a total population of 1,129,472.
4
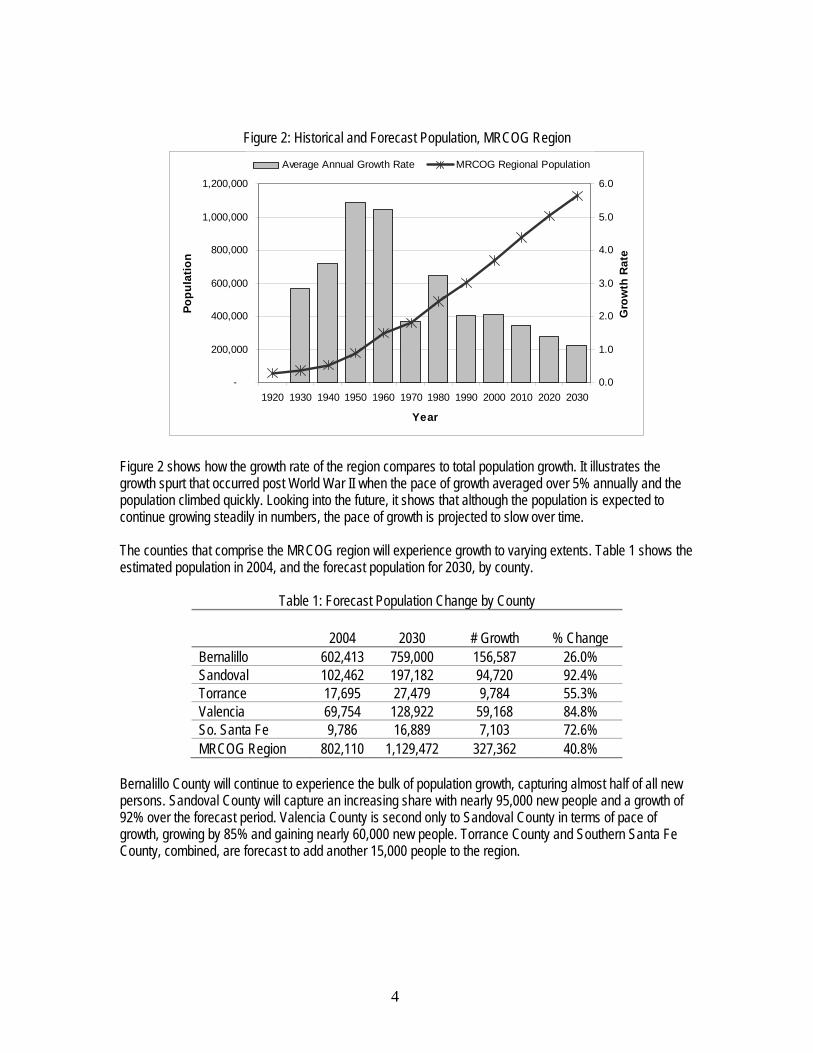
Figure 2: Historical and Forecast Population, MRCOG Region
Average Annual Growth Rate MRCOG Regional Population
Figure 2 shows how the growth rate of the region compares to total population growth. It illustrates the growth spurt that occurred post World War II when the pace of growth averaged over 5% annually and the population climbed quickly. Looking into the future, it shows that although the population is expected to continue growing steadily in numbers, the pace of growth is projected to slow over time. The counties that comprise the MRCOG region will experience growth to varying extents. Table 1 shows the estimated population in 2004, and the forecast population for 2030, by county.
Table 1: Forecast Population Change by County 2004 2030 # Growth % Change Bernalillo 602,413 759,000 156,587 26.0% Sandoval 102,462 197,182 94,720 92.4% Torrance 17,695 27,479 9,784 55.3% Valencia 69,754 128,922 59,168 84.8% So. Santa Fe 9,786 16,889 7,103 72.6% MRCOG Region 802,110 1,129,472 327,362 40.8%
Bernalillo County will continue to experience the bulk of population growth, capturing almost half of all new persons. Sandoval County will capture an increasing share with nearly 95,000 new people and a growth of 92% over the forecast period. Valencia County is second only to Sandoval County in terms of pace of growth, growing by 85% and gaining nearly 60,000 new people. Torrance County and Southern Santa Fe County, combined, are forecast to add another 15,000 people to the region.
5
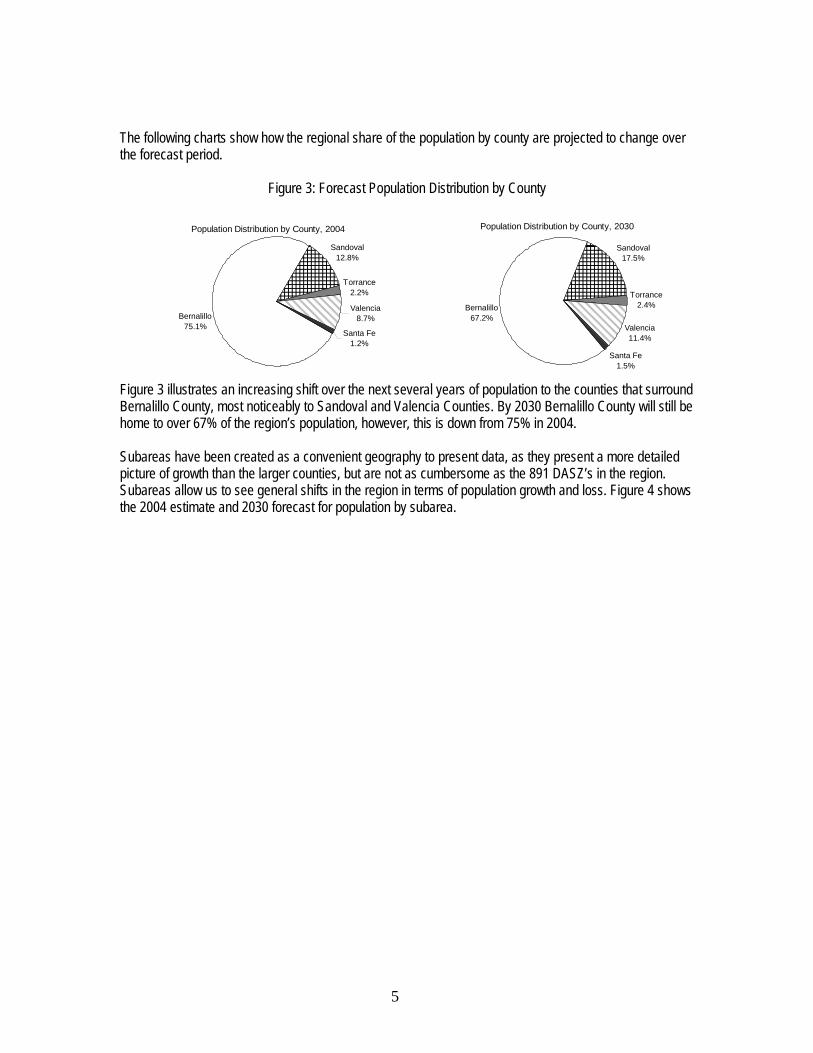
The following charts show how the regional share of the population by county are projected to change over the forecast period.
Figure 3: Forecast Population Distribution by County
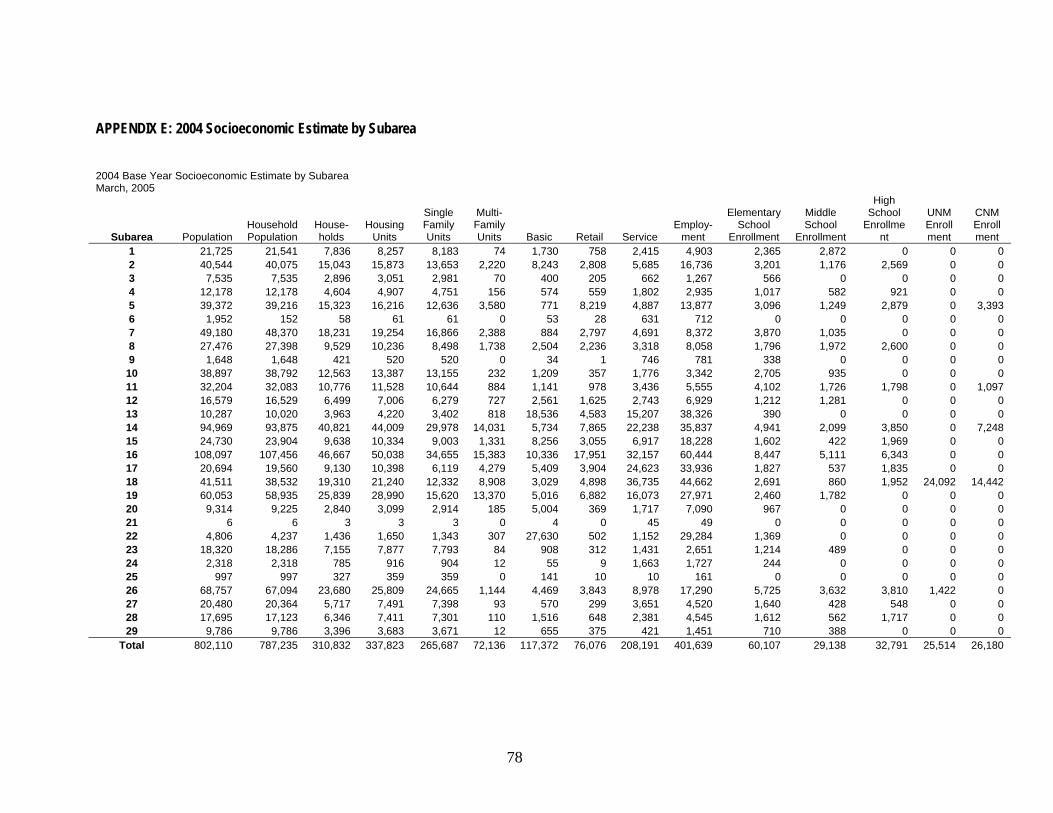
Figure 3 illustrates an increasing shift over the next several years of population to the counties that surround Bernalillo County, most noticeably to Sandoval and Valencia Counties. By 2030 Bernalillo County will still be home to over 67% of the region’s population, however, this is down from 75% in 2004. Subareas have been created as a convenient geography to present data, as they present a more detailed picture of growth than the larger counties, but are not as cumbersome as the 891 DASZ’s in the region. Subareas allow us to see general shifts in the region in terms of population growth and loss. Figure 4 shows the 2004 estimate and 2030 forecast for population by subarea.
Population Distribution by County, 2004
Bernalillo75.1%
Sandoval12.8%
Torrance2.2%
Valencia8.7%
Santa Fe1.2%
Population Distribution by County, 2030
Bernalillo67.2%
Sandoval17.5%
Torrance2.4%
Valencia11.4%
Santa Fe1.5%
6
Figure 4: Subarea Population, 2004 and 2030
7
The most rapid growth is forecast for subareas 21 and 6 are due to the anticipated development of Mesa del Sol and Volcano Heights, respectively. General patterns include decreased population densities in the near north and southeast heights of Albuquerque. High growth areas also include the west and far northeast parts of Albuquerque, Rio Rancho, and Los Lunas. As households become smaller in size, the traditionally dense areas in the region will appear to “thin out” a bit. This doesn’t mean that there are fewer homes, but fewer people living in existing homes. And because households are smaller, the region will require more homes than ever to accommodate a growing population. The majority of growth will continue to occur where there is consolidated land available for development outside of Albuquerque’s immediate core. However growth is also vibrant inside of the core as well. A variety of infill projects and loft style developments are being built and will continue to sprout up throughout areas within the urban core, contributing to the diversity of the region’s housing stock. Subarea 17, essentially Albuquerque’s downtown, is forecast to increase its population by 17% by 2030. Employment Forecast The region is anticipated to gain approximately 160,000 jobs since 2004, reaching 560,000 jobs in 2030.
Figure 5: Historical and Forecast Employment, MRCOG Region
0
100,000
200,000
300,000
400,000
500,000
600,000
1980 1990 2000 2010 2020 2030
Year
Po
pu
lati
on
0.0
0.5
1.0
1.5
2.0
2.5
3.0
3.5
Gro
wth
Rat
e
Average Annual Growth Rate MRCOG Regional Employment
Figure 5 shows that employment growth peaked between 1990 and 2000, averaging a 3% increase per year. Similar to the population forecast, the pace of job growth is expected to slow down, but remain steady.
Table 2: Forecast Employment Change by County 2004 2030 # Growth % Change Bernalillo 347,831 458,505 110,674 31.8% Sandoval 30,361 58,333 27,972 92.1% Torrance 4,545 6,685 2,140 47.1% Valencia 17,451 32,541 15,090 86.5% So. Santa Fe 1,451 3,796 2,345 161.6% MRCOG Region 401,639 559,860 158,221 39.4%
8
All counties will add jobs and Bernalillo County will continue to serve as the employment hub of the region, capturing approximately 110,000 of the 160,000 new jobs. In terms of the percent change, however, all counties surrounding Bernalillo will experience faster growth. Southern Santa Fe leads the region in rapid growth, more than doubling the base year in number of jobs. Sandoval County is next, with a percent growth of 92%. Valencia County trails only slightly with an 87% growth in jobs. Torrance County will also grow primarily due to activity in and around Moriarty. While Bernalillo County will continue to serve as the economic engine for the region, the following pie charts show how the surrounding counties are expected have an increased role in the regional economy.
FIGURE 6: Forecast Employment Distribution by County
Bernalillo County is expected to drop in its share of the regional jobs by 5 percentage points, which will be captured primarily by Sandoval and Valencia Counties. Torrance County and Southern Santa Fe County combined will hold about 2% of the regions jobs. The following look at employment change by subarea adds more detail regarding where growth is anticipated over the forecast period.
Job Distribution by County, 2004
Bernalillo86.6%
Sandoval7.6%
Torrance1.1%
Valencia4.3%
Santa Fe0.4%
Job Distribution by County, 2030
Sandoval10.4%
Torrance1.2%
Valencia5.8%
Santa Fe0.7%
Bernalillo81.9%
9
Figure 7: Subarea Employment, 2004 and 2030
10
Subarea 21 is forecast to experience the fastest growth in jobs due to expected activity at Mesa del Sol. At the time of the forecast several employers had already located or committed to locating within the new community forming in southeast Albuquerque. Another area that is expected to see exponential growth lies west of Paseo del Volcan and north of I-40, due primarily to a rapidly expanding industrial park as well as planned expansion of Eclipse Aviation at Double Eagle II Airport. Growing employment centers are an important part of the region’s economic future, some of which include Rio Rancho’s City Center, a new SuperWalmart for Edgewood, and Valencia County’s Los Morros Business Park. Educational campuses are expanding to the south and north, along with new medical facilities such as the new Presbyterian Branch in Los Lunas and another planned for Rio Rancho. Meanwhile substantial job growth continues within the urban core and traditionally dense employment corridors, north I-25 in particular, are projected to continue to absorb a high number of new jobs.
11
Methodology Overview The goal of the socioeconomic forecasting process is to first define where the region is today in terms of population, housing, jobs and land use, and then to determine where current activity, plans, and policies are leading all of these things in the future. This process takes the better part of two years for MRCOG and includes rigorous information gathering, analysis, and input from the public, member governments, and other stakeholders in the region. The entire process can be summarized into five steps.
1. Establish Control Totals 2. Build Land Use Layers 3. Run the Land Use Allocation Module 4. Develop DASZ Forecast 5. Refine and Finalize Forecast
The following sections describe the steps of the forecasting process in detail. Figure 8 is a visual representation of MRCOG’s socioeconomic forecasting process.
Figure 8: MRCOG’s Socioeconomic Forecasting Process
Existing
Land Use
Site Suitability
Evaluation
Population, Population in
Households, & Households
School Enrollment and Income
Quintiles
Controls Related to Population (County level)
Controls Related to Employment
(Regional level)
Run the Land Use Allocation Module
Build Land Use Layers
Planned Developments
(long term)
* Includes adopted policies and plans from local jurisdictions
Known Developments
(near term)
Develop DASZ Forecast
Refine and Finalize Forecast
Employment; Retail, Service
and Basic
Housing Units; Single and
Multi-Family
LAM Sub-models
Establish Control Totals
12
MRCOG employs a Land Use Allocation Model (LAM) that is central to the forecasting process. The LAM was developed specifically for MRCOG and is a valuable tool in guiding the determination of what the future of the region may look like by the year 2030. The internal processes within LAM are complex, and this document does not serve as a technical documentation for LAM. However, an overview of LAM is critical to understanding the forecasting methodology. The following components of LAM are important to understanding the forecasting process:
Sub-Models – LAM is fed a series of linked spreadsheets that serve as inputs to the model. Their function is to tell LAM the regional and county control totals for population, housing, employment and other variables forecast by MRCOG. Land Use Layers – LAM is also fed a series of geographic shapefiles that are created by MRCOG staff in preparation for the LAM allocation. They tell LAM about existing land use, near term development, and long term development plans. They also contain information about redevelopment, not developable or preserved land, and allowable uses and densities set by planning policy. Allocation Module – This module distributes housing and employment throughout the region. It pulls from the sub-models in determining how much it can allocate, and the land use layers in determining where it can allocate growth. The allocation is guided by a series of calibrated equations imbedded in the model that were based on observed behaviors of growth in the region. DASZ Module – This module automates the creation of a DASZ output from LAM. It calculates the variables that are derived from LAMs housing and employment allocation, including population, households, and employment by industry, and sums all variables by DASZ. It also inserts values from the sub-models that apply to KAFB and tribal areas into the appropriate DASZs. The DASZ module outputs a DASZ dataset that can be fed directly into MRCOG’s travel demand forecasting model.
13
1. Establish Control Totals The first step in developing small area socioeconomic forecasts for the region is establishing the control totals. Control totals serve as a target for the region to reach when the small areas are summed. In that sense, they set a ceiling on growth. They are read into LAM through a series of linked spreadsheets called “sub-models” which essentially tell LAM when to stop in the allocation, or distribution, of housing and jobs. The following figure depicts how the sub-models relate to the overall forecasting process. Figure 9: Sub-Model Integration within the Land Use Modeling Process
Population Population control totals are developed by the Bureau of Business and Economic Research (BBER) of the University of New Mexico. BBER’s projections are developed using a cohort component method, which is demographic technique for forecasting population. Births, deaths, and migration rates are calculated based
BBER Forecasts
MRCOG Forecasts
REMI Forecasts
Census Forecasts
Current & Historical Socioeconomics
Population Group Quarters Population Population in Households Households Housing Units Housing Type Employment by Sector Public School Enrollment UNM Enrollment CNM Enrollment Kirtland Air Force Base Tribal Lands
Generation of LAM Spatial Output and DASZ dataset
2030 Socioeconomic Dataset by DASZ
LAM Allocation
Data Sources Control Totals
LAM Sub-models
14
on historical trends and carried forward in time by each age cohort. Two trends that are critical to the forecast are a declining birth rate and an increase in life expectancy.1 MRCOG developed population control total for Southern Santa Fe County since BBER does not currently project population for geographies below a county level. However the MRCOG forecast is tied to the BBER forecast for Santa Fe County because it relies on the relationship between the southern part of the county in comparison to the whole county. This methodology has been detailed in a separate document available at MRCOG upon request.
* This table is based on a 2004 estimate by County that was developed by BBER in 2005. A revised 2004 estimate was later released by BBER.
BBER projects population at a county level, therefore LAM is designed to hit population control totals for each county within the region. Since population related variables are all derived from the BBER projection, they are also designed to be read by LAM as county level controls. Group Quarters Population The Group Quarters sub-model generates regional control totals by county for five categories of group quarters: dormitory residents (military and college), adult correctional population, nursing home residents, other institutional residents (mental health facilities, hospital wards for chronically ill or disabled, and juvenile detention facilities), and other non-institutional residents (group homes, religious group homes, workers’ dormitories, job corps dormitories, shelters, and the homeless). The projection of group quarters data is based on historical Census data.
Table 4: Forecast Group Quarters Population by County
1 It is important to note that the 2030 Socioeconomic Forecast was developed during a housing boom in the region. Since the cohort component method for forecasting population does not take into consideration current market forces, the forecast had the appearance of being conservative during a time of growth. However, history shows that housing market behavior tends to behave cyclically, and that times of high growth are eventually moderated as market forces shift. This was already beginning to take place at a national level during the time of production. By using a demographic model to forecast population, this moderation is inherent to the forecast.
15
Dormitory population is a required input to the travel demand model and therefore an important component of group quarters forecasts. It contains both college and military dormitory population. College dormitory population is located at the UNM central campus and the Southwestern Indian Polytechnic Institute (SIPI). At the time of the forecast UNM had added dormitory rooms since 2000 and was considering building more rooms. Given the possibility of growth at UNM the college dormitory population was calculated as a proportion of the age 18 - 24 population for Bernalillo County, as that is the most likely age range for dorm residents. There were no anticipated additional rooms at SIPI, so the 2004 number was held constant. Military dormitory population is located at Kirtland Air Force Base (KAFB). At the time of the forecast there was no information that suggested a decline or an increase in this population so the military dorm population was also projected as a constant. Correctional population was projected as two components; the local jail population and regional jail population. In calculating the local jail population, its proportion to the regional population age 18 – 64 was computed. An assumption was made that the statewide trend since 1970 was an accurate measure of the increase in incarcerations. There is no evidence to suggest that local trends are significantly different from the State’s trends. Therefore, the proportion for the local jail population was increased at the same rate as the State. The projected proportions were applied to the projected regional population age 18 – 64 to produce a forecast for local jail population.
The regional jails include the State facilities in Los Lunas and the private jails that house prisoners both from the region and from elsewhere. Calculating regional jail population was more complicated considering a recent trend in private jails that house many prisoners from outside the region, which has in turn produced a large increase in the correctional population. After reviewing several approaches it was decided to use a mean of the ratio to the total population from 1990 (before private jails) and 2000 (after private jails). Lacking any specific data on the future of private jails, this approach allows for the likelihood of additional private facilities and the growth in the proportion of incarcerated persons without forecasting a boom in this industry. This ratio was used to project a regional proportion of incarcerated persons. The total correctional population was the sum of local and region jail projections. The correctional population was allocated to counties based on the 2000 Census distribution. Nursing home population was projected as a constant proportion of the population age 75 and over. 2000 Census data was used to calculate a proportion for each county of the population age 75 and over residing in nursing homes (4.7 percent). The nursing home population is forecast to increase over time as the BBER forecasts an increase in the portion of the population aged 75 and over. This is consistent with both the aging of the baby boomer generation and longer life expectancies. A regional total as well as totals for each county were projected using proportions specific to the county or the region and the county projections were adjusted to the independently projected regional total. Other institutional population was projected as a constant proportion of the total population. Currently the only institutions in this category are located in Bernalillo and Valencia Counties. The allocation of the ‘other institutional’ population between these two counties was based on 2000 Census data. Other non-institutional population is a collection of a variety of groups and was projected as a constant of the total population. A regional total was calculated for each forecast year as well as a county total; the initial county projections were adjusted to the independently projected regional total. Population in Households Population in households was computed for each county as the total population minus population in group quarters.
16
Table 5: Forecast Population in Households by County
Households Total Households is the equivalent of total occupied housing units. A control total for households was generated indirectly from the population in households and a projection of average household size. Therefore, the methodology for calculating average household size must be explained. The household size forecast is based on the assumption that there is a relationship between change in household size at the national level and the local level. The societal factors that drive the downward trend of household sizes affect all areas of the nation. At the time of this forecast the U.S. Census Bureau had projected the national household size to 2010. MRCOG extended the Census forecast to 2030 using a least squares trend method. The average household size is expected to decline at a slow rate over the next 30 years. Given the expectation on a national level of a slow decline in average household size, and given the slow historical rate of decline in MRCOG counties, it is reasonable to suggest that the future rates of change in household size in this region will continue to be slow. Therefore, the average household size for each county is projected to decline at the same rate as the national average. The results of dividing household population by the initial projection for average household size by county to calculate the number of households was further adjusted to a regional control total for households. This was calculated from regional data in the same manner that it was for the counties. Regional data is expected to be more accurate than the sum of the counties as the change in the national average household size and the regional average household size has been very close in since 1990. Therefore, this adjusted number of households was used as the county controls and average household size by county was recomputed based on the adjusted household control total.
Table 6: Forecast Average Household Size by County
Housing Units The total number of housing units is the product of the sum of occupied housing units (households) and vacant housing units. Vacant housing units are calculated by dividing the number of occupied units by the projected occupancy rates. The occupancy rates are projected based on historical data for each county. The Census Bureau has reported occupancy rates since 1970. There has been considerable variation over time as well as between counties. An occupancy rate for the projection was assigned for each county based on a review of the county specific data available. The occupancy rate for Bernalillo County was very similar from 1980 through 2000. The rate for Bernalillo County was projected as the mean of 1980, 1990 and 2000.
Sandoval County’s occupancy rate declined after 1970 but has had an increase in each period since 1980. The most recent rate from the 2000 Census was used in the projection. Historically, Sandoval County has had a lower occupancy rate than Bernalillo County; this technique continues that historical relationship. At the same time, the urbanization in Sandoval County should produce a rate close to that of Bernalillo County, which it does. Torrance County has historically had the lowest occupancy rate in the region. The 2000 Census rate was the most reasonable rate to use as it was nearly identical to the 1970 and 1980 rates. The 1990 rate was omitted because it would have skewed the occupancy rate for the county. Valencia County has a pattern similar to that of Sandoval County and the most recent rate is the highest. The 2000 Valencia rate was almost as high as that of Bernalillo County. The assumption is that increased urbanization in Valencia County should continue to make it similar to Bernalillo County so the 2000 rate was used. For a number of years Southern Santa Fe County had an occupancy rate that was similar to that of Torrance County, its rural neighbor. In recent years, it has experienced growth with the construction of single family houses which are mostly owner-occupied units. The occupancy rate in 2000 was more comparable to the rates for the more urban counties than for Torrance County. Future growth in southern Santa Fe County is expected to continue to be exurban type growth, it is therefore reasonable to use the 2000 rate for the projection for this area. Finally an occupancy rate for the region was projected. The regional occupancy rates reported by the Census Bureau have been very similar for the past three censuses. Therefore, the mean of the 1980, 1990, and 2000 Census reports was calculated and used as the projected regional average. The projected occupied housing units were divided by the projected occupancy rates to generate an initial number of total housing units for each county and the region. However due to the long term consistency in the regional
18
occupancy rates the regional number of housing units, the initial forecasts of housing by county were adjusted to the regional projection.
Table 8: Forecast Occupancy Rates by County (held constant throughout forecast)
Housing Type The total number of housing units was divided into housing type (single family and multifamily) by first projecting the number of multifamily units. The number of single family units was the product of total units minus multifamily units. Historically, multifamily housing has been cyclical. At the time of the forecast, multifamily construction was slow but it is anticipated that a new cycle of multifamily housing will begin. Various economic factors have affected the ups and downs of the multifamily housing market. In the past, tax benefits associated with multifamily housing drove a lot of apartment development. Presently, low mortgage rates make single family home ownership more affordable which has reduced the demand for multifamily housing. Rather than attempt to forecast the multifamily cycles, a forecast has been prepared that smoothes the cycles in an effort to projects the eventual proportion of housing that will be multifamily. Historical data for housing by county and type and an estimate for the current base year were analyzed. As expected, the majority of multifamily units have consistently located in Bernalillo County, with small percentages in the surrounding MRCOG counties. An examination of the type of housing constructed by decade reveals that the proportion of multifamily housing built during the 1970’s and 1980’s was almost the same: about 30 percent of the total new units. During the 1990’s the multifamily percentage dropped to only 15 percent of all new units. Multifamily housing construction has dropped even further since 2000 and residential permits to date indicate that only 11.5 percent of new units in the region are multifamily units.
Multifamily units were forecast for the region by considering historical trends over a long period of time so as to capture the highs and lows. During the period from 1970 to 2000 Census data show that the average percentage of new homes built that were multifamily units was 25.3 percent. It was determined that the 30-year historical figure for multi-family, 25.3 percent of new housing, was a reasonable target for the following 30 year period. Therefore, while just 11.5 percent of all housing units allocated in 2004 went to multi-family housing that percentage was increased gradually throughout the forecast period, reaching 25.3 percent by 2030.
19
The assumptions behind this determination are as follows:
1. The single family housing market seems strong for the immediate future; 2. Tax advantages to build multifamily housing are gone so the construction of new multifamily
housing will have to make economic sense; 3. There is a developing “urban” market as evidenced by the construction of new lofts and apartments
in the core but this is still a relatively small segment of new housing and it will take time to gradually build this market;
4. The increasing proportion of the population in older age brackets will create more demand for senior multifamily housing over time;
5. Although the recent trend of multi-family construction has been downward, the cyclical nature of the market would suggest a rise in the future.
The regional projection was divided into county projections based on the historical proportions of multifamily housing in each county.
Employment by Sector Unlike population which is projected by county, employment control totals are developed for the region as a whole and LAM is programmed to allocate the jobs across county boundaries. LAM output was reviewed using several reasonability checks and, following limited post-processing, the county shares were determined to be reasonable given current trends, future plans, and information from local planners and developers. The following is a summary of the methodology used to develop the regional 2030 employment forecast for 2030. MRCOG utilized a variety of data and forecasting tools to develop a complete employment forecast, by sector, to 2030. At the base of the forecast is BBER’s nonagricultural wage and salary employment forecast by sector for the Albuquerque MSA. Albuquerque MSA is defined as the four counties of Bernalillo, Sandoval, Torrance and Valencia.
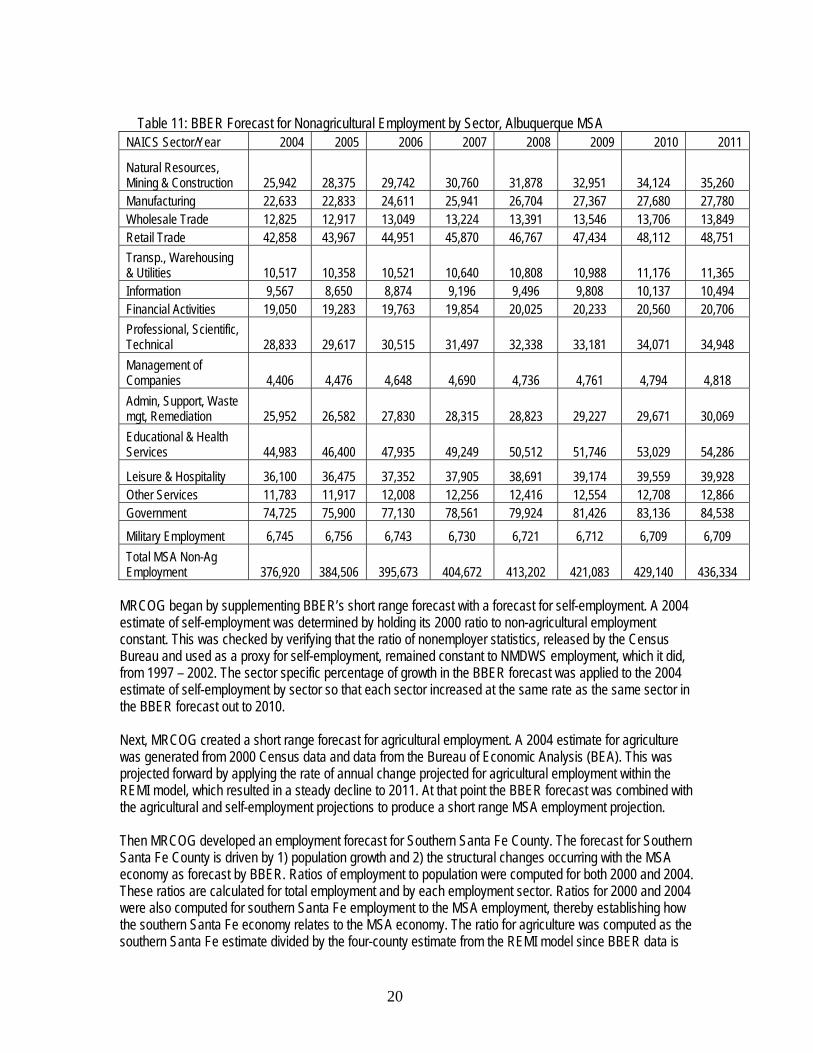
20
Table 11: BBER Forecast for Nonagricultural Employment by Sector, Albuquerque MSA
MRCOG began by supplementing BBER’s short range forecast with a forecast for self-employment. A 2004 estimate of self-employment was determined by holding its 2000 ratio to non-agricultural employment constant. This was checked by verifying that the ratio of nonemployer statistics, released by the Census Bureau and used as a proxy for self-employment, remained constant to NMDWS employment, which it did, from 1997 – 2002. The sector specific percentage of growth in the BBER forecast was applied to the 2004 estimate of self-employment by sector so that each sector increased at the same rate as the same sector in the BBER forecast out to 2010. Next, MRCOG created a short range forecast for agricultural employment. A 2004 estimate for agriculture was generated from 2000 Census data and data from the Bureau of Economic Analysis (BEA). This was projected forward by applying the rate of annual change projected for agricultural employment within the REMI model, which resulted in a steady decline to 2011. At that point the BBER forecast was combined with the agricultural and self-employment projections to produce a short range MSA employment projection. Then MRCOG developed an employment forecast for Southern Santa Fe County. The forecast for Southern Santa Fe County is driven by 1) population growth and 2) the structural changes occurring with the MSA economy as forecast by BBER. Ratios of employment to population were computed for both 2000 and 2004. These ratios are calculated for total employment and by each employment sector. Ratios for 2000 and 2004 were also computed for southern Santa Fe employment to the MSA employment, thereby establishing how the southern Santa Fe economy relates to the MSA economy. The ratio for agriculture was computed as the southern Santa Fe estimate divided by the four-county estimate from the REMI model since BBER data is
21
non-agricultural data. The mean ratio was computed for the 2000 and 2004 data for both population and employment. Employment by sector was projected out six years to match the extent of the BBER projection. Population ratios were applied to annual projections of population for southern Santa Fe County. Employment ratios were applied to the BBER projections for both total employment and employment sector. An initial employment projection for each year was calculated. The sectors of retail trade, financial activities, and government were projected entirely based on the population projection; in southern Santa Fe County, these sectors are almost entirely population supporting and would respond to population growth rather than regional economic changes. Agriculture and manufacturing are considered base industries and change in southern Santa Fe County is most likely to be a reflection of regional trends, therefore these sectors were projected based on the anticipated change in the regional economy. The other sectors including the total were projected as an average of the population based projection and the employment based projection. The projection by sector was balanced to the calculated total employment. The BBER projection, the projection of self-employment and agriculture, and the southern Santa Fe County projection combine to result in a short term employment projection for the MRCOG Region. Table 12: Short Range Employment Forecast by Sector, MRCOG Region
At this point in the process MRCOG turned to the issue of extending the forecast beyond the BBER horizon year to 2030. In the late 1990’s, MRCOG obtained the REMI model in part to generate the long-term employment forecast. The REMI economic forecasts contain a demographic component which MRCOG was able to calibrate to match BBER’s population forecast. Since the employment forecast produced by REMI is tied to the region’s population forecast, the link between the region’s population and job forecasts is maintained.
22
The BBER forecast is based on New Mexico Department of Workforce Solutions (DWS) data while the REMI forecast is based on Bureau of Economic Analysis (BEA) data, so these data differences needed to be resolved. To combine these forecasts, three methods were calculated and then combined to produce a final projection. The first employment projection method was based on the annual rate of change for both employment and labor force, which was calculated from REMI’s long range forecast for total employment and labor force. The appropriate annual rate of change in total employment from the REMI model was applied to the last year of the BBER-based forecast. Each subsequent projection year is forecast by applying the appropriate annual rate of change in total employment that was calculated using REMI. The second employment projection method is based on the REMI projection of labor force and assumes a relationship between the size of the labor force and the amount of employment. This method is particularly appealing because it ties directly to the demographic forecast and thereby links the employment forecast to BBER’s population forecast. This method combines the MSA projection of labor force with the projected labor force for southern Santa Fe County to generate a MRCOG Region labor force. The projected unemployment rate, derived from historical averages from the DWS, is added. Through subtraction, a projection of employed persons for the region was computed. Finally, an estimate of multiple jobholders, derived from a historical mean of Bureau of Labor Statistics (BLS) data, was applied. A regional projection of total employment was generated by combining the projected employed persons with the estimate of multiple jobholders. The third forecast method was based on the sector specific growth from the REMI forecast. First, the annual proportion change by sector was calculated from the REMI forecast. Then the appropriate annual sector specific proportion change based on REMI was applied to the final year of the BBER forecast. Each subsequent year was calculated by applying the appropriate sector-specific proportion to the result for the prior year.
The three projection methods were summarized, combining the BBER and REMI projections into a MRCOG projection. A simple mean of the three projections was calculated as the regional control total for employment. A sector-specific forecast was then computed based on the REMI forecast. Retail was forecast independently, however, as REMI projected a large drop in retail employment after 2015. REMI based this drop on the assumption that the internet and other forces will cause a significant reduction in demand for retail jobs. However, the magnitude of the drop was in dramatic conflict with the rising population and the historical relationship between retail growth and population h. BBER economists were consulted and agreed with MRCOG’s decision to tie retail employment back in with population growth. The projections by sector were balanced to the regional employment control total resulting in a final forecast by sector.
Table 13: Summary of the Three Employment Forecast Methods
Another element related to the employment forecast is the myriad classification systems that needed to be reconciled. First, the North American Industry Classification System (NAICS) has replaced the U.S. Standard Industrial Classification (SIC) system, the system on which LAM processes were previously based. The LAM model required reprogramming to recognize and handle NAICS categories. The next issue was the many class conversions that need to occur throughout the forecasting process. The initial forecast data from BBER come in 16 NAICS categories, which needed to be translated into the 21 NAICS categories provided to MRCOG by the DWS. Then, those 21 NAICS sector categories (mining, utilities, construction, manufacturing, etc.) need to be converted to land use categories (commercial, office, industrial, etc.) which serve as the basis of the LAM allocation. When LAM completes the allocation the land use categories are translated back to NAICS sectors. Lastly, the NAICS sectors are collapsed into 3 broad categories (basic, retail, and services) for the final DASZ dataset as required by the travel demand model. Public School Enrollment The projection for public school enrollment for the region is subdivided into three categories: elementary, middle, and high. This is projected for the travel model which has a component that generates trips for public schools. Intermediate schools were classified appropriately according to the transportation characteristics of their students. Currently, alternative schools and private school enrollment is not handled by the travel model. Enrollment projections are based on the 2000 proportion of the population age 5 to 18 enrolled in public schools. Population by age data come from the US Census Bureau and public school enrollment is available from the New Mexico Department of Education. The proportions were applied to the age-specific population projections developed by BBER as part of their population projections by county. Total public school
24
enrollment is subdivided by elementary, middle, and high school. The factors for the three types of schools were calculated by MRCOG from historical data from the New Mexico Department of Education.
Table 15: Projection Factors for Public School Enrollment Proportion of Population Age 5-18 enrolled in Public Schools: 0.78999
Proportion of School Enrollment in Elementary Schools: 0.48982
Proportion of School Enrollment in Middle Schools: 0.23745
Proportion of School Enrollment in High Schools: 0.27273 The projection for the MRCOG region is as follows:
Table 16: Forecast Public School Enrollment, MRCOG Region
University of New Mexico (UNM) Enrollment The projection for enrollment at the central UNM campus is based on the proven assumption that that the market is comprised of the entire State and that the majority of university students fall into the 18 – 29 age group. An 18 - 29 age cohort was calculated from BBER’s State population projections. From 1987 to 2004, UNM central campus enrollment was an almost constant ratio of .08 to the statewide population age 18 – 29. Therefore, the computed ratio was applied as a constant to the forecast population age 18 – 29 for each projection year. The projection for the UNM-Valencia Branch is based on the proven assumption that the Valencia Branch serves primarily Valencia County. An 18 - 29 age cohort was calculated from BBER’s population projection for Valencia County. Over the 15-year enrollment history, the ratio of UNM-Valencia enrollment to the Valencia County population age 18 – 29 has remained reasonably stable at .17. Future enrollment for the Valencia campus was projected with this ratio. UNM is planning to develop a new branch campus in Rio Rancho. Based on statements by UNM, there is sufficient land to develop a campus that could have up to 12,000 students. At the time of the forecast it was not certain how quickly the Rio Rancho branch will develop, or what programs will be housed there, however it is expected to primarily serve Sandoval County residents. Without specific enrollment forecasts for this new facility MRCOG made the assumption that the Sandoval County branch will function similar to the Valencia County branch of UNM and therefore applied the same ratio to the Sandoval County projections of persons age 18 – 29. The first projection year that includes the Rio Rancho campus is 2015.
Community College of Central New Mexico (CNM) Enrollment As with UNM, the assumption is that the core age range that CNM serves is the 18 -29 age cohort. Currently all of its campuses are within Bernalillo County, however, the school draws students from adjacent counties because of its low tuition costs and numerous programs that are directed at specific vocations. Therefore, the MRCOG Region was used as the market area for CNM.
Historical enrollment data for CNM indicates considerable growth since 1989 in the ratio of enrollment to the population of the age 18 – 29 cohort. The belief is that most of this change has been due to the expanding focus since the 1980’s. CNM courses began as entirely technical or vocational. In the 1980’s, it moved toward becoming a community college and added academic courses unrelated to the technical and vocational programs. Over time, CNM has become a viable option for students to take the first two years of college course work before transferring to a 4-year college. CNM also opened a west side campus in 2004 which further increased enrollment. It was decided that for the purposes of forecasting future enrollment a constant ratio to population aged 18-29 would be used rather than a trend method. The assumption is that CNM’s historically high growth rate is related to its metamorphosis in terms of curriculum, and that those changes are largely completed. The 2004 ratio of enrollment to the region’s 18 – 29 population was 0.20 and that ratio was used to forecast future enrollment. Enrollment was divided into the four campuses by factors based on historical trends and an assumption regarding growth at the new west side campus. Enrollment was based on day division students.
Table 18: Forecast CNM Enrollment
Year CNM, Day Division 2004 26,776 2010 29,180 2015 30,016 2020 30,205 2025 30,837 2030 32,434
Kirtland Air Force Base (KAFB) LAM was not designed to forecast military base operations, so KAFB jobs and housing were forecast separately by DASZ and directly inserted into the DASZ output. Projected population, housing and jobs are subtracted from the regional controls that are available during LAM allocation processes so as not to over-allocate.
26
Historical information regarding jobs and homes on the base was collected, and interviews were held with KAFB’s public information officer and Kirtland Family Housing, LLC, to gather insight into future activity on the base. The historical data are provided below. Table 19: Historical Population, Housing and Employment on KAFB
The housing unit forecast was performed following the privatization of housing on the Base, which is now owned and operated by Kirtland Family Housing, LLC. This group has undertaken an improvement effort which includes demolishing a large portion of the old housing on the Base and replacing approximately two-thirds of it with new homes. Although the overall number of residences on the Base will decline this does not imply a reduction in Air Force personnel or other employers located on KAFB. From the housing projection, population variables were calculated with assumptions regarding occupancy and household size. Historical occupancy rates hover around 90% therefore an average was taken and used for the future projection of occupied housing. The average household size has declined since 1980, which is consistent with regional and national trends. The historical rate of decline was carried forward using a trend method in order to project future household sizes, which decrease from 3.00 in 2004 to 2.81 in 2030. Population in dormitories is forecast as a constant to the number of persons living in dormitories in 2000, as there is no information regarding the anticipated number of military personnel living in dormitories in the future. Historical employment since 1990 has held fairly stable and KAFB is projected to maintain its current levels of employment. There was no available information from Air Force officials regarding the potential future employment levels. During this forecast military bases nationwide were considered for closure due to federal cutbacks but with enormous public support KAFB survived. Also during this forecast it was announced that the Department of Defense was opening the Operationally Responsive Space Office (ORS) at KAFB. With lack of any certain data regarding the future of the Base, MRCOG assumes that KAFB will continue to operate in Albuquerque at current levels plus the addition of ORS. Table 20: Forecast Population, Housing and Employment on KAFB
All employment on KAFB with the exception of retail is classified as basic employment.
27
Tribal Lands Tribal lands in the MRCOG region include lands within the eight Pueblos of Cochiti, Isleta, Jemez, Sandia, San Felipe, Santa Ana, Santo Domingo, and Zia. The region also includes a portion of Laguna Pueblo, and the portions of the Jicarilla Acache and Navajo Reservations. Tribal trust lands include Laguna, Navajo and Zia. Although the Sandia grant line goes through the Town of Bernalillo, this forecast excludes the Town of Bernalillo and the unincorporated subdivision of Bosque del Bernalillo from the Pueblo of Sandia forecast. Similar to KAFB, the forecast for Tribal Lands is performed prior to LAM allocation and fed directly into the final output by DASZ. The main reason for this is that current and future land use information on tribal lands are generally not publicly available and are not subject to the same planning and zoning processes as development in the rest of the region. Therefore, rather than allocating growth by land use within reservation boundaries, it is forecast by DASZ. To the extent possible, this is done with guidance from Tribal Governors and planners. The Pueblos of Sandia, Laguna, Isleta and Santa Ana participated in the process. Population for Tribal lands as a whole was projected to 2030 with a least squares regression technique based on historical population from 1970 to 2000. The R-square value was .995. The average annual rate of growth on Tribal lands over the past 30 years has been 2.31 percent; however that rate has declined from 3.28 percent during the 1970's to 1.70 percent during the 1990's. In the forecast, the rate of growth is slowed; this slowing is consistent both with the last 30 years and what is projected for the growth rate of the region. Historically, the population on Tribal lands accounted for just over 2.6 percent of the region’s population, although this percentage has been declining slightly. In the forecast, the slight decline in the percentage of population on Tribal lands is expected to continue. Housing was calculated from the population forecast. Historical Census data from 1980 through 2000 for housing units for the population living on Tribal lands was collected. A ratio of persons per dwelling unit was calculated for each area for each decade by dividing population by housing units. A housing forecast for the Tribal population was the result of regression equations computed for the ratios of persons per dwelling unit applied to forecast years.
Table 21: Forecast Population, Households, and Housing Units on Tribal Land Year Population Households Housing Units 2004 20,275 5,252 6,170 2010 22,023 5,771 6,799 2015 23,528 6,307 7,421 2020 24,997 6,856 8,070 2025 26,449 7,427 8,742 2030 27,859 8,011 9,420
Next population was forecast for each Pueblo or Reservation. For Tribal lands on which there were no existing forecasts or input, population was forecast with a linear regression equation based on 1970 to 2000 data. When alternative information was available, it was used in the forecast. The results were balanced to the total forecast population on Tribal lands. Housing forecasts for each Tribal area was calculated using a regression technique and balanced to the overall housing forecast for Pueblo and Reservation areas. The forecast by Tribal area is shown below.
28
Table 22: Forecast Population and Housing by Pueblo or Reservation Area TRIBAL AREAS POPULATION HOUSING 2004 2015 2030 2004 2015 2030 COCHITI** 1,553 1,899 2,350 640 846 1,117 ISLETA 3,315 3,862 4,677 1,275 1,542 1,993 JEMEZ 2,110 2,403 2,784 542 657 812 JICARILLA APACHE* 12 14 16 7 6 7 LAGUNA* 23 29 37 15 22 30 NAVAJO, TO'HAJIILEE* 1,648 1,981 2,416 505 590 768 NAVAJO, TRUST LANDS* 2,796 3,195 3,713 987 1,155 1,433 SANDIA*** 711 887 1,118 284 344 464 SAN FELIPE 3,462 3,993 4,681 836 988 1,236 SANTA ANA 550 614 696 216 262 318 SANTO DOMINGO* 3,416 3,898 4,521 673 787 975 ZIA 679 753 850 198 224 271 TOTAL 20,275 23,528 27,859 6,178 7,423 9,424 * Population within MRCOG region. ** The Census reports for Cochiti Pueblo all of the population within the Pueblo which includes the
unincorporated town of Cochiti Lake which is on land leased from the Tribe. Since the Tribe retains
control of this area, the population reported for Cochiti include Cochiti Lake City. ***The Census reports for Sandia Pueblo all of the population within the Sandia Grant which includes a
large portion of the Town of Bernalillo. The population in the Town of Bernalillo and the unincorporated area of
Bosque del Bernalillo have been excluded from the Sandia population estimate.
Employment for Tribal lands was forecast by computing ratios for various types of employment. Estimated 2004 employment was divided into three employment types: Basic (which consisted of agricultural, mining, construction, manufacturing, transportation, communications, utilities, wholesale, and military employment); Population-serving (which consisted of retail, finance, insurance, real estate, service except for casino, and government employment); and casino. A ratio of Basic employment to population in 2000 was computed for the sum of all Tribal lands. There was an assumption that this ratio would remain constant, therefore, total Basic employment on all Tribal lands for future years was computed by applying the ratio to the forecast population on Tribal lands. A second ratio was computed; population-serving employment to population was calculated for Tribal lands and also for the non-metropolitan (excluding Tribal lands) portion of the MRCOG Region. In 2004, the population-serving ratio on all Tribal lands was slightly lower than the ratio in the non-metropolitan portion of the region. An assumption was made that the population-serving ratio on Tribal lands would increase to be equal to the current ratio in the non-metropolitan portion of the region by 2030. Casino employment was forecast by calculating the current ratio of casino employment to total regional population and applying that ratio to the regional population forecast. In instances where there was information regarding planned casino expansion the forecast was altered accordingly. Since 2000 expansions have occurred at Santa Ana, Isleta, and Sandia, and more is projected. Employment on Tribal Lands was forecast by NAICS sector using the REMI Model. Employment by sector for the region was obtained from the REMI Model. Employment by sector on Tribal lands was obtained from the 2004 Socioeconomic Dataset. An assumption was made that the increase in employment by NAICS sector on Tribal lands would be proportionately the same as the NAICS sector-specific increases for the region. An exception was the service sector which was adjusted for the large increases in casino employment. The preliminary results for the NAICS projections were adjusted to the overall forecast employment totals for Tribal lands.
29
Table 23: Forecast Employment by Sector on Tribal Land NAICS Sector/Year 2004 2015 2030 Agriculture, Forestry, Fishing 12 17 16 Mining 87 100 113 Utilities 44 55 67 Construction 233 267 303 Manufacturing 4 5 5 Wholesale Trade 100 114 133 Retail Trade 241 325 423 Transportation and Warehousing 318 391 475 Information 2 2 3 Finance & Insurance 48 54 64 Real Estate, Rental & Leasing 23 26 30 Professional, Scientific, Technical 11 12 14 Management of Companies 0 0 0 Admin, Support, Waste mgt, Remediation 227 368 437 Educational Services 8 13 13 Health Care & Social Assistance 67 121 147 Arts, Entertainment & Recreation 31 34 40 Accommodation & Food Services (except eating and drinking) 243 264 309 Eating and Drinking 69 75 88 Other Services 12 13 15 Government 6,347 7,313 8,684 Total Employment 8,127 9,569 11,379
Employment by sector was forecast for the various Tribes by allocating the increase in employment in each NAICS sector to the Tribes depending on the proportion of that NAICS sector in their 2004 economy. Adjustments were made for the known increase in casino employment at Santa Ana, Isleta, and Sandia. The Tribal allocations were balanced to the NAICS sector and total employment control totals. When information specific to a certain area was known outside of these calculations the forecast was adjusted.
Table 24: Forecast Employment by Pueblo or Reservation Area TRIBAL AREA 2004 2015 2030
2. Build Land Use Layers MRCOG staff collected a variety of information, developed maps, and held many meetings in order to identify existing land uses, known or near term development, and planned or longer term development out to the horizon year of 2030. In addition to document collection, policy review and data analysis, this step required extensive outreach including site visits and face-to-face meetings, as well as follow up meetings. This time intensive process was essential in ensuring that the MRCOG forecasting processes was based on real activity occurring out in the field rather than perceived activity as observed from behind a desk. The information that MRCOG collected in this step is used to create three land use layers required by LAM that are differentiated by project status; the existing land use layer, the known layer, and the plan layer. These layers are coded into LAM using a land use classification system with 18 categories which are as follows:
1. Single family Residential 2. Multi-family Residential 3. Mixed and Minor Commercial 4. Major Retail Commercial 5. Regional Office 6. Industrial/Wholesale 7. Institutions 8. Schools/Universities 9. Airports 10. Transportation and Utility corridors 11. Irrigated Agriculture 12. Dry Agricultural/Rangeland 13. Major Public Open Space, Parks, Recreation Land 14. Natural Drainage 15. Urban Vacant 16. Landfills/Sewage Treatment 17. Other Urban Non-Residential 18. Kirtland Air Force Base
LAM also has a ‘Mixed Use Development’ designation that is used in circumstances where mixed uses are anticipated, but specific locations for each use within the development are not known. The modeler can specify the percentage of the land expected to be dedicated to each use along with the densities. In the LAM allocation processes, it will determine the specific location of the allocated land uses to that development. In addition to the three land use layers that guide development, LAM also is programmed to identify potential redevelopment areas as well as lands that are not likely to develop at all. The following figure shows a simplified representation of how these inputs relate to one another in LAM.
31
Figure 10: LAM Land Use Layers
Existing Land Use (2004) A 2004 Existing Land Use (EXLU) layer was built as an update to the 2000 EXLU which served as the base for the 2025 MTP. The 2000 EXLU was built using individual land use inventories maintained by governing jurisdictions combined with data from the U.S. Census Bureau and the New Mexico Department of Workforce Solutions (DWS). The 2004 update primarily relied on 2004 digital orthophotography, which was instrumental in locating new development. In areas where orthophotography was not available or not current, building permit data combined with rural address data were used to identify new structures. When a new development was added to the EXLU it was given a housing or employment density. Housing densities were determined by a combination of sources; housing units and area as determined from the orthophotography, densities defined in planning and zoning cases, and as estimated from the building permit file. Employment densities were created from an estimate based on planning and zoning cases, and by employment densities in the surrounding area. If the identity of an individual business was known, the employment was obtained from the 2004 employment file provided by DWS. The housing densities in the 2004 EXLU were adjusted within each DASZ so that the sum of the housing units would approximately match the total housing estimated in a partnering dataset created by MRCOG, 2004 Socioeconomic Estimates by DASZ. This dataset contains population, housing and employment estimates for 2004 by DASZ and was developed in conjunction with the EXLU. The population and housing estimates were based on building permits and estimates for occupancy rates and household size. The population in the DASZ dataset was balanced to the 2004 county-level population estimates developed by BBER. The employment densities in the 2004 EXLU were also balanced to meet the total number of jobs reported in the 2004 Socioeconomic Estimates by DASZ. The data contained within the DASZ dataset were provided directly by the DWS Enhanced Quarterly Unemployment Insurance (EQUI) report which provides jobs by employer address. MRCOG spent several months cleaning the data, address-matching jobs, and creating an estimate for employment not included in the EQUI (agriculture, self-employment and unpaid family workers). The result was a 2004 estimate of total employment, by sector, by DASZ. The DASZ dataset was balanced to meet the total number of jobs in the region as reported by DWS.
Existing Land
Use Layer
Known Layer 1. Active 2. Planned
Plan Layer
Redevelopment Areas and
Undevelopable Lands
32
Known Development (approximately 2005 to 2015) The purpose of the known development layer is to tell the model about projects that are likely to build in the near term. It works together with the EXLU, which tells the model if the land under a known project is indeed available for development. Land in the EXLU is available for development if it is coded vacant, rangeland, unpreserved agricultural or built but available for redevelopment. Development allocated by LAM will halt as soon as density thresholds as outlined in by the known layer are met, thereby ensuring that projects are not “over-built”. The known layer has two distinct designations for development status, Active or Planned. Active projects take precedence over Planned projects in the LAM allocation. The following are the criteria for inclusion in the known layer: Projects that had been approved by the appropriate development review board were entered into
LAM’s known layer as Active. Meetings with planners, government officials, and developers resulted in identifying projects that
had begun construction after the existing land use layer was finalized. These projects were entered as Active.
Phase one of major planned communities that had broken ground were entered as Active in the
known layer. Subsequent phases were included in the plan layer. Phase one of major planned communities that are not currently building but reasonably expected to
in the near future were entered in the known layer as ‘Planned’. These communities either had submitted plans for zoning and development review, or were widely accepted by the planning and development community. Future phases were included in the plan layer.
Newspaper articles regarding land use and new developments that were considered to be at build
status were clipped and entered as Active. Meetings with planners, government officials, and developers resulted in identifying areas that are
not currently building but were believed to be on the horizon for development. These projects were entered as ‘Planned’ in the known layer if they fit one of the following criteria:
o the land had been platted and/or subdivided; o the project is a subsequent phase to a current development; o the plans are currently being drafted and fit in with surrounding land uses; o the land had been purchased for the specific development; o a high level of certainty exists among multiple sources that development will begin in the
near future. Areas that have exhibited a fairly continuous pace of growth were coded to grow at their current
pace in the known layer. Planned Development (2016 to 2030) Along with later phases of master plans, the plan layer also includes the “visioning” that came out of our meetings. One example of this is the expectation that that the land surrounding rail stations will increase in desirability and redevelop with higher densities and mixed uses. Potential new communities that were speculative at the time of the data collection were placed in the plan layer. This was also true of proposed areas for developments that were perceived to have specific challenges, such as lack of utilities or obstacles to land consolidation. Entries in the plan layer were coded to conform to current planning policy documents and zoning designations.
33
The following are the criteria for inclusion in the plan layer: Large master planned communities still in conceptual stages were entered into the plan layer. If no
build out exists, the community was given a density that complies with an adopted plan or the surrounding areas.
Adopted general plans, area plans and sector plans were reviewed and the areas that they cover
were coded into the plan layer with the land uses and densities stated in the document. Areas that are not covered by adopted plans were entered if planners, government officials, or
developers identified land that they felt reasonably certain of their future plans. Much of this involved the use of judgment based on professional experience and understanding of land use, development patterns, the real estate market, and economics.
Land that was not zoned or zoned for agricultural use, and was not mentioned in meetings with
planners or developers, was sometimes entered into the plan layer for potential development if it was in close proximity to existing development, accessible by roadways, or located near areas with significant future plans for growth.
Lastly, there were areas in the region that were not assigned a use and density within the plan
layer. This was often because there had been no evidence of any interest in developing them, and in most cases these parcels were far from existing roads and other infrastructure and there were no known plans to provide access to them in the future. In other instances, areas were not entered into the plan layer because they were identified as targets for conservation or preservation for open space or agricultural uses.
In all cases, surrounding land uses, densities, and existing zoning were used to consider the appropriateness and likelihood of developments entered into the plan layer. Redevelopment LAM recognizes developable land by its coded use, and will allow building to occur on vacant, rangeland, or unpreserved agricultural land. In addition, LAM will allow building to occur on top of an existing use if it has been identified as a potential parcel for redevelopment. This is done by turning on a “redevelopment flag” in the known or plan layer that tells LAM it is ok to build a project even though it is located on land that is already being used. The identification of such areas was determined through meetings with planners, government officials and developers. Discussions revealed many areas within the region, particularly within the urban core, where there was a high likelihood for continued and potentially greater redevelopment efforts. This was particularly true in built areas that have increasing land values and strong site desirability. Areas that were selected to be available for redevelopment fit one of the following criteria: The area or corridor is designated as a “Redevelopment Zone” by a municipality through policy or
plan. The area or corridor has been targeted for redevelopment or higher densities in an adopted plan
such as in the City of Albuquerque’s Centers and Corridors Plan.
34
The area or corridor was identified by planners or developers as having a high potential for new uses or increased densities due to surrounding uses and site desirability.
In some cases, parcels were identified for redevelopment by MRCOG staff, such as certain parcels
surrounding Commuter Rail stations. Developed areas surrounding vacant parcels that are targeted as highly desirable for high density
infill development were selected for higher densities. When LAM redevelops a piece of land, the homes and jobs in the existing land use layer vacate the parcel and are reallocated during a future step in the modeling process. Undevelopable Lands MRCOG created an undevelopable layer as a safeguard imbedded within LAM to ensure that specific areas that are unavailable for development are not accidentally developed. Undevelopable areas include land owned by the Bureau of Land Management, the State and National Park Services, the Forest Service, the Department of Energy, the Department of Defense, and natural drainage areas. Professional judgment was used in parcels that may be owned by one of the above entities but is likely to be developed. The State Land Office provided active input to this process. Pueblo and reservation boundaries were also included in the undevelopable layer. This is because specific development on Indian Land was not allocated to specific sites through the LAM model. Rather, growth was projected off-model based on meetings with Tribal planners and leaders, or based on past trends when input was not received, and incorporated directly into the final DASZ forecast.
35
3. Run the Land Use Allocation Module LAM was created specifically for use by MRCOG to forecast population, housing and employment. It was designed by a local consulting firm, Planning Technologies, LLC with input by MRCOG staff. It was calibrated based on local data specific to this region. Lastly, it was enhanced during the 2030 MTP development to increase its power, accuracy, and efficiency. The main components of the actual LAM model are described on page 12. In short, they are the sub-models (which tell LAM the control totals), the land use layers (which tell LAM about existing, known and potential development), the allocation module (where LAM performs the actual distribution of housing and employment throughout the region), and the DASZ module (where LAM calculates socioeconomic variables by DASZ as required by the travel demand model). The preliminary steps that are necessary prior to running the LAM allocation module have been described in detail in the previous two sections. Establishing control totals and building the land use layers set the stage for the allocation of new growth. At this point the modeler “runs” the LAM Allocation Module. Site Suitability Evaluation The allocation process is not as simple as just building projects that are in the pipeline, and distributing the remainder of growth into some pre-defined long term developments. If it were there would be no need for a model. In addition to the prioritization assigned to the 3 land use layers, LAM also has an internal component that evaluates the site suitability of lands eligible for development. That is, LAM is designed to recognize the inherent characteristics of competing sites and rank them due to various measures of attractiveness. This is the component that ultimately determines which projects are built, and at what pace and magnitude. The site suitability evaluation component of LAM is meant to simulate the real characteristics of growth. “Site suitability scores” were developed at MRCOG as the result of a series of discussions with planners and developers about what factors influence where people choose to develop. These preferences were tested through regression analyses and those which were proven to be statistically significant were imbedded into the scoring component of LAM. The site evaluation measures used in the 2030 MTP are specific to each sector of development (residential, commercial, industrial, etc) but in general they include:
Freeway Interchanges and Major Intersections: Present day and planned transportation networks for the future are used to evaluate land access. They also serve a surrogate for proximity to infrastructure.
Proximity to Urban Development: Distance to other “built” uses is an indicator of the availability
of local infrastructure and utilities to support development. Developers vocalized and research confirms that there are distinct advantages to building near existing developments.
Recent Growth Areas: Areas that have experienced considerable development within the past 5
years are expected to continue growing. Recent development is a key indicator of what areas are attractive to homebuyers and businesses.
Development Probability: Projects that have already initiated the development review process
have a higher likelihood of progressing than those still in the conceptual planning phases.
Utility Service Areas: LAM recognizes areas served by a water utility and these areas receive priority in the allocation. This layer updates itself throughout the allocation years with the
36
assumption that water service areas expand to meet the needs of areas experiencing significant growth.
Proximity to Activity Centers: Existing employment concentrations act as attractions for new
jobs. Future activity centers were defined in later LAM years in order to account for proposed centers in areas anticipated to see significant growth.
Proximity to Points of Interest: Proximity to amenities, scenic areas, recreation and other
attractions was found to be of increasing importance to residential developers. The exceptions are those that create noise or congestion such as airports or stadiums. Anticipated future points of interest were coded into future LAM years.
Lot Size: Developers agreed that oftentimes residential construction is influenced by the
economies of scale. That is, consolidated parcels of bulk land are often more attractive to larger residential developers because they provide an opportunity for higher returns on investments.
Since the developments coded into the land use layers far exceed the control totals for allowable growth, site scores serve as an “intelligent” way to evaluate which projects are most likely to build within the forecast period. LAM Output The result of the LAM allocation exists in two forms. One output consists of a shapefile, or spatial representation, of a regional land use forecast by land use category. This output is used as a powerful visual tool in presenting the forecast. The data attached to this output include housing and job density, therefore this file is also useful to calculate the number of housing and jobs forecast to an area, or to view density variations in the region. An example of this output is shown in Figure 10, 2030 Land Use Forecast.
37
Figure 11: 2030 Land Use Forecast for the Metropolitan Area
While land use is allocated by LAM to areas as small as ½ acre, this output is not designed to be used as a parcel level forecast. LAM was not designed to be a forecasting tool for geographies at that fine of a grain. The second output is a DASZ dataset that contains the actual data used in the forecast. This dataset exists as a spreadsheet and a shapefile. It aggregates the land use categories in each of the region’s 891 DASZs, applies average densities, and comes out with a total number of housing and jobs by zone. From housing and jobs several other variables are derived such as population, households, employment, income quintile and school enrollment. The process for deriving these variables from the housing and job allocation produced by LAM is outlined in section 4. The DASZ dataset is the subject of post-processing by MRCOG staff and, once finalized, is delivered to MRCOG member governments and the public as the “official” forecast. It is also this dataset that is read into MRCOG’s travel demand model for the purpose of performing traffic forecasts for the region.
38
4. Develop DASZ Forecast The primary output from the LAM Allocation is a spatial distribution of forecast land use in the region. Each development in the forecast is associated with a land use sector, a land area, and a housing or employment density. From these densities, a total number of housing and jobs is calculated and aggregated to DASZ geography. From them, other socioeconomic variables are also generated by DASZ through automated computations that follow LAM allocation. They include;
Total Population Population in Households Households Basic Employment Retail Employment Service Employment Income category Public School Enrollment UNM and CNM Enrollment
Population Variables The variables derived from the housing allocation are Total Population, Population in Households, and Households. The number of households was derived from housing by applying an occupancy rate to the total units allocated. The population in households was derived from applying a household size to the total households. Therefore, to get to households and population in households, occupancy rates and average household size projections were necessary. In many of the older parts of the region with established neighborhoods, the occupancy rate and average household size was used from the base dataset (2004). The challenge, however, comes with quickly growing or entirely new communities. These newer areas either do not have any data for 2004 or the existing data are volatile due to the changing nature of the area. LAM was programmed to recognize such areas and project occupancy rates and household sizes. In the DASZ module, LAM draws from a master DASZ file which was created based on land availability and density of housing. Zones that are considered to have an established zonal character were given a flag of ‘1’. Zones that were vacant or had a high percent of undeveloped land in the base year of 2004 were given a flag code of ‘0’. If a DASZ is coded as ‘0’ and the number of newly allocated housing units does not exceed the existing housing units in the same zone then the factors for occupancy and household size remain unchanged from the base year. If a zone was coded ‘0’, the occupancy rate and household size from the base data could be overrode if the number of newly allocated housing units exceeds the existing housing units. In the instance that allocated housing exceeded the existing housing, the calculation of households and population in households was accomplished using the following steps. Step 1: Calculate new occupancy rates in zones that have a flag code of ‘0’ and newly allocated housing units exceeded the existing housing units.
a) Occupancy rates in Bernalillo County (OccRtBC) = (base year households + (new single family units * .938) + (new multifamily units * .870)) / (base year housing units + new single family units + new multifamily units)
39
b) Occupancy rates outside Bernalillo County (OccRtOC) = (base year households + (new single family units * .907) + (new multifamily units * .736)) / (base year housing units + new single family units + new multifamily units)
Bernalillo County has unique characteristics because of its nature as an urban core, and therefore is calculated with different factors than the rest of the region. Step 2: Calculate an initial number of Households by combining the occupancy rates carried forward from the base year for established zones with the recalculated occupancy rates for the changing zones.
a) For Bernalillo County zones: HhldsBC=OccRtBC * total housing units b) For other counties: HhldsOC=OccRtOC * total housing units
Step 3: Revise the number of Households for all zones by balancing the initial calculation of households to the county control total for households. A check was performed to ensure that the number of households was less than or equal to the total number of housing units in each DASZ. Step 4: Calculate new average household sizes for all zones by combining base year data with data for new housing units. Factors are applied to the new housing units that reflect the projected decrease in household size throughout the forecast period.
a) Household sizes for zones in Bernalillo County (HHSZBC) = (base year population in households + (HHSZBSFfactor * (new single family units * .938)) + (HHSZBMFfactor * (multifamily units * .870))) / (base year housing units + new single family units + new multifamily units)
b) Household sizes for zones outside Bernalillo County (HHSZOC) = (base year population in households + (HHSZOSFfactor * (new single family units * .907)) + (HHSZOMFfactor * (multifamily units * .736))) / (base year housing units + new single family units + new multifamily units)
The household size factors for single and multi-family housing in and outside of Bernalillo County are
provided below.
Table 25: Factors for Household Size Bernalillo County Other Counties Forecast
Step 5: Calculate the initial Population in Households for all zones by multiplying the total number of households by household size. If the computed household size was less than 1 it was increased to 1. Step 6: Revise the Population in Households for all zones by balancing the initial population in households to the county control totals for Population in Households. An edit check was performed to ensure that the population in households was greater than or equal to the total number of households. Following each LAM iteration a new input file for the next iteration was generated. The new input file contained recomputed values for occupancy rate and household size that were generated from the updated totals for housing units, households, and population in households. This file served as input to the next
40
iteration, and so forth, until the 2030 forecast year. For any zone that previously had a flag code of ‘0’ but had gained at least 100 housing units, the flag code was changed to ‘1’. Total population was generated by adding the population in households to the number of persons living in group quarters. Population in group quarters was computed by MRCOG staff separately from the modeling process. The base year data for the group quarters population was grown throughout the forecast period and balanced to the forecast for group quarters in the sub-models. Employment Conversions The LAM allocation distributes employment throughout the region by land use code. The sub-models contain factors that are applied after allocation and convert employment by land use code to NAICS code. These conversion factors were developed by overlaying the 2004 EXLU, which contains employment by land use, with the 2004 EQUI data, which contains employment by NAICS. In creating the dataset that serves as input to the travel model, LAM’s automated processes then collapse the NAICS employment into three employment sectors; basic, retail, and service. Basic consists of all agricultural, mining, utilities, construction, manufacturing, wholesale trade, transportation and warehousing information and military jobs. Retail includes retail trade and eating and drinking employment. Services includes government, education, health, arts, recreation, financial, insurance, real estate, administration, management, professional/technical employment and other services. The final result is a DASZ forecast for basic, retail and service employment. Income Quintiles Each DASZ in the modeling area with one or more households is categorized with an income quintile from 1 (low income) to 5 (high income). Each category contains approximately 20 percent of the coded DASZs. Coding for the 2000 socioeconomic dataset was based on median household income from the 2000 Census. This coding was updated using the value data attached to residential building permits and tax assessor data in creating the base year dataset for 2004. Income quintile forecasts are based on a shapefile that is read by LAM following housing allocation. The shapefile codes an income quintile to every zone, even those without housing units. These codes are derived from historical income data, current permit data and housing values, as well as planner and developer input regarding expectations about income in a given community or area. For example, at the time of MTP development, developers were planning for entry-level housing in the southwest mesa. These zones were therefore coded with lower income quintiles. Mesa del Sol developers were planning for a mix of housing choices, therefore the DASZ shapefile reflected a variety of incomes. With each LAM iteration DASZs were identified if they received households where there previously were none, or if more than half of the total housing was due to growth. When this was the case, income quintiles were pulled from the income forecast shapefile and the quintiles were recomputed. Zones were moved up or down in the income quintile distribution based on where they fell in terms of median income compared to other zones within the same quintile. Those that had the lowest median incomes in the 2nd quintile may be knocked down into the 1st in the redistribution of quintiles, and those with the highest might climb into the 3rd quintile. The income shapefile was updated for each forecast year and served as input to the next iteration. Public School Enrollment A school forecast is required by the travel model to generate school-based trips. This forecast occurs in a separate LAM extension referred to as the LAM School Module. In the school module new schools are created, attendance areas are refined, and the number of students in each DASZ is calculated. Students per attendance area are summarized to total enrollment by school, and total enrollment is summarized and balanced to the county controls.
41
A forecast for schools began with the input of existing schools, which were automatically built. Next, new schools that are planned or reasonably expected to build were entered into the known layer and carried through into the School Module. These schools were revealed through meetings with school planners and developers in the region when questioned about plans for future schools and likely sites. Schools entered in the known layer have data attached regarding school type and the year in which the school can be built. Finally, a forecast for new schools that are not yet known was developed in the school module based on anticipated future demand, which is determined by the projection of households. A forecast for attendance areas began with base year boundaries for current school districts and school attendance areas. The school module projects future attendance areas to have a maximum of 7,000 persons in households for elementary schools; about 26,000 for middle schools; and about 45,000 for high schools. These population thresholds are based on current averages. In many cases, attendance areas fall well below these thresholds due to the proximity of schools in older areas or School Districts that have small populations. A forecast for enrollment by school began with a projection of students living in each DASZ, which was calculated from total households. An initial calculation of students in each DASZ was computed with the following equations that were calibrated from 2000 Census data. The R-square values for each of these equations exceeded .9.
Elementary Students = (population in households * 0.13805) – (estimated adult population * 0.08892) where estimated adult population equals the number of households times 1.89 (the median number of adults in households from the 2000 Census); Middle School Students = (population in households * 0.06066) – (estimated adult population * 0.03413); and High School Students = population in households * 0.04474.
Students by DASZ were summarized by attendance area for each school to get a preliminary forecast for enrollment by school. These enrollments were analyzed and if they exceeded the specific thresholds for households per school a new school was added or the attendance area was revised. Enrollment was summarized by elementary, middle and high school and then balanced to the control totals.
While the final DASZ forecast contains data regarding public school enrollment only, the School Module also generates a separate school file required by the travel model which specifies school location, attendance area and enrollment. UNM and CNM Enrollment UNM and CNM enrollment are forecast in the sub-models by branch location as described in the control totals section. In the development of the forecast dataset by zone, the forecast enrollments were simply inserted directly into each DASZ forecast to have a UNM or CNM branch.
42
5. Refine and Finalize DASZ Forecast In the post-processing step, MRCOG staff were careful to trust the modeling process and not to make revisions hastily based on expectations regarding development in the region. LAM is designed to look at attractiveness of development on several different layers and make informed predictions. If a development sprouted up in the forecast that wasn’t currently being planned, or if a development that was currently being planned did not build at the scale it was expected to, the modeler recognized that this may be entirely reasonable, and there have been many local examples of departures from development plans in the past. However, a model does not replace human reasonability checks and informed manual processes. Therefore the LAM output underwent several post-processing checks in order to finalize the 2030 forecast. First there is the concern regarding the potential for modeling error. The MTP forecasting process occurred simultaneously with a LAM Enhancement Project, where Planning Technologies, LLC was contracted to update and enhance the model to run more efficiently. Prior to forecast development, the model was run several times and the output was subject to intense scrutiny in order to correct any problems within the model coding and processes. Some modifications were made to model assumptions. By the time the final series of forecasts were run, staff felt confident that LAM was working properly. Reasonability checks were performed on the model output itself, which included the following steps; LAM forecasts were summarized to the Region and Counties and checked against the control
totals fed into LAM through the sub-models. Employment shares by County in the 2030 forecast were checked against 2004 shares. LAM allocated growth was checked against LAM inputs including the known, planned, and
redevelopment projects. LAM forecasts were summarized to municipal boundaries and checked against any existing and
independent municipal forecasts performed by MRCOG or other entities. Housing and employment shares in subareas of the region were analyzed over time. The difference between the 2030 forecast and the 2004 DASZ dataset was compared by DASZ. The difference between the 2030 forecast and the 2025 forecast performed in 2002 for the 2025
MTP was compared by DASZ. Residential growth was analyzed in terms of the subsequent allocation of supporting services such
as population serving jobs, emergency services, and educational facilities. Employment in special sectors such as airports, schools, and Kirtland Air Force Base was
reviewed. Final occupancy rates and household sizes by County and by DASZ were reviewed. Zones were checked to ensure that the number of households was less than or equal to the total
number of housing units. Housing to employment ratios were analyzed over time. School enrollment was recalculated based on adjustments made to housing during post-processing
routines. Work at home employment was adjusted based on revisions to the number of households that
occurred during post-processing. Revisions during these post-processing checks were made cautiously. In most cases, revisions to LAM output were due to technical and computational issues. In some cases, revisions were made based on professional judgment about growth allocation or new information made available after the model was run. Prost-processing for the 2030 dataset was over a month long process subject to review by MRCOG transportation staff. In July of 2007, the final 2030 socioeconomic forecast was publicly released.
43
APPENDIX A: Participants in the Forecasting Process Meetings were held with the following entities and individuals at various points throughout the forecasting process to discuss current and proposed development in the MRCOG region. Planning Departments and Government Officials Bernalillo County Planning City of Albuquerque Planning City of Albuquerque Redevelopment Village of Los Ranchos de Albuquerque Planning Village of Tijeras Municipal Office Sandoval County Planning City of Rio Rancho Development Services Village of Corrales Planning Town of Bernalillo Planning Valencia County Planning City of Belen Planning and Zoning Bosque Farms Planning and Zoning Village of Los Lunas Community Development Torrance County Manager’s Office City of Moriarty Mayor’s Office Town of Edgewood Planning and Zoning Schools Albuquerque Public Schools Belen Schools Los Lunas Schools Bernalillo Schools Moriarty Schools Rio Rancho Schools UNM TVI Development Community Ron Brown, Ron Brown & Associates Roger Cox, Roger Cox and Associates Leroy Chavez, Westland Corporation Tom Wade, Artistic Homes Herb Denish, Denish & Kline Associates Jacqueline Guilbault, Valley Improvement Association Jim Folkman, Homebuilders Association Greg Foltz, Coldwell Banker Commercial Bob Murphy, Sandia Properties Kurt Browning, Sandia Properties Dale Dekker, Dekker, Parich, Sabitini and Associates Doug Collister, High Desert Corporation Harry Relkin, Forest City Covington John Black, West Wood Realty Ben Spencer, Argus Development Company Chuck Gara, Gara Commercial John Murtaugh, Longford Homes Bob Pruitt, Centex Housing
44
Bill Campbell Jr, Bill Campbell Realty Stan Strickman & Chuck Haigland, Curb Inc. Rick Bressan, D. R. Horton Jody Paza, Fuller Homes Bob Coleman, KB Homes Chris Calott, Infill Solutions Robert Lupton, Raylee - Vantage Homes Jim Folkman, Home Builders Association of Central New Mexico Rob Dickson, Paradigm and Company Tribal Governments Sandia San Felipe Laguna Isleta Navajo To’hajjillee Santa Ana Land Grant Community Chilili San Antonia de las Huertas Tome Carnuel North Central New Mexico Economic Development District, Director of Planning Others Greater Albuquerque Housing Partnership Architectural Research Consultants, Incorporated Consensus Planning Kirtland Air Force Base State Land Office State Engineer’s Office Public Meetings were held to gather public input periodically throughout the forecasting process at various different venues.