37


230 Education and Culture
SY 2 0 11- 2 0 12 SY 2 0 12 - 2 0 13 SY 2 0 11- 2 0 12 SY 2 0 12 - 2 0 13
38,501 38,662 7,468 7,748
NCR 517 518 246 250
CAR 1,515 1,517 280 282Abra 278 280 34 36Apayao 163 163 27 27Benguet 405 405 75 75Ifugao 222 222 34 34Kalinga 245 245 46 46M t. Province 202 202 64 64
I - Ilocos Region 2,387 2,394 508 529Ilocos Norte 381 382 62 67Ilocos Sur 490 490 67 74La Union 335 336 84 88Pangasinan 1,181 1,186 295 300
II - Cagayan Valley 2,186 2,192 372 383Batanes 21 22 7 7Cagayan 721 723 109 113Isabela 941 943 176 180Nueva Vizcaya 331 332 44 46Quirino 172 172 36 37
III - Central Luzon 2,966 2,983 568 607Aurora 135 135 34 35Bataan 186 186 36 38Bulacan 560 560 101 107Nueva Ecija 757 774 119 126Pampanga 550 550 130 139Tarlac 510 510 76 84Zambales 268 268 72 78
IVA - CALABARZON 2,720 2,728 638 654Batangas 798 798 154 154Cavite 374 374 78 87Laguna 457 461 129 129Quezon 842 845 183 183Rizal 249 250 94 101
IVB - M IM AROPA 1,821 1,835 344 355M arinduque 181 182 44 44Occidental M indoro 298 301 49 50Oriental M indoro 463 465 80 82Palawan 663 671 134 140Romblon 216 216 37 39
C ont inued
Element aryR eg io n/ Province
Secondary
Philippines
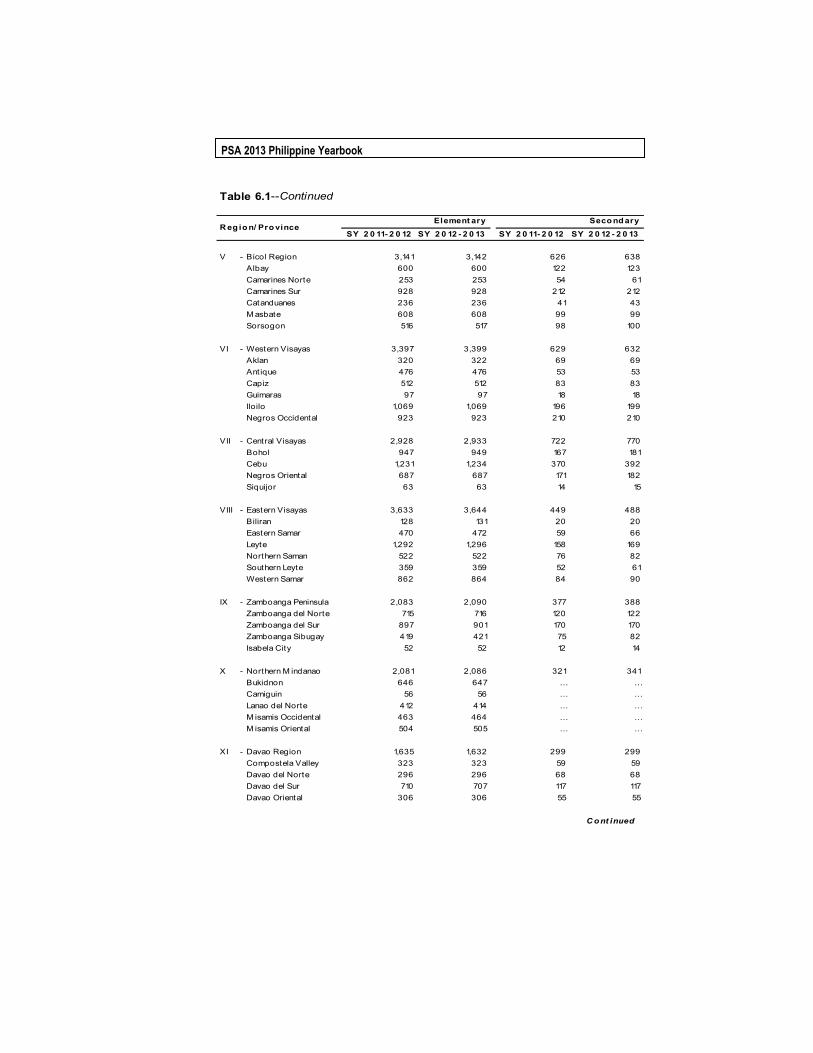
TABLE 6.1 Number of Public Schools in Elementary and Secondary Level, by Region and Province: SY 2011-2012 and SY 2012-2013
PSA 2013 Philippine Yearbook
Table 6.1--Continued
SY 2 0 11- 2 0 12 SY 2 0 12 - 2 0 13 SY 2 0 11- 2 0 12 SY 2 0 12 - 2 0 13
V - Bicol Region 3,141 3,142 626 638Albay 600 600 122 123Camarines Norte 253 253 54 61Camarines Sur 928 928 212 212Catanduanes 236 236 41 43M asbate 608 608 99 99Sorsogon 516 517 98 100
VI - Western Visayas 3,397 3,399 629 632Aklan 320 322 69 69Antique 476 476 53 53Capiz 512 512 83 83Guimaras 97 97 18 18Iloilo 1,069 1,069 196 199Negros Occidental 923 923 210 210
VII - Central Visayas 2,928 2,933 722 770Bohol 947 949 167 181Cebu 1,231 1,234 370 392Negros Oriental 687 687 171 182Siquijor 63 63 14 15
VIII - Eastern Visayas 3,633 3,644 449 488Biliran 128 131 20 20Eastern Samar 470 472 59 66Leyte 1,292 1,296 158 169Northern Saman 522 522 76 82Southern Leyte 359 359 52 61Western Samar 862 864 84 90
IX - Zamboanga Peninsula 2,083 2,090 377 388Zamboanga del Norte 715 716 120 122Zamboanga del Sur 897 901 170 170Zamboanga Sibugay 419 421 75 82Isabela City 52 52 12 14
X - Northern M indanao 2,081 2,086 321 341Bukidnon 646 647 … …Camiguin 56 56 … …Lanao del Norte 412 414 … …M isamis Occidental 463 464 … …M isamis Oriental 504 505 … …
XI - Davao Region 1,635 1,632 299 299Compostela Valley 323 323 59 59Davao del Norte 296 296 68 68Davao del Sur 710 707 117 117Davao Oriental 306 306 55 55
C ont inued
R eg ion/ Pro vinceElement ary Secondary

232 Education and Culture
Table 6.1--Concluded
SY 2 0 11- 2 0 12 SY 2 0 12 - 2 0 13 SY 2 0 11- 2 0 12 SY 2 0 12 - 2 0 13
XII - SOCCSKSARGEN 1,692 1,707 402 430North Cotabato 680 680 167 170Sarangani 238 238 59 67South Cotabato 401 407 104 112Sultan Kudarat 343 344 58 62Cotabato City 30 38 14 19
XIII - Caraga 1,626 1,664 391 400Agusan del Norte 294 302 82 83Agusan del Sur 446 458 93 96Surigao del Norte 342 353 78 78Surigao del Sur 434 439 108 113Dinagat Island 110 112 30 30
ARM M 2,173 2,198 296 302Basilan 192 193 28 30Lanao de Sur 796 808 134 134M aguindanao 543 548 66 68Sulu 409 414 45 45Tawi-Tawi 233 235 23 25
Source: Department of Education.
R eg ion/ ProvinceElement ary Secondary

PSA 2013 Philippine Yearbook
T o t al Pr ivat e Pub lic
Sat ell i t e Sub - LU C s Ot her T o t al andC amp uses T o t al Pr ivat
A Y 2 0 11- 2 0 12Total 110 437 547 95 14 656 1,643 2,299
NCR 8 9 17 16 3 36 302 338CAR 6 14 20 - 1 21 36 57I - Ilocos Region 6 21 27 4 - 31 83 114II - Cagayan Valley 5 18 23 1 - 24 49 73III - Central Luzon 12 37 49 11 1 61 165 226IVA - CALABARZON 5 55 60 13 1 74 229 303IVB - M IM AROPA 6 42 48 1 - 49 41 90V - Bicol Region 8 24 32 16 - 48 106 154VI - Western Visayas 11 53 64 9 1 74 77 151VII - Central Visayas 5 24 29 10 - 39 123 162VIII - Eastern Visayas 10 28 38 3 - 41 54 95IX - Zamboanga Peninsula 6 46 52 - - 52 54 106X - Northern M indanao 6 33 39 6 - 45 67 112XI - Davao Region 4 8 12 4 - 16 84 100XII - SOCCSKSARGEN 4 11 15 - - 15 77 92XIII - Caraga 4 10 14 1 - 15 45 60ARM M 4 4 8 - 7 15 51 66
A Y 2 0 12 - 2 0 13Total 112 451 563 98 14 675 1,699 2,374
NCR 8 8 16 16 4 36 314 350CAR 6 13 19 - 1 20 36 56I - Ilocos Region 6 21 27 4 - 31 80 111II - Cagayan Valley 5 20 25 - - 25 49 74III - Central Luzon 12 39 51 14 - 65 172 237IVA - CALABARZON 5 57 62 13 1 76 252 328IVB - M IM AROPA 6 43 49 1 - 50 39 89V - Bicol Region 9 23 32 16 - 48 110 158VI - Western Visayas 11 55 66 9 1 76 78 154VII - Central Visayas 5 22 27 10 - 37 123 160VIII - Eastern Visayas 10 28 38 3 - 41 54 95IX - Zamboanga Peninsula 6 54 60 1 - 61 55 116X - Northern M indanao 6 34 40 6 - 46 65 111XI - Davao Region 5 8 13 4 - 17 80 97XII - SOCCSKSARGEN 4 11 15 - - 15 93 108XIII - Caraga 4 10 14 1 - 15 41 56ARM M 4 5 9 - 7 16 58 74
N o t es: SUCs - State Universit ies and CollegesLUCs - Local Universit ies and Colleges
So urce: Commission on Higher Educat ion.
M ain
SU C s
TABLE 6.1a Distribution of Higher Education Institutions, by Region Sector, and Institutional Type: AY 2011-2012 and 2012-2013
R eg io n
Pub lic
234 Education and Culture
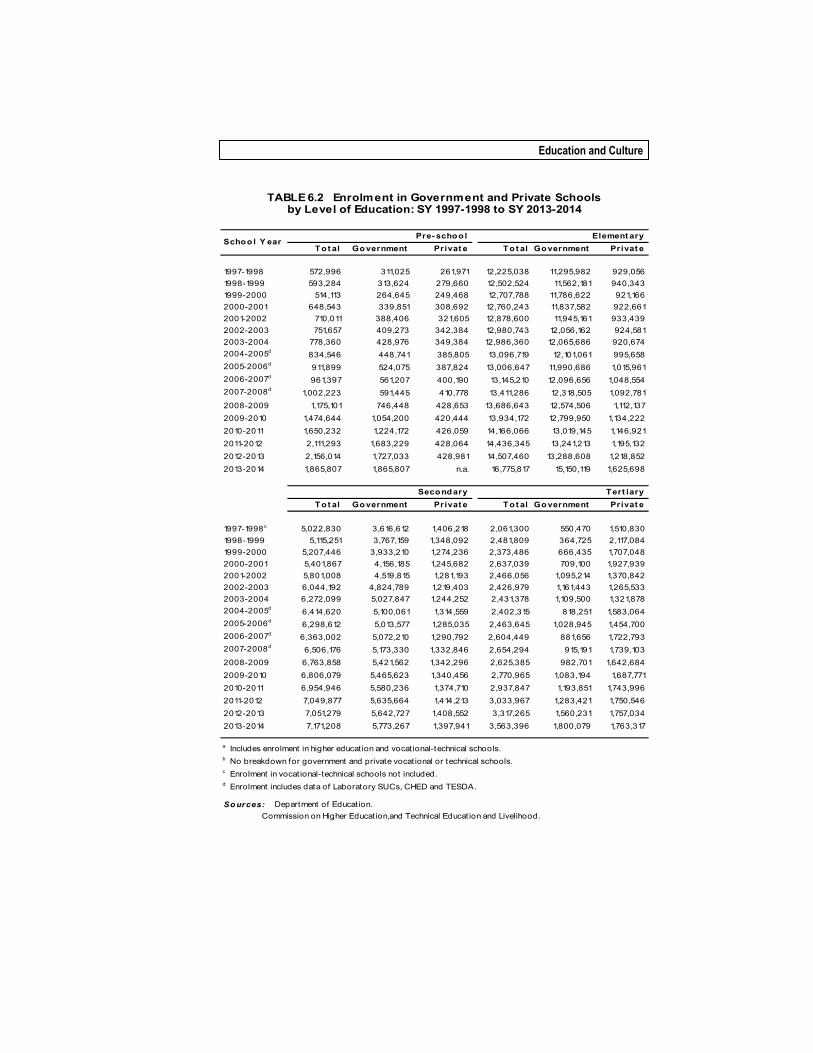
Pre- scho ol Element ary T o t al Go vernment Privat e T o t al Go vernment Pr ivat e
1997-1998 572,996 311,025 261,971 12,225,038 11,295,982 929,0561998-1999 593,284 313,624 279,660 12,502,524 11,562,181 940,3431999-2000 514,113 264,645 249,468 12,707,788 11,786,622 921,1662000-2001 648,543 339,851 308,692 12,760,243 11,837,582 922,6612001-2002 710,011 388,406 321,605 12,878,600 11,945,161 933,4392002-2003 751,657 409,273 342,384 12,980,743 12,056,162 924,5812003-2004 778,360 428,976 349,384 12,986,360 12,065,686 920,6742004-2005d 834,546 448,741 385,805 13,096,719 12,101,061 995,6582005-2006d 911,899 524,075 387,824 13,006,647 11,990,686 1,015,9612006-2007d 961,397 561,207 400,190 13,145,210 12,096,656 1,048,5542007-2008d 1,002,223 591,445 410,778 13,411,286 12,318,505 1,092,7812008-2009 1,175,101 746,448 428,653 13,686,643 12,574,506 1,112,1372009-2010 1,474,644 1,054,200 420,444 13,934,172 12,799,950 1,134,2222010-2011 1,650,232 1,224,172 426,059 14,166,066 13,019,145 1,146,9212011-2012 2,111,293 1,683,229 428,064 14,436,345 13,241,213 1,195,1322012-2013 2,156,014 1,727,033 428,981 14,507,460 13,288,608 1,218,8522013-2014 1,865,807 1,865,807 n.a. 16,775,817 15,150,119 1,625,698
Seco nd ary T ert iary T o t al Go vernment Privat e T o t al Go vernment Pr ivat e
1997-1998c 5,022,830 3,616,612 1,406,218 2,061,300 550,470 1,510,8301998-1999 5,115,251 3,767,159 1,348,092 2,481,809 364,725 2,117,0841999-2000 5,207,446 3,933,210 1,274,236 2,373,486 666,435 1,707,0482000-2001 5,401,867 4,156,185 1,245,682 2,637,039 709,100 1,927,9392001-2002 5,801,008 4,519,815 1,281,193 2,466,056 1,095,214 1,370,8422002-2003 6,044,192 4,824,789 1,219,403 2,426,979 1,161,443 1,265,5332003-2004 6,272,099 5,027,847 1,244,252 2,431,378 1,109,500 1,321,8782004-2005d 6,414,620 5,100,061 1,314,559 2,402,315 818,251 1,583,0642005-2006d 6,298,612 5,013,577 1,285,035 2,463,645 1,028,945 1,454,7002006-2007d 6,363,002 5,072,210 1,290,792 2,604,449 881,656 1,722,7932007-2008d 6,506,176 5,173,330 1,332,846 2,654,294 915,191 1,739,1032008-2009 6,763,858 5,421,562 1,342,296 2,625,385 982,701 1,642,6842009-2010 6,806,079 5,465,623 1,340,456 2,770,965 1,083,194 1,687,7712010-2011 6,954,946 5,580,236 1,374,710 2,937,847 1,193,851 1,743,9962011-2012 7,049,877 5,635,664 1,414,213 3,033,967 1,283,421 1,750,5462012-2013 7,051,279 5,642,727 1,408,552 3,317,265 1,560,231 1,757,0342013-2014 7,171,208 5,773,267 1,397,941 3,563,396 1,800,079 1,763,317
a Includes enrolment in higher educat ion and vocat ional-technical schools.b No breakdown for government and private vocat ional or technical schools.c Enrolment in vocat ional-technical schools not included.d Enrolment includes data of Laboratory SUCs, CHED and TESDA.
So urces: Department of Educat ion. Commission on Higher Educat ion,and Technical Educat ion and Livelihood.
TABLE 6.2 Enrolment in Government and Private Schoolsby Level of Education: SY 1997-1998 to SY 2013-2014
Scho o l Y ear
PSA 2013 Philippine Yearbook
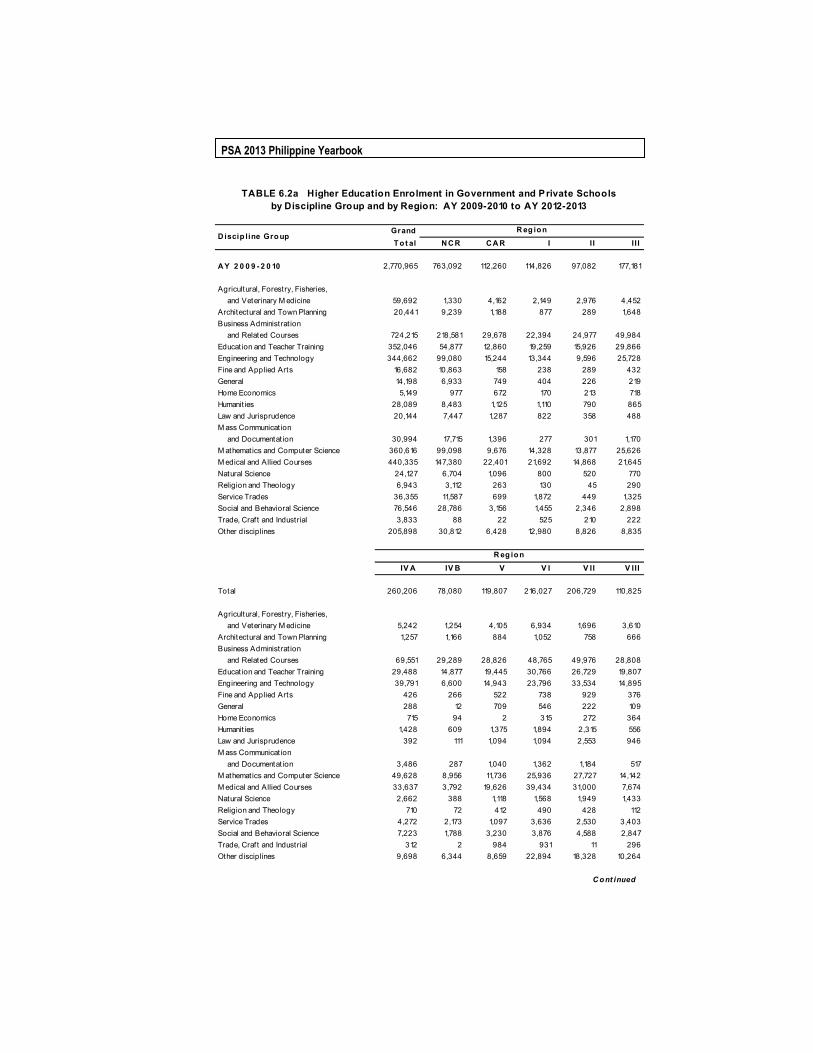
GrandT ot al N C R C A R I II I I I
A Y 2 0 0 9 - 2 0 10 2,770,965 763,092 112,260 114,826 97,082 177,181
Agricultural, Forestry, Fisheries, and Veterinary M edicine 59,692 1,330 4,162 2,149 2,976 4,452Architectural and Town Planning 20,441 9,239 1,188 877 289 1,648Business Administrat ion and Related Courses 724,215 218,581 29,678 22,394 24,977 49,984Educat ion and Teacher Training 352,046 54,877 12,860 19,259 15,926 29,866Engineering and Technology 344,662 99,080 15,244 13,344 9,596 25,728Fine and Applied Arts 16,682 10,863 158 238 289 432General 14,198 6,933 749 404 226 219Home Economics 5,149 977 672 170 213 718Humanit ies 28,089 8,483 1,125 1,110 790 865Law and Jurisprudence 20,144 7,447 1,287 822 358 488M ass Communicat ion and Documentation 30,994 17,715 1,396 277 301 1,170M athematics and Computer Science 360,616 99,098 9,676 14,328 13,877 25,626M edical and Allied Courses 440,335 147,380 22,401 21,692 14,868 21,645Natural Science 24,127 6,704 1,096 800 520 770Religion and Theology 6,943 3,112 263 130 45 290Service Trades 36,355 11,587 699 1,872 449 1,325Social and Behavioral Science 76,546 28,786 3,156 1,455 2,346 2,898Trade, Craft and Industrial 3,833 88 22 525 210 222Other disciplines 205,898 30,812 6,428 12,980 8,826 8,835
IV A IV B V V I V II V III
Total 260,206 78,080 119,807 216,027 206,729 110,825
Agricultural, Forestry, Fisheries, and Veterinary M edicine 5,242 1,254 4,105 6,934 1,696 3,610Architectural and Town Planning 1,257 1,166 884 1,052 758 666Business Administrat ion and Related Courses 69,551 29,289 28,826 48,765 49,976 28,808Educat ion and Teacher Training 29,488 14,877 19,445 30,766 26,729 19,807Engineering and Technology 39,791 6,600 14,943 23,796 33,534 14,895Fine and Applied Arts 426 266 522 738 929 376General 288 12 709 546 222 109Home Economics 715 94 2 315 272 364Humanit ies 1,428 609 1,375 1,894 2,315 556Law and Jurisprudence 392 111 1,094 1,094 2,553 946M ass Communicat ion and Documentation 3,486 287 1,040 1,362 1,184 517M athematics and Computer Science 49,628 8,956 11,736 25,936 27,727 14,142M edical and Allied Courses 33,637 3,792 19,626 39,434 31,000 7,674Natural Science 2,662 388 1,118 1,568 1,949 1,433Religion and Theology 710 72 412 490 428 112Service Trades 4,272 2,173 1,097 3,636 2,530 3,403Social and Behavioral Science 7,223 1,788 3,230 3,876 4,588 2,847Trade, Craft and Industrial 312 2 984 931 11 296Other disciplines 9,698 6,344 8,659 22,894 18,328 10,264
C ont inued
TABLE 6.2a Higher Education Enrolment in Government and Private Schoolsby Discipline Group and by Region: AY 2009-2010 to AY 2012-2013
R eg ion
R eg ion
D iscip line Gro up

236 Education and Culture
Table 6.2a--Continued
IX X X I X I I C arag a A R M M
Total 72,500 140,435 115,115 88,633 46,027 52,140
Agricultural, Forestry, Fisheries, and Veterinary M edicine 1,626 4,168 3,174 5,362 1,339 6,113Architectural and Town Planning 171 349 716 84 97 -Business Administrat ion and Related Courses 16,985 31,284 33,922 16,844 13,989 10,362Education and Teacher Training 9,988 17,826 13,425 10,544 8,897 17,466Engineering and Technology 6,235 13,539 9,797 7,386 6,758 4,396Fine and Applied Arts 286 353 455 218 89 44General 265 1,835 51 239 407 984Home Economics 66 274 0 58 0 239Humanit ies 1,149 1,576 2,292 1,146 670 706Law and Jurisprudence 511 1,124 798 266 157 696M ass Communicat ion and Documentat ion 242 282 1,284 288 59 104M athematics and Computer Science 8,464 19,194 9,989 12,869 4,896 4,474M edical and Allied Courses 13,925 28,428 22,866 7,200 2,815 1,952Natural Science 452 1,787 1,161 942 276 501Religion and Theology 31 397 415 36 - -Service Trades 777 1,836 437 129 133 0Social and Behavioral Science 2,774 3,619 3,239 2,224 888 1,609Trade, Craft and Industrial - - 218 12 - -Other disciplines 8,553 12,564 10,876 22,786 4,557 2,494
GrandTo t al N C R C A R I II I I I
A Y 2 0 10 - 2 0 11 2,937,847 793,198 116,222 130,011 107,311 194,621
Agricultural, Forestry, Fisheries, and Veterinary M edicine 63,679 3,365 3,580 2,074 3,144 5,804Architectural and Town Planning 23,103 9,473 1,318 1,009 922 2,274Business Administrat ion and Related Courses 785,305 224,766 32,748 25,325 26,987 52,739Education and Teacher Training 400,912 58,743 14,825 22,996 21,768 35,827Engineering and Technology 354,218 99,824 15,876 14,100 9,948 26,113Fine and Applied Arts 18,158 11,339 189 259 444 487General 11,619 6,354 628 386 200 189Home Economics 5,308 1,017 704 190 230 746Humanit ies 30,407 8,801 1,206 1,521 880 943Law and Jurisprudence 21,915 8,428 1,287 844 426 522M ass Communicat ion and Documentat ion 33,991 18,712 1,489 588 637 1,396M athematics and Computer Science 388,657 103,988 10,485 16,732 14,987 26,555M edical and Allied Courses 363,147 140,192 18,421 17,436 11,249 19,233Natural Science 25,425 6,914 1,129 888 536 837Religion and Theology 7,323 3,492 263 130 45 290Service Trades 47,530 12,426 774 1,898 523 1,486Social and Behavioral Science 83,371 29,611 3,392 1,656 2,563 3,244Trade, Craft and Industrial 2,996 56 20 459 157 175Other disciplines 270,783 45,697 7,888 21,520 11,665 15,761
C o nt inued
D iscip l ine GroupR eg ion
R eg ion

PSA 2013 Philippine Yearbook
Table 6.2a--Continued
IV A IV B V V I V II V II I
Total 279,374 99,545 129,039 218,488 211,959 116,705
Agricultural, Forestry, Fisheries, and Veterinary M edicine 5,400 2,065 4,230 6,887 1,929 3,548Architectural and Town Planning 986 584 930 1,097 1,798 975Business Administrat ion and Related Courses 73,690 34,866 33,625 52,888 53,897 31,744Educat ion and Teacher Training 36,983 18,925 21,952 34,211 27,928 20,978Engineering and Technology 40,478 6,936 15,607 24,104 34,226 15,386Fine and Applied Arts 464 297 591 788 988 467General 215 6 648 466 195 59Home Economics 715 94 11 315 272 364Humanit ies 1,476 692 1,387 1,922 2,375 572Law and Jurisprudence 458 123 1,182 1,177 2,570 987M ass Communicat ion and Documentat ion 3,520 524 1,133 1,399 1,272 666M athematics and Computer Science 52,527 9,676 14,016 26,444 28,219 15,777M edical and Allied Courses 27,904 3,022 16,726 30,023 26,244 4,392Natural Science 2,746 401 1,128 1,601 1,962 1,440Religion and Theology 710 72 412 490 428 112Service Trades 4,525 2,920 1,486 5,247 3,763 4,531Social and Behavioral Science 7,488 2,523 3,616 4,010 4,722 2,979Trade, Craft and Industrial 260 2 532 894 11 184Other disciplines 18,829 15,817 9,827 24,525 19,160 11,544
IX X X I X II C arag a A R M M
Total 79,939 136,485 115,715 98,080 52,008 59,147
Agricultural, Forestry, Fisheries, and Veterinary M edicine 1,585 3,898 3,723 4,160 1,506 6,781Architectural and Town Planning 229 557 767 84 100 -Business Administrat ion and Related Courses 20,229 36,786 37,928 21,722 14,337 11,028Educat ion and Teacher Training 10,618 18,425 14,666 11,092 10,594 20,381Engineering and Technology 6,944 13,834 10,127 8,561 7,424 4,730Fine and Applied Arts 354 416 524 287 157 107General 219 780 14 181 348 731Home Economics 66 274 5 58 8 239Humanit ies 1,342 1,798 2,370 1,346 870 906Law and Jurisprudence 570 1,194 828 316 239 764M ass Communicat ion and Documentat ion 338 366 1,364 314 75 198M athematics and Computer Science 8,829 21,976 11,874 15,632 5,266 5,674M edical and Allied Courses 13,489 13,802 11,644 6,422 1,986 962Natural Science 486 1,931 1,307 1,042 385 692Religion and Theology 31 397 415 36 - -Service Trades 1,897 2,588 1,293 572 834 767Social and Behavioral Science 3,440 3,953 3,839 2,624 1,522 2,189Trade, Craft and Industrial - - 240 6 - -Other disciplines 9,273 13,510 12,787 23,625 6,357 2,998
C o nt inued
D iscip line Gro up
R eg io n
R eg io n
238 Education and Culture
Table 6.2a--Continued
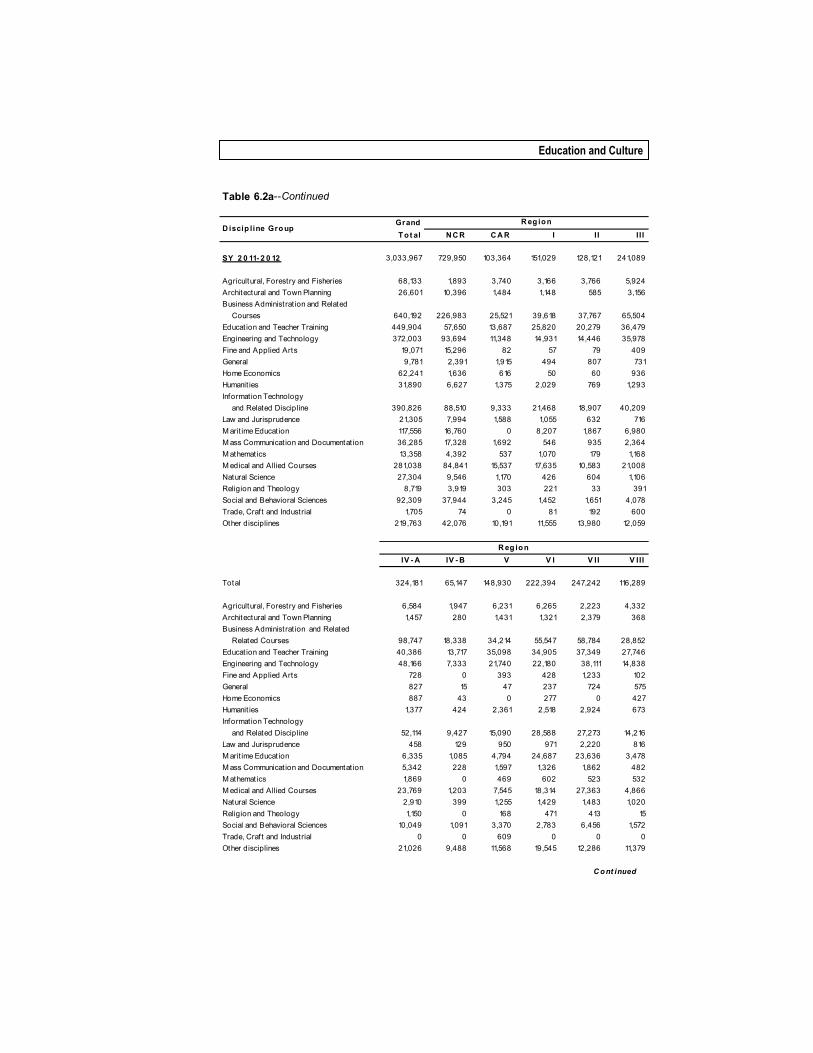
GrandT ot al N C R C A R I II I I I
SY 2 0 11- 2 0 12 3,033,967 729,950 103,364 151,029 128,121 241,089
Agricultural, Forestry and Fisheries 68,133 1,893 3,740 3,166 3,766 5,924Architectural and Town Planning 26,601 10,396 1,484 1,148 585 3,156Business Administrat ion and Related Courses 640,192 226,983 25,521 39,618 37,767 65,504Educat ion and Teacher Training 449,904 57,650 13,687 25,820 20,279 36,479Engineering and Technology 372,003 93,694 11,348 14,931 14,446 35,978Fine and Applied Arts 19,071 15,296 82 57 79 409General 9,781 2,391 1,915 494 807 731Home Economics 62,241 1,636 616 50 60 936Humanit ies 31,890 6,627 1,375 2,029 769 1,293Information Technology and Related Discipline 390,826 88,510 9,333 21,468 18,907 40,209Law and Jurisprudence 21,305 7,994 1,588 1,055 632 716M arit ime Educat ion 117,556 16,760 0 8,207 1,867 6,980M ass Communicat ion and Documentat ion 36,285 17,328 1,692 546 935 2,364M athematics 13,358 4,392 537 1,070 179 1,168M edical and Allied Courses 281,038 84,841 15,537 17,635 10,583 21,008Natural Science 27,304 9,546 1,170 426 604 1,106Religion and Theology 8,719 3,919 303 221 33 391Social and Behavioral Sciences 92,309 37,944 3,245 1,452 1,651 4,078Trade, Craft and Industrial 1,705 74 0 81 192 600Other disciplines 219,763 42,076 10,191 11,555 13,980 12,059
IV - A IV - B V V I V II V III
Total 324,181 65,147 148,930 222,394 247,242 116,289
Agricultural, Forestry and Fisheries 6,584 1,947 6,231 6,265 2,223 4,332Architectural and Town Planning 1,457 280 1,431 1,321 2,379 368Business Administrat ion and Related Related Courses 98,747 18,338 34,214 55,547 58,784 28,852Educat ion and Teacher Training 40,386 13,717 35,098 34,905 37,349 27,746Engineering and Technology 48,166 7,333 21,740 22,180 38,111 14,838Fine and Applied Arts 728 0 393 428 1,233 102General 827 15 47 237 724 575Home Economics 887 43 0 277 0 427Humanit ies 1,377 424 2,361 2,518 2,924 673Information Technology and Related Discipline 52,114 9,427 15,090 28,588 27,273 14,216Law and Jurisprudence 458 129 950 971 2,220 816M arit ime Educat ion 6,335 1,085 4,794 24,687 23,636 3,478M ass Communicat ion and Documentat ion 5,342 228 1,597 1,326 1,862 482M athematics 1,869 0 469 602 523 532M edical and Allied Courses 23,769 1,203 7,545 18,314 27,363 4,866Natural Science 2,910 399 1,255 1,429 1,483 1,020Religion and Theology 1,150 0 168 471 413 15Social and Behavioral Sciences 10,049 1,091 3,370 2,783 6,456 1,572Trade, Craft and Industrial 0 0 609 0 0 0Other disciplines 21,026 9,488 11,568 19,545 12,286 11,379
C ont inued
R eg ion
R eg ion
D iscip line Gro up

PSA 2013 Philippine Yearbook
Table 6.2a--Continued
IX X X I X II C araga A R M M
Total 92,925 136,969 130,782 95,740 55,675 44,140
Agricultural, Forestry and Fisheries 2,592 5,560 3,548 4,911 2,404 3,047Architectural and Town Planning 390 527 1,166 103 410 0Business Administrat ion and Related Courses 18,642 39,940 42,437 25,273 15,895 8,130Educat ion and Teacher Training 18,616 23,020 20,863 18,634 11,107 14,548Engineering and Technology 8,214 14,475 10,853 7,546 6,254 1,896Fine and Applied Arts 0 42 222 0 0 0General 297 419 206 83 13 0Home Economics 164 630 0 89 2 407Humanit ies 922 2,443 2,330 1,343 839 1,643Information Technology and Related Discipline 13,841 12,659 13,044 13,660 8,743 3,744Law and Jurisprudence 755 1,046 1,008 435 88 444M arit ime Educat ion 3,313 4,290 5,618 4,253 2,253 0M ass Communicat ion and Documentat ion 378 347 1,140 469 100 149M athematics 189 492 455 179 261 441M edical and Allied Courses 11,294 12,027 12,549 7,079 2,349 3,076Natural Science 605 2,208 1,269 699 509 666Religion and Theology 48 536 962 88 1 0Social and Behavioral Sciences 3,466 6,670 3,398 2,218 645 2,221Trade, Craft and Industrial 115 0 0 5 29 0Other disciplines 9,084 9,638 9,714 8,673 3,773 3,728
GrandT o t al N C R C A R I II I I I
SY 2 0 12 - 2 0 13 3,022,074 804,133 115,042 153,730 133,224 250,898
Agricultural, Forestry and Fisheries 113,687 1,963 4,112 4,228 3,979 6,126Architectural and Town Planning 28,207 10,715 1,868 1,894 684 3,892Business Administrat ion and Related Courses 725,162 233,243 27,414 39,434 38,010 66,435Educat ion and Teacher Training 381,379 60,236 15,828 26,729 21,644 37,089Engineering and Technology 333,102 95,159 11,880 12,366 14,928 36,825Fine and Applied Arts 90,950 16,008 88 61 84 558General 16,494 2,421 2,831 500 888 839Home Economics 29,223 1,952 632 48 79 1,124Humanit ies 31,163 8,121 1,422 2,138 849 1,387Information Technology and Related Discipline 397,167 92,203 9,949 21,766 19,227 41,786Law and Jurisprudence 24,614 8,484 1,739 1,125 786 897M arit ime Educat ion 123,887 26,990 0 8,797 1,993 7,286M ass Communicat ion and Documentat ion 63,233 18,794 2,150 600 1,134 2,892M athematics 13,435 4,488 557 666 384 1,477M edical and Allied Courses 330,948 123,427 17,646 17,774 11,294 21,837Natural Science 25,237 10,244 1,302 558 771 1,592Religion and Theology 10,990 5,683 390 294 39 566Social and Behavioral Sciences 81,765 38,442 3,973 2,878 1,728 4,878Trade, Craft and Industrial 2,229 94 0 81 344 822Other disciplines 199,202 45,466 11,261 11,793 14,379 12,590
C o nt inued
R eg ionD iscip line Gro up
R eg io n

240 Education and Culture
Table 6.2a--Concluded
IV - A IV - B V V I V II V II I
Total 330,121 88,299 155,861 266,771 278,881 153,404
Agricultural, Forestry and Fisheries 6,896 2,110 6,896 8,965 8,862 7,296Architectural and Town Planning 1,526 333 1,575 1,787 2,896 667Business Administrat ion and Related Related Courses 98,222 28,966 35,010 61,844 60,267 34,704Educat ion and Teacher Training 41,678 14,641 35,947 46,899 39,286 30,826Engineering and Technology 48,777 7,948 22,116 24,792 40,063 18,248Fine and Applied Arts 909 0 459 885 2,011 1,665General 888 17 101 734 2,057 1,120Home Economics 901 45 0 539 0 1896Humanit ies 1,438 501 2,894 3,218 3,293 2,128Informat ion Technology and Related Discipline 52,898 9,566 15,977 32,866 30,828 18,694Law and Jurisprudence 666 210 1,186 1,144 110 1,019M arit ime Educat ion 6,539 1,188 5,125 28,767 28,968 6,333M ass Communicat ion and Documentat ion 5,964 252 1,877 2,359 3,954 2,896M athematics 2,010 0 610 1,144 862 939M edical and Allied Courses 23,966 1,295 7,940 22,876 28,768 6,544Natural Science 3,010 502 1,354 1,863 2,112 1,929Religion and Theology 1,436 0 239 677 917 749Social and Behavioral Sciences 10,569 1,138 3,541 4,986 7,436 2,196Trade, Craft and Industrial 0 0 888 0 0 0Other disciplines 21,828 19,587 12,126 20,426 16,191 13,555
IX X X I X II C araga A R M M
Total 99,582 142,482 137,244 101,160 59,249 47,184
Agricultural, Forestry and Fisheries 2,885 5,787 4,027 5,288 2,596 3,476Architectural and Town Planning 444 614 1,594 239 610 0Business Administrat ion and Related Courses 19,762 40,210 43,034 26,024 16,101 8,733Educat ion and Teacher Training 18,926 23,986 21,266 18,892 11,509 14,898Engineering and Technology 9,005 15,076 11,584 7,863 6,797 1,929Fine and Applied Arts 0 52 318 0 0 0General 359 552 543 101 20 0Home Economics 284 677 0 125 17 510Humanit ies 1,126 2,587 2,596 1,585 888 1,794Informat ion Technology and Related Discipline 14,292 13,110 13,888 14,096 8,939 3,897Law and Jurisprudence 928 1,439 535 539 101 556M arit ime Educat ion 3,876 4,587 5,874 4,872 2,798 0M ass Communicat ion and Documentat ion 557 501 1,629 666 210 211M athematics 322 558 610 394 333 498M edical and Allied Courses 12,200 12,596 12,626 7,844 2,797 3,344Natural Science 777 2,584 1,549 777 784 777Religion and Theology 59 679 1,044 114 5 0Social and Behavioral Sciences 3,676 7,010 3,592 2,787 701 2,595Trade, Craft and Industrial 228 0 0 15 55 0Other disciplines 9,876 9,877 10,935 8,939 3,988 3,966
N o t e: ª Includes enrollment in pre-baccalaureate, baccalaureate, post-baccalaureate, master's and doctorate programs.
So urces: Commission on Higher Educat ion.
R eg ion
D iscip line GroupR eg ion

PSA 2013 Philippine Yearbook
2 0 0 8 - 2 0 0 9 2 0 0 9 - 2 0 10 2 0 10 - 2 0 11 2 0 11- 2 0 12 2 0 12 - 2 0 13
Total 2,509,959 2,643,335 2,799,260 2,882,704 3,123,775
Agricultural, Forestry, Fisheries, Veterinary M edicine 59,208 59,745 63,471 68,098 81,740Architectural and Town Planning 17,994 20,491 23,116 26,356 31,352Business Administrat ion and Related Courses 647,292 723,997 796,302 845,031 915,191Education and Teacher Training 322,703 352,343 404,261 450,225 536,854Engineering and Technology 315,453 339,045 354,321 367,620 406,831Fine and Applied Arts 16,362 16,327 18,149 19,260 21,778General 10,830 12,365 12,832 10,232 10,586Home Economics 4,852 5,095 5,331 5,681 6,655Humanit ies 28,560 28,219 30,470 31,775 35,605Information Technology 302,057 346,427 377,438 393,913 404,813Law and Jurisprudence 21,067 21,099 23,087 22,479 24,092M arit ime 68,115 88,567 111,469 125,905 152,657M ass Communicat ion and Documentat ion 27,363 28,818 33,284 35,068 35,520M athematics 12,115 12,310 12,792 13,595 13,992M edical and Allied Courses 520,026 440,160 365,715 284,598 243,285Natural Science 23,580 24,242 25,758 27,442 30,394Religion and Theology 7,266 6,805 7,300 8,682 9,593Service Trades 29,546 36,390 46,960 50,850 57,734Social and Behavioral Science 71,746 76,677 83,537 92,403 101,617Trade, Craft and Industrial 3,824 4,213 3,667 3,491 3,486 CoursesOther Disciplines 117,839 131,033 151,935 161,514 193,490
N o t e: Figures include pre-baccalaureate to doctoral programs.
So urce: Commission on Higher Education.
TABLE 6.3 Higher Education Enrollment, by Discipline Group: AY 2008-2009 to AY 2012-2013
A cad emic Y earD iscip l ine St ud y

242 Education and Culture
2 0 0 8 - 2 0 0 9 2 0 0 9 - 2 0 10 2 0 10 - 2 0 11 2 0 11- 2 0 12 2 0 12 - 2 0 13
Total 470,139 481,331 496,949 522,570 564,769
Agricultural, Forestry, Fisheries, Veterinary M edicine 9,862 10,043 9,618 11,605 13,796Architectural and Town Planning 2,322 2,274 2,245 2,278 2,624Business Administrat ion and Related Courses 107,403 117,399 125,840 141,327 164,541Educat ion and Teacher Training 55,849 56,419 62,715 69,738 86,903Engineering and Technology 47,468 49,373 57,439 56,690 59,399Fine and Applied Arts 2,079 2,346 2,516 3,207 2,813General 1,426 1,587 1,402 2,032 1,211Home Economics 955 1,107 809 997 966Humanit ies 4,647 5,196 4,981 5,562 6,577Informat ion Technology 44,448 49,786 54,225 66,672 72,879Law and Jurisprudence 2,916 2,829 2,927 2,743 2,705M arit ime 11,716 14,439 14,430 19,515 23,506M ass Communicat ion and Documentat ion 5,156 5,243 5,334 5,463 6,475M athematics 2,100 2,021 1,903 2,038 2,984M edical and Allied Courses 128,381 116,380 103,582 80,800 57,427Natural Science 4,155 3,949 3,910 4,330 6,626Religion and Theology 1,138 1,073 1,357 1,542 1,442Service Trades 3,312 5,067 6,184 6,244 8,629Social and Behavioral Science 12,598 12,723 13,168 13,816 15,953Trade, Craft and Industrial Courses 1,057 1,298 1,117 1,255 374Other Disciplines 21,151 20,779 21,247 24,716 26,939
N ot e: Figures include pre-baccalaureate to doctoral programs.
Source: Commission on Higher Educat ion.
D iscip line St ud yA cademic Y ear
TABLE 6.3a Higher Education Graduates, by Discipline Group: AY 2008-2009 to AY 2012-2013

PSA 2013 Philippine Yearbook
A cademic Y ear N umber o f F oreig n St udent s
1994 - 1995 4,7911995 - 1996 5,2841996 - 1997 4,8641997 - 1998 4,4191998 - 1999 3,5161999 - 2000 2,6022000 - 2001 2,3232001 - 2002 2,8362002 - 2003 4,760
2003 - 2004 2,1612004 - 2005 4,8362005 - 2006 6,8992006 - 2007 2,3032007 - 2008 7,3152008 - 2009 6,9672009 - 2010 4,9622010 - 2011 6,9172011 - 2012 8,207
So urce: Commission on Higher Educat ion.
TABLE 6.4 Number of Foreign Students, by Academic Year:AY 1994-1995 to AY 2011-2012

244 Education and Culture
C ount ry N at io nali t y N umber C ount ry N at ionalit y N umber
To t al 8,469 Kenya Kenyan 8Korea Korean 1,755
Afghanistan Afghan 2 Kuwait Kuwait i 65Angola Angolan 6 Laos Lao 13Armenia Armenian 4 M alaysia M alaysian 17Australia Australian 36 M arshall Island M arshallese 8Austria Austrian 13 M exico M exican 15Bahrain Bahraini 5 M icronesia M icronesian 9Bangladesh Bangladeshi 30 M ongolia M ongolian 4Belarus Belarusian 1 Nepal Nepalese 106Belgium Belgian 4 Netherlands Dutch 2Brazil Brazilian 6 New Zealand New Zealander 13Brunei Bruneian 5 Nigeria Nigerian 12Burma/M yanmar Burmese/M yanmar 28 Norway Norwegian 9Cambodia Cambodian 29 Papua New Guinea Papua New Guinean 15Cameroon Cameroonian 31 Pakistan Pakistani 51Canada Canadian 4 Palest ine Palest inian 5China, People's Republic of Chinese 72 Panama Panamanian 2Colombia Colombian 2,740 Paraguay Paraguayan 3Congo Congan 5 Portugal Portuguese 2Costa Rica Costa Rican 2 Russia Russian 2Croat ia Croat ian 2 Rwanda Rwandan 1Dominican Republic Dominican 2 Samoa/Western Samoa Samoan 2East Timor East Timorese 7 Saudi Arabian Saudi Arabian 9Egypt Egypt ian 5 Singapore Singaporean 13Erithrea Erithean 10 Slovakia Slovak 9Estonia Estonia 3 Solomon Islands Solomon Islander 2Ethiopia Ethiopian 12 Somalia Somalian 2France French 5 Spain Spanish 20French Polynesia French Polynesian 12 Sri Lanka Sri Lankan 15Germany German 4 Sudan Sudanese 69Ghana Ghanaian 18 Sweden Swedish 27Great Britain Brit ish 55 Switzerland Swiss 3Greece Greek 9 Syria Syrian 9Guyana Guyanese 2 Taiwan Taiwanese 551Hait i Hait ian 2 Thailand Thai 60India Indian 436 Timor Atoni 2Indonesia Indonesian 8 Turkey Turkish 2Iran Iranian 654 USA American 902Ireland Irish 2 Vanuatu Ni-Vanuatu 40Italy Italian 2 Vietnam Vietnamese 290Japan Japanese 10 Yemen Yemanin 2Jordan Jordanian 64 Zambia Zambian 3
So urce: Commission on Higher Educat ion.
TABLE 6.4a Foreign Students in the Philippines, by Nationality: AY 2011-2013

PSA 2013 Philippine Yearbook
Scho o l Y ear T ot al PESFA SN PLP N ISGP C F D F SEGEA P SSP HED F Ot hers
1990-1991 20,527 8,898 2,129 4,243 - 1,449 1,432 - 2,376.00 1991-1992 40,790 10,700 1,690 15,862 29 6,634 5,875 - - 1992-1993 80,623 6,843 2,023 5,384 50 18,424 17,721 - 30,178 1993-1994 67,982 28,372 326 9,503 395 9,047 8,575 - 11,764 1994-1995 47,898 37,357 3,802 1,766 446 1,857 882 - 1,788
1995-1996 35,443 27,232 2,035 1,620 671 1,196 798 - 1,891 1996-1997 35,468 19,483 1,329 1,837 1,534 1,860 786 162 8,477 1997-1998 43,059 15,137 2,366 1,873 1,859 1,844 849 6,511 12,620 1998-1999 45,294 16,732 2,266 1,777 2,038 1,851 809 8,156 11,665 1999-2000 59,566 16,950 2,236 1,502 940 1,711 978 28,587 6,662
2000-2001 40,755 16,250 1,786 1,502 - 1,711 978 - 18,528 2001-2002 36,441 14,650 1,190 1,264 - 1,300 1,000 - 17,037 2002-2003 26,293 16,732 2,266 1,777 2,038 1,851 809 - 820 2003-2004 51,698 15,989 977 1,379 165 1,419 1,500 - 30,269 2004-2005 67,426 25,578 406 8,673 289 8,767 9,129 - 14,584
2005-2006 72,826 29,777 2,044 5,366 1,375 7,424 12,468 - 14,372 2006-2007 80,777 34,426 2,286 9,439 2,010 9,888 10,502 - 12,226 2007-2008 52,757 - 578 - 1,474 - - - 50,705 2008-2009 53,815 2,232 2,300 101 1,737 88 990 380 45,987 2009-2010 55,279 2,686 2,439 216 1,833 94 988 387 46,636 2010-2011 60,566 12,442 2,694 301 1,859 102 1,010 402 41,756
N o t es: PESFA - Private Educat ion Student Financial Assistance. SNPLP - Study-Now-Pay-Later Plan. NISGP - National Integrat ion Study Grant Program. CFDF - College Faculty Development Fund. SEGEAP - Selected Ethnic Group Educat ional Assistance Program. SSP - State Scholarship Program. HEDF - Higher Educat ion Development Fund.
So urce: Commission on Higher Educat ion.
TABLE 6.5 Number of Scholarship Awardees, by Program: SY 1990-1991 to SY 2010-2011

246 Education and Culture
Prog rams N umber o f Scho lar
Total 60,566
CHED Scholarship Program for Bright M indanaoan M uslims (CSPBM M ) -CHED Special Study Grant Program for Congressional Districts (CSSGPCD) 41,756CHED Senate Study Grant Program (CSSGP) -Island Off-Luzon -National Integrat ion Study Grant Program (NISGP) 301OPAPP-CHED Study Grant Program for Rebel Returnees (OPAPP-CHED-SGPRR) -Private Educat ion Student Financial Assistance Program (PESFA) 12,442Selected Ethnic Group Educat ional Assistance Program (SEGEAP) 102State Scholarship Program (SSP) 1,010State Scholarship Program-BSED SSUC (SSP BSED-SSUC) -Student Financial Assistance Programs (STFUP) -Student Loan Fund for Region V (SLF-R5) -Student Loan Program for Centers for Excellence (SLP for COE) 2,261Study Now-Pay-Later Plan (SNPLP) 2,694Iskolar ng M ahirap na Pamilya (IPM ) -
Source: Commission on Higher Educat ion (CHED).
TABLE 6.6 Beneficiaries of Commission on Higher Education Student Financial Assistance Programs: 2009-2011

PSA 2013 Philippine Yearbook
SY 2 0 0 4 - SY 2 0 0 5- SY 2 0 0 6 - SY 2 0 0 7-2 0 0 5* 2 0 0 6 * 2 0 0 7 2 0 0 8
Philippines 87.11 84.44 83.22 84.84
NCR 94.82 92.61 92.89 94.42CAR 86.40 82.58 80.86 81.50I - Ilocos Region 86.98 84.87 82.74 83.14II - Cagayan Valley 82.90 79.92 77.70 77.53III - Central Luzon 92.03 90.77 89.14 91.37IVA - CALABARZON 95.10 92.87 92.36 94.02IVB - M IM AROPA 88.00 84.39 83.84 84.07V - Bicol Region 87.78 85.43 83.80 85.41VI - Western Visayas 80.49 77.14 74.96 75.44VII - Central Visayas 83.53 80.08 78.87 80.28VIII - Eastern Visayas 83.44 80.03 78.15 79.19IX - Zamboanga Peninsula 82.83 79.14 77.59 78.99X - Northern M indanao 84.16 80.20 78.96 80.60XI - Davao Region 82.54 79.01 75.89 77.38XII - SOCCSKSARGEN 79.99 77.43 76.35 78.65XIII - Caraga 75.08 74.80 77.76 78.69ARM M 90.01 87.26 85.82 94.01
SY 2 0 0 8 - SY 2 0 0 9 - SY 2 0 10 - SY 2 0 11-2 0 0 9 2 0 10 2 0 11 2 0 12
Philippines 85.12 86.89 88.90 88.74
NCR 93.69 92.61 93.79 93.69CAR 81.93 84.35 85.66 85.44I - Ilocos Region 82.85 83.44 84.55 83.85II - Cagayan Valley 76.23 78.33 80.30 79.32III - Central Luzon 90.93 91.24 90.53 91.22IVA - CALABARZON 94.10 93.89 92.02 93.59IVB - M IM AROPA 85.42 86.78 86.89 86.76V - Bicol Region 85.07 85.67 86.86 85.87VI - Western Visayas 74.93 76.33 78.44 77.68VII - Central Visayas 81.38 82.44 81.72 82.39VIII - Eastern Visayas 80.33 81.37 82.45 81.86IX - Zamboanga Peninsula 79.25 80.28 81.84 81.24X - Northern M indanao 81.23 81.86 82.90 82.32XI - Davao Region 78.00 79.12 81.66 80.38XII - SOCCSKSARGEN 80.12 80.89 82.41 82.24XIII - Caraga 76.39 77.87 78.90 78.79ARM M 99.85 98.76 98.87 99.75
* Data for public school only.
So urce: Department of Educat ion.
N o t e: Net part icipat ion rate is def ined as the proport ion of the number of enrollees 7-12/6-11 years old to populat ion 7-12/6-11 years old.
R eg io n
TABLE 6.7 Net Participation Rate in Public and Private ElementarySchools, by Region: SY 2004-2005 to SY 2011-2012

248 Education and Culture
SY 2 0 0 5- SY 2 0 0 6 - SY 2 0 0 7- SY 2 0 0 8 -2 0 0 6 * 2 0 0 7 2 0 0 8 2 0 0 9
Philippines 58.54 58.59 60.26 60.74
NCR 74.99 75.12 80.16 80.79CAR 57.81 59.10 57.04 57.14I - Ilocos Region 65.83 68.19 67.62 68.22II - Cagayan Valley 59.02 58.85 59.47 58.34III - Central Luzon 68.93 69.13 70.78 71.24IVA - CALABARZON 69.10 71.26 73.86 74.89IVB - M IM AROPA 56.08 58.86 59.28 59.67V - Bicol Region 53.24 54.33 55.97 55.24VI - Western Visayas 54.91 52.89 53.83 53.98VII - Central Visayas 54.76 53.86 54.57 55.49VIII - Eastern Visayas 50.09 49.88 51.49 53.28IX - Zamboanga Peninsula 47.17 47.70 50.18 49.28X - Northern M indanao 51.27 51.23 51.70 50.67XI - Davao Region 49.02 47.84 49.12 48.61XII - SOCCSKSARGEN 51.33 48.85 50.62 51.80XIII - Caraga 48.52 48.89 49.85 51.09ARM M 35.61 32.56 34.58 37.98
SY 2 0 0 9 - SY 2 0 10 - SY 2 0 11- SY 2 0 12 -2 0 10 2 0 11 2 0 12 2 0 13
Philippines 59.86 61.26 64.83 64.61
NCR 76.56 77.76 78.77 78.38CAR 62.96 62.70 67.74 68.80I - Ilocos Region 71.11 72.67 75.91 76.48II - Cagayan Valley 65.45 68.25 69.69 69.19III - Central Luzon 68.08 70.22 75.73 73.39IVA - CALABARZON 66.98 67.59 71.61 71.22IVB - M IM AROPA 56.49 56.55 61.32 62.28V - Bicol Region 55.03 55.60 60.85 61.10VI - Western Visayas 55.42 56.06 61.81 61.46VII - Central Visayas 56.37 58.62 60.91 63.00VIII - Eastern Visayas 52.74 54.44 58.14 58.87IX - Zamboanga Peninsula 49.24 58.72 50.30 50.08X - Northern M indanao 50.08 53.66 55.19 56.13XI - Davao Region 53.35 55.36 56.16 56.31XII - SOCCSKSARGEN 51.62 51.27 53.39 53.39XIII - Caraga 54.58 55.60 56.77 58.12ARM M 39.82 33.76 44.26 39.61
* Data for public school only.
So urce: Department of Educat ion.
N o t e: Net part icipat ion rate is def ined as the proport ion of the number of enrollees 13-16 years old to thepopulat ion 13-16 years old.
R eg io n
TABLE 6.7a Net Participation Rate in Public and Private Secondary Schools, by Region: SY 2005-2006 to SY 2012-2013
PSA 2013 Philippine Yearbook
SY 2 0 0 5- SY 2 0 0 6 - SY 2 0 0 7- SY 2 0 0 8 -2 0 0 6 * 2 0 0 7 2 0 0 8 2 0 0 9
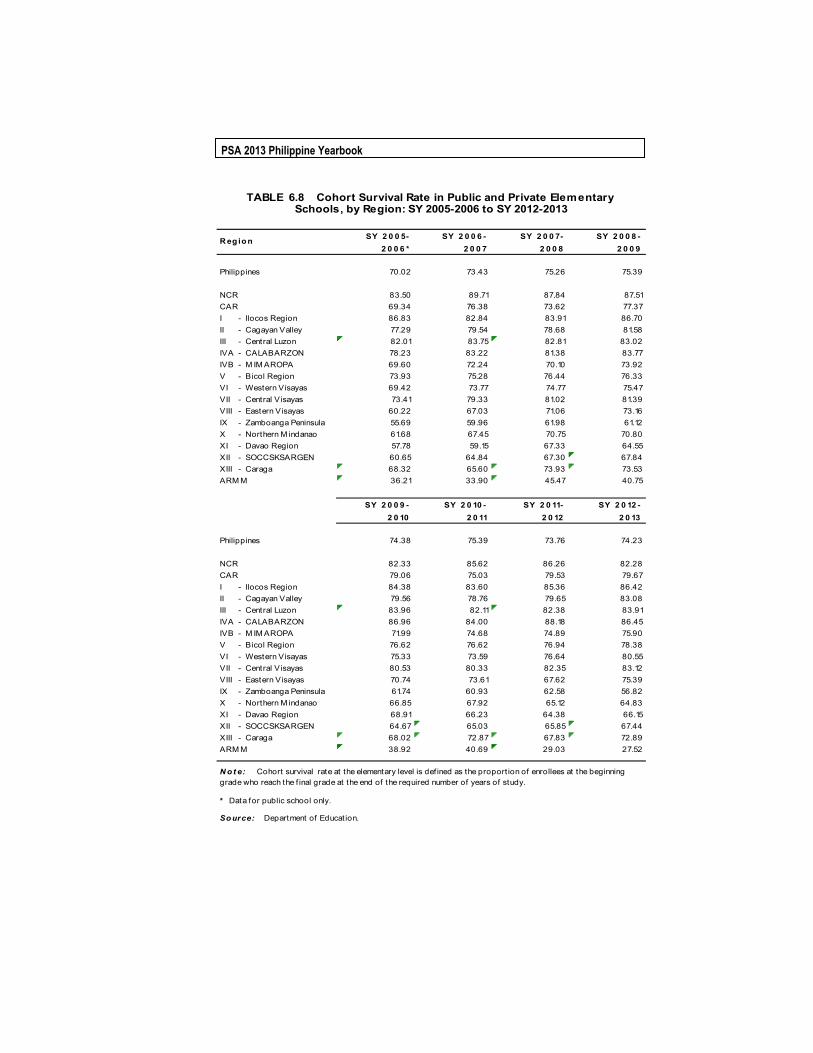
Philippines 70.02 73.43 75.26 75.39
NCR 83.50 89.71 87.84 87.51CAR 69.34 76.38 73.62 77.37I - Ilocos Region 86.83 82.84 83.91 86.70II - Cagayan Valley 77.29 79.54 78.68 81.58III - Central Luzon 82.01 83.75 82.81 83.02IVA - CALABARZON 78.23 83.22 81.38 83.77IVB - M IM AROPA 69.60 72.24 70.10 73.92V - Bicol Region 73.93 75.28 76.44 76.33VI - Western Visayas 69.42 73.77 74.77 75.47VII - Central Visayas 73.41 79.33 81.02 81.39VIII - Eastern Visayas 60.22 67.03 71.06 73.16IX - Zamboanga Peninsula 55.69 59.96 61.98 61.12X - Northern M indanao 61.68 67.45 70.75 70.80XI - Davao Region 57.78 59.15 67.33 64.55XII - SOCCSKSARGEN 60.65 64.84 67.30 67.84XIII - Caraga 68.32 65.60 73.93 73.53ARM M 36.21 33.90 45.47 40.75
SY 2 0 0 9 - SY 2 0 10 - SY 2 0 11- SY 2 0 12 -2 0 10 2 0 11 2 0 12 2 0 13
Philippines 74.38 75.39 73.76 74.23
NCR 82.33 85.62 86.26 82.28CAR 79.06 75.03 79.53 79.67I - Ilocos Region 84.38 83.60 85.36 86.42II - Cagayan Valley 79.56 78.76 79.65 83.08III - Central Luzon 83.96 82.11 82.38 83.91IVA - CALABARZON 86.96 84.00 88.18 86.45IVB - M IM AROPA 71.99 74.68 74.89 75.90V - Bicol Region 76.62 76.62 76.94 78.38VI - Western Visayas 75.33 73.59 76.64 80.55VII - Central Visayas 80.53 80.33 82.35 83.12VIII - Eastern Visayas 70.74 73.61 67.62 75.39IX - Zamboanga Peninsula 61.74 60.93 62.58 56.82X - Northern M indanao 66.85 67.92 65.12 64.83XI - Davao Region 68.91 66.23 64.38 66.15XII - SOCCSKSARGEN 64.67 65.03 65.85 67.44XIII - Caraga 68.02 72.87 67.83 72.89ARM M 38.92 40.69 29.03 27.52
* Data for public school only.
So urce: Department of Education.
N ot e: Cohort survival rate at the elementary level is def ined as the proport ion of enrollees at the beginning grade who reach the f inal grade at the end of the required number of years of study.
TABLE 6.8 Cohort Survival Rate in Public and Private Elementary Schools, by Region: SY 2005-2006 to SY 2012-2013
R egion
250 Education and Culture
SY 2 0 0 5- SY 2 0 0 6 - SY 2 0 0 7- SY 2 0 0 8 -2 0 0 6 * 2 0 0 7 2 0 0 8 2 0 0 9
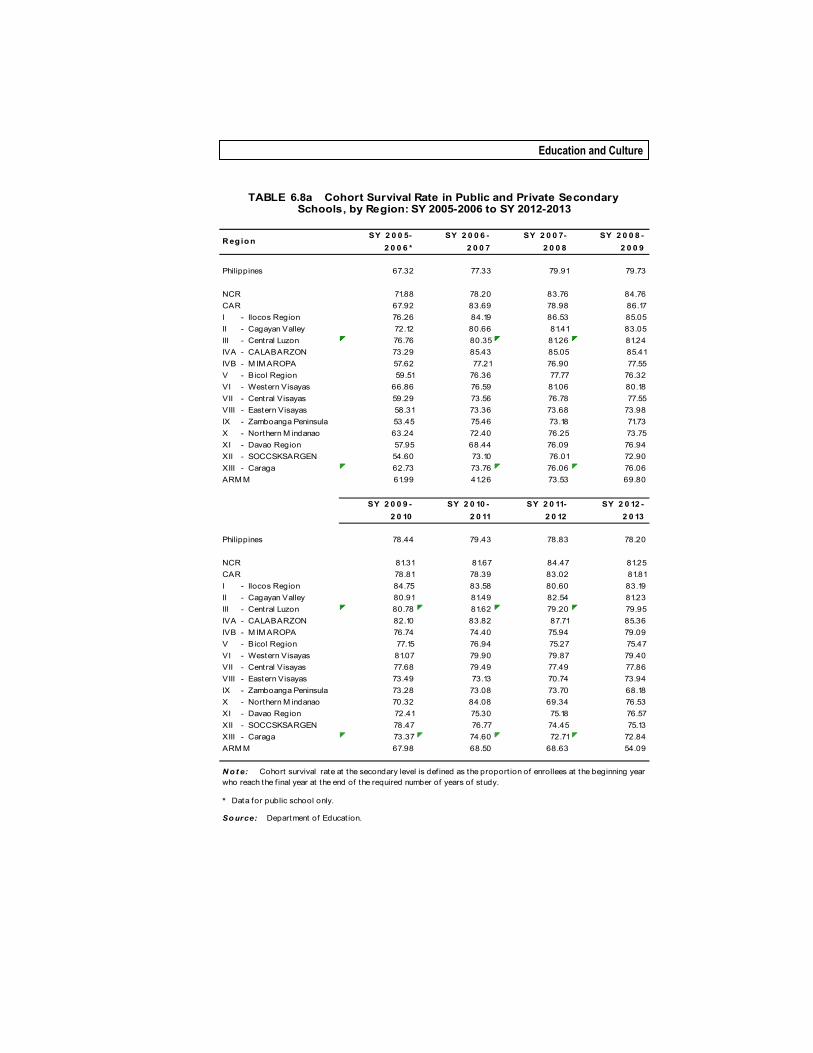
Philippines 67.32 77.33 79.91 79.73
NCR 71.88 78.20 83.76 84.76CAR 67.92 83.69 78.98 86.17I - Ilocos Region 76.26 84.19 86.53 85.05II - Cagayan Valley 72.12 80.66 81.41 83.05III - Central Luzon 76.76 80.35 81.26 81.24IVA - CALABARZON 73.29 85.43 85.05 85.41IVB - M IM AROPA 57.62 77.21 76.90 77.55V - Bicol Region 59.51 76.36 77.77 76.32VI - Western Visayas 66.86 76.59 81.06 80.18VII - Central Visayas 59.29 73.56 76.78 77.55VIII - Eastern Visayas 58.31 73.36 73.68 73.98IX - Zamboanga Peninsula 53.45 75.46 73.18 71.73X - Northern M indanao 63.24 72.40 76.25 73.75XI - Davao Region 57.95 68.44 76.09 76.94XII - SOCCSKSARGEN 54.60 73.10 76.01 72.90XIII - Caraga 62.73 73.76 76.06 76.06ARM M 61.99 41.26 73.53 69.80
SY 2 0 0 9 - SY 2 0 10 - SY 2 0 11- SY 2 0 12 -2 0 10 2 0 11 2 0 12 2 0 13
Philippines 78.44 79.43 78.83 78.20
NCR 81.31 81.67 84.47 81.25CAR 78.81 78.39 83.02 81.81I - Ilocos Region 84.75 83.58 80.60 83.19II - Cagayan Valley 80.91 81.49 82.54 81.23III - Central Luzon 80.78 81.62 79.20 79.95IVA - CALABARZON 82.10 83.82 87.71 85.36IVB - M IM AROPA 76.74 74.40 75.94 79.09V - Bicol Region 77.15 76.94 75.27 75.47VI - Western Visayas 81.07 79.90 79.87 79.40VII - Central Visayas 77.68 79.49 77.49 77.86VIII - Eastern Visayas 73.49 73.13 70.74 73.94IX - Zamboanga Peninsula 73.28 73.08 73.70 68.18X - Northern M indanao 70.32 84.08 69.34 76.53XI - Davao Region 72.41 75.30 75.18 76.57XII - SOCCSKSARGEN 78.47 76.77 74.45 75.13XIII - Caraga 73.37 74.60 72.71 72.84ARM M 67.98 68.50 68.63 54.09
* Data for public school only.
So urce: Department of Educat ion.
R egio n
TABLE 6.8a Cohort Survival Rate in Public and Private Secondary Schools, by Region: SY 2005-2006 to SY 2012-2013
N o t e: Cohort survival rate at the secondary level is def ined as the proport ion of enrollees at the beginning year who reach the f inal year at the end of the required number of years of study.

PSA 2013 Philippine Yearbook
SY 2 0 11- 2 0 12 SY 2 0 12 - 2 0 13Enro lment Teacher Enro lment Teacher
Philippines 13,228,304 363,955 1 : 36 15,033,177 367,017 1 : 41
NCR 1,248,164 31,640 1 : 39 1,371,867 31,787 1 : 43CAR 216,495 7,999 1 : 27 246,875 7,994 1 : 31I - Ilocos Region 626,851 21,790 1 : 29 725,305 21,811 1 : 33II - Cagayan Valley 427,537 14,521 1 : 29 501,138 14,925 1 : 34III - Central Luzon 1,307,031 35,418 1 : 37 1,486,934 35,658 1 : 42IVA - CALABARZON 1,571,394 37,501 1 : 42 1,801,832 38,125 1 : 47IVB - M IM AROPA 472,855 13,215 1 : 36 541,055 13,213 1 : 41V - Bicol Region 988,183 27,299 1 : 36 1,120,452 27,473 1 : 41VI - Western Visayas 1,023,291 33,046 1 : 31 1,182,696 33,208 1 : 36VII - Central Visayas 1,007,955 26,232 1 : 38 1,167,896 26,279 1 : 44VIII - Eastern Visayas 709,835 22,003 1 : 32 804,074 21,978 1 : 37IX - Zamboanga Peninsula 584,087 16,800 1 : 35 661,330 16,902 1 : 39X - Northern M indanao 657,435 18,188 1 : 36 758,256 18,327 1 : 41XI - Davao Region 674,674 17,233 1 : 39 766,839 17,310 1 : 44XII - SOCCSKSARGEN 624,378 16,019 1 : 39 723,918 16,297 1 : 44XIII - Caraga 400,346 11,947 1 : 34 456,582 11,923 1 : 38ARM M 687,793 13,104 1 : 52 716,128 13,807 1 : 52
Source: Department of Educat ion.
SY 2 0 11- 2 0 12 SY 2 0 12 - 2 0 13Enro lment Teacher Enro lment Teacher
Philippines 5,576,268 150,516 1 : 37 5,641,898 160,623 1 : 35
NCR 674,237 19,588 1 : 34 680,656 21,067 1 : 32CAR 86,468 3,044 1 : 28 87,433 3,222 1 : 27I - Ilocos Region 300,037 9,271 1 : 32 304,047 9,692 1 : 31II - Cagayan Valley 194,409 5,945 1 : 33 193,387 6,361 1 : 30III - Central Luzon 591,251 14,832 1 : 40 602,304 15,950 1 : 38IVA - CALABARZON 715,219 17,445 1 : 41 737,463 18,733 1 : 39IVB - M IM AROPA 188,972 5,134 1 : 37 194,223 5,492 1 : 35V - Bicol Region 389,582 10,744 1 : 36 397,002 11,459 1 : 35VI - Western Visayas 470,555 14,218 1 : 33 468,552 14,992 1 : 31VII - Central Visayas 415,315 10,202 1 : 41 427,667 11,047 1 : 39VIII - Eastern Visayas 292,441 7,547 1 : 39 300,212 7,909 1 : 38IX - Zamboanga Peninsula 213,082 5,820 1 : 37 210,414 6,074 1 : 35X - Northern M indanao 230,578 6,123 1 : 38 231,228 6,476 1 : 36XI - Davao Region 247,004 6,756 1 : 37 250,690 7,259 1 : 35XII - SOCCSKSARGEN 234,371 6,320 1 : 37 236,769 6,655 1 : 36XIII - Caraga 158,265 4,323 1 : 37 159,750 4,654 1 : 34ARM M 174,482 3,204 1 : 54 160,101 3,581 1 : 45
Source: Department of Educat ion.
SY 2011-2012 to SY 2012-2013
R eg ion
TSR T SRR eg ion
SY 2011-2012 to SY 2012-2013TABLE 6.9a Teacher-Student Ratio in Government Secondary Schools, by Region:
TPR T PR
TABLE 6.9 Teacher-Pupil Ratio in Government Elementary Schools, by Region:

252 Education and Culture
SY 2 0 10 - 2 0 11 SY 2 0 11- 2 0 12C lassroom C lassroom
Philippines 332,992 1 : 39 335,546 1 : 38
NCR 16,295 1 : 76 16,669 1 : 77CAR 7,359 1 : 30 7,588 1 : 28I - Ilocos Region 21,719 1 : 26 21,953 1 : 87II - Cagayan Valley 15,637 1 : 24 15,768 1 : 25III - Central Luzon 35,174 1 : 35 35,396 1 : 34IVA - CALABARZON 34,388 1 : 46 34,814 1 : 43IVB - M IM AROPA 12,947 1 : 34 13,497 1 : 35V - Bicol Region 26,051 1 : 36 26,464 1 : 36VI - Western Visayas 33,038 1 : 29 33,258 1 : 28VII - Central Visayas 24,307 1 : 34 24,761 1 : 35VIII - Eastern Visayas 21,091 1 : 33 19,195 1 : 33IX - Zamboanga Peninsula 15,680 1 : 36 15,836 1 : 36X - Northern M indanao 16,699 1 : 35 16,882 1 : 35XI - Davao Region 16,090 1 : 40 16,617 1 : 39XII - SOCCSKSARGEN 14,289 1 : 45 14,316 1 : 42XIII - Caraga 10,801 1 : 36 10,991 1 : 35ARM M 11,427 1 : 61 11,541 1 : 60
SY 2 0 10 - 2 0 11 SY 2 0 11- 2 0 12C lassroom C lassroom
Philippines 104,172 1 : 53 107,223 1 : 54
NCR 8,549 1 : 79 9,486 1 : 77CAR 2,257 1 : 40 2,308 1 : 41I - Ilocos Region 6,977 1 : 41 7,229 1 : 42II - Cagayan Valley 5,026 1 : 35 5,074 1 : 36III - Central Luzon 10,754 1 : 51 10,886 1 : 52IVA - CALABARZON 11,190 1 : 64 12,296 1 : 65IVB - M IM AROPA 3,897 1 : 46 3,902 1 : 45V - Bicol Region 7,778 1 : 48 7,996 1 : 47VI - Western Visayas 10,823 1 : 42 10,834 1 : 42VII - Central Visayas 7,571 1 : 47 7,579 1 : 46VIII - Eastern Visayas 5,764 1 : 49 5,769 1 : 49IX - Zamboanga Peninsula 4,512 1 : 47 4,519 1 : 47X - Northern M indanao 4,567 1 : 48 4,598 1 : 48XI - Davao Region 4,587 1 : 52 4,688 1 : 51XII - SOCCSKSARGEN 4,406 1 : 59 4,426 1 : 58XIII - Caraga 3,378 1 : 47 3,389 1 : 46ARM M 2,136 1 : 54 2,244 1 : 55
Source: Department of Educat ion.
C PR C PRR eg ion
C PR C PR
Element ary Schoo ls
Secondary Schoo ls
TABLE 6.10 Classroom-Pupil Ratio in Government Elementary and Secondary Schools by Region: SY 2010-2011 to SY 2011-2012

PSA 2013 Philippine Yearbook
SY 2 0 0 9 - 2 0 10 SY 2 0 10 - 2 0 11Element ary Second ary Element ary Seco ndary
Philippines 358,164 142,994 361,567 146,255
NCR 31,044 18,604 31,314 19,210CAR 7,881 2,928 7,848 2,967I - Ilocos Region 21,490 8,996 21,604 9,032II - Cagayan Valley 14,608 5,739 14,721 5,855III - Central Luzon 34,631 13,981 34,952 14,534IVA - CALABARZON 36,832 16,060 37,187 16,193IVB - M IM AROPA 12,663 4,818 12,889 4,953V - Bicol Region 26,780 10,208 27,056 10,513VI - Western Visayas 32,644 13,639 32,777 13,859VII - Central Visayas 25,828 9,614 25,966 9,856VIII - Eastern Visayas 21,867 7,152 21,897 7,348IX - Zamboanga Peninsula 16,363 5,523 16,603 5,703X - Northern M indanao 17,854 5,943 17,998 5,979XI - Davao Region 17,007 6,523 17,146 6,619XII - SOCCSKSARGEN 15,261 5,893 15,765 6,031XIII - Caraga 11,543 4,172 11,569 4,271ARM M 13,868 3,201 14,275 3,332
SY 2 0 11- 2 0 12 SY 2 0 12 - 2 0 13Element ary Second ary Element ary Seco ndary
Philippines 363,955 150,619 374,404 169,479
NCR 31,640 19,668 32,704 22,253CAR 7,999 3,044 8,160 3,301I - Ilocos Region 21,790 9,279 22,012 10,011II - Cagayan Valley 14,521 5,945 15,155 6,614III - Central Luzon 35,418 14,831 36,140 16,696IVA - CALABARZON 37,501 17,449 39,206 19,429IVB - M IM AROPA 13,215 5,136 13,498 5,746V - Bicol Region 27,299 10,748 27,896 12,166VI - Western Visayas 33,046 14,225 33,524 15,470VII - Central Visayas 26,232 10,202 27,045 12,021VIII - Eastern Visayas 22,003 7,543 22,495 9,098IX - Zamboanga Peninsula 16,800 5,822 17,050 6,489X - Northern M indanao 18,188 6,120 18,661 6,871XI - Davao Region 17,233 6,758 17,658 7,535XII - SOCCSKSARGEN 16,019 6,322 16,649 6,920XIII - Caraga 11,947 4,323 12,184 5,159ARM M 13,104 3,204 14,367 3,700
So urce: Department of Education.
TABLE 6.11 Teachers in Government Schools, by Level of Educationand by Region: SY 2009-2010 to SY 2012-2013
R egio n

254 Education and Culture
Total Household Population 10 Years Old and Over
2000 2003 2008 Both Sexes Male Female
Philippines 56,975 61,964 70,818 95.6 95.1 96.1
NCR 7,625 8,318 9,021 99.2 99.0 99.4CAR 1,020 1,082 1,277 94.8 95.2 94.3I - Ilocos 3,206 3,345 3,941 98.2 98.1 98.2II - Cagayan Valley 2,105 2,290 2,583 95.0 94.5 95.6III - Central Luzon 6,070 6,844 7,752 97.8 97.7 97.8IVA - Calabarzon 8,740 8,132 8,951 98.0 97.7 98.2IVB - Mimaropa - 1,760 2,136 95.1 94.4 95.9V - Bicol 3,364 3,504 4,205 96.6 96.1 97.1VI - Western Visayas 4,694 4,878 5,819 94.5 93.2 95.8VII - Central Visayas 4,261 4,599 5,283 95.1 94.6 95.6VIII - Eastern Visayas 2,597 2,754 3,310 93.6 92.2 95.0IX - Zamboanga Peninsula 2,235 2,260 2,534 94.0 93.3 94.8X - Northern Mindanao 2,026 2,804 3,234 93.9 92.6 95.3XI - Davao Region 3,851 2,950 3,302 93.7 93.1 94.3XII - Soccsksargen 1,889 2,574 2,991 92.1 91.9 92.3XIII - Caraga 1,519 1,635 1,899 94.7 93.2 96.3ARMM 1,758 2,235 2,578 81.5 82.8 80.3
2003 (Percent) 2000 (Percent)Both Sexes Male Female Both Sexes Male Female
Philippines 93.4 92.6 94.3 92.3 92.1 92.5
NCR 99.0 98.9 99.1 98.1 98.2 98.1CAR 91.6 92.0 91.1 90.5 90.9 90.1I - Ilocos 97.4 97.6 97.3 95.2 95.4 95.0II - Cagayan Valley 92.7 92.1 93.5 91.8 91.4 92.1III - Central Luzon 96.9 96.8 96.9 94.8 94.8 94.8IVA - Calabarzon 97.2 96.8 97.5 *94.0 *93.9 *94.1IVB - Mimaropa 91.2 91.4 91.0 - - -V - Bicol 95.0 93.8 96.3 92.7 92.4 93.0VI - Western Visayas 92.8 91.6 94.0 93.0 92.4 93.6VII - Central Visayas 92.4 91.5 93.2 91.7 91.5 91.8VIII - Eastern Visayas 90.1 87.0 93.3 89.9 88.8 91.1IX - Zamboanga Peninsula 88.9 86.8 90.9 85.3 85.3 85.2X - Northern Mindanao 91.8 90.1 93.5 91.4 90.7 92.1XI - Davao Region 90.3 88.0 92.7 90.2 89.8 90.5XII - Soccsksargen 87.3 85.9 88.8 87.0 87.1 87.0XIII - Caraga 92.1 89.5 94.6 92.0 91.4 92.6ARMM 70.2 71.0 69.4 68.7 69.8 67.7
Note: * Data for Southern TagalogDetails may not add up to totals due to rounding.
Sources: National Statistics Office and Department of Education 2000, 2003 and 2008 Functional Literacy, Education, and Mass Media Survey.
Region
TABLE 6.12 Simple Literacy of the Household Population 10 Years Old and Over, by Sex and by Region: 2000, 2003 and 2008
(Population in Thousands)
2008 (Percent)

PSA 2013 Philippine Yearbook
Population High HighRegion 10-64 No Grade Elementary Elementary School School
Years Old Completed Level Graduate Level Graduateor Higher
Philippines 86.4 5.3 67.0 80.8 89.8 100.0
NCR 94.0 11.8 80.4 81.3 89.8 100.0CAR 89.2 0.0 70.1 86.9 93.9 100.0I - Ilocos Region 91.3 16.1 73.6 82.0 90.9 100.0II - Cagayan Valley 86.1 2.5 66.2 82.2 91.2 100.0III - Central Luzon 92.1 0.0 77.8 84.4 92.1 100.0IVA - Calabarzon 93.5 3.6 81.0 87.7 94.8 100.0IVB - Mimaropa 83.9 6.4 65.8 80.5 91.4 100.0V - Bicol Region 79.9 9.1 55.7 71.5 85.7 100.0VI - Western Visayas 82.6 9.6 60.4 77.9 84.6 100.0VII - Central Visayas 86.6 2.3 70.6 84.7 91.0 100.0VIII - Eastern Visayas 72.9 5.3 48.3 68.6 81.0 100.0IX - Zamboanga Peninsula 79.6 5.8 59.3 78.4 89.7 100.0X - Northern Mindanao 85.9 3.8 63.2 84.6 92.9 100.0XI - Davao Region 81.7 1.8 65.1 76.6 86.3 100.0XII - Soccsksargen 78.3 1.2 57.5 74.3 86.9 100.0XIII - Caraga 85.7 1.9 63.0 82.0 93.8 100.0ARMM 71.6 7.4 66.4 86.2 91.7 100.0
SexMale 84.2 5.3 63.9 79.8 88.6 100.0Female 88.7 5.2 71.1 81.9 91.1 100.0
Notes: Details may not add up to totals due to rounding.
Sources: National Statistics Office. 2008 Functional Literacy, Education, and Mass Media Survey.
Highest Educational Attainment
TABLE 6.13 Functional Literacy Rate of Population 10 to 64 Years Oldby Highest Educational Attainment, by Region and Sex: 2008
(Population in Thousands)
256 Education and Culture
2 0 13 2 0 12Licensure Examinat ions f o r Percent Percent
Examinees Passers Passed Examinees Passers Passed
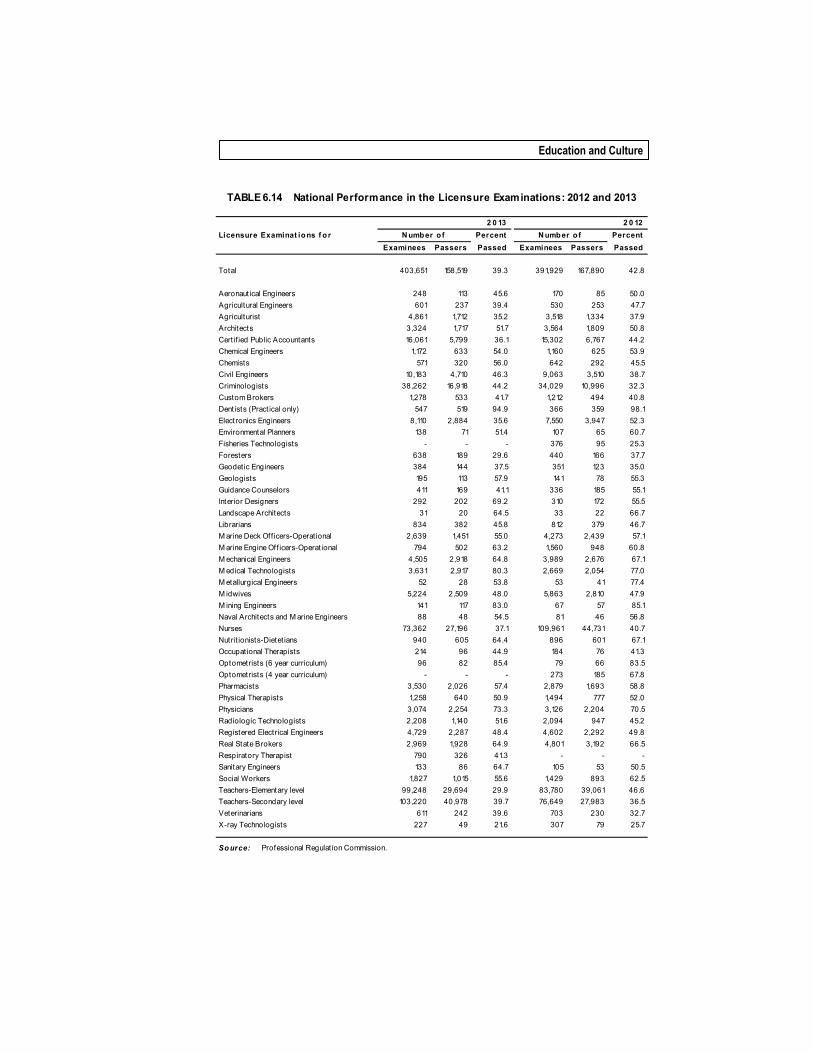
Total 403,651 158,519 39.3 391,929 167,890 42.8
Aeronaut ical Engineers 248 113 45.6 170 85 50.0Agricultural Engineers 601 237 39.4 530 253 47.7Agriculturist 4,861 1,712 35.2 3,518 1,334 37.9Architects 3,324 1,717 51.7 3,564 1,809 50.8Cert if ied Public Accountants 16,061 5,799 36.1 15,302 6,767 44.2Chemical Engineers 1,172 633 54.0 1,160 625 53.9Chemists 571 320 56.0 642 292 45.5Civil Engineers 10,183 4,710 46.3 9,063 3,510 38.7Criminologists 38,262 16,918 44.2 34,029 10,996 32.3Custom Brokers 1,278 533 41.7 1,212 494 40.8Dentists (Pract ical only) 547 519 94.9 366 359 98.1Electronics Engineers 8,110 2,884 35.6 7,550 3,947 52.3Environmental Planners 138 71 51.4 107 65 60.7Fisheries Technologists - - - 376 95 25.3Foresters 638 189 29.6 440 166 37.7Geodetic Engineers 384 144 37.5 351 123 35.0Geologists 195 113 57.9 141 78 55.3Guidance Counselors 411 169 41.1 336 185 55.1Interior Designers 292 202 69.2 310 172 55.5Landscape Architects 31 20 64.5 33 22 66.7Librarians 834 382 45.8 812 379 46.7M arine Deck Off icers-Operat ional 2,639 1,451 55.0 4,273 2,439 57.1M arine Engine Off icers-Operat ional 794 502 63.2 1,560 948 60.8M echanical Engineers 4,505 2,918 64.8 3,989 2,676 67.1M edical Technologists 3,631 2,917 80.3 2,669 2,054 77.0M etallurgical Engineers 52 28 53.8 53 41 77.4M idwives 5,224 2,509 48.0 5,863 2,810 47.9M ining Engineers 141 117 83.0 67 57 85.1Naval Architects and M arine Engineers 88 48 54.5 81 46 56.8Nurses 73,362 27,196 37.1 109,961 44,731 40.7Nutrit ionists-Dietet ians 940 605 64.4 896 601 67.1Occupat ional Therapists 214 96 44.9 184 76 41.3Optometrists (6 year curriculum) 96 82 85.4 79 66 83.5Optometrists (4 year curriculum) - - - 273 185 67.8Pharmacists 3,530 2,026 57.4 2,879 1,693 58.8Physical Therapists 1,258 640 50.9 1,494 777 52.0Physicians 3,074 2,254 73.3 3,126 2,204 70.5Radiologic Technologists 2,208 1,140 51.6 2,094 947 45.2Registered Electrical Engineers 4,729 2,287 48.4 4,602 2,292 49.8Real State Brokers 2,969 1,928 64.9 4,801 3,192 66.5Respiratory Therapist 790 326 41.3 - - -Sanitary Engineers 133 86 64.7 105 53 50.5Social Workers 1,827 1,015 55.6 1,429 893 62.5Teachers-Elementary level 99,248 29,694 29.9 83,780 39,061 46.6Teachers-Secondary level 103,220 40,978 39.7 76,649 27,983 36.5Veterinarians 611 242 39.6 703 230 32.7X-ray Technologists 227 49 21.6 307 79 25.7
So urce: Professional Regulat ion Commission.
TABLE 6.14 National Performance in the Licensure Examinations: 2012 and 2013
N umber o fN umber o f
PSA 2013 Philippine Yearbook
Tot al N umb er Passedof Examinees N umber Percent
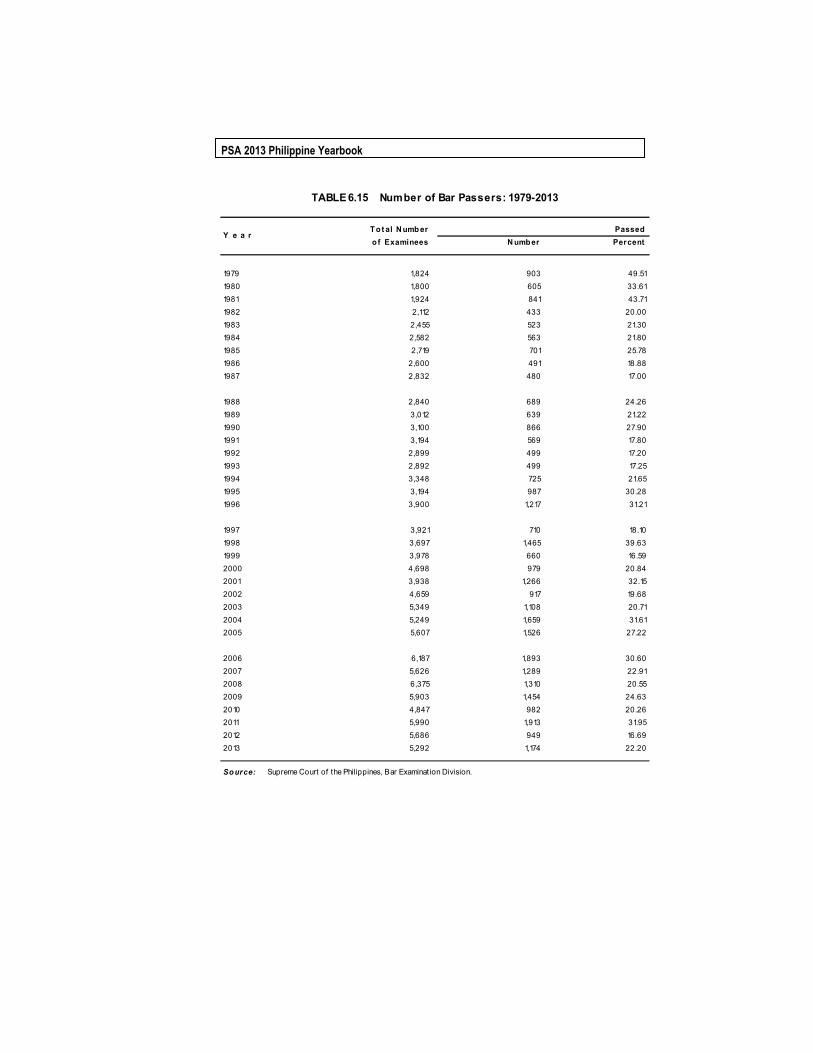
1979 1,824 903 49.511980 1,800 605 33.611981 1,924 841 43.711982 2,112 433 20.001983 2,455 523 21.301984 2,582 563 21.801985 2,719 701 25.781986 2,600 491 18.881987 2,832 480 17.00
1988 2,840 689 24.261989 3,012 639 21.221990 3,100 866 27.901991 3,194 569 17.801992 2,899 499 17.201993 2,892 499 17.251994 3,348 725 21.651995 3,194 987 30.281996 3,900 1,217 31.21
1997 3,921 710 18.101998 3,697 1,465 39.631999 3,978 660 16.592000 4,698 979 20.842001 3,938 1,266 32.152002 4,659 917 19.682003 5,349 1,108 20.712004 5,249 1,659 31.612005 5,607 1,526 27.22
2006 6,187 1,893 30.602007 5,626 1,289 22.912008 6,375 1,310 20.552009 5,903 1,454 24.632010 4,847 982 20.262011 5,990 1,913 31.952012 5,686 949 16.692013 5,292 1,174 22.20
Source: Supreme Court of the Philippines, Bar Examinat ion Division.
Y e a r
TABLE 6.15 Number of Bar Passers: 1979-2013
258 Education and Culture
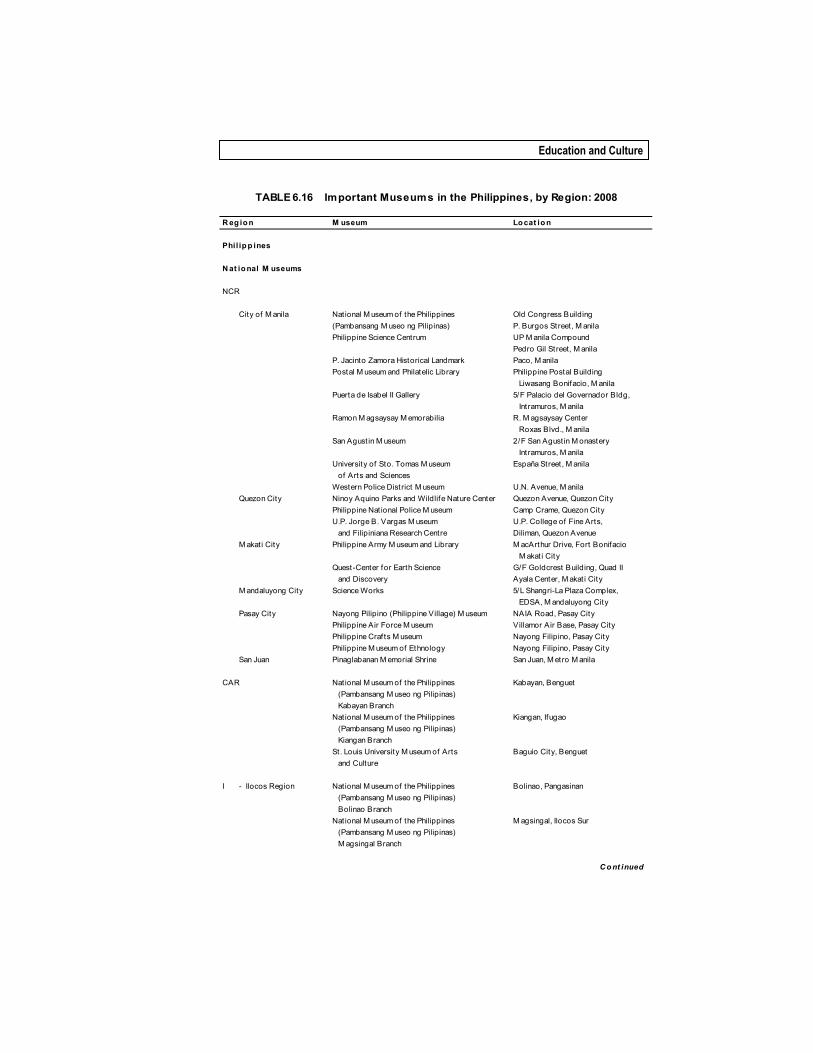
R eg ion M useum Locat ion
Phil ipp ines
N at ional M useums
NCR
City of M anila National M useum of the Philippines Old Congress Building(Pambansang M useo ng Pilipinas) P. Burgos Street , M anilaPhilippine Science Centrum UP M anila Compound
Pedro Gil Street, M anilaP. Jacinto Zamora Historical Landmark Paco, M anilaPostal M useum and Philatelic Library Philippine Postal Building
Liwasang Bonifacio, M anilaPuerta de Isabel II Gallery 5/F Palacio del Governador Bldg,
Intramuros, M anilaRamon M agsaysay M emorabilia R. M agsaysay Center
Roxas Blvd., M anilaSan Agust in M useum 2/F San Agustin M onastery
Intramuros, M anilaUniversity of Sto. Tomas M useum España Street , M anila of Arts and SciencesWestern Police District M useum U.N. Avenue, M anila
Quezon City Ninoy Aquino Parks and Wildlife Nature Center Quezon Avenue, Quezon CityPhilippine Nat ional Police M useum Camp Crame, Quezon CityU.P. Jorge B. Vargas M useum U.P. College of Fine Arts, and Filipiniana Research Centre Diliman, Quezon Avenue
M akati City Philippine Army M useum and Library M acArthur Drive, Fort Bonifacio M akat i City
Quest-Center for Earth Science G/F Goldcrest Building, Quad II and Discovery Ayala Center, M akat i City
M andaluyong City Science Works 5/L Shangri-La Plaza Complex, EDSA, M andaluyong City
Pasay City Nayong Pilipino (Philippine Village) M useum NAIA Road, Pasay CityPhilippine Air Force M useum Villamor Air Base, Pasay CityPhilippine Craf ts M useum Nayong Filipino, Pasay CityPhilippine M useum of Ethnology Nayong Filipino, Pasay City
San Juan Pinaglabanan M emorial Shrine San Juan, M etro M anila
CAR National M useum of the Philippines Kabayan, Benguet (Pambansang M useo ng Pilipinas) Kabayan BranchNational M useum of the Philippines Kiangan, Ifugao (Pambansang M useo ng Pilipinas) Kiangan BranchSt. Louis University M useum of Arts Baguio City, Benguet and Culture
I - Ilocos Region National M useum of the Philippines Bolinao, Pangasinan (Pambansang M useo ng Pilipinas) Bolinao BranchNational M useum of the Philippines M agsingal, Ilocos Sur (Pambansang M useo ng Pilipinas) M agsingal Branch
C ont inued
TABLE 6.16 Important Museums in the Philippines, by Region: 2008

PSA 2013 Philippine Yearbook
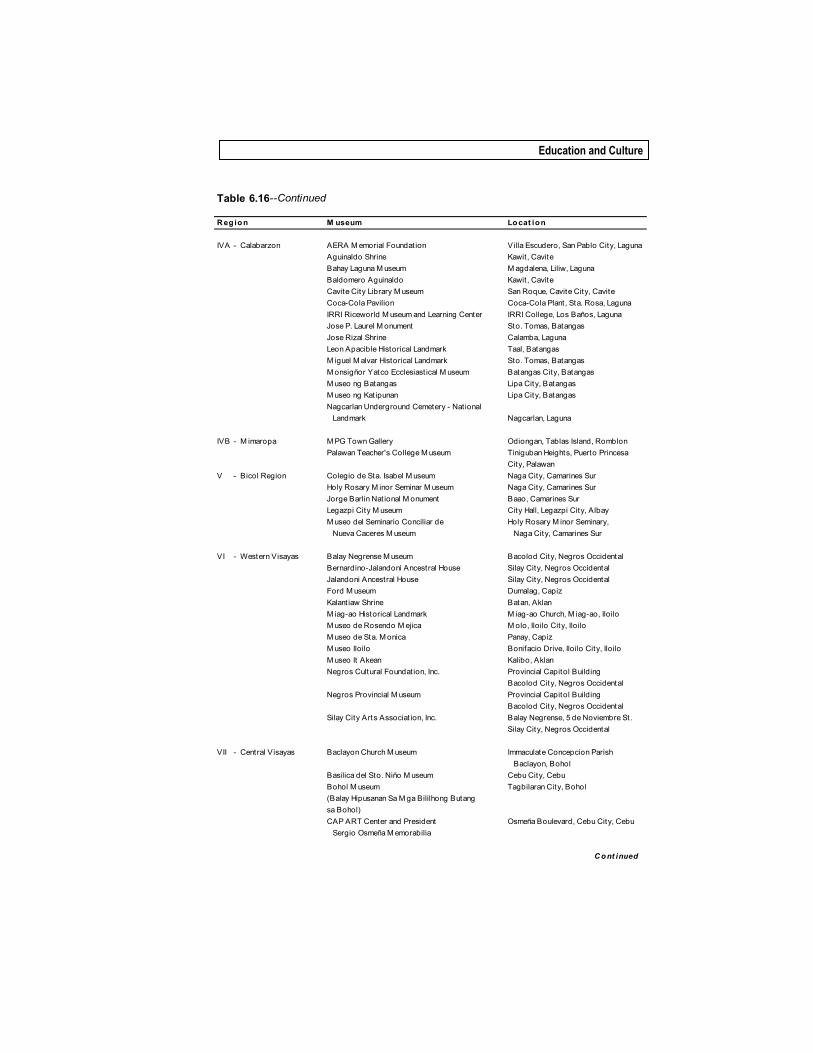
Table 6.16--Continued
R eg io n M useum Lo cat io n
Nat ional M useum of the Philippines Padre Burgos House, Vigan, (Pambansang M useo ng Pilipinas) Ilocos Sur Padre Burgos BranchResurreccion M emorial M useum- 21 El Calle Real, Luna, La Union Ilocos M useum of M usic and Fine ArtsSarrat M useum Sarrat , Ilocos NorteVigan House National Historical Inst itute Vigan, Ilocos Sur Branch (Crisologo House and M emorabilia)
II - Cagayan Valley Nat ional M useum of the Philippines Tuguegarao City, Cagayan (Pambansang M useo ng Pilipinas) Tuguegarao BranchPanaddaman (Cagayan State University College of M edicine and Surgery Bldg. M useum) CSU, Tuguegarao City, Cagayan
IVA - Calabarzon Nat ional M useum of the Philippines Angono Petroglyphs RockShelter, (Pambansang M useo ng Pilipinas) Angono, Rizal Angono BranchPhilippine Navy M useum Fort San Felipe Naval Base,
Cavite City, CavitePila M useum Rizal Street, Pila, LagunaRizal Technological Polytechnic M orong, Rizal Inst itute of M useum and ArchivesUPLB M useum of Natural History Los Baños, LagunaUP Los Baños Sining M akiling Gallery Auditorium Basement, UPLB,
Los Baños, LagunaVicente M anansala Historical Landmark Binangonan, Rizal
IVB - M imaropa Nat ional M useum of the Philippines Puerto Galera, Oriental M indoro (Pambansang M useo ng Pilipinas) Puerto Galera BranchNat ional M useum of the Philippines Quezon, Palawan (Pambansang M useo ng Pilipinas) Quezon BranchPalawan M useum Old City Hall Building, M endoza Park,
Puerto Princesa City, PalawanPalawan State University M useum PSU Complex, Tiniguiban Heights,
Puerto Princesa City, Palawan
V - Bicol Region Nat ional M useum of the Philippines Daraga, Albay (Pambansang M useo ng Pilipinas) Daraga BranchUniversity of Nueva Caceres M useum Jaime Hernandez Avenue, Naga City,
Camarines SurWenceslao Vinzons Historical Daet, Camarines Norte Landmarks
VI - Western Visayas M useo Negrense University of St. La Salle Bacolod City, Negros Occidental
Rosendo M ejica Historical Landmark M olo, Iloilo
C o nt inued

260 Education and Culture
Table 6.16--Continued
R eg ion M useum Locat ion
VII - Central Visayas National M useum of the Philippines Fort San Pedro, Cebu City, Cebu (Pambansang M useo ng Pilipinas) Fort San Pedro, BranchSala Piano M useum 415 Gorordo Avenue, Cebu City, CebuSiliman University Anthropology M useum Dumaguete City, Negros OrientalSouthwestern University M useum Cebu City, CebuSt. Theresa's College M useum R. Aboit iz Street , Cebu City, CebuUniversity of San Carlos Anthropology P. del Rosario Street, Cebu City, Cebu M useumUniversity of San Carlos Biological M useum USC-Talamban, Cebu City
VIII - Eastern Visayas Price M ansion and CAP Art Center Tacloban City, LeyteSto. Niño Shrine and Heritage M useum Real, Tacloban City, LeyteZaldivar M useum Albuena, Leyte
IX - Zamboanga Peninsula National M useum of the Philippines Fort Pilar, Zamboanga City, (Pambansang M useo ng Pilipinas) Zamboanga del Sur Fort Pilar, BranchWestern M indanao State University San Jose Road, Zamboanga City, - Ethnological M useum Zamboanga del Sur
X - Northern M indanao Xavier University M useum (M useo de Oro) Cagayan de Oro City, M isamis Oriental
XII - Soccsksargen National M useum of the Philippines Sharif f Kabunsuan Cultural Center (Pambansang M useo ng Pilipinas) LTP 12 Compound, Cotabato City Cotabato City Branch M aguindanao
XIII - Caraga National M useum of the Philippines Butuan City, Agusan del Norte (Pambansang M useo ng Pilipinas) Butuan BranchUrios College M useum San Francisco Street, Butuan City
ARM M Jolo Nat ional M useum Branch Capitol Site, Jolo, SuluNotre Dame College M useum Capitol Site, Jolo, Sulu
and Oceanography, Jolo, SuluTawi-Tawi Ethnological M useum M indanao State University,
Bongao, Tawi-Tawi
Ot her M useums
NCRCity of M anila Apolinario M abini Shrine Pandacan, M anila
Arcdiocesan M useum of M anila Arzobispo Street, Intramuros, M anilaBayanihan Folk Arts M useum Philippine Women's University
Taft Avenue, M anilaCarlos P. Romulo Collect ion 4/F Nat ional Historical Inst itute Bldg.
T.M . Kalaw St., Ermita, M anilaCasa M anila M useum Intramuros, M anilaDaniel W. Tantaco Jr. Collect ion De La Salle University, Taf t Ave., M anilaEARIST M useum EARIST, Sampaloc, M anilaJose P. Laurel M emorial Roxas Blvd. Cor. Perdo Gil Sts., Foundation M useum M alate, M anila
C ont inued

PSA 2013 Philippine Yearbook
Table 6.16--Continued
R egion M useum Lo cat io n
Jose Rizal Shrine Fort Santiago, Intramuros, M anilaM alacañang Heritage Foundat ion M alacañang Palace, M anilaM anila Zoo and Botanical Garden Adriat ico Street , M alate, M anilaM useo Pambata (M useum for Children) Ermita, M anilaM useum of Philippine History Rizal Park, M anilaNational Historical Inst itute - Historical T.M . Kalaw St., Ermita, M anila
Quezon City Ateneo Art Gallery Ateneo de M anila University, Q.C.Bangko Sentral ng Pilipinas M oney M useum BSP Security Plant Complex
East Avenue, Diliman, Quezon CityChildren's M useum and Library Kalayaan Avenue, Diliman, Quezon CityIglesia ni Cristo M useum and Gallery Iglesia ni Cristo, Diliman, Quezon CityM anuel L. Quezon M emorial Shrine Quezon Circle, Quezon CityM useo Recoletos M ira-mira House, Tandang Sora, Q.C.M useum of Filipino Culture (M useo ng Buhay BSP Complex, East Avenue, QuezonPilipino) City
M akat i City Ayala M useum of Philippine History M akati Avenue, M akati City and Iconographic ArchiveM akati M useum (M useo ng M akati) J.P. Rizal cor. M abini Sts., M akati City
M alabon City M alabon Zoo, Dinosaur M useum, No. 1 Gov. Pascual, Barrio Potrero, Aquarium and Tropical Rainforest M alabon, M etro M anila
M andaluyong City Kaban ng Hiyas ng Lungsod M andaluyong Off ice of the City M ayor, M andaluyongPasay City CCP Contemporary Art M useum Cultural City of the Philippines,
of the Philippines Roxas Boulevard, Pasay CityCCP M useo ng Kalinangang Pilipino CCP, Roxas Boulevard, Pasay CityCCP M useum of Philippine Humanit ies CCP, Roxas Boulevard, Pasay CityM etropolitan M useum of M anila Central Bank Complex, Pasay City
Pasig City Lopez M emorial M useum G/F Benpres Building, Exchange Road cor. M eralco Avenue, Pasig City
CAR Benguet M useum Capitol, La Trinidad, BenguetBontoc M useum Bontoc, M ountain Province
I - Ilocos Region Divine Word College M useum Laoag City, Ilocos NorteM arcos M useum Batac, Ilocos Norte
II - Cagayan Valley Cagayan M useum and Historical Expo Building, Capitol Compound Research Center Tuguegarao City, Cagayan
III - Central Luzon Barasoain Church Historical Landmark M useum M alolos, BulacanBulacan M useum, Library and Cultural Provincial Capitol Compound Center (Hiyas ng Bulacan) M alolos, BulacanCasa Real Shrine Plaza Rizal, M alolos, BulacanCasa San M iguel Barrio San M iguel, San Antonio,
ZambalesM arcelo H. del Pilar Historical Landmark Bulacan, BulacanM useo de Tarlac Capas, TarlacNational Food Authority Grains Authority NFA-Central Luzon Regional Off ice M useum Cabanatuan City, Nueva Ecija
C o nt inued
262 Education and Culture
Table 6.16--Continued
R eg ion M useum Locat ion
IVA - Calabarzon AERA M emorial Foundat ion Villa Escudero, San Pablo City, LagunaAguinaldo Shrine Kawit, CaviteBahay Laguna M useum M agdalena, Liliw, LagunaBaldomero Aguinaldo Kawit, CaviteCavite City Library M useum San Roque, Cavite City, CaviteCoca-Cola Pavilion Coca-Cola Plant, Sta. Rosa, LagunaIRRI Riceworld M useum and Learning Center IRRI College, Los Baños, LagunaJose P. Laurel M onument Sto. Tomas, BatangasJose Rizal Shrine Calamba, LagunaLeon Apacible Historical Landmark Taal, BatangasM iguel M alvar Historical Landmark Sto. Tomas, BatangasM onsigñor Yatco Ecclesiast ical M useum Batangas City, BatangasM useo ng Batangas Lipa City, BatangasM useo ng Kat ipunan Lipa City, BatangasNagcarlan Underground Cemetery - National Landmark Nagcarlan, Laguna
IVB - M imaropa M PG Town Gallery Odiongan, Tablas Island, RomblonPalawan Teacher's College M useum Tiniguban Heights, Puerto Princesa
City, PalawanV - Bicol Region Colegio de Sta. Isabel M useum Naga City, Camarines Sur
Holy Rosary M inor Seminar M useum Naga City, Camarines SurJorge Barlin Nat ional M onument Baao, Camarines SurLegazpi City M useum City Hall, Legazpi City, AlbayM useo del Seminario Conciliar de Holy Rosary M inor Seminary, Nueva Caceres M useum Naga City, Camarines Sur
VI - Western Visayas Balay Negrense M useum Bacolod City, Negros OccidentalBernardino-Jalandoni Ancestral House Silay City, Negros OccidentalJalandoni Ancestral House Silay City, Negros OccidentalFord M useum Dumalag, CapizKalant iaw Shrine Batan, AklanM iag-ao Historical Landmark M iag-ao Church, M iag-ao, IloiloM useo de Rosendo M ejica M olo, Iloilo City, IloiloM useo de Sta. M onica Panay, CapizM useo Iloilo Bonifacio Drive, Iloilo City, IloiloM useo It Akean Kalibo, AklanNegros Cultural Foundation, Inc. Provincial Capitol Building
Bacolod City, Negros OccidentalNegros Provincial M useum Provincial Capitol Building
Bacolod City, Negros OccidentalSilay City Arts Associat ion, Inc. Balay Negrense, 5 de Noviembre St.
Silay City, Negros Occidental
VII - Central Visayas Baclayon Church M useum Immaculate Concepcion Parish Baclayon, Bohol
Basilica del Sto. Niño M useum Cebu City, CebuBohol M useum Tagbilaran City, Bohol(Balay Hipusanan Sa M ga Bililhong Butang sa Bohol)CAP ART Center and President Osmeña Boulevard, Cebu City, Cebu Sergio Osmeña M emorabilia
C ont inued
PSA 2013 Philippine Yearbook
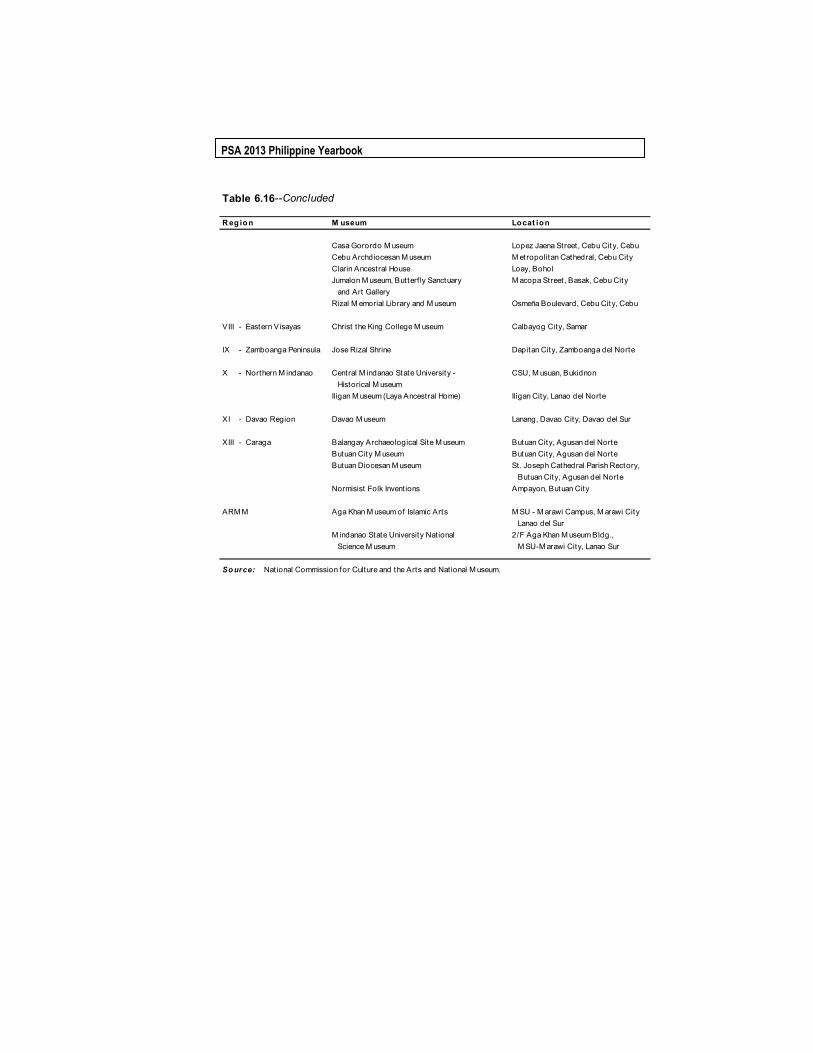
Table 6.16--Concluded
R eg io n M useum Locat ion
Casa Gorordo M useum Lopez Jaena Street, Cebu City, CebuCebu Archdiocesan M useum M etropolitan Cathedral, Cebu CityClarin Ancestral House Loay, BoholJumalon M useum, Butterf ly Sanctuary M acopa Street, Basak, Cebu City and Art GalleryRizal M emorial Library and M useum Osmeña Boulevard, Cebu City, Cebu
VIII - Eastern Visayas Christ the King College M useum Calbayog City, Samar
IX - Zamboanga Peninsula Jose Rizal Shrine Dapitan City, Zamboanga del Norte
X - Northern M indanao Central M indanao State University - CSU, M usuan, Bukidnon Historical M useumIligan M useum (Laya Ancestral Home) Iligan City, Lanao del Norte
XI - Davao Region Davao M useum Lanang, Davao City, Davao del Sur
XIII - Caraga Balangay Archaeological Site M useum Butuan City, Agusan del NorteButuan City M useum Butuan City, Agusan del NorteButuan Diocesan M useum St. Joseph Cathedral Parish Rectory,
Butuan City, Agusan del NorteNormisist Folk Inventions Ampayon, Butuan City
ARM M Aga Khan M useum of Islamic Arts M SU - M arawi Campus, M arawi City Lanao del Sur
M indanao State University Nat ional 2/F Aga Khan M useum Bldg., Science M useum M SU-M arawi City, Lanao Sur
So urce: National Commission for Culture and the Arts and National M useum.

264 Education and Culture
Y ear A ward ee F ield Y ear A ward ee F ield
1972 Fernando Amorsoloa Paint ing 1999 Daisy Avellana Theater1973 Francisca Reyes-Aquino Dance Ernani Cuenco M usic
Carlos V. Francisco Paint ing J. Elizalde Navarro Visual ArtsAmado V. Hernandez Literature Edith Tiempo LiteratureAmado J. M olina M usic Andrea Veneracion M usicJuan F. Nakpil Architecture 2000 Ang Kiukok Visual ArtsGuillermo Tolent ino Sculpture Antonio M olina M usicJose Garcia Villa Literature F. Sionil Jose Literature
1976 Napoleon Abueva Sculpture Ishmael Bernal FilmPablo S. Antonio Architecture 2001 Severino M ontano Theater and FilmLamberto Avellana Drama and Film 2003 Virgilio S. Almario LiteratureVictorio Edades Paint ing Salvador F. Bernal Theater DesignJovita Fuentes M usic Jose T. Joyac Visual ArtsLeonor Orosa-Goquingco Dance Alejandro R. Roces LiteratureNick Joaquin Literature Edgar S. Romero Cinema
1981 Vicente S. M anansalab Paint ing 2006 Ronald Allan K. Poe Film1982 Carlos P. Romulo Literature Ramon Valera Fashion Design
Gerardo de Leon Film Ildefonso P. Santos, Jr. Architecture1987 Honorata " Atang" de la Rama Theater and M usic Benedicto R. Cabrera Visual Arts1988 Antonino Buenaventura M usic Ramon A. Obusan Dance
Lucresia Reyes-Urtula Dance Bienvenido L. Lumbera Literature1989 Lucresia Kasilag M usic Abdulmaria Asia Imao Visual Arts1990 Francisco Arcellana Literature 2009 M anuel Conde Film and Broadcast Art
Cesar Legaspi Paint ing Lazaro Francisco LiteratureLeandro Locsin Architecture Federico Aguilar Alcuaz Visual Arts
1991 Hernando R. Ocampo Visual Arts 2014 Alice Reyes DanceLucio San Pedro M usic Francisco Coching Visual Arts
1997 Lino Brocka Film and Broadcast Arts Cirilo F. Baut ista LiteratureLevi Celerio M usic Francisco Feliciano M usic
1997 Felipe Padilla de Leon M usic Ramon Santos M usicN.V.M . Gonzales Literature Jose M aria Zaragoza ArchitectureWilf rido M a. Guerrero TheaterArturo Luz Visual ArtsJose M . M aceda M usicCarlos Quirino Historical LiteratureRolando S. Tinio Theater and Literature
a Awarded posthumously in the State funeral service for him at the Cultural Center of the Philippines.b Conferred posthumously on August 26, 1981.c Conferred posthumously on June 26, 2003.
So urce: Cultural Center of the Philippines.
TABLE 6.17 National Artists: 1972-2014

PSA 2013 Philippine Yearbook
C ount ry N at ionalit y N umber C o unt ry N at ionalit y N umber
To t al 8,469 Kenya Kenyan 8Korea Korean 1,755
Afghanistan Afghan 2 Kuwait Kuwait i 65Angola Angolan 6 Laos Lao 13Armenia Armenian 4 M alaysia M alaysian 17Australia Australian 36 M arshall Island M arshallese 8Austria Austrian 13 M exico M exican 15Bahrain Bahraini 5 M icronesia M icronesian 9Bangladesh Bangladeshi 30 M ongolia M ongolian 4Belarus Belarusian 1 Nepal Nepalese 106Belgium Belgian 4 Netherlands Dutch 2Brazil Brazilian 6 New Zealand New Zealander 13Brunei Bruneian 5 Nigeria Nigerian 12Burma/M yanmar Burmese/M yanmar 28 Norway Norwegian 9Cambodia Cambodian 29 Papua New Guinea Papua New Guinean 15Cameroon Cameroonian 31 Pakistan Pakistani 51Canada Canadian 4 Palest ine Palest inian 5China, People's Republic of Chinese 72 Panama Panamanian 2Colombia Colombian 2,740 Paraguay Paraguayan 3Congo Congan 5 Portugal Portuguese 2Costa Rica Costa Rican 2 Russia Russian 2Croat ia Croatian 2 Rwanda Rwandan 1Dominican Republic Dominican 2 Samoa/Western Samoa Samoan 2East Timor East Timorese 7 Saudi Arabian Saudi Arabian 9Egypt Egyptian 5 Singapore Singaporean 13Erithrea Erithean 10 Slovakia Slovak 9Estonia Estonia 3 Solomon Islands Solomon Islander 2Ethiopia Ethiopian 12 Somalia Somalian 2France French 5 Spain Spanish 20French Polynesia French Polynesian 12 Sri Lanka Sri Lankan 15Germany German 4 Sudan Sudanese 69Ghana Ghanaian 18 Sweden Swedish 27Great Britain Brit ish 55 Switzerland Swiss 3Greece Greek 9 Syria Syrian 9Guyana Guyanese 2 Taiwan Taiwanese 551Hait i Hait ian 2 Thailand Thai 60India Indian 436 Timor Atoni 2Indonesia Indonesian 8 Turkey Turkish 2Iran Iranian 654 USA American 902Ireland Irish 2 Vanuatu Ni-Vanuatu 40Italy Italian 2 Vietnam Vietnamese 290Japan Japanese 10 Yemen Yemanin 2Jordan Jordanian 64 Zambia Zambian 3
Source: Commission on Higher Educat ion.
TABLE 6.18 Foreign Students in the Philippines, by Nationality: AY 2011-2013


