24 Data flow diagrams 24.1 Purpose A data flow diagram is a logical model of the flow of data through a system that shows how the system’s boundaries, processes, and data entities are logically related. 24.2 Strengths, weaknesses, and limitations A data flow diagram is an excellent tool for summarizing and organizing detailed information about a system’s boundaries, processes, and data e ntities, providing the analyst with a logical map of the system. Documenting the system’s boundaries by drawing a context diagram helps the analyst, the user, and the responsible managers visualize alternative high-level logical system designs. The elements of a data flow diagram lead directly into physical design, with processes suggesting programs and procedures, data flows suggesting composites, and data stores suggesting data entities, files, and databases. Creating a data flow diagram is a process driven task. Consequently, it is relatively easy to overlook key data elements and composites. Balancing a data flow diagram verifies the model’s internalconsistency, but does not necessarily reveal missing elements. Attempting to balance a significant logical model without appropriate software (such as CASE software) is at best difficult and can be misleading. Beginners and users often confuse data flow diagrams with process flowcharts. 24.3 Inputs and related ideas The first step in creating a data flow diagram is to prepare a list of the system’s boundaries, data, and p rocesses using the tools covered in Part II. Data flow diagrams are a significant part of the structured analysis and design methodology ( # 3). A data flow diagram is sometimes created in conjunction with an entity-relationship diagram ( # 26) ordata normalization ( # 28). Processes are documented using one or more of the process description tools in Part VI (#s 55 through 60). The data elements and data composites are documented in the data dictionary ( # 25). The data flow diagram is sometimes included in the requirements specification ( # 35). A completed data flow is required by the automation boundaries technique described in # 36.24.4 Concepts A data flow diagram is a logical model that shows the flow of data through a system. 24.4.1 Data flow diagram symbols
A data flow diagram is a logical model of the flow of data through a system that shows
how the system’s boundaries, processes, and data entities are logically related.
24.2 Strengths, weaknesses, and limitations
A data flow diagram is an excellent tool for summarizing and organizing detailed
information about a system’s boundaries, processes, and data entities, providing theanalyst with a logical map of the system. Documenting the system’s boundaries by
drawing a context diagram helps the analyst, the user, and the responsible managers
visualize alternative high-level logical system designs. The elements of a data flowdiagram lead directly into physical design, with processes suggesting programs and
procedures, data flows suggesting composites, and data stores suggesting data entities,
files, and databases.
Creating a data flow diagram is a process driven task. Consequently, it is relatively easyto overlook key data elements and composites. Balancing a data flow diagram verifies the
model’s internal consistency, but does not necessarily reveal missing elements.
Attempting to balance a significant logical model without appropriate software (such as
CASE software) is at best difficult and can be misleading. Beginners and users often
confuse data flow diagrams with process flowcharts.
Using Gane and Sarson’s notation,4 four primary symbols
are used to create a data flow diagram (Figure 24.1). A
source or destination (sink) is represented by a (shaded)square. Sources and destinations define the system’s
boundaries; each one represents a person, organization,
or other system that supplies data to the system, gets datafrom the system, or both. A process, or transform, (a
round-cornered rectangle) identifies an activity that
changes, moves, or otherwise transforms data. A datastore (an open-ended, horizontal rectangle) represents
data at rest and implies that the data are held (for somelogical reason) between processes. A data flow (anarrow) represents data in motion. Additionally, Gane and
Sarson use thick arrows to show physical or material
flows.
Using Yourdon7 and DeMarco’s2 notation, sources andsinks are represented as rectangles, processes as circles,
and data stores as horizontal rectangles open at both ends
(two parallel horizontal lines). Data flows are shown as
By convention, the processes in a level 1 data flow diagram are numbered 1, 2, 3, and soon. The numbers do not imply sequence; they are for reference only.
The sub-processes in an exploded data flow diagram are assigned numbers starting with
the parent process’s number. For example, level 1 process 4 might be exploded into level
2 processes 4.1, 4.2, 4.3, and so on, while level 2 process 4.3 might be decomposed into
level 3 processes 4.3.1, 4.3.2, 4.3.3, and so on.
Many analysts use the letter D followed by a number to identify the data stores. For example, in an inventory system, INVENTORY might be D1, SALES might be D2, and
so on. Some analysts identify the sources and destinations as well.
24.4.2.5 Duplicate symbols
Symbols can be repeated if doing so makes the diagram easier to read. For example,duplicating a symbol might be clearer than drawing lengthy or crossing data flows.
Duplicate symbols are usually marked in some way; for example, source/destinationsmight be marked with a slash in the lower-left corner and data stores might be markedwith an extra vertical line.
24.4.3 Underlying principles
Two general principles guide the creation of a data flow diagram: the principle of data
conservation and the principle of iteration.
24.4.3.1 The principle of data conservation
There are no miracles and there are no black holes A given process can neither lose nor
diagram helps the analyst, the user, and the responsible managers visualize alternative
high-level logical system designs.
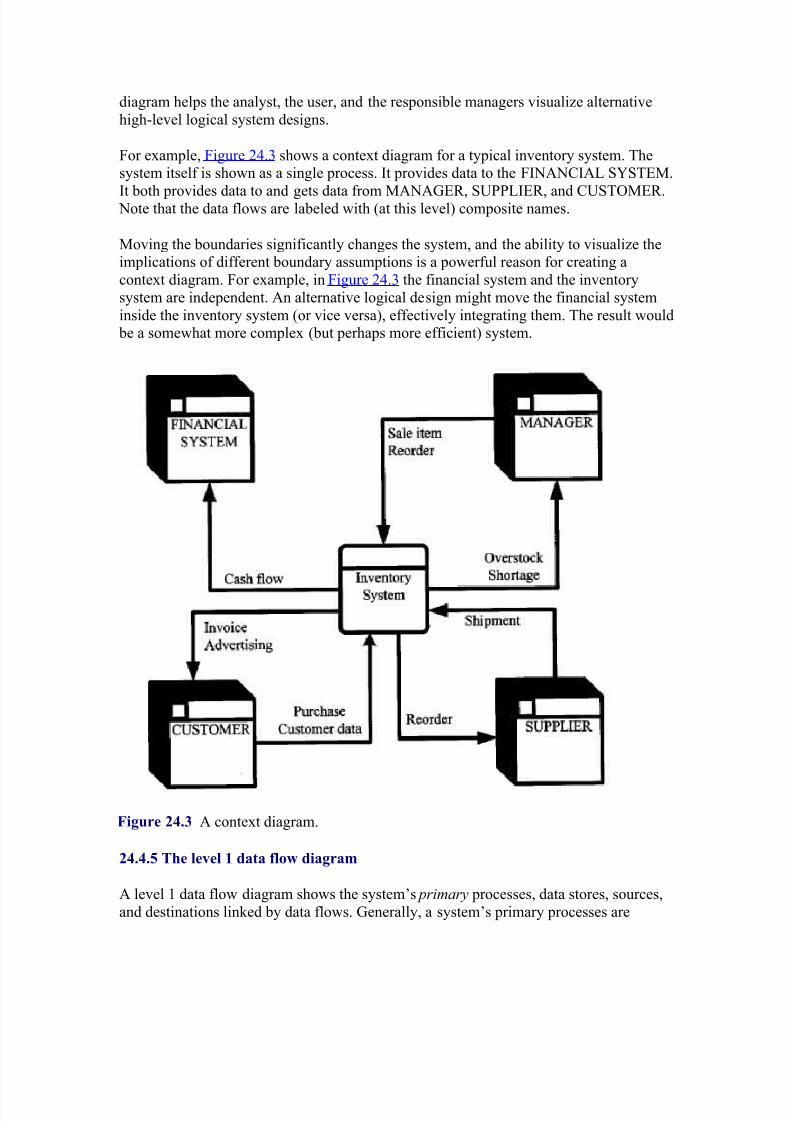
For example, Figure 24.3 shows a context diagram for a typical inventory system. Thesystem itself is shown as a single process. It provides data to the FINANCIAL SYSTEM.
It both provides data to and gets data from MANAGER, SUPPLIER, and CUSTOMER.
Note that the data flows are labeled with (at this level) composite names.
Moving the boundaries significantly changes the system, and the ability to visualize theimplications of different boundary assumptions is a powerful reason for creating a
context diagram. For example, in Figure 24.3 the financial system and the inventorysystem are independent. An alternative logical design might move the financial system
inside the inventory system (or vice versa), effectively integrating them. The result would be a somewhat more complex (but perhaps more efficient) system.
independent, and thus, separated from each other by intermediate data stores that suggest
the data are held in some way between processes.
For example, Figure 24.4 shows a level 1 data flow diagram for an inventory system.Start at the upper left with source/destination FINANCIAL SYSTEM. Data flow to
FINANCIAL SYSTEM from process 9, Report cash flow. Data enter process 9 from data
store D1, SALES. Data enter D1 from process 2, Sell appliance. Process 2 gets its data
from CUSTOMER and from data stores D1, D3, D5, and D6, and so on. Note howintermediate data stores serve to insulate the primary processes from each other and thus
promote process independence.
A level 1 process is a composite item that might incorporate related programs, routines,
manual procedures, hardware-based procedures, and other activities. For example, process 2, Sell appliance might imply (in one alternative) a set of sales associate’s
guidelines, while another alternative might include a point-of-sale terminal equipped with
a bar code scanner and necessary support software. In effect, the level 1 process Sell
appliance represents all the hardware, software, and procedures associated with selling an
appliance. As the data flow diagram is decomposed, the various sub-processes are
eventually isolated and defined.
24.4.6 Documenting the model
The data flow diagram shows the data flows between the system’s sources, destinations,
processes, and data stores.
24.4.6.1 The data dictionary
The data elements are recorded in the data dictionary (# 25). As work progresses, the dataelements that occupy the same data store or share a data flow form composite items or
Each process is defined in a process description that notes its input and output data
elements and composites and briefly describes the tasks or activities it performs. (Processdescription tools are described in Part VI.) Process (or data transform) descriptions are
sometimes recorded in the data dictionary.
24.4.6.3 The CASE repository
In most CASE products (# 5), the data descriptions and process descriptions are stored inthe CASE repository.
24.4.7 Verifying the model
The point of verification is to ensure that the model is complete and internally consistent.
24.4.7.1 Syntax checking
Every data flow must begin and/or end with a process and have at least one arrowhead to
define the direction of data movement. Every process and every data store must have atleast one input data flow and at least one output data flow. If the inflow is missing, the
source of the data is unknown. If the outflow is missing, that process or store acts like a
black hole. In either case, something is wrong.
Other syntax checks involve judgement. Process names should imply their function.
Component names should be unique because redundant names are confusing.
Each process description must match a process on the data flow diagram, and the input
and output lists must match the data flows. Every data element entering or leaving a
process must appear in the data dictionary. Unused processes may have been overlookedwhen the data flow diagram was created. If not, they are unnecessary.
24.4.7.4 Tracing objectives
Note that if a significant feature of the system was overlooked, verification will not
necessarily find the error. Consequently, the logical model should always be checkedagainst the system objectives and the process or processes that contribute to meeting each
one identified. If an objective cannot be matched with at least one process, that objectivemay have been overlooked. If a process cannot be matched with at least one objective,that process might be unnecessary.
24.4.8 Exploding the processes
A level 1 data flow diagram is a high-level logical map of the system. It shows the key
relationships but hides most of the details. Consequently, the next step is to explode the
processes by taking advantage of the principle of iteration. The act of exploding a dataflow diagram is sometimes called functional decomposition.
24.4.8.1 Level 2
Each level 1 process consists of several sub-processes that are listed on the process
description. To explode the data flow diagram, the analyst creates an independent level 2data flow diagram for each level 1 process.
For example, Figure 24.5 shows a level 2 data flow diagram for process 4, Reorder stock
(Figure 24.4). Note the numbering scheme. Processes 4.1, 4.2, 4.3, 4.4, and 4.5 are sub-
Global data are shared by two or more higher level processes. Local data are known only
within one part of the system; intermediate computations are a good example. For example, in Figure 24.5, the data elements in data store D7, REORDER DATA are
known only within the level 2 explosion of process 4 (and its sub-processes).
Mistakes made while working with local data tend to be limited in scope, but global data
errors can ripple throughout the system. Local data elements should be recorded in the
data dictionary and identified as local. If they already exist, they might not be local; perhaps a global data element was overlooked.
24.4.8.3 Balancing the level 2 explosion
An exploded data flow diagram must be balanced by accounting for each input from the
parent level and each output to the parent level. Checking to ensure that an explosion is balanced is similar to tracing data elements from their destination (output) back to their
source (input). The only difference is that the higher-level process’s outputs are traced back to the higher-level process’s inputs through the exploded data flow diagram.
Every global data element (or composite) input to the lower level must be used by at leastone lower-level sub-process. Every global data element (or composite) output to the
higher level must either be input to the lower level or generated by an algorithm within a
lower-level sub-process. Each data element or composite input to or used by an exploded process must be defined in the higher-level process.
Note that a higher-level composite might be decomposed into data elements or sub-
composites at the lower level. Local data (by definition) are neither input to nor output
A logical model consists of a complete set of balanced data flow diagrams, a data
dictionary, and one process description for each process at each level down to the
configuration item level. Note that some processes will be exploded only to level 2,others to level 3, and so on, so the configuration item level does not necessarily
correspond to a single, consistent data flow diagram level.
The documentation package for a large system can be quite lengthy. Processes above the
configuration item level are purely logical; their process descriptions consist of littlemore than lists of sub-processes. Those sub-processes can be obtained from the exploded
data flow diagram, so some organizations exclude them from the finished model process
descriptions above the configuration item level.
The configuration item level processes will decompose into the system’s programs and procedures. The data stores will map into files and databases. The data flows will become
reports, screens, forms, and dialogues. Above the configuration item level, the logical
relationships between the components support planning, coordination, and control.
24.4.12 Logical and physical data flow diagrams
A logical data flow diagram’s symbols are used to describe logical not physical entities.
A process might eventually be implemented as a computer program, a subroutine, or a
manual procedure. A data store might represent a database, a file, a book, a folder in afiling cabinet, or even notes on a sheet of paper. Data flows show how the data move
between the system’s components, but they do not show the flow of control. The idea is
to create a logical model that focuses on what the system does while disregarding the
physical details of how it works.
A physical data flow diagram uses data flow diagram symbols to represent the system’s
physical processes (programs, manual procedures) and physical data stores (files,
Many CASE products support creating, modifying, maintaining, and balancing data flow
diagrams. Charting programs, such as Visio and Micrografx’s Flowcharter can be used to
create data flow diagrams. The data flow diagrams in this # were created using Visio.
24.7 References
1. Davis, W. S., Business Systems Analysis and Design, Wadsworth, Belmont,CA, 1994.
2. DeMarco, T., Structured Analysis and System Specification, Yourdon, New
York, 1978.
3. Gane, C., Rapid System Development , Rapid System Development, New York,1987.4. Gane, C. and Sarson, T., Structured Systems Analysis: Tools and Techniques,Prentice-Hall, Englewood Cliffs, NJ, 1979.
5. Martin, J. and McClure, C., Diagramming Techniques for Analysts and Programmers, Prentice-Hall, Englewood Cliffs, NJ, 1985.6. Thayer, R. H. and Dorfman, M., System and Software Requirements
Engineering , IEEE Computer Society Press, Los Alamitos, CA, 1990.
7. Yourdon, E. and Constantine, L. L., Structured Design, Prentice-Hall,
Englewood Cliffs, NJ, 1979.
What is a Context Diagram and what are the benefits of creating one?
The Context Diagram shows the system under consideration as a single high-level process andthen shows the relationship that the system has with other external entities (systems,organizational groups, external data stores, etc.).
Another name for a Context Diagram is a Context-Level Data-Flow Diagram or a Level-0 DataFlow Diagram. Since a Context Diagram is a specialized version of Data-Flow Diagram,understanding a bit about Data-Flow Diagrams can be helpful.
A Context Diagram (and a DFD for that matter) provides no information about the timing,sequencing, or synchronization of processes such as which processes occur in sequence or inparallel. Therefore it should not be confused with a flowchart or process flow which can showthese things.
Some of the benefits of a Context Diagram are:
• Shows the scope and boundaries of a system at a glance including the other systems
that interface with it• No technical knowledge is assumed or required to understand the diagram
• Easy to draw and amend due to its limited notation
• Easy to expand by adding different levels of DFDs
Data Flow Diagrams - IntroductionData flow diagrams can be used to provide a clear representation of any business function. The techniquestarts with an overall picture of the business and continues by analyzing each of the functional areas of interest. This analysis can be carried out to precisely the level of detail required. The technique exploits amethod called top-down expansion to conduct the analysis in a targeted way.
The result is a series of diagrams that represent the business activities in a way that is clear and easy tocommunicate. A business model comprises one or more data flow diagrams (also known as business processdiagrams). Initially a context diagram is drawn, which is a simple representation of the entire system under
investigation. This is followed by a level 1 diagram; which provides an overview of the major functional areasof the business. Don't worry about the symbols at this stage, these are explained shortly. Using the contextdiagram together with additional information from the area of interest, the level 1 diagram can then be drawn.
The level 1 diagram identifies the major business processes at a high level and any of these processes canthen be analyzed further - giving rise to a corresponding level 2 business process diagram. This process of
more detailed analysis can then continue – through level 3, 4 and so on. However, most investigations willstop at level 2 and it is very unusual to go beyond a level 3 diagram.
Identifying the existing business processes, using a technique like data flow diagrams, is an essential
precursor to business process re-engineering, migration to new technology, or refinement of an existing
business process. However, the level of detail required will depend on the type of change being considered.
Data Flow Diagrams – Diagram NotationThere are only five symbols that are used in the drawing of business process diagrams (data flow diagrams).These are now explained, together with the rules that apply to them.
This diagram represents a banking process, which maintains customer accounts. In this example, customerscan withdraw or deposit cash, request information about their account or update their account details. The fivedifferent symbols used in this example represent the full set of symbols required to draw any business processdiagram.
External Entity
An external entity is a source or destination of a data flow which is outside the area of study. Only those
entities which originate or receive data are represented on a business process diagram. The symbol used is an
oval containing a meaningful and unique identifier.
A process shows a transformation or manipulation of data flows within the system. The symbol used is arectangular box which contains 3 descriptive elements:
Firstly an identification number appears in the upper left hand corner. This is allocated arbitrarily at the toplevel and serves as a unique reference.Secondly, a location appears to the right of the identifier and describes where in the system the process takesplace. This may, for example, be a department or a piece of hardware. Finally, a descriptive title is placed inthe centre of the box. This should be a simple imperative sentence with a specific verb, for example 'maintain
customer records' or 'find driver'.
Data Flow
A data flow shows the flow of information from its source to its destination. A data flow is represented by a
line, with arrowheads showing the direction of flow. Information always flows to or from a process and may bewritten, verbal or electronic. Each data flow may be referenced by the processes or data stores at its head andtail, or by a description of its contents.
Data Store
A data store is a holding place for information within the system:
It is represented by an open ended narrow rectangle.Data stores may be long-term files such as sales ledgers, or may be short-term accumulations: for examplebatches of documents that are waiting to be processed. Each data store should be given a reference followed
A resource flow shows the flow of any physical material from its source to its destination. For this reason theyare sometimes referred to as physical flows.The physical material in question should be given a meaningful name. Resource flows are usually restricted toearly, high-level diagrams and are used when a description of the physical flow of materials is considered to be
important to help the analysis.
Data Flow Diagrams – The Rules
External EntitiesIt is normal for all the information represented within a system to have been obtained from, and/or to be
passed onto, an external source or recipient. These external entities may be duplicated on a diagram, to avoidcrossing data flow lines. Where they are duplicated a stripe is drawn across the left hand corner, like this.
The addition of a lowercase letter to each entity on the diagram is a good way to uniquely identify them.
ProcessesWhen naming processes, avoid glossing over them, without really understanding their role. Indications thatthis has been done are the use of vague terms in the descriptive title area - like 'process' or 'update'.
The most important thing to remember is that the description must be meaningful to whoever will be using the
diagram.
Data FlowsDouble headed arrows can be used (to show two-way flows) on all but bottom level diagrams. Furthermore, incommon with most of the other symbols used, a data flow at a particular level of a diagram may bedecomposed to multiple data flows at lower levels.
Each store should be given a reference letter, followed by an arbitrary number. These reference letters areallocated as follows:
'D' - indicates a permanent computer file'M' - indicates a manual file
'T' - indicates a transient store, one that is deleted afterprocessing.
In order to avoid complex flows, the same data store may be drawn several times on a diagram. Multiple
instances of the same data store are indicated by a double vertical bar on their left hand edge.
Data Flow Diagrams – Relationship Grid
There are rules governing various aspects of the diagram components and how they can relate to one another.
Data FlowsFor data flows the rules are as follows:Data flows and resource flows are allowed between external entities and processes. Data flows are also
allowed between different external entities. However, data flows and resource flows are not allowed betweenexternal entities and data stores.
ProcessesFor processes the data flow rules are as follows:Data flows and resource flows are allowed between processes and external entities and between processes and
data stores. They are also allowed between different processes. In other words processes can communicatewith all other areas of the business process diagram.
Data StoresFor data stores the data flow rules are as follows:Data flows and resource flows are allowed between data stores and processes. However, these flows are notallowed between data stores and external entities or between one data store and another. In practice thismeans that data stores cannot initiate a communication of information, they require a process to do this.
Data Flow Diagrams – Context Diagrams
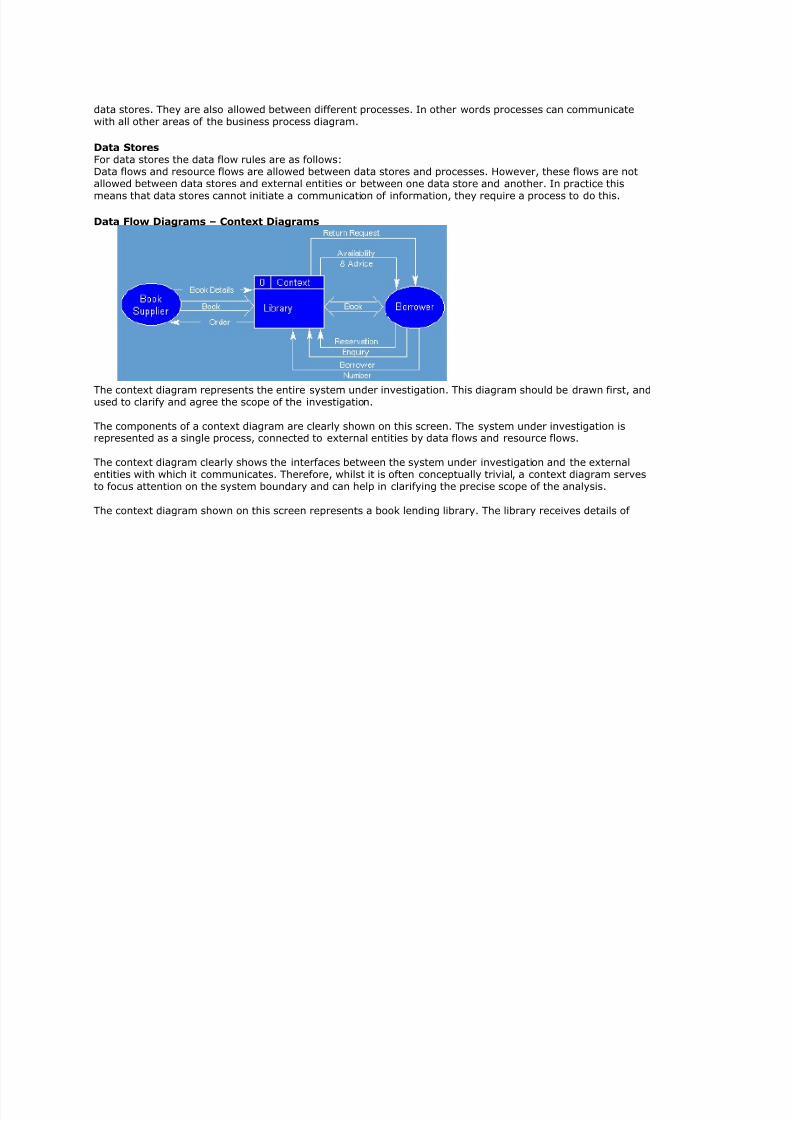
The context diagram represents the entire system under investigation. This diagram should be drawn first, andused to clarify and agree the scope of the investigation.
The components of a context diagram are clearly shown on this screen. The system under investigation isrepresented as a single process, connected to external entities by data flows and resource flows.
The context diagram clearly shows the interfaces between the system under investigation and the externalentities with which it communicates. Therefore, whilst it is often conceptually trivial, a context diagram servesto focus attention on the system boundary and can help in clarifying the precise scope of the analysis.
The context diagram shown on this screen represents a book lending library. The library receives details of
books, and orders books from one or more book suppliers.
Books may be reserved and borrowed by members of the public, who are required to give a borrower number.The library will notify borrowers when a reserved book becomes available or when a borrowed book becomesoverdue.
In addition to supplying books, a book supplier will furnish details of specific books in response to libraryenquiries.
Note, that communications involving external entities are only included where they involve the 'system'
process. Whilst a book supplier would communicate with various agencies, for example, publishers and othersuppliers - these data flow are remote from the 'system' process and so this is not included on the context
diagram.
Data Flow Diagrams – Context Diagram Guidelines
Firstly, draw and name a single process box that represents the entire system.
Next, identify and add the external entities that communicate directly with the process box. Do this byconsidering origin and destination of the resource flows and data flows.
Finally, add the resource flows and data flows to the diagram.
In drawing the context diagram you should only be concerned with the most important information flows.These will be concerned with issues such as: how orders are received and checked, with providing goodcustomer service and with the paying of invoices. Remember that no business process diagram is the definitivesolution - there is no absolute right or wrong.
The level 1 diagram shows the main functional areas of the system under investigation. As with the context
diagram, any system under investigation should be represented by only one level 1 diagram.
There is no formula that can be applied in deciding what is, and what is not, a level 1 process. Level 1processes should describe only the main functional areas of the system, and you should avoid the temptation
of including lower level processes on this diagram. As a general rule no business process diagram shouldcontain more than 12 process boxes.
The level 1 diagram is surrounded by the outline of a process box that represents the boundaries of thesystem. Because the level 1 diagram depicts the whole of the system under investigation, it can be difficult toknow where to start.
There are three different methods, which provide a practical way to start the analysis. These are explained in
the following section and any one of them, or a combination, may prove to be the most helpful in any giveninvestigation.
There are three different methods, which provide a practical way to start the analysis. These are introducedbelow and any one of them, or a combination, may prove to be the most helpful in any given investigation:
Data Flow Diagrams – Resource Flow AnalysisResource flow analysis may be a useful method for starting the analysis if the current system consists largelyof the flow of goods, as this approach concentrates on following the flow of physical objects.
Resource flow analysis may be a useful method for developing diagrams if the current system consists largelyof the flow of goods. Physical resources are traced from when they arrive within the boundaries of the system,
through the points at which some action occurs, to their exit from the system. The rationale behind thismethod is that information will normally flow around the same paths as the physical objects.
Data Flow Diagrams – Organizational Structure AnalysisThe organizational structure approach starts from an analysis of the main roles that exist within the
organization, rather than the goods or information that is flowing around the system.
Identification of the key processes results from looking at the organizational structure and deciding whichfunctional areas are relevant to the current investigation. By looking at these areas in more detail, and
analyzing what staff actually do, discrete processes can be identified.
Starting with these processes, the information flows between them and between these processes and externalentities are then identified and added to the diagram.
Data Flow Diagrams – Document Flow AnalysisThe document flow analysis approach is appropriate if the part of the business under investigation consistsprincipally of flows of information in the form of documents or computer input and output.
Document flow analysis is particularly useful where information flows are of special interest. The first step is tolist the major documents and their sources and recipients. This is followed by the identification of other majorinformation flows such as telephone and computer transactions. Once the document flow diagram has been
The section explains the process of top down expansion, or leveling. Furthermore, it illustrates that whilst
there can only be one context and one level 1 diagram for a given system, these normally give rise tonumerous lower level diagrams.
Each process within a given business process diagram may be the subject of further analysis. This involves
identifying the lower level processes that together constitute the process as it was originally identified. Thisprocedure is known as top-down expansion or leveling.
As a business process diagram is decomposed, each process box becomes a boundary for the next, lowerlevel, diagram.
Data Flow Diagrams – Top Down Expansion Illustrated
In order to illustrate the process of top-down expansion, consider the three processes shown within thisbusiness process diagram. No detail is shown, only the outline of the process boxes, which have beenidentified during the drawing of a level 1 diagram.
Any area of a level 1 diagram is likely to require further analysis, as the level 1 diagram itself only provides afunctional overview of the business system.
Therefore, below the level 1 diagram there will be a series of lower level diagrams. These are referred to aslevel 2, level 3, etcetera. In practice, level 2 is usually sufficient and it is unusual to carry out an analysisbeyond level 3.
In this example the process numbered 3, at level 1, will be investigated further thereby giving rise to a level 2diagram.
In the level 2 diagram four processes of interest have been identified and the numbering of these processesmust reflect the parent process. Therefore the level 2 processes are numbered 3.1, 3.2, 3.3 and 3.4
Suppose that of these four level 2 processes, one was of sufficient interest and complexity to justify furtheranalysis. This process, let's say 3.3, could then be further analyzed resulting in a corresponding level 3
diagram. Once again the numbering of these processes must reflect the parent process. Therefore these threelevel 3 processes are numbered 3.3.1, 3.3.2 and 3.3.3.
Data Flow Diagrams – Numbering Rules
The process boxes on the level 1 diagram should be numbered arbitrarily, so that no priority is implied. Even
where data from one process flows directly into another process, this does not necessarily mean that the firstone has to finish before the second one can begin.
Therefore the processes on a level 1 diagram could be re-numbered without affecting the meaning of thediagram. This is true within any business process diagram - as these diagrams do not imply time, sequence orrepetition.
However, as the analysis continues beyond level 1 it is important that a strict numbering convention isfollowed. The processes on level 2 diagrams must indicate their parent process within the level 1 diagram. Thisconvention should continue through level 3 diagrams, and beyond, should that level of analysis ever berequired.
The diagram on this screen clearly illustrates how processes on lower level diagrams identify their ancestralpath.
Data Flow Diagrams - When to StopIt is important to know when to stop the process of top-down expansion. Usually this will be at level 2 or level3.
There are 3 useful guidelines to help you to decide when to stop the analysis:
Firstly, if a process has a single input data flow or a single output data flow then it should be apparent thatthere is little point in analyzing it any further.
Secondly, when a process can be accurately described by a single active verb with a singular object, this alsoindicates that the analysis has been carried out to a sufficiently low level. For example, the process named
validate enquiry contains a single discrete task.
Finally, ask yourself if anything useful will be gained by further analysis of a process. Would any more detail
influence your decisions?
If the answer is no, then there is little point in taking the analysis further.
Data Flow Diagrams – Keeping the Diagrams ClearIn this section a variety of simple techniques are introduced to show how a business process diagram can beclarified. The examples used do not relate to any specific scenario but are hypothetical abstracts used for thepurpose of illustration.
Combining ProcessesFirstly, where a diagram is considered to contain too many processes, those that are related can often becombined. As a general rule no business process diagram should contain more than 12 process boxes.
In some examples multiple process boxes can be identified as being related and can be combined into a singleprocess box with a collective description.
Exclude Minor Data FlowsWhere information is being retrieved from a data store, it is not necessary to show the selection criteria, orkey, that is being used to retrieve it.
In the banking example, the customer details are shown being retrieved from the data store but the key usedto retrieve this information is not shown.
Where a data store is being updated, only the data flow representing the update needs to be shown. The fact
that the information must first be retrieved does not need to be shown.
Only the most important reports, enquiries, etcetera should be shown on the diagram. Communications thatare of less significance can, if necessary, be detailed in support documentation.
Combining External EntitiesAnother way to reduce the complexity of a business process diagram is to combine any related externalentities.
For example, a business system will often be dealing with different units from within the same externalorganization, and these can be combined into a single external entity. Where these units are uniquely
identified a number should follow the entity identification letter. However, when they are combined thenumbers placed after the identifying alphabetic character are not shown.
Combining Data Stores
In a similar way, data stores that are holding related information should be suffixed with a lower case letter.
Related data stores can also be combined, and where this is the case the numbers placed after the identifyingalphabetic character are not shown