2442 IEEE TRANSACTIONS ON POWER DELIVERY, VOL. 32, NO. 6,DECEMBER 2017 Fast Frequency Response From Offshore Multiterminal VSC–HVDC Schemes Oluwole Daniel Adeuyi, Member, IEEE, Marc Cheah-Mane , Student Member, IEEE, Jun Liang, Senior Member, IEEE, and Nick Jenkins, Fellow, IEEE Abstract—This paper analyzes the frequency support character- istics of multiterminal voltage source converter HVdc (VSC–HVdc) (MTDC) schemes using the energy transferred from wind turbine rotating mass and other ac systems. An alternative coordinated control (ACC) scheme that gives priority to a frequency versus ac- tive power droop fitted to onshore VSCs is proposed to: transfer wind turbine recovery power to undisturbed ac grids, and allow correct control operation of MTDC systems during multiple power imbalances on different ac grids. The fast frequency response capa- bility of MTDC systems equipped with the proposed ACC scheme is compared against a coordinated control scheme, which uses a frequency versus dc voltage droop. The frequency control schemes are demonstrated on an experimental test rig, which represents a three-terminal HVdc system. Also, the MTDC frequency support capability when wind farms do not provide extra power is tested using a four-terminal HVdc system. Index Terms—Frequency control, hardware-in-the-loop simula- tion, inertial response, multi-terminal VSC-HVDC (MTDC) trans- mission, offshore wind farm. I. INTRODUCTION V ARIABLE speed wind turbines and other low carbon gen- erators and loads, that are connected through power con- verters, do not inherently contribute to the inertia of power systems, unless they are fitted with supplementary controls [1], [2], [3]. Multi-terminal high voltage direct current (MTDC) sys- tems, based on voltage source converter (VSC) technology, are intended to transfer the power generated from offshore wind farms to onshore grids and interconnect the grids of different countries for electricity trading. The active power transferred from MTDC systems will replace conventional synchronous generation capacity on onshore AC grids, reduce system inertia and increase the risk of operation and frequency control on the AC grids [1]. During a frequency disturbance, a power system with low in- ertia will have a higher Rate of Change of Frequency (RoCoF) Manuscript received July 5, 2016; revised September 29, 2016; accepted November 17, 2016. Date of publication December 5, 2016; date of current version October 16, 2017. This work was supported in part by the RCUK HubNet under Grant EP/I013636/1, in part by the Top and Tail Programme (EP/I031707/1), in part by the EU FP7 Programme, in part by the MEDOW Project (317221), and in part by the EPSRC under Grant EP/L024155/1. Paper no. TPWRD-00849-2016. The authors are with the School of Engineering, Cardiff University, Cardiff CF24 3AA, U.K. (e-mail: [email protected]; [email protected]; [email protected]; [email protected]). Color versions of one or more of the figures in this paper are available online at http://ieeexplore.ieee.org. Digital Object Identifier 10.1109/TPWRD.2016.2632860 and require additional energy to contain the frequency within operational limits, than a power system with high inertia [1]. This increase in the rate of change of frequency may result in unintended tripping of distributed generators with loss of mains relays. Also, the actions required to contain the frequency would need to take place more rapidly to avoid loss of synchronism [4]. Variable speed wind turbines and HVDC links fitted with aux- iliary controls are capable of providing fast frequency response to AC grids with low inertia [1]. The authors in [5]–[7] reported two methods for provision of fast frequency response from wind turbines. These are: (i) kinetic energy from wind turbine rotating mass; and (ii) addi- tional active power from wind turbines operating in de-loaded condition. The kinetic energy is delivered to AC grids more rapidly than the de-loading operation. For the case of kinetic energy extraction, the generator rotor speed decreases and the kinetic energy stored in the wind turbine rotating mass is used to provide additional power to the AC grids. Once the wind turbine inertia support has ended, the generator rotor speed will have to recover back to its original value within a period of time, known as the recovery period [8], [9]. Wind turbines operating at below rated wind speed will experience a temporary under-production of power during their recovery period. The recovery power will result in a further loss of power and produce a further frequency drop on disturbed AC grids, after an initial power imbalance [10], [5]. Two methods for provision of fast frequency response from point-to-point (P2P) HVDC links were proposed in [1], [6], [11], [12]: (i) additional active power from other AC systems and (ii) electrostatic energy from DC link capacitors. The au- thors in [13] proposed a communication-free coordinated con- trol (CC) scheme that allows frequency response from P2P HVDC-connected offshore wind farms. The CC scheme uses a supplementary frequency versus DC voltage droop at the onshore VSCs and a DC voltage versus offshore frequency droop at the offshore converters for fast frequency response from the offshore wind farms. An inertia emulation control scheme was presented in [14], to utilize the electrostatic en- ergy stored in the HVDC links, but this required large DC link capacitors [6]. A frequency control strategy, which utilizes the energy from wind turbines and DC capacitors of the P2P HVDC links for frequency support was developed in [15] and analysed in [6]. The CC scheme was applied to MTDC-connected offshore wind farms in [16], but the DC voltage versus frequency droop This work is licensed under a Creative Commons Attribution 3.0 License. For more information, see http://creativecommons.org/licenses/by/3.0/
Transcript
2442 IEEE TRANSACTIONS ON POWER DELIVERY, VOL. 32, NO. 6, DECEMBER 2017
Fast Frequency Response From OffshoreMultiterminal VSC–HVDC Schemes
Oluwole Daniel Adeuyi, Member, IEEE, Marc Cheah-Mane , Student Member, IEEE,Jun Liang, Senior Member, IEEE, and Nick Jenkins, Fellow, IEEE
Abstract—This paper analyzes the frequency support character-istics of multiterminal voltage source converter HVdc (VSC–HVdc)(MTDC) schemes using the energy transferred from wind turbinerotating mass and other ac systems. An alternative coordinatedcontrol (ACC) scheme that gives priority to a frequency versus ac-tive power droop fitted to onshore VSCs is proposed to: transferwind turbine recovery power to undisturbed ac grids, and allowcorrect control operation of MTDC systems during multiple powerimbalances on different ac grids. The fast frequency response capa-bility of MTDC systems equipped with the proposed ACC schemeis compared against a coordinated control scheme, which uses afrequency versus dc voltage droop. The frequency control schemesare demonstrated on an experimental test rig, which represents athree-terminal HVdc system. Also, the MTDC frequency supportcapability when wind farms do not provide extra power is testedusing a four-terminal HVdc system.
VARIABLE speed wind turbines and other low carbon gen-erators and loads, that are connected through power con-
verters, do not inherently contribute to the inertia of powersystems, unless they are fitted with supplementary controls [1],[2], [3]. Multi-terminal high voltage direct current (MTDC) sys-tems, based on voltage source converter (VSC) technology, areintended to transfer the power generated from offshore windfarms to onshore grids and interconnect the grids of differentcountries for electricity trading. The active power transferredfrom MTDC systems will replace conventional synchronousgeneration capacity on onshore AC grids, reduce system inertiaand increase the risk of operation and frequency control on theAC grids [1].
During a frequency disturbance, a power system with low in-ertia will have a higher Rate of Change of Frequency (RoCoF)
Manuscript received July 5, 2016; revised September 29, 2016; acceptedNovember 17, 2016. Date of publication December 5, 2016; date of currentversion October 16, 2017. This work was supported in part by the RCUKHubNet under Grant EP/I013636/1, in part by the Top and Tail Programme(EP/I031707/1), in part by the EU FP7 Programme, in part by the MEDOWProject (317221), and in part by the EPSRC under Grant EP/L024155/1. Paperno. TPWRD-00849-2016.
Color versions of one or more of the figures in this paper are available onlineat http://ieeexplore.ieee.org.
Digital Object Identifier 10.1109/TPWRD.2016.2632860
and require additional energy to contain the frequency withinoperational limits, than a power system with high inertia [1].This increase in the rate of change of frequency may result inunintended tripping of distributed generators with loss of mainsrelays. Also, the actions required to contain the frequency wouldneed to take place more rapidly to avoid loss of synchronism [4].Variable speed wind turbines and HVDC links fitted with aux-iliary controls are capable of providing fast frequency responseto AC grids with low inertia [1].
The authors in [5]–[7] reported two methods for provisionof fast frequency response from wind turbines. These are: (i)kinetic energy from wind turbine rotating mass; and (ii) addi-tional active power from wind turbines operating in de-loadedcondition. The kinetic energy is delivered to AC grids morerapidly than the de-loading operation. For the case of kineticenergy extraction, the generator rotor speed decreases and thekinetic energy stored in the wind turbine rotating mass is used toprovide additional power to the AC grids. Once the wind turbineinertia support has ended, the generator rotor speed will have torecover back to its original value within a period of time, knownas the recovery period [8], [9]. Wind turbines operating at belowrated wind speed will experience a temporary under-productionof power during their recovery period. The recovery power willresult in a further loss of power and produce a further frequencydrop on disturbed AC grids, after an initial power imbalance[10], [5].
Two methods for provision of fast frequency response frompoint-to-point (P2P) HVDC links were proposed in [1], [6],[11], [12]: (i) additional active power from other AC systemsand (ii) electrostatic energy from DC link capacitors. The au-thors in [13] proposed a communication-free coordinated con-trol (CC) scheme that allows frequency response from P2PHVDC-connected offshore wind farms. The CC scheme usesa supplementary frequency versus DC voltage droop at theonshore VSCs and a DC voltage versus offshore frequencydroop at the offshore converters for fast frequency responsefrom the offshore wind farms. An inertia emulation controlscheme was presented in [14], to utilize the electrostatic en-ergy stored in the HVDC links, but this required large DC linkcapacitors [6]. A frequency control strategy, which utilizes theenergy from wind turbines and DC capacitors of the P2P HVDClinks for frequency support was developed in [15] and analysedin [6].
The CC scheme was applied to MTDC-connected offshorewind farms in [16], but the DC voltage versus frequency droop
This work is licensed under a Creative Commons Attribution 3.0 License. For more information, see http://creativecommons.org/licenses/by/3.0/
ADEUYI et al.: FAST FREQUENCY RESPONSE FROM OFFSHORE MULTITERMINAL VSC–HVDC SCHEMES 2443
on offshore VSCs resulted in maloperation of wind farm fre-quency response during multiple power imbalances on differentAC grids [5]. A weighted frequency scheme was proposed torestore correct operation of wind turbine frequency responseduring multiple power imbalances on different AC grids, butthis required fast telecommunications between VSCs [5]. Theauthors in [17], [18] proposed a communication-free dual con-troller, which combines a frequency versus power droop with theDC voltage droop fitted on onshore VSCs of MTDC systems. In-teractions between the direct voltage droop and frequency droopof the dual controller was investigated in [19]. A droop correc-tion factor was proposed in [20] to avoid the droop interactions,by manipulating the frequency droop gain of the dual controller.However, the droop correction factor depends on the DC voltagedroop information of all the onshore converters [20], whichrequires fast telecommunications between VSCs. Also, the tem-porary under-production of power due to the wind turbine recov-ery period resulted in a further frequency drop on the disturbedAC grid connected to VSCs equipped with the dual frequencycontroller [21].
In this paper, a communication-free alternative coordinatedcontrol (ACC) scheme is developed to: (i) prevent furtherfrequency drop on disturbed AC grids during wind turbinerecovery period and (ii) allow correct operation of windturbine frequency response during multiple power imbalances.The proposed ACC scheme gives priority to the frequencyversus power droop of dual controllers and deactivates thedirect voltage droop during fast frequency response fromMTDC systems, in order to eliminate interactions betweenthe two droops. A 3-terminal HVDC system modelled usingPSCAD and implemented on a hardware-in-the-loop exper-imental test rig is used to demonstrate the effectiveness ofthe proposed ACC scheme and the results are compared withthe CC scheme. The MTDC frequency support capabilitywhen wind farms do not provide extra power is demon-strated using a 4-terminal system modelled using MATLABSimulink.
II. FREQUENCY SUPPORT CONTROL FOR MTDC SYSTEMS
During normal operation, onshore grid-side converters(GSCs) of MTDC systems typically use a vector control strat-egy, in which the d-axis regulates the direct voltage (P vs. Vdcdroop) or the active power (Vdc vs. P droop) and the q-axiscontrols reactive power, Q. Fig. 1 shows the structure of theouter loop and inner loop controllers of the GSCs in normaloperation. The outer loops use PI controllers to compute thereference values of current, i∗d and i∗q , which are fed to the innerloop as illustrated in Fig. 1.
In an MTDC scheme with multiple onshore AC systems andoffshore wind farms, a power imbalance on the onshore ACsystem will cause a frequency variation. Local measurements ateach terminal [16] or telecommunication schemes [5] are usedto transmit the information of the frequency variation to theVSCs of the MTDC scheme. These converters are controlledto provide frequency response from the energy sources of theMTDC scheme.
Fig. 1. Control diagram for grid-side converters in normal operation.
Fig. 2. Control diagram for grid-side converters with the CC scheme.
A. Coordinated Control Scheme
The CC scheme is designed by fitting a supplementary fre-quency versus DC voltage (f vs. Vdc) droop to onshore grid-sideconverter (GSC) controllers and a DC voltage versus frequency(Vdc vs. f ) droop to offshore wind farm converter (WFC) con-trollers [16].
1) GSCs with CC Scheme: the control operation of the on-shore converters is:
V ∗dc = Vdc0 − kpv(Pdc0 − Pdc) + kf
Δfo n︷ ︸︸ ︷
(fon0 − fon) (1)
where kpv is the gain of an active power versus DC voltage (Pvs. Vdc) droop and kf is the gain of the f vs. Vdc droop controlsystem. Fig. 2 shows the control system fitted to the GSCs ofthe CC scheme.
During normal operation, the frequency deviation, Δfon in(1) is 0 and the P vs. Vdc droop regulates DC voltage andtransfers active power variations to onshore converters of theMTDC system. During a power imbalance on the AC grids, thesystem frequency, fon , starts to deviate from its nominal value,fon0 , and the frequency deviation, |Δfon |, starts to increase. Thedisturbed AC grid model includes an aggregated inertia, Hsys ,self-load regulation effect, D, and primary frequency responseof synchronous generators [22].
2444 IEEE TRANSACTIONS ON POWER DELIVERY, VOL. 32, NO. 6, DECEMBER 2017
Fig. 3. Control diagram for WFC with frequency support schemes.
When |Δfon | is above a specific margin, |Δfdb |, onshoreconverters connected to the disturbed AC grid will detect thefrequency variations and switch from the original P vs. Vdcdroop to the f vs. Vdc . The f vs. Vdc controller uses the fre-quency variations on disturbed AC grids to regulate the referencevalue of the DC voltage, Vdc , on the MTDC grid (where kpv = 0in (1)). The new control operation in the onshore converters ofMTDC systems with the CC scheme is:
{
V ∗dc,i = Vdc0,i − kpv ,i(Pdc0,i − Pdc,i) ∀i ∈ Nn
V ∗dc,j = Vdc0,j + kf,j (fon0,j − fon,j ) ∀j ∈ Nd
(2)
where, Nn is the number of onshore converters in normal oper-ation and Nd is the number of onshore converters connected tothe disturbed AC grids.
2) WFCs with CC Scheme: Fig. 3 shows the WFC controlwith frequency support scheme. During normal operation, theWFC creates an AC voltage with a fixed amplitude, Vrms,g ,frequency, foff and phase angle, θoff , in order to absorb the totalpower generated by the wind farms.
Offshore converters use the Vdc vs. f droop to transform localDC voltage deviations, ΔVdc , to a reference frequency signal,f ∗
off , using:
f ∗off = foff ,0 + kvf
ΔVd c︷ ︸︸ ︷
(Vdc0 − Vdc), (3)
where kvf is the gain of the Vdc vs. f droop control system.The measured frequency, foff , on the offshore AC network isused to activate wind turbine inertia control systems.
3) Limitations of the CC Scheme: at below rated windspeeds, wind turbines will require additional recovery powerafter their synthetic inertial response. The temporary under-production of wind farm power due to wind turbine recoverypower will result in a further drop of power on disturbed ACgrids connected by P2P HVDC and MTDC systems equippedwith the CC scheme. This will produce a further drop of fre-quency on the disturbed AC grid, after an initial frequency dis-turbance. Also, if frequency disturbances occur on different ACgrids connected by an MTDC system, multiple onshore con-verters will use their f vs. Vdc droop controllers, as describedin (2), to produce non-linear DC voltage variations. WFCs withthe Vdc vs. f droop transform the DC voltage variations into anoffshore frequency signal, which is used to activate synthetic in-ertial controllers of variable speed wind turbines. The non-linear
Fig. 4. Control diagram for grid-side converters with the ACC scheme.
DC voltage variations will result in maloperation of the windturbine inertial controls, hence a telecommunications-based fre-quency control strategy was developed in [5], to restore the windturbine frequency response operation on MTDC grids equippedwith the CC scheme.
B. Alternative Coordinated Control Scheme
A communication-free ACC scheme is proposed to improvethe effectiveness of fast frequency support from MTDC sys-tems. The proposed ACC scheme prevents further frequencydrop on disturbed AC grids during wind turbine recovery powerand allows operation of wind turbine frequency control duringmultiple power imbalances on different AC grids. The ACCscheme is designed by fitting a supplementary frequency versusactive power (f vs. P ) droop control system to the GSCs andthe Vdc vs. f droop (described in (3)) to the WFCs.
1) GSCs with ACC Scheme: the control operation of theGSCs is obtained by re-writing (1) as:
P ∗dc = Pdc0 − kvp(Vdc0 − Vdc) + k
′f (fon0 − fon), (4)
where, kvp = 1/kpv and k′f = kf /kpv . Fig. 4 shows the control
system fitted to the GSCs of the ACC scheme. When |Δfon | isabove |Δfdb |, the GSCs will switch from their original droopto the f vs. P droop (where kvp = 0 in (4), in order to regulatethe reference value of active power, Pdc , flowing through theGSCs.
The new control operation of the converters in the MTDCconsidering ACC is expressed as:
{
P ∗dc,i = Pdc0,i − kvp,i(Vdc0,i − Vdc,i) ∀i ∈ Nn
P ∗dc,j = Pdc0,j + k
′f ,j (fon0,j − fon,j ) ∀j ∈ Nd
(5)
Assuming there are no power losses in the DC grid and that nooutages occur in the converter stations and given that the windturbine synthetic inertial control is inactive, the DC voltagedeviation in the MTDC grid is:
ΔV iddc,w =
∑Nd
i=1 k′f ,iΔfon,i
∑Nn
i=1 kvp,i
. (6)
There is a linear relationship between the frequency varia-tions, Δfon,i and the ideal DC voltage deviation, ΔV id
dc,w asin (6). This linear relationship is also true for non-ideal MTDCgrids (see analysis in Appendix B and simulation results inFig. 16a) .
2) Advantanges of the ACC Scheme: at below rated windspeeds the ACC scheme transfers wind turbine recovery power
ADEUYI et al.: FAST FREQUENCY RESPONSE FROM OFFSHORE MULTITERMINAL VSC–HVDC SCHEMES 2445
Fig. 5. 3-terminal VSC-HVDC system.
TABLE IOPERATIONAL MODES IN A 3-TERMINAL VSC-HVDC SYSTEM
GSC1, GSC2 WFC3
CC Normal operation d-axis: P vs. Vd cq-axis: QPLL (fo n )
Va c controlOscillator (fo f f )
Disturbed operation d-axis: fo n vs. Vd cq-axis: QPLL (fo n )
Vd c vs. fo f fVa c control
Oscillator (fo f f )ACC Normal operation d-axis: Vd c vs. P
q-axis: QPLL (fo n )
Va c controlOscillator (fo f f )
Disturbed operation d-axis: fo n vs. Pq-axis: QPLL (fo n )
Vd c vs. fo f fVa c control
Oscillator (fo f f )
to undisturbed AC systems, due to the operation of the f vs. Pdroop in GSCs connected to disturbed AC grids. For MTDC sys-tems with multiple frequency variations on different AC grids,the ACC scheme will enable correct operation of MTDC sys-tems, due to the linear relationship between the frequency andthe DC voltage variation in (6).
C. Example of a 3-Terminal VSC-HVDC System
A 3-terminal VSC-HVDC system is utilised to test the effec-tiveness of the proposed ACC scheme and the CC scheme. TheHVDC system was to transfer power from an offshore windfarm to two onshore AC grids. Fig. 5 shows the 3-terminalVSC-HVDC system.
The HVDC system consists of a wind farm converter (WFC3)and two grid-side converters (GSC1 and GSC2). WFC3 inter-faces the offshore wind farm to the HVDC system. GSC2 con-nects the HVDC system to a Main AC Grid and GSC1 connectsthe HVDC system to another AC system. Table I is a summaryof the control modes of the GSC1, GSC2 and WFC3 duringnormal and disturbed operation.
Fig. 6 shows the control scheme of the offshore wind farmconnected to the 3-terminal HVDC system. The network-sideconverter (NSC) regulates the DC link voltage and reactivepower and the machine-side converter (MSC) regulates torqueand reactive power [23]. The offshore frequency deviationsignal, Δfg , is used to trigger a wind turbine sythetic inertial
Fig. 6. Control scheme of wind turbine with fully-rated converters.
Fig. 7. Implementation of supplementary controllers during disturbed opera-tion (a) Coordinated Control and (b) Alternative Coordinated Control.
controller that adds a torque step to the optimal value of gen-erator torque, Topt , to produce a reference torque, Tm,ref [24].
During normal operation, the GSCs use a DC voltage droop toshare power flows to the onshore AC grids and the WFC createsan AC voltage on the offshore grid. During a disturbance onthe Main AC grid, the power mismatch results in a frequencydeviation, Δfon2 . The GSC2 will detect a frequency deviationabove a specific margin, fdb , of ±20 mHz and switch fromthe original DC voltage droop to a frequency droop control.For small frequency disturbances, a hysteresis block is requiredto avoid repeated switching between different control modes.Large frequency disturbances (where Δfon2 is up to 0.5 Hz)are used to demonstrate fast frequency response from MTDCgrids in this study, hence this will prevent multiple switchingbetween control modes. Fig. 7 shows the CC and ACC schemeimplementation during the disturbed operation.
1) Coordinated Control (CC): Fig. 7a shows the supplemen-tary controls of the CC scheme. During a frequency disturbanceon the Main AC grid, the GSC2 detects a frequency deviation,Δfon2 , above ±20 mHz and switches to an f vs. Vdc droop.The f vs. Vdc droop control is designed using:
V ∗dc2 = V ∗
dc2,0 + kfv ,2Δfon2 = V ∗dc2,0 + ΔV ∗
dc2 , (7)
where kfv ,2 is the gain of the f vs. Vdc droop. The output ofthe f vs. Vdc droop controller is a DC voltage signal, ΔV ∗
dc2 ,which is used to compute the reference DC voltage, V ∗
dc2 , of theGSC2 as in (7). A sample and hold block was used to measurethe initial reference of DC voltage, V ∗
dc2,0 , at the instant of
2446 IEEE TRANSACTIONS ON POWER DELIVERY, VOL. 32, NO. 6, DECEMBER 2017
switching to the f vs. Vdc droop. At the WFC3, the DC voltagedeviation, ΔVdc3 , is measured and processed by a Vdc vs. fdroop controller, which is designed using:
f ∗wf = f ∗
wf ,0 + kvf ,3ΔVdc3 = f ∗wf ,0 + Δf ∗
wf , (8)
where kvf is the gain of the Vdc vs. f droop. The output of theVdc vs. f droop controller is a frequency signal, Δf ∗
wf , whichis used to regulate the set-point of frequency on the offshoreAC network. At the GSC1, the DC voltage deviation, ΔVdc1 , isprocessed by a DC voltage droop, in order to transfer additionalpower from the other AC system to the disturbed AC grid.
2) Alternative Coordinated Control (ACC): Fig. 7b showsthe supplementary controls of the proposed ACC scheme. Dur-ing a grid disturbance on the Main AC grid, the GSC2 detectssystem frequency variations above ±20 mHz and switches to anf vs. P droop controller, designed using:
P ∗dc2 = P ∗
dc2,0 + kfp,2Δfon2 = P ∗dc2,0 + ΔP ∗
dc2 , (9)
where kfp,2 is the gain of the f vs. P droop. A sample and holdblock was used to measure the initial set-point of active power,P ∗
dc2,0 , at the instant of switching to the f vs. P droop. Theoutput of the f vs. P droop is an active power signal, ΔP ∗
dc2 ,which is used to compute the reference active power, P ∗
dc2 ,on the GSC2 as in (9). The additional active power, ΔP ∗
dc2 ,transferred to the main AC grid through the GSC2 would resultin a DC voltage deviation on the 3-Terminal HVDC system.At the WFC3, the measured DC voltage deviation, ΔVdc3 , wasused to regulate the reference offshore frequency, f ∗
off , as in (8).At the GSC1, the DC voltage deviation, ΔVdc1 , was used by theDC voltage droop controller to transfer additional power to themain AC grid from the other AC system.
III. SIMULATION MODEL AND EXPERIMENTAL TEST RIG
The 3-terminal VSC-HVDC scheme shown in Fig. 5 wasmodelled using the PSCAD simulation tool. An experimentaltest rig was used to demonstrate the effectiveness of the CC andthe proposed ACC scheme, during the wind turbine recoveryperiod. The converters of the PSCAD simulation model and theexperimental test rig are represented as two-level VSCs. Thetechnical parameters of the simulation model and experimentaltest rig are found in Table V.
A. Simulation Model
The VSCs are modelled using a full switching model. Thewind turbines of the offshore wind farm use Permanent Mag-net Synchronous Generators (PMSG), fully controlled throughback-to-back VSCs. The main objective of these converters is togenerate optimum power from the wind turbines at below ratedwind speed. The wind turbine inertia control system uses a stepresponse of electromagnetic torque to extract kinetic energyfrom their rotating mass [24]. The Main AC Grid was mod-elled using a simplified GB power system model as described in[22]. The Other AC System was modelled using a three-phaseAC voltage source, in order to represent a strong AC grid (e.g.Norway) with sufficient frequency support capability.
Fig. 8. Experimental test rig. (a) Schematic diagram. (b) Set-up.
B. Experimental Test Rig Components
Fig 8a shows the schematic diagram of test rig and Fig 8bshows the experimental set-up. The main components of theexperimental test rig are the MTDC test rig, wind turbine testrig, real time simulator and AC grid simulator.
1) MTDC Test Rig: is formed by a VSC cabinet, autotrans-former and DC network cabinet. The VSC cabinet houses threeVSCs, a dSPACE controller, AC inductors and DC inductors.The VSCs operate at a rated voltage of 140 V (L-L rms) AC and250 V DC and at a power of 2 kW. The autotransformer controlsthe 415 V (L-L rms) mains supply voltage of GSC1 to 140 VAC. The dSPACE controller was used to control and monitorthe system states of the test rig. The DC network cabinet housesDC inductors and capacitors used to model HVDC cables.
2) Wind Turbine Rig: consists of a motor-generator set, avariable speed motor drive, two VSCs and a dSPACE controller.
ADEUYI et al.: FAST FREQUENCY RESPONSE FROM OFFSHORE MULTITERMINAL VSC–HVDC SCHEMES 2447
Fig. 9. Hardware-in-the-loop test. (a) Schematic diagram with operating volt-ages. (b) AC voltage signal transmission from the RTDS to GS to VSC test rig.(c) Current signal transmission from the VSC test rig to the RTDS.
The motor-generator set is coupled through a shaft. The vari-able speed motor drive uses a Unidrive inverter to control therotational speed of the motor, in order to represent the aerody-namic and mechanical response of a real wind turbine. The twoVSCs were connected to the output of the generator, using aback-to-back configuration. A dSPACE controller was used tocontrol the VSCs and the Unidrive inverter, in order to monitorand acquire data from the test rig.
3) Real Time Simulator: a real time digital simulator(RTDS) was used to model a simplified GB power system, usingthe RSCAD tool of the RTDS. The GB grid was modelled as a380 kV single-bus system with a controlled three-phase voltagesource, a controlled current source and a load resistance, Rload ,which represents a 1800 MW generation loss.
4) AC Grid Simulator: is used to interface the GB grid mod-elled using the RTDS to the MTDC test rig. The grid simulator(GS) is connected to the GSC2 of the MTDC test rig as shownin Fig 8a. The GS was used to achieve a conversion ratio of380 kV/140 V, which means that an AC voltage of 140 V inthe VSC test rig represents 380 kV of the high voltage systemof the RTDS. Frequency disturbances on the GB grid modelledon the RTDS are measured at GSC2 by a phase locked loop(PLL), whose input is the 140 V AC voltage created by the GS.The RTDS-connected GS is used to demonstrate the impact ofPLL measurement delays on the operation of MTDC frequencyresponse control schemes.
C. Hardware-in-the-loop Tests
A hardware-in-the-loop (HIL) test was designed using theMTDC test rig, wind turbine test rig, RTDS and GS. Fig. 9ashows the schematic diagram and operating voltages of the HILscheme. Fig. 9b shows the AC voltage signal transmitted fromthe RTDS to the MTDC test rig through the GS. The 380 kV ACon the GB grid modelled using the RSCAD tool of the RTDSis scaled to 5 V using the Analogue Output (AO) cards of theRTDS. The output of the AO cards is connected to the inputs of
TABLE IIBASE PARAMETERS OF PSCAD MODEL AND EXPERIMENTAL TEST RIG
Parameter PSCAD Model Test Rig
DC Voltage, Vd c , b 640 kV 250 VAC Voltage, Va c , b 380 kV 140 VActive Power, Pb 1000 MW 700 WDC impedance, Zd c , b = (V 2
d c , b /Pb ) 409.6 Ω 89.2 ΩAC impedance, Za c , b = (V 2
a c , b /Pb ) 144.4 Ω 28 Ω
the GS. Fig. 9c shows the AC current transmitted from the VSCtest rig to the RTDS through the Analogue Input (AI) cards ofthe RTDS. The output of the AI card was processed by a lead-lagcompensator to eliminate a phase shift of 4.96 degrees betweenthe actual VSC test rig currents, iabc , the current injected to thehigh voltage system in the RTDS, iabc,response . The iabc,responsewas the input signal to the controllable current source of theRTDS. Technical specifications of the RTDS and GS are shownin Appendix A.
IV. SIMULATION AND EXPERIMENTAL RESULTS
Two frequency support control schemes (CC and ACC) weremodelled using the PSCAD simulation tool and implementedusing the experimental test rig. Detailed models of 2-level VSCare used in the PSCAD model in order to achieve a closerrepresentation of the experimental results. For a 1800 MW lossof generation on the main AC grid at 1 s, three cases werestudied:
1) NC: no frequency support from the MTDC system2) CC: frequency support using the CC scheme3) ACC: frequency support using the proposed ACC scheme.A per-unit system was utilised to scale-down the experimental
test rig, in order to represent the equivalent dynamic and steady-state performance as the PSCAD model. The dynamic responseof the DC test rig and PSCAD model depends on the DC cableand VSC parameters. The DC cable and VSC parameters ofthe experimental test rig were scaled-down to have equal per-unit values as the PSCAD model. Table II is a summary of thebase values for scaling the test rig and PSCAD parameters andsimulation results.
The steady-state performance of the MTDC system dependson the direct voltage droop parameters. During normal opera-tion, the droop parameters were designed to achieve an equiv-alent steady-state response of DC voltage and active power (inpu) on the MTDC test rig and offline simulation models. GSC1and GSC2 droop control parameters were chosen to transfer0.45 pu active power to another AC system and 0.15 pu activepower to the main AC grid. The droop gain kpv of the P vs. Vdcdroop is related to the droop gain kvp of the Vdc vs. P droop us-ing kpv = 1/kvp . During disturbed operation, the CC and ACCdroop gains, (i.e. kfv and kf p ) on GSC2 were chosen to trans-fer 0.38 pu active power to the main AC grid after frequencysupport. The droop gain of the f vs. P droop is expressed askf p = kfv/kpv . The droop parameters of the PSCAD model andexperimental test rig are shown in Table IV.
2448 IEEE TRANSACTIONS ON POWER DELIVERY, VOL. 32, NO. 6, DECEMBER 2017
Fig. 10. Simulation (left column) and experimental (right column) results ofthe main ac grid frequency during the case of NC, CC and ACC.
Fig. 11. Simulation (left column) and experimental (right column) resultsduring the case of NC, CC and ACC. (a) ActiveaAApower through the windfarm converter WFC3 (pu). (b) Active power through the grid side converter(GSC1) (pu). (c) Active power through the grid side converter (GSC2) (pu).
Fig. 12. Simulation (left column) and experimental (right column) results ofDC voltage at the WFC3 (pu) during the case of NC, CC and ACC.
Fig. 13. Simulation (left column) and experimental (right column) of offshoreAC grid frequency deviation during the case of NC, CC and ACC.
The wind turbine synthetic inertia controller was designedto transfer equal amount of extra power to the WFC3 duringthe case of CC and ACC. Figs. 10–13 show the simulation andexperimental result of the main AC grid frequency, active power,DC voltage and offshore frequency during the case of NC, CCand ACC. There is good agreement between the simulation and
TABLE IIIROCOF OF MAIN AC GRID AND FREQUENCY DEVIATION
Case RoCoF (Hz/s) Δfo n 2 (Hz)
NC 0.21 0.51CC 0.17 0.35ACC 0.19 0.39
experimental results. The MTDC test rig operating power (i.e.700 W) is about 14 times less than the rated power of 10 kW.This results in no-load power losses of about 0.2 pu on the testrig, and produces an offset on the steady-state power flow onthe GSC1 in Fig. 11b.
A. Rate of Change of Frequency and Frequency Deviation
During the period 1 s to 5 s, Fig. 10 shows that the main ACgrid frequency starts to drop at time 1s, due to the 1800 MWgeneration loss. The rate of change of frequency (RoCoF) wasmeasured during the period 1 s to 2 s using a sampling time of0.5 s, as indicated in [25], and the maximum frequency deviationwas measured during the period 1 s to 5 s.
Table III is a summary of the RoCoF and frequency deviationon the main AC grid. In the case of NC, the energy sourcesof the MTDC system did not provide frequency support. Thefrequency deviation has a value of 0.51 Hz, which exceeds thepermissible limits on the GB grid.
For the case of CC and ACC, the MTDC system provided fastfrequency response to limit the RoCoF and frequency deviationon the main AC grid compared with the case of NC. Table IIIshows a clear decrease of the initial RoCoF measured within 1safter the generation loss, during the case of CC and ACC. Alsothe frequency deviation is contained within 4 seconds after thedisturbance.
In Fig. 11, a positive sign on the y-axis is used to represent theoperation of the VSCs in rectifier mode and a negative sign isfor the VSCs operating in inverter mode. During the case of CC,a larger amount of additional active power was transferred to themain AC grid compared with the case of ACC, as illustrated inFig. 11c. This resulted in a lower RoCoF and a smaller frequencydeviation on the main AC grid, during the case of CC comparedwith the case of ACC (see Table III). Also, ACC has a deepernadir than CC (see Fig. 10), due to the f vs. P droop whichlimits the active power transferred through the VSCs connectedto the disturbed AC grid as shown in Fig. 11c.
During the case of CC and ACC, the additional active powertransferred to the main AC grid was provided from the windturbine rotating mass (see Fig. 11a) and another AC system(see Fig. 11b). The wind turbine synthetic inertial power wasdelivered more rapidly than the additional active power fromanother AC system. Therefore, the kinetic energy taken fromthe wind turbines helped to limit the RoCoF and the additionalpower from another AC system helped to contain the frequencydeviation, during the case of CC and ACC compared with thecase of NC. The wind turbine auxiliary controller [24] added a0.6 pu torque step to the initial set-point of generator torque, dueto a frequency deviation signal, Δfwf on the offshore network.
ADEUYI et al.: FAST FREQUENCY RESPONSE FROM OFFSHORE MULTITERMINAL VSC–HVDC SCHEMES 2449
During the period 1 s to 2.5 s, Fig. 11a, shows that up to 0.25 pu ofadditional power was transferred from the wind turbine rotatingmass to support the disturbed AC grid for the case of CC andACC.
B. Wind Turbine Recovery Power
At time 8 s, the wind turbine auxiliary controller was deacti-vated and the reference value of generator torque was restoredto its original value. During the period 8 s to 10 s, the windturbines start to recover back to their original speed. Fig. 11ashows that the wind turbine recovery period resulted in up to0.3 pu active power drop on the wind generation. For the caseof CC, the wind turbine recovery power resulted in up to 0.3 puactive power drop on the disturbed AC grid during the period8 s to 10 s (see Fig. 11c). This resulted in a further drop offrequency on the disturbed AC grid, as illustrated in Fig. 10. Inthe case of ACC, the wind turbine recovery power resulted in0.3 pu active power increase on the other AC system during theperiod 8 s to 10 s as shown in Fig. 11b. This prevented a furtherdrop of frequency on the disturbed AC grid, as shown in Fig. 10.
C. DC Voltage and Offshore Frequency Variation
Fig. 12 shows the DC voltage measured at the WFC3 duringthe case of NC, CC and ACC. In all the three cases, the maximumDC voltage deviation is about 0.05 pu, which is within permis-sible limits, assuming DC voltage limits of ±10 percent on theMTDC system. The shape of the DC voltage curves in Fig. 12 issimilar to the active power curves on the GSC1 (see Fig. 11b),due to the converter’s operation with a P vs. Vdc droop.
Fig. 13 shows the AC grid frequency measured at the offshorewind farm during the case of NC, CC and ACC. The offshorefrequency traces (in Fig. 13) show a proportional relation to theDC voltage traces (see Fig. 12) measured at the WFC3, due tothe characteristic of the Vdc vs. f droop fitted to the WFC3. Thefrequency deviation, Δfwf , on the offshore AC network wasused to activate the wind turbine inertia controller.
D. Response Times
The simulation results of GSC2 active power (see Fig. 11c)was used to analyse the response time of the frequency controlschemes and energy sources, during the case of CC and ACC.For the 1800 MW generation loss at 1 s, it took 80 ms delayfor the fast frequency response controllers fitted to the GSC2to detect the generation loss. It took about 120 ms delay forthe DC voltage droop controller on the GSC1 to detect the DCvoltage variation, in order to transfer additional active powerfrom another AC system to the disturbed AC grid. The activationtime for the wind turbine auxiliary controller was about 500 msafter the generation loss. The maximum active power due to fastfrequency response from wind turbines was delivered within1.5 s after the generation loss.
V. LACK OF EXTRA POWER FROM WIND FARMS
A 4-terminal VSC-HVDC system is used to demonstrate theeffectiveness of the CC and ACC scheme when wind farms do
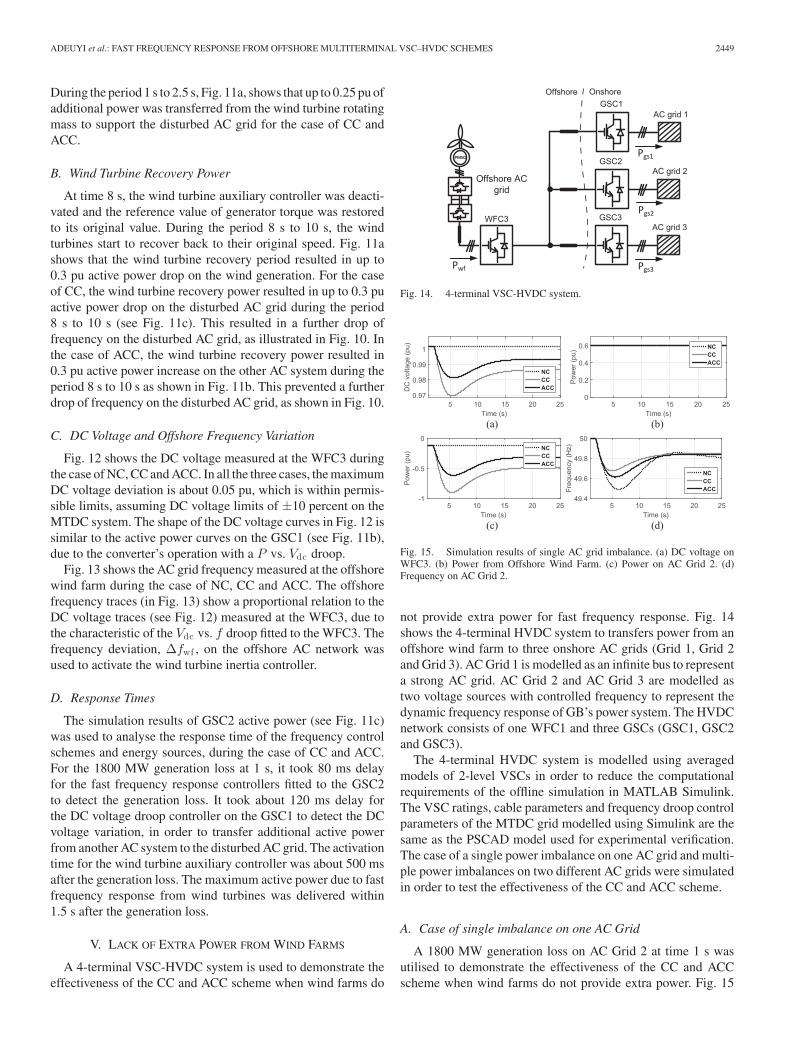
Fig. 14. 4-terminal VSC-HVDC system.
Fig. 15. Simulation results of single AC grid imbalance. (a) DC voltage onWFC3. (b) Power from Offshore Wind Farm. (c) Power on AC Grid 2. (d)Frequency on AC Grid 2.
not provide extra power for fast frequency response. Fig. 14shows the 4-terminal HVDC system to transfers power from anoffshore wind farm to three onshore AC grids (Grid 1, Grid 2and Grid 3). AC Grid 1 is modelled as an infinite bus to representa strong AC grid. AC Grid 2 and AC Grid 3 are modelled astwo voltage sources with controlled frequency to represent thedynamic frequency response of GB’s power system. The HVDCnetwork consists of one WFC1 and three GSCs (GSC1, GSC2and GSC3).
The 4-terminal HVDC system is modelled using averagedmodels of 2-level VSCs in order to reduce the computationalrequirements of the offline simulation in MATLAB Simulink.The VSC ratings, cable parameters and frequency droop controlparameters of the MTDC grid modelled using Simulink are thesame as the PSCAD model used for experimental verification.The case of a single power imbalance on one AC grid and multi-ple power imbalances on two different AC grids were simulatedin order to test the effectiveness of the CC and ACC scheme.
A. Case of single imbalance on one AC Grid
A 1800 MW generation loss on AC Grid 2 at time 1 s wasutilised to demonstrate the effectiveness of the CC and ACCscheme when wind farms do not provide extra power. Fig. 15
2450 IEEE TRANSACTIONS ON POWER DELIVERY, VOL. 32, NO. 6, DECEMBER 2017
Fig. 16. Simulation results of opposing frequency trends on different AC grids.(a) DC voltage on WFC3. (b) Power from Offshore Wind Farm. (c) Frequencyon AC Grid 2. (d) Frequency on AC Grid 3. (e) Power on AC Grid 2. (f) Poweron AC Grid 3.
shows the curves of DC voltage, active power (at WFC3 andGSC2) and AC Grid2 frequency.
The maximum DC voltage deviation increased from 0.02 puin the case of ACC to 0.03 pu during the case of CC as seenin Fig. 15a. For the case of NC, CC and ACC, the wind farmstransfer 0.6 pu active power (see Fig. 15b) to the onshore grid.During the case of CC and ACC, the additional power for fastfrequency response is taken from another AC system, due to thelack of synthetic inertial response from offshore wind farms.In Fig. 15c, more active power is transferred to AC Grid 2 inthe case of CC (see grey line) compared with the case of ACC(see black line). The additional power is taken from AC Grid 1and AC Grid 2, hence the frequency nadir in Fig. 15d is deeperduring the case of ACC than the case of CC. In the case of NC,frequency support schemes were not utilized, hence the MTDCsystem did not provide additional active power to the disturbedAC grids, as shown in Fig. 15.
B. Case of Opposing Frequency Trends on Different AC Grids
During multiple power imbalances on different AC grids, theDC voltage in the MTDC scheme should be controlled by atleast one onshore VSC during the case of CC and ACC. The CCscheme uses multiple f vs. Vdc droops on the VSCs connectedto the disturbed grid. This produces non-linearity of DC voltagecontrol, as described in (2), and results in unwanted operationof the MTDC system during frequency support. The proposedACC scheme uses multiple f vs. P droops to achieve linearDC voltage control that allows correct operation of the MTDCsystem (as described in (6)). The CC and ACC schemes aretested using the case of opposing frequency trends due to a1800 MW generation loss on AC Grid 2 and a 900 MW demandloss on AC Grid 3 at t = 1 s. Fig. 16 shows the WFC DC voltage,
onshore frequency and active power curves (on the WFC side,AC Grid 2 and AC Grid 3) during the case of NC, CC and ACC.
For the case of ACC, Fig. 16a illustrates that the calculatedDC voltage (see grey dashed line), obtained using the analyticalexpression in (6) for an ideal MTDC grid, has good agreementwith the measured DC voltage (see black solid line) on the non-ideal MTDC grid modelled in Simulink. This demonstrates thelinear relationship between the frequency variations in Fig. 16cand Fig. 16d and the DC voltage, due the operation of two GSCswith the f vs. P droop. Hence, the ACC scheme will facilitatethe operation of wind turbine inertia controllers.
For the CC scheme, a non-linear relationship exists betweenthe DC grid voltage and the onshore AC grid frequencies, asdescribed in (2), due to the operation of the f vs. Vdc droopcontroller on the GSC2 and GSC3. Fig. 16a illustrates that theDC voltage (see grey solid line) is not controlled properly dueto multiple DC voltage control operation on the MTDC systemduring power imbalances on AC Grid 2 and AC Grid 3. The DCvoltage response will result in incorrect operation of wind tur-bine inertia controllers Figs. 16c -16f shows that the CC schemeresults in larger power oscillations and frequency deviations onAC Grid 2 and AC Grid 3 compared with the ACC scheme.
VI. CONCLUSIONS
A communication-free alternative coordinated control (ACC)scheme is developed to prevent further frequency drop on dis-turbed AC grids during wind turbine recovery period. Also,the proposed ACC scheme allows correct operation of fast fre-quency response from MTDC-connected wind farms duringmultiple power imbalances on different AC grids, due to thelinear relationship between the MTDC voltage and the onshoreAC grid frequencies. The ACC scheme, which gives priority tothe frequency versus active power droop on VSCs connectedto disturbed AC grids, is compared with a coordinated control(CC) scheme presented in the literature, which uses a frequencyversus DC voltage droop. During a single power imbalance inone AC grid, fast frequency response from MTDC-connectedwind farms (equipped with the ACC and CC scheme) limits theRoCoF on disturbed AC grids and additional active power trans-ferred from another AC system contains the system frequencydeviation. This will prevent unintended tripping of protectionrelays on power systems and enhance the frequency controlrequirements of AC grids.
APPENDIX BDC VOLTAGE ON NON-IDEAL MTDC GRIDS WITH ACC
The DC voltage deviation can be calculated from the sum ofexchanged power between converters in small-signal form:
N∑
i=1
ΔPi = ΔPlosses (10)
The sum of exchanged power can be expressed as:
N∑
i=1
ΔPi =
Vdc vs. P droop︷ ︸︸ ︷
Nn∑
i=1
kvp,iΔVdc,i −
f vs. P droop︷ ︸︸ ︷
Nd∑
i=1
k′f ,iΔfon,i (11)
and the total power losses are:
ΔPlosses =N
∑
i=1
2Iiw ,oRiwΔIiw (12)
where, Iiw ,o and ΔIiw are the initial current and current variationfrom onshore converter i to offshore converter w and Riw isthe equivalent resistance from onshore converter i to offshoreconverter w.
Combining (10)–(12) and considering the voltage dropbetween onshore converters and WFC, ΔVdc,w = ΔVdc,i +
RiwΔIiw , the DC voltage deviation at the WFC is:
ΔVdc,w =
ΔV idd c , w
︷ ︸︸ ︷
∑Nd
i=1 k′f ,iΔfon,i
∑Nn
i=1 kvp,i
+
ΔV v d r o pd c , w
︷ ︸︸ ︷
∑Nn
i=1 kvp,iΔIiwRiw∑Nn
i=1 kvp,i
+
ΔV l o s s e sd c , w
︷ ︸︸ ︷
∑Ni=1 2Iiw ,oΔIiwRiw
∑Nn
i=1 kvp,i
(13)
where ΔV lossesdc,w is the additional DC voltage deviation due to
the voltage drop between onshore converters and WFC andΔV vdrop
dc,w is the additional DC voltage deviation due to powerlosses. If a lossless MTDC grid is considered, ΔPlosses = 0,ΔVdc,w = ΔVdc,i and the DC voltage deviation corresponds toΔV id
dc,w . As an example, the DC voltage deviation in the 3-terminal case study presented in section II-C is calculated whena frequency disturbance occurs in Main AC grid. In this case,ΔIiw = ΔPi/Vdc,i , due to the radial topology of the MTDCgrid. Then, (13) is expressed as:
ΔVdc,3 =k
′f ,2Δfon,2
kvp,1+
kvp,1ΔVdc,1R13
Vdc,1
+2I13,oR13kvp,1ΔVdc,1/Vdc,1 − 2I23,oR23k
′f ,2Δfon,2/Vdc,2
kvp,1
(14)
The non-ideal additional terms can be negligible for nom-inal operational conditions. Considering the simulation pa-rameters in Table IV, the simulation base values in Table IIand maximum DC voltage and frequency deviations equal toΔVdc,max = 0.1 pu and Δfon,max = 0.8 Hz, the maximum DCvoltage deviation at WFC3 is estimated as:
ΔV niddc,3 = ΔV id
dc,3 + ΔV vdropdc,3 + ΔV losses
dc,3
= 0.081 + 0.0034 + 0.0004 = 0.0848 pu (15)
It is observed that the additional terms can be neglected, be-cause they only represent 0.38% of the nominal voltage. Also,the main contribution in the additional non-ideal terms is fromthe voltage drop between converters. This is due to the inher-ent error in the proportional characteristic of the onshore droopcontrollers. The voltage drop effect on the non-ideal DC volt-age deviation can be reduced if higher droop gains kvp,i areused.
ACKNOWLEDGEMENT
Information about the data upon which the reported resultsare based, including how to access them, can be found in theCardiff University data catalogue at http://doi.org/10.17035/d.2016.0011647652.
REFERENCES
[1] National Grid, System operability framework 2015, Warwick, U.K.,2015. [Online]. Available: http://www2.nationalgrid.com/UK/Industry-information/Future-of-Energy/System-Operability-Framework/
2452 IEEE TRANSACTIONS ON POWER DELIVERY, VOL. 32, NO. 6, DECEMBER 2017
[2] J. Ekanayake and N. Jenkins, “Comparison of the response of doubly fedand fixed-speed induction generator wind turbines to changes in networkfrequency,” IEEE Trans. Energy Convers., vol. 19, no. 4, pp. 800–802,Dec. 2004.
[3] G. C. Tarnowski, P. C. Kjar, P. E. Sorensen, and J. Ostergaard, “Vari-able speed wind turbines capability for temporary over-production,”in Proc. IEEE Power Energy Soc. Gen. Meeting, Jul. 2009, pp. 1–7.[Online]. Available: http://ieeexplore.ieee.org/lpdocs/epic03/wrapper.htm?arnumber=5275387
[4] National Grid, Electricity ten year statement (ETYS) 2015,2015. [Online]. Available: http://www2.nationalgrid.com/UK/Industry-information/Future-of-Energy/Electricity-Ten-Year-Statement/
[5] I. M. Sanz, B. Chaudhuri, and G. Strbac, “Inertial response from offshorewind farms connected through DC grids,” IEEE Trans. Power Syst., vol.30, no. 3, pp. 1518–1527, May 2015.
[6] A. Junyent-Ferre, Y. Pipelzadeh, and T. C. Green, “Blending HVDC-link energy storage and offshore wind turbine inertia for fast frequencyresponse,” IEEE Trans. Sustain. Energy, vol. 6, no. 3, pp. 1059–1066, Jul.2015.
[7] L. Chang-Chien, W. Lin, and Y. Yin, “Enhancing frequency responsecontrol by DFIGs in the high wind penetrated power systems,” IEEETrans. Power Syst., vol. 26, no. 2, pp. 710–718, May 2011.
[8] D. Gautam, L. Goel, R. Ayyanar, V. Vittal, and T. Harbour, “Control strat-egy to mitigate the impact of reduced inertia due to doubly fed inductiongenerators on large power systems,” IEEE Trans. Power Syst., vol. 26, no.1, pp. 214–224, Feb. 2011.
[9] J. Morren, S. de Haan, W. Kling, and J. Ferreira, “Wind turbines emulatinginertia and supporting primary frequency control,” IEEE Trans. PowerSyst., vol. 21, no. 1, pp. 433–434, Feb. 2006.
[10] National Grid, Grid code frequency response technical sub-Group re-port, 2013. [Online]. Available: http://www2.nationalgrid.com/UK/Industry-information/Electricity-codes/Grid-code/Modifications/GC0022/
[11] National Grid, SMART frequency control project—The balance ofpower, 2015. [Online]. Available: http://www.nationalgridconnecting.com/The_balance_of_power/index.html
[12] J. Guerrero, G. Adam, and C. Booth, “A generic inertia emulation con-troller for multi-terminal VSC–HVDC systems,” in Proc. 2nd IET Renew.Power Gener. Conf., 2013, p. 2.14.
[13] Y. Phulpin, “Communication-free inertia and frequency control for windgenerators connected by an HVDC-link,” IEEE Trans. Power Syst., vol.27, no. 2, pp. 1136–1137, May 2012.
[14] J. Zhu, C. D. Booth, G. P. Adam, A. J. Roscoe, and C. G. Bright, “Inertiaemulation control strategy for VSC–HVDC transmission systems,” IEEETrans. Power Syst., vol. 28, no. 2, pp. 1277–1287, May 2013.
[15] Y. Li, Z. Zhang, Y. Yang, Y. Li, H. Chen, and Z. Xu, “Coordinated controlof wind farm and VSC–HVDC system using capacitor energy and kineticenergy to improve inertia level of power systems,” Int. J. Elect. PowerEnergy Syst., vol. 59, pp. 79–92, Jul. 2014.
[16] B. Silva, C. L. Moreira, L. Seca, Y. Phulpin, and J. A. Pecas Lopes, “Pro-vision of inertial and primary frequency control services using offshoremultiterminal HVDC networks,” IEEE Trans. Sustain. Energy, vol. 3, no.4, pp. 800–808, Oct. 2012.
[17] T. M. Haileselassie and K. Uhlen, “Power system security in a meshednorth sea HVDC grid,” Proc. IEEE, vol. 101, no. 4, pp. 978–990, Apr.2013.
[18] N. R. Chaudhuri, R. Majumder, and B. Chaudhuri, “System frequencysupport through multi-terminal DC (MTDC) grids,” IEEE Trans. PowerSyst., vol. 28, no. 1, pp. 347–356, Feb. 2013.
[19] P. Rault, X. Guillaud, F. Colas, and S. Nguefeu, “Investigation on inter-actions between AC and DC grids,” in Proc. IEEE Grenoble Conf., Jun.2013, pp. 1–6.
[20] S. Akkari, M. Petit, J. Dai, and X. Guillaud, “Interaction between thevoltage-droop and the frequency-droop control for multi-terminal HVDCsystems,” IET Gen., Transm. Distrib., vol. 10, no. 6, pp. 1345–1352, Apr.2016.
[21] L. Xu, J. Rafferty, Y. Wang, and G. Xu, “MTDC systems for frequencysupport base on dc voltage manipulation,” in Proc. Int. Conf. Renew. PowerGen., 2015, p. 6.
[22] Y. Mu, J. Wu, J. Ekanayake, N. Jenkins, and H. Jia, “Primary frequencyresponse from electric vehicles in the Great Britain power system,” IEEETrans. Smart Grid, vol. 4, no. 2, pp. 1142–1150, Jun. 2013.
[23] M. Cheah-Mane, J. Liang, and N. Jenkins, “Permanent magnet syn-chronous generator for wind turbines: Modelling, control and inertialfrequency response,” in Proc. 49th Int. Univ. Power Eng. Conf., Sep.2014, pp. 1–6.
[24] M. Kayikci and J. Milanovic, “Dynamic contribution of DFIG-based windplants to system frequency disturbances,” IEEE Trans. Power Syst., vol.24, no. 2, pp. 859–867, May 2009.
[25] European Network of Transmission System Operators—Electricity, “Draftnetwork code on high voltage direct current connections and DC-connected power park modules,” ENTSO-E, Brussels, Belgium, 2014.
Oluwole Daniel Adeuyi (S’11–M’16) receivedthe B.Sc. degree in electrical/electronics engineer-ing from the Federal University of Agriculture,Abeokuta, Nigeria, in 2010, the M.Sc. degree (Hons.)in 2012, and the Ph.D. degree in electrical energy sys-tems from Cardiff University, Cardiff, U.K., in 2016.
He is a Research Fellow in the School of Engi-neering, Cardiff University, with a focus on enhancedcontrol and operation of renewable energy systems,offshore dc networks, and smart power grids.
Marc Cheah-Mane (S’14) received the degree in in-dustrial engineering from the School of Industrial En-gineering of Barcelona, Technical University of Cat-alonia, Barcelona, Spain, in 2013 and is currently pur-suing the Ph.D. degree at Cardiff University, Cardiff,U.K.
From 2010 to 2013, he was a Researcher inthe Centre d’Innovacio Tecnologica en Conver-tidors Estatics i Accionaments. His research inter-ests include renewable energies, power converters,high-voltage dc systems, electrical machines, andmicrogrids.
Jun Liang (M’02–SM’12) received the B.Sc. degreein electrical power engineering from Huazhong Uni-versity of Science and Technology, Wuhan, China, in1992 and the M.Sc. and Ph.D. degrees from the ChinaElectric Power Research Institute, Beijing, China, in1995 and 1998, respectively.
From 1998 to 2001, he was a Senior Engineer withthe China Electric Power Research Institute. From2001 to 2005, he was a Research Associate in theImperial College London, London, U.K. From 2005to 2007, he was a Senior Lecturer at the University
of Glamorgan, Pontypridd, U.K.He is currently a Reader in the School of Engineering, Cardiff University,
Cardiff, U.K. His research interests include FACTS devices/HVdc, power sys-tem stability and control, power electronics, and renewable power generation.
Nick Jenkins (M’81–SM’97–F’05) receivedthe B.Sc. degree from Southampton University,Southampton, U.K., in 1974, the M.Sc. degree fromReading University, Reading, U.K., in 1975, andthe Ph.D. degree from Imperial College London,London, U.K., in 1986.
He is currently a Professor and Director in theInstitute of Energy, Cardiff University, Cardiff, U.K.Before moving to academia, his career included14 years of industrial experience, of which fiveyears were in developing countries. While at the
university, he has developed teaching and research activities in both electricalpower engineering and renewable energy.