25 January 2021 Sector Update Indian Chemical Sector HSIE Research is also available on Bloomberg ERH HDF <GO> & Thomson Reuters Steering well through the pandemic! The Indian chemical industry holds an integral position in the global market. It is the sixth-largest globally, and the third-largest in Asia with a market size of ~USD180bn. The Indian chemical industry is in a sweet spot with tremendous opportunity and favourable tailwinds. It should experience significant growth in the coming years, driven by rising household incomes, the existent consumption gap, favourable government policies, and a huge export opportunity. The rising disposable income will lead to a shift in consumer preferences towards premier products. There will be a shift in consumption from commoditised products towards premier products across all industries. Currently, imports meet a large part of the domestic demand for speciality and downstream chemicals, offering much headroom growth in local production. In addition to significant growth in domestic demand, the geopolitical shifts underway in the international markets offer India an opportunity to emerge as a global production and export powerhouse. The focus on investments to develop product and process capabilities, research & development abilities, and supportive policies should drive the industry's growth. We expect aggregate revenue of our chemical universe to grow at a 14% CAGR over FY21-24E, while APAT CAGR would be ahead of revenue growth 17% for the companies under our coverage. Average RoCE of the companies in our chemical universe would expand by 50bps to 18% in FY24E despite their heavy Capex investments. The aggregate OCF of our chemical universe should grow by 45% from INR 35bn in FY21E to INR 51bn in FY24E. We roll forward the DCF-based target prices for companies under our coverage to Mar ‘23 (earlier Sep’22). We maintain a BUY rating for AIL, Galaxy Surfactants, Sudarshan Chemical, and an ADD rating for NFIL, while a SELL rating for Vinati Organics. We have increased the target prices for Alkyl Amines, Balaji Amines and SRF, but have downgraded their rating from BUY to ADD. We like these stocks owing to the expectation of their attractive revenue growth, margin levers and capacity expansion over the next two years. The downgrade is largely on the back of 20-50% increase in the stock prices in the past three months. Rising disposable income to increase the demand for value-added products With the rise in disposable incomes and an increase in urbanisation, consumer preferences will shift towards a healthier lifestyle and environmentally friendly products. It will boost the demand for value-added products from end-user industries. India's per capita chemical consumption continues to be significantly lower than that of the developed markets. India is one of the fastest-growing consumer markets globally, wherein per capita chemical consumption is low, allowing much headroom for growth. China plus one policy to create a massive opportunity The ongoing global trade war and changing geopolitical scenario triggered by the spread of the pandemic will encourage more global chemical companies to diversify their supply sources. Indian chemical manufacturers are in a sweet spot with policy support from the government. China is the largest chemical producer globally (~36% market share). India's share in the global chemical market (~3%) will be doubled by a shift of merely 10% of China's chemical business to India. Company Reco TP Upside (%) AIL BUY 1,440 21.5 Alkyl Amines ADD 5,310 8.9 Balaji Amines ADD 1,280 14.4 Galaxy Surfactants BUY 2,600 18.0 NFIL ADD 2,720 7.0 SRF ADD 6,080 5.3 Sudarshan Chemical BUY 610 20.8 Vinati Organics SELL 1,020 -18.7 FY22E PER (x) P/B (x) AIL 41.5 5.4 Alkyl Amines 37.8 10.1 Balaji Amines 21.3 3.7 Galaxy Surfactants 23.5 5.1 NFIL 42.1 6.8 SRF 34.5 5.1 Sudarshan Chemical 25.4 4.8 Vinati Organics 37.8 7.2 Nilesh Ghuge [email protected]+91-22-6171-7342 Harshad Katkar [email protected]+91-22-6171-7319 Rutvi Chokshi [email protected]+91-22-6171-7356
Transcript
25 January 2021 Sector Update
Indian Chemical Sector
HSIE Research is also available on Bloomberg ERH HDF <GO> & Thomson Reuters
Steering well through the pandemic! The Indian chemical industry holds an integral position in the global market.
It is the sixth-largest globally, and the third-largest in Asia with a market size
of ~USD180bn. The Indian chemical industry is in a sweet spot with
tremendous opportunity and favourable tailwinds. It should experience
significant growth in the coming years, driven by rising household incomes,
the existent consumption gap, favourable government policies, and a huge
export opportunity.
The rising disposable income will lead to a shift in consumer preferences
towards premier products. There will be a shift in consumption from
commoditised products towards premier products across all industries.
Currently, imports meet a large part of the domestic demand for speciality and
downstream chemicals, offering much headroom growth in local production.
In addition to significant growth in domestic demand, the geopolitical shifts
underway in the international markets offer India an opportunity to emerge as
a global production and export powerhouse.
The focus on investments to develop product and process capabilities, research
& development abilities, and supportive policies should drive the industry's
growth. We expect aggregate revenue of our chemical universe to grow at a
14% CAGR over FY21-24E, while APAT CAGR would be ahead of revenue
growth 17% for the companies under our coverage. Average RoCE of the
companies in our chemical universe would expand by 50bps to 18% in FY24E
despite their heavy Capex investments. The aggregate OCF of our chemical
universe should grow by 45% from INR 35bn in FY21E to INR 51bn in FY24E.
We roll forward the DCF-based target prices for companies under our coverage
to Mar ‘23 (earlier Sep’22). We maintain a BUY rating for AIL, Galaxy
Surfactants, Sudarshan Chemical, and an ADD rating for NFIL, while a SELL
rating for Vinati Organics. We have increased the target prices for Alkyl
Amines, Balaji Amines and SRF, but have downgraded their rating from BUY
to ADD. We like these stocks owing to the expectation of their attractive
revenue growth, margin levers and capacity expansion over the next two years.
The downgrade is largely on the back of 20-50% increase in the stock prices in
the past three months.
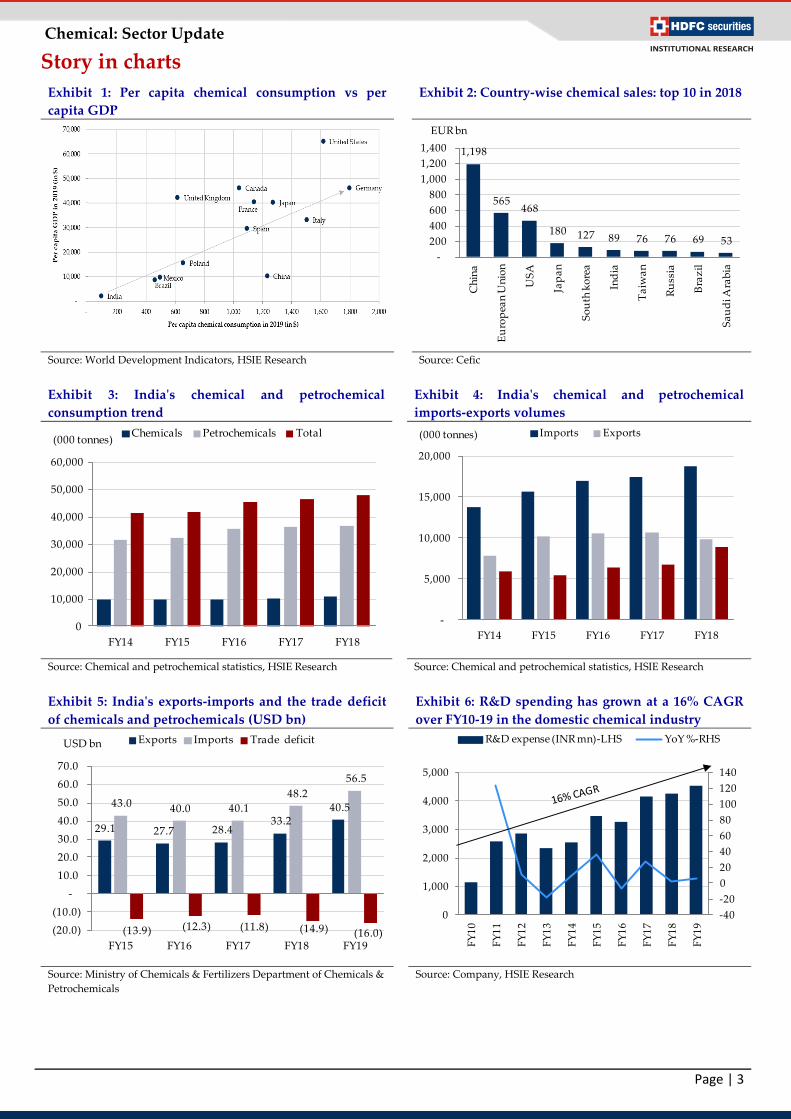
Rising disposable income to increase the demand for value-added products
With the rise in disposable incomes and an increase in urbanisation, consumer
preferences will shift towards a healthier lifestyle and environmentally friendly
products. It will boost the demand for value-added products from end-user
industries. India's per capita chemical consumption continues to be significantly
lower than that of the developed markets. India is one of the fastest-growing
consumer markets globally, wherein per capita chemical consumption is low,
allowing much headroom for growth.
China plus one policy to create a massive opportunity
The ongoing global trade war and changing geopolitical scenario triggered by the
spread of the pandemic will encourage more global chemical companies to
diversify their supply sources. Indian chemical manufacturers are in a sweet spot
with policy support from the government. China is the largest chemical producer
globally (~36% market share). India's share in the global chemical market (~3%)
will be doubled by a shift of merely 10% of China's chemical business to India.
Disclosure: We, Nilesh Ghuge, MMS, Harshad Katkar, MBA & Rutvi Chokshi, CA, authors and the names subscribed to this report, hereby certify that all of the views expressed in this research report accurately reflect our views about the subject issuer(s) or securities. HSL has no material adverse disciplinary history as on the date of publication of this report. We also certify that no part of our compensation was, is, or will be directly or indirectly related to the specific recommendation(s) or view(s) in this report. Research Analyst or his/her relative or HDFC Securities Ltd. does not have any financial interest in the subject company. Also Research Analyst or his relative or HDFC Securities Ltd. or its Associate may have beneficial ownership of 1% or more in the subject company at the end of the month immediately preceding the date of publication of the Research Report. Further Research Analyst or his relative or HDFC Securities Ltd. or its associate does not have any material conflict of interest. Any holding in stock –No HDFC Securities Limited (HSL) is a SEBI Registered Research Analyst having registration no. INH000002475. Disclaimer: This report has been prepared by HDFC Securities Ltd and is solely for information of the recipient only. The report must not be used as a singular basis of any investment decision. The views herein are of a general nature and do not consider the risk appetite or the particular circumstances of an individual investor; readers are requested to take professional advice before investing. Nothing in this document should be construed as investment advice. Each recipient of this document should make such investigations as they deem necessary to arrive at an independent evaluation of an investment in securities of the companies referred to in this document (including merits and risks) and should consult their own advisors to determine merits and risks of such investment. The information and opinions contained herein have been compiled or arrived at, based upon information obtained in good faith from sources believed to be reliable. Such information has not been independently verified and no guaranty, representation of warranty, express or implied, is made as to its accuracy, completeness or correctness. All such information and opinions are subject to change without notice. Descriptions of any company or companies or their securities mentioned herein are not intended to be complete. HSL is not obliged to update this report for such changes. HSL has the right to make changes and modifications at any time. This report is not directed to, or intended for display, downloading, printing, reproducing or for distribution to or use by, any person or entity who is a citizen or resident or located in any locality, state, country or other jurisdiction where such distribution, publication, reproduction, availability or use would be contrary to law or regulation or what would subject HSL or its affiliates to any registration or licensing requirement within such jurisdiction. If this report is inadvertently sent or has reached any person in such country, especially, United States of America, the same should be ignored and brought to the attention of the sender. This document may not be reproduced, distributed or published in whole or in part, directly or indirectly, for any purposes or in any manner. Foreign currencies denominated securities, wherever mentioned, are subject to exchange rate fluctuations, which could have an adverse effect on their value or price, or the income derived from them. In addition, investors in securities such as ADRs, the values of which are influenced by foreign currencies effectively assume currency risk. It should not be considered to be taken as an offer to sell or a solicitation to buy any security. This document is not, and should not, be construed as an offer or solicitation of an offer, to buy or sell any securities or other financial instruments. This report should not be construed as an invitation or solicitation to do business with HSL. HSL may from time to time solicit from, or perform broking, or other services for, any company mentioned in this mail and/or its attachments. HSL and its affiliated company(ies), their directors and employees may; (a) from time to time, have a long or short position in, and buy or sell the securities of the company(ies) mentioned herein or (b) be engaged in any other transaction involving such securities and earn brokerage or other compensation or act as a market maker in the financial instruments of the company(ies) discussed herein or act as an advisor or lender/borrower to such company(ies) or may have any other potential conflict of interests with respect to any recommendation and other related information and opinions. HSL, its directors, analysts or employees do not take any responsibility, financial or otherwise, of the losses or the damages sustained due to the investments made or any action taken on basis of this report, including but not restricted to, fluctuation in the prices of shares and bonds, changes in the currency rates, diminution in the NAVs, reduction in the dividend or income, etc. HSL and other group companies, its directors, associates, employees may have various positions in any of the stocks, securities and financial instruments dealt in the report, or may make sell or purchase or other deals in these securities from time to time or may deal in other securities of the companies / organizations described in this report. HSL or its associates might have managed or co-managed public offering of securities for the subject company or might have been mandated by the subject company for any other assignment in the past twelve months. HSL or its associates might have received any compensation from the companies mentioned in the report during the period preceding twelve months from the date of this report for services in respect of managing or co-managing public offerings, corporate finance, investment banking or merchant banking, brokerage services or other advisory service in a merger or specific transaction in the normal course of business. HSL or its analysts did not receive any compensation or other benefits from the companies mentioned in the report or third party in connection with preparation of the research report. Accordingly, neither HSL nor Research Analysts have any material conflict of interest at the time of publication of this report. Compensation of our Research Analysts is not based on any specific merchant banking, investment banking or brokerage service transactions. HSL may have issued other reports that are inconsistent with and reach different conclusion from the information presented in this report. Research entity has not been engaged in market making activity for the subject company. Research analyst has not served as an officer, director or employee of the subject company. We have not received any compensation/benefits from the subject company or third party in connection with the Research Report. HDFC securities Limited, I Think Techno Campus, Building - B, "Alpha", Office Floor 8, Near Kanjurmarg Station, Opp. Crompton Greaves, Kanjurmarg (East), Mumbai 400 042 Phone: (022) 3075 3400 Fax: (022) 2496 5066 Compliance Officer: Binkle R. Oza Email: [email protected] Phone: (022) 3045 3600 HDFC Securities Limited, SEBI Reg. No.: NSE, BSE, MSEI, MCX: INZ000186937; AMFI Reg. No. ARN: 13549; PFRDA Reg. No. POP: 11092018; IRDA Corporate Agent License No.: CA0062; SEBI Research Analyst Reg. No.: INH000002475; SEBI Investment Adviser Reg. No.: INA000011538; CIN - U67120MH2000PLC152193
HDFC securities
Institutional Equities
Unit No. 1602, 16th Floor, Tower A, Peninsula Business Park,