2580 IEEE TRANSACTIONS ON WIRELESS COMMUNICATIONS, VOL. 7, NO. 7, JULY 2008 Scheduling Performance in Downlink WCDMA Networks with AMC and Fast Cell Selection Hua Fu and Dong In Kim, Senior Member, IEEE Abstract—This paper is concerned with the analysis of schedul- ing performance in downlink WCDMA networks that employ adaptive modulation and coding (AMC) and fast cell selection (FCS). The scheduling schemes investigated include (i) the Round Robin (RR) scheme, (ii) the maximum carrier-to-interference ratio (C/I ) scheme, (iii) the simplified proportional fair (PF) scheme, and (iv) the conventional PF scheme. The channel model includes large-scale signal attenuation and small-scale fading. By using a form analogous to Shannon’s channel capacity formula, a logarithmic relationship between the instantaneous data rate and the C/I with AMC is first established. Using the so-called Poisson scheme in which the probabilities of the occurrence of the events in Bernoulli trials depend on the trial index, FCS implementation is then examined in detail. Finally, a complete set of analytical expressions on the average system throughput, the peak data rate and the fairness for the abovementioned scheduling schemes are derived. Index Terms—Throughput, fairness, scheduling, round robin, proportional fair, maximum C/I , AMC, FCS, WCDMA. I. I NTRODUCTION I N parallel with fast growing internet services via the wireless medium, the third-generation (3G) mobile com- munication system based on wideband code division multiple access (WCDMA) has been developed as the basic radio ac- cess technology for the universal mobile telecommunications system (UMTS), and is being deployed as one of the IMT- 2000 standards [1] - [7]. The system can support high-speed packet data services with multi-rate multi-media traffic and with different quality-of-service (QoS) requirements. In 3G WCDMA data networks, the downlink bears a significantly higher traffic load than the uplink [1]. In order to support this high traffic load, several new techniques are introduced, including downlink scheduling, adaptive modula- tion and coding (AMC) and fast cell selection (FCS). Down- link scheduling is the algorithm that decides which packets should be transmitted and when. In the WCDMA high-speed downlink packet access (WCDMA-HSDPA) network [2], [5], [7] and the CDMA high data rate (CDMA-HDR) network [3], Manuscript received November 18, 2006; revised January 31, 2007, May 21, 2007, and July 29, 2007; accepted October 2, 2007. The associate editor coordinating the review of this paper and approving it for publication was S. Shen. This work was supported by the Ministry of Knowledge Economy, Korea, under the ITRC (Information Technology Research Center) support program supervised by the IITA (Institute of Information Technology Assessment). This paper was presented in part at the 2007 IEEE Global Communications Conference, Washington, USA, November 2007. H. Fu is with the Department of Electrical and Computer Engineering, Na- tional University of Singapore, Singapore 117576 (e-mail: [email protected]). D. I. Kim is with the School of Information and Communication Engineering, Sungkyunkwan University, Suwon 440-746, Korea (e-mail: [email protected]). Digital Object Identifier 10.1109/TWC.2008.060956. [4], [6], a feedback mechanism has been included to constantly estimate the channel and inform the base station (BS) of the channel states for all active mobile users. This information allows the BS some flexibility in scheduling according to the estimated channel quality. Several scheduling schemes have been proposed [1] - [7] to achieve the trade-off between throughput and fairness which are two key measures of the QoS. These scheduling schemes include the Round Robin (RR) [2], [5], [7], the maximum carrier-to-interference ratio (C/I ) [2], [5], [7], and the proportional fair (PF) [3], [4], [6]. Intuitively, the RR scheme is perhaps the simplest of all as its implementation completely ignores the channel conditions. The maximum C/I scheme provides the maximum system throughput as it assigns the resource to the user with the best channel condition. The PF scheme schedules users to get access to the channel subject to some fairness criteria. AMC and FCS are two important link adaptation techniques. They have been proposed and implemented in 3G WCDMA downlink networks to enable more reliable communications while simultaneously improving data throughput and system capacity [6], [7]. Using AMC, the modulation and coding for- mats can be changed in accordance with variations in the chan- nel conditions. For instance, the mobile users experiencing good channel quality can be assigned higher-order modulation and coding rate to achieve larger system throughput, whereas the users with poor channel quality may choose lower-order modulation and coding rate to combat channel impairments and enhance the performance. Using FCS, the mobile user can select the best active BS which should serve it on the downlink. It can be treated as alternative to soft handoff. Note that in current WCDMA-HSDPA and CDMA-HDR downlink systems, no soft handoff is used. Various studies have been performed on AMC and FCS. In [8], the physical layer performance of the modems for high-order modulation schemes with AMC was extensively analyzed. A new method for selecting the appropriate AMC schemes in 3G wireless systems was proposed in [9]. The benefits of site selection diversity transmission power control for CDMA forward link were investigated in [10]. A network controlled cell selection for HSDPA and its advantage were studied in [11]. Some recent work on downlink scheduling in- cluded the following. A flexible downlink scheduling scheme used in packet data system was discussed in [12]. Downlink scheduling optimization with fairness constraint and user constraint was studied in [13] and [14], respectively. A cross- layer design on adaptive downlink scheduling is presented in [15]. The merit on base-station density in CDMA system using downlink scheduling was examined in [16]. However, 1536-1276/08$25.00 c 2008 IEEE Authorized licensed use limited to: Sungkyunkwan University. Downloaded on February 27, 2009 at 05:02 from IEEE Xplore. Restrictions apply.
Transcript
2580 IEEE TRANSACTIONS ON WIRELESS COMMUNICATIONS, VOL. 7, NO. 7, JULY 2008
Scheduling Performance in Downlink WCDMANetworks with AMC and Fast Cell Selection
Hua Fu and Dong In Kim, Senior Member, IEEE
Abstract—This paper is concerned with the analysis of schedul-ing performance in downlink WCDMA networks that employadaptive modulation and coding (AMC) and fast cell selection(FCS). The scheduling schemes investigated include (i) the RoundRobin (RR) scheme, (ii) the maximum carrier-to-interferenceratio (C/I) scheme, (iii) the simplified proportional fair (PF)scheme, and (iv) the conventional PF scheme. The channel modelincludes large-scale signal attenuation and small-scale fading. Byusing a form analogous to Shannon’s channel capacity formula, alogarithmic relationship between the instantaneous data rate andthe C/I with AMC is first established. Using the so-called Poissonscheme in which the probabilities of the occurrence of the eventsin Bernoulli trials depend on the trial index, FCS implementationis then examined in detail. Finally, a complete set of analyticalexpressions on the average system throughput, the peak data rateand the fairness for the abovementioned scheduling schemes arederived.
Index Terms—Throughput, fairness, scheduling, round robin,proportional fair, maximum C/I , AMC, FCS, WCDMA.
I. INTRODUCTION
IN parallel with fast growing internet services via thewireless medium, the third-generation (3G) mobile com-
munication system based on wideband code division multipleaccess (WCDMA) has been developed as the basic radio ac-cess technology for the universal mobile telecommunicationssystem (UMTS), and is being deployed as one of the IMT-2000 standards [1] - [7]. The system can support high-speedpacket data services with multi-rate multi-media traffic andwith different quality-of-service (QoS) requirements.
In 3G WCDMA data networks, the downlink bears asignificantly higher traffic load than the uplink [1]. In orderto support this high traffic load, several new techniques areintroduced, including downlink scheduling, adaptive modula-tion and coding (AMC) and fast cell selection (FCS). Down-link scheduling is the algorithm that decides which packetsshould be transmitted and when. In the WCDMA high-speeddownlink packet access (WCDMA-HSDPA) network [2], [5],[7] and the CDMA high data rate (CDMA-HDR) network [3],
Manuscript received November 18, 2006; revised January 31, 2007, May21, 2007, and July 29, 2007; accepted October 2, 2007. The associateeditor coordinating the review of this paper and approving it for publicationwas S. Shen. This work was supported by the Ministry of KnowledgeEconomy, Korea, under the ITRC (Information Technology Research Center)support program supervised by the IITA (Institute of Information TechnologyAssessment). This paper was presented in part at the 2007 IEEE GlobalCommunications Conference, Washington, USA, November 2007.
H. Fu is with the Department of Electrical and Computer Engineering, Na-tional University of Singapore, Singapore 117576 (e-mail: [email protected]).
D. I. Kim is with the School of Information and CommunicationEngineering, Sungkyunkwan University, Suwon 440-746, Korea (e-mail:[email protected]).
Digital Object Identifier 10.1109/TWC.2008.060956.
[4], [6], a feedback mechanism has been included to constantlyestimate the channel and inform the base station (BS) of thechannel states for all active mobile users. This informationallows the BS some flexibility in scheduling according to theestimated channel quality. Several scheduling schemes havebeen proposed [1] - [7] to achieve the trade-off betweenthroughput and fairness which are two key measures of theQoS. These scheduling schemes include the Round Robin(RR) [2], [5], [7], the maximum carrier-to-interference ratio(C/I) [2], [5], [7], and the proportional fair (PF) [3], [4], [6].Intuitively, the RR scheme is perhaps the simplest of all asits implementation completely ignores the channel conditions.The maximum C/I scheme provides the maximum systemthroughput as it assigns the resource to the user with thebest channel condition. The PF scheme schedules users toget access to the channel subject to some fairness criteria.AMC and FCS are two important link adaptation techniques.They have been proposed and implemented in 3G WCDMAdownlink networks to enable more reliable communicationswhile simultaneously improving data throughput and systemcapacity [6], [7]. Using AMC, the modulation and coding for-mats can be changed in accordance with variations in the chan-nel conditions. For instance, the mobile users experiencinggood channel quality can be assigned higher-order modulationand coding rate to achieve larger system throughput, whereasthe users with poor channel quality may choose lower-ordermodulation and coding rate to combat channel impairmentsand enhance the performance. Using FCS, the mobile usercan select the best active BS which should serve it on thedownlink. It can be treated as alternative to soft handoff. Notethat in current WCDMA-HSDPA and CDMA-HDR downlinksystems, no soft handoff is used.
Various studies have been performed on AMC and FCS.In [8], the physical layer performance of the modems forhigh-order modulation schemes with AMC was extensivelyanalyzed. A new method for selecting the appropriate AMCschemes in 3G wireless systems was proposed in [9]. Thebenefits of site selection diversity transmission power controlfor CDMA forward link were investigated in [10]. A networkcontrolled cell selection for HSDPA and its advantage werestudied in [11]. Some recent work on downlink scheduling in-cluded the following. A flexible downlink scheduling schemeused in packet data system was discussed in [12]. Downlinkscheduling optimization with fairness constraint and userconstraint was studied in [13] and [14], respectively. A cross-layer design on adaptive downlink scheduling is presentedin [15]. The merit on base-station density in CDMA systemusing downlink scheduling was examined in [16]. However,
Authorized licensed use limited to: Sungkyunkwan University. Downloaded on February 27, 2009 at 05:02 from IEEE Xplore. Restrictions apply.
FU and KIM: SCHEDULING PERFORMANCE IN DOWNLINK WCDMA NETWORKS WITH AMC AND FAST CELL SELECTION 2581
the analysis on the impact of joint downlink scheduling andlink adaptation on the throughput and fairness performance hasnot been addressed satisfactorily in the literature. The maincontribution of this paper, therefore, is to develop a unifiedtheoretical framework to determine the analytical expressionson the throughput and fairness, in which both downlinkscheduling schemes and link adaptation techniques proposedin 3GPP and 3GPP2 [1] are incorporated. This work can beseen as a complement to the system level simulations andexperimental implementations conducted in the industry [1]- [7]. Specifically, it derives a complete set of expressionson the BS throughput, the ensemble average throughput ofthe active region, the peak data throughput and the fairnesswith AMC, FCS and four scheduling algorithms, includingthe RR, maximum C/I , simplified PF and conventional PF.In the fairness analysis, two criteria are considered. From theexpressions derived, the behavior of throughput and fairness asa function of various system parameters can easily be deduced.The results are not only of fundamental theoretical value, butare also vital to guiding the simulations and experiments tobe performed.
Section II describes the system model. Section III presentsAMC and establishes a logarithmic relationship between theinstantaneous data rate and C/I . Section IV studies FCSusing Possion scheme. In Section V, the throughput andfairness of various scheduling schemes are analyzed, andtheir explicit expressions are derived. Section VI presentsnumerical/simulation results to highlight the dependence ofthroughput/fairness performance on FCS, scheduling algo-rithms and system parameters.
II. SYSTEM MODEL AND ASSUMPTIONS
The network and system model consists of multiple hexag-onal cells with a BS at its center, as shown in Fig. 1. Notethat in theory the number of cells can be infinite, however,in actual simulation/numerical evaluation presented in SectionVI, we only consider three concentric rings around the regionstudied. We assume 120◦ ideal antenna sectorization, which isdefined as unity gain inside sector, zero gain outside sector [17,Section (6.8)]. No power control is used and the total transmitpowers are equal for all BSs. The active region modelledincludes three contiguous sectors − the shaded region inFig. 1. We assume that there are M mobile users, uniformlydistributed in the active region, and all BSs operate at fullloading [4]. A set S of BSs that provide the packet data serviceto the users in the active region includes BS 1, BS 2 and BS3 only, i.e., S = {1, 2, 3}. In the downlink WCDMA system,the packet transmission can be carried out on a set of physicalchannels shared by the users with either code-division mul-tiplexing (CDM) mode or time-division multiplexing (TDM)mode [1], [5]. In this paper we follow the transmission schemeused in the WCDMA-HSDPA and CDMA-HDR networks [3]- [7], and assume that the packets are transmitted in the TDMmode and at the full power allocated to a mobile user in anone-by-one transmission fashion with both data rate and timeslot length changing [3, Figure 1], according to the user’schannel conditions. At any given time the users receive thepacket data from no more than one BS in the active set S,and we assume soft handoff is not utilized [6], [7]. Instead
Fig. 1. Cellular layout and the active region for fast cell selection (FCS).
of combining transmit energies from multiple BSs, the usersin the active region are now able to rapidly switch fromcommunicating with one BS to another in the set S.
The channel model considered in this paper includes large-scale signal attenuation and small-scale fading [17]. Large-scale attenuation consists of path loss and shadowing effectwhich describe the mean signal variations over a much longertime scale and a large distance between the transmitter andreceiver. The rapid fluctuations of the received signal envelopeover a short period of time or travel distance are characterizedby small-scale fading. We assume that the distance betweenthe BS and mobile user is known. This is justifiable becausethe mobile users can periodically report their locations to theBS for handoff. The user location can also be detected by thenetwork. UMTS has specified various kinds of mobile posi-tioning methods [1], [18], [19], e.g., the cell coverage-basedpositioning method, the observed time difference of arrival-idle period downlink method, and the network-assisted GPSmethod. Therefore, the distance between the BS and mobileuser can be accurately evaluated based on the knowledge ofuser’s location. The small-scale channel fading in this paper isassumed to follow the Rayleigh distribution for the receivedsignal envelope. The corresponding squared envelope (denotedas ψ) that is proportional to a short-term instantaneous poweris exponentially distributed. Its probability density function(PDF) has the form [17]
f(ψ) =1η2e−ψ/η
2, ψ ≥ 0 (1)
where η2 is the average power. Following [17], [20] and [21],the signal power attenuation, A(d, ξ, ψ), which includes pathloss, lognormal shadowing and Rayleigh fading, is modelledas
A(d, ξ, ψ) = d−4 10(ξ/10) ψ (2)
where d is the known distance between the BS and mobileuser. The inverse fourth-law propagation is assumed. Thequantity ξ is a Gaussian-distributed random variable withmean zero and standard deviation σ (dB), i.e., ξ ∼ N(0, σ2),
Authorized licensed use limited to: Sungkyunkwan University. Downloaded on February 27, 2009 at 05:02 from IEEE Xplore. Restrictions apply.
2582 IEEE TRANSACTIONS ON WIRELESS COMMUNICATIONS, VOL. 7, NO. 7, JULY 2008
so that the shadowing 10(ξ/10) is a lognormally distributedrandom variable.
III. CARRIER-TO-INTERFERENCE RATIO AND
INSTANTANEOUS DATA RATE WITH AMC
In the downlink WCDMA system, the user’s channel con-dition measured by C/I is a primary factor in determiningthe instantaneous data rate. The value of C/I is defined asthe ratio of the received signal energy density to single-sidedinterference density and can be measured through the pilotbursts [3]. Note that the interference here comprises intercellinterference and thermal noise. It is assumed in this paper thatthe cell-specific spreading codes are statistically independent,so that the despread signals associated with BSs in the set Scan be treated as mutually independent under the TDM (i.e.,no intracell interference). We use W to denote the systembandwidth, P to denote the total transmitted power of each BS,and Ik + ν to denote the mean interference plus backgroundnoise level received by user k in the active region [22]. WithTDM, the received instantaneous C/I at user k from BS i iswritten as
γki =PA(dki, ξki, ψki)/W
(Ik + ν)/W=A(dki, ξki, ψki)
(Ik + ν)/P(3)
where i ∈ S = {1, 2, 3} and k = 1, 2, . . . ,M . Substituting(2) into (3) yields
γki =Pd−4
ki
Ik + ν10(ξki/10) ψki (4)
where, for each k = 1, 2, . . . ,M and each i = 1, 2, 3, {ξki}is a set of independent, identically distributed (i.i.d.) Gaussianrandom variables with mean zero and variance σ2 (dB); {ψki}is a set of i.i.d. exponential random variables with mean η2.For each k and i, the quantities ξki and ψki are mutuallyindependent. For k �= p and i �= q, {ξki, ψki} are independentof {ξpq, ψpq}. The average value of C/I is given by γki =Pd−4
ki
Ik+ν η2 exp
[σ2
2
(ln 1010
)2].
The composite distribution due to shadowing 10(ξki/10)
and Rayleigh fading ψki in (4) called Lee-Yeh distribution[21] has no closed-form solution and is rather complicatedmathematically, but can well be approximated by a lognormalfunction. This approximation is very useful and convenient toengineering applications since the lognormal distribution canbe completely specified by the mean and standard deviation.Following [21] and using the natural logarithm, the PDF ofγki can be derived as
f(γki) =1
γki√
2πς2exp
[− (lnγki − μki)2
2ς2
](5)
where the mean μki and standard deviation ς are given,respectively, by
The corresponding cumulative distribution function (CDF),denoted by Γ(γki), has the expression
Γ(γki) = 1 − 12
erfc(
ln γki − μki
ς√
2
)= Q
(μki − ln γki
ς
)(7)
where erfc(x) is the complementary error function and Q(x)is the Gaussian Q-function. From (5) and (6), we see thatthe instantaneous C/I {γki} is a set of independent, non-identically distributed lognormal random variables. The means{μki} depend on the parameter η2 of fast Rayleigh fading,the transmitted signal power P , the interference level Ik + νand the mobile user location in the active region, while thevariances
{ς2}
depend on the standard deviation σ of thelognormal shadow fading.
The AMC technique is a fundamental feature in theWCDMA-HSDPA and CDMA-HDR networks. It allows tooptimize the modulation and coding formats adaptive to vari-ations in the channel conditions. Since each value of the user’smeasured C/I can be mapped directly into an instantaneousdata rate that such value can support for a given targeterror performance, the downlink WCDMA system can supportdynamic packet data rates through AMC. For example, in theCDMA-HDR system, for BS i and user k, the relationshipbetween the instantaneous data rate Rki and the C/I γki fordifferent modulation orders and coding rates is determined byusing a look-up mapping table [3, Table 2]. Mathematically,the linear relationship between the instantaneous data rate Rkiand the C/I γki can be formulated as [17], [23], [24]
Rki =W
(Eb/I0)kγki (8)
where (Eb/I0)k is the required bit energy-to-interference-plus-noise density ratio, whose value depends on modulationand coding formats, channel impairments such as fading, anderror performance requirements. For instance, in [3, Table 2]and [6, Table 1], with iterative decoding on serial concatenateddecoding and QPSK modulation, a 1-percent packet-error rate(PER) corresponds to (Eb/I0)k ≈ 2.5 dB at the lower datarates, ranging from 38.4 kb/s to 1228.8 kb/s. This impliesthat the supportable data rate is linearly proportional to C/Iover the wide region of lower data rates, which can be wellapproximated by (8). However, at the region of higher datarates such as 1843.2 kb/s and 2457.6 kb/s in [3, Table 2], inorder to achieve the 1-percent PER, the required (Eb/I0)kwill increase considerably because higher-order modulation(e.g., 8PSK and 16QAM) is more sensitive to fading andinterference. Therefore, in the case of AMC, the linear re-lationship (8) is not convenient to use, since we have tokeep adjusting the quantity (Eb/I0)k based on the modulationand coding formats. It is more desirable to find a simplemathematical function that can relate Rki directly to γki. Thiscan be done by using Shannon’s channel capacity formulawhere a logarithmic relationship is employed. We proceed firstwith using the logarithmic relation to approximate (8) with(Eb/I0)k ≈ 2.5 dB for a small value of C/I at the lowerdata rates.
At low signal-to-noise ratio (SNR), Shannon’s channelcapacity formula is approximated to [25]
C
W= log2(1 + SNR) =
ln(1 + SNR)ln2
≈ SNRln2
(9)
where the following relation has been used for low SNR
ln(1 + SNR) = SNR − 12
(SNR)2 +13
(SNR)3 · · ·
Authorized licensed use limited to: Sungkyunkwan University. Downloaded on February 27, 2009 at 05:02 from IEEE Xplore. Restrictions apply.
FU and KIM: SCHEDULING PERFORMANCE IN DOWNLINK WCDMA NETWORKS WITH AMC AND FAST CELL SELECTION 2583
−15 −10 −5 0 5 10 15 2010
1
102
103
104
105
C/I, γ (dB)
Dat
a R
ate,
R (
kb/s
)
Table 2 from [3]Eq.(8) with E
b/I
0=2.5 dB
Eq.(11) with α=0.4
Fig. 2. Linear and logarithmic relationships between the instantaneous datarate and the C/I .
Now we can approximate (8) by a function in a form analo-gous to (9), by defining
α =ln2
(Eb/I0)k=
ln2102.5/10
= 0.4. (10)
Using this and (9), we derive the following formula
Rki =W
(Eb/I0)kγki = W
αγkiln2
≈W log2 (1 + αγki) (11)
which gives a logarithmic relationship between the data rateRki and the C/I . To show the validity of (11), the data rateRki is plotted against the C/I , γki, in Fig. 2, by using (8)and (11) with system bandwidth W = 1.2288 MHz. As abasis for comparison, the look-up mapping table given in[3, Table 2] is also plotted. From Fig. 2, we see that forlow C/I at the region of lower rates, the mapping table[3, Table 2] can reasonably be approximated by both linearrelationship (8) and logarithmic relationship (11). However, inorder for (8) to be valid as C/I increases, we need to modify(Eb/I0)k to a larger value accordingly. In other words, thelinear relationship (8) can only provide good approximationbetween the instantaneous data rate and the C/I locally,whereas the logarithmic relationship (11) is more convenientto use and can be utilized for the reasonably accurate analysisglobally.
IV. FAST CELL SELECTION AND DOWNLINK SCHEDULING
FCS has been proposed for both WCDMA-HSDPA networkand CDMA-HDR network. Using FCS, each mobile user inthe active region can request data transmission from threeBS candidates of the active set S = {1, 2, 3}, but onlyselects the best BS which should serve it at any time. FCScan potentially increase the C/I , and thus, increase datatransmission rate. Therefore, FCS has become a key elementof downlink WCDMA networks that determines an overallsystem performance such as throughput [6], [7]. In practice,the user can continuously monitor all three BSs in the setS and report to the radio network controller (RNC) when achange of the best serving BS occurs. Determination of the
best BS may be based on the user’s C/I measurements. Ingeneral, FCS can be performed in the following procedure:
1) Measurements on each mobile user’s C/I from the threeBSs in the set S are made,
2) Based on the measurements of C/I , each mobile userin the active region selects the best serving BS,
3) Each mobile user then transmits a BS indicator (as tothe best serving BS) along with its measurement on C/Iusing the uplink dedicated control channel,
4) Each BS in the set S uses the C/I measurements todetermine scheduling priorities as well as the AMC levelfor a scheduled user via the scheduling algorithm used.
From the above procedure, we note that FCS is carried out forevery user in the active region before downlink scheduling isimplemented. After FCS each user is assigned to one and onlyone of the possible BSs S = {1, 2, 3}. Therefore, we canvisualize the FCS procedure as a partitioning of the wholeusers in the active region into disjoint groups, say {Gi}, i =1, 2, 3. Each group Gi comprises all users such that the BSi is the best serving BS. Once the groups have been formed,a scheduling scheme will be employed to each group Gi todecide which user in the group the data should be transmittedto. In the following, we will apply Poisson scheme [26] tostudy FCS.
Without loss of generality, we can choose BS 1 as the bestserving BS and form the group G1. The decision processgiven in steps 1) - 3) above can be modelled as a generalizedBernoulli trial, called the Possion scheme. This process issimilar to the coin tossing problem. Specifically, the FCSdecision for each of M mobile users can be viewed asperformingM random trials to decide which user in the activeregion will be served by BS 1 (i.e., in the group G1). Clearly,the outcomes of the M trials are independent. As a resultof the kth trial (k = 1, 2, . . . ,M), we can obtain the eventAk1, which indicates that user k is in the group G1, withprobability pk1, or the complementary Ak1, which indicatesthat user k is not served by BS 1, with probability 1 − pk1.Since the selection criterion for determining the best servingBS is based on the user’s C/I , the event Ak1 occurs if boththe C/I’s γk2 and γk3 are simultaneously below γk1. Hence,the probability pk1 is written as
pk1 = Pr[γk2 ≤ γk1, γk3 ≤ γk1
]. (12)
We can evaluate the probability pk1 in (12) by first condition-ing on knowing γk1. By averaging this conditional probabilityover the distribution of γk1, the final probability pk1 isobtained. Since {γki}3
i=1 are mutually independent randomvariables, the conditional probability is the product of theprobabilities that the quantities γk2 and γk3 are smaller thanγk1. Using (6) and (7) in (12), the final result is derived as
pk1 =1√
2πς2
∫ ∞
0
1xQ
(μk2 − lnx
ς
)Q
(μk3 − lnx
ς
)
× exp[− (lnx− μk1)2
2ς2
]dx. (13)
Note that unlike the coin-tossing Bernouli trial, the proba-bilities {pk1} of occurrence of the events {Ak1}Mk=1 in thegeneralized Bernoulli trials are distinct from one another.
Authorized licensed use limited to: Sungkyunkwan University. Downloaded on February 27, 2009 at 05:02 from IEEE Xplore. Restrictions apply.
2584 IEEE TRANSACTIONS ON WIRELESS COMMUNICATIONS, VOL. 7, NO. 7, JULY 2008
There are two possible events (Ak1 and the complementaryAk1) belonging to each user k, and M users in the activeregion; it follows that there are 2M distinct ways of assigningthe M users to G1, each of which stands for one of thepossible sequence of length M constructible from Ak1 andthe complementary Ak1. If we associate with every possiblesequence a probability Pl for l = 1, 2, . . . , 2M , we have
2M∑l=1
Pl = 1. (14)
As an example, suppose there are three users in the activeregion (i.e., M = 3), we have 23 = 8 distinct ways toassign the three users to G1. Table 1 gives all events andthe corresponding probabilities of G1. Clearly, in the case ofl = 1, where P1 = (1−p11)(1−p21)(1−p31), no user is servedby BS 1, while in the case of l = 8, where P8 = p11 p21 p31,all three users are served by BS 1.
Without loss of generality and for the purpose of notationalsimplicity, in the following analysis, we assume that after FCS,the users from 1 to K , where K < M , are in the group G1,and the rest of M −K users are served by either BS 2 or BS3. The probability of this assignment, denoted by P , is thusgiven by
P =K∏k=1
pk1
M∏k=K+1
(1 − pk1). (15)
Now, we have K users (k = 1, 2, . . . ,K) in G1. Thescheduling scheme in the abovementioned step 4) will thendecide which user in the group G1 is served by BS 1 with itsrequested data rate at any given time. The scheduling schemeis another key element that determines an overall systemperformance for downlink WCDMA networks. A detaileddiscussion on downlink scheduling is available in [2] - [7],[23], [24]. In the next section, we will study four downlinkscheduling schemes, namely, the RR, maximum C/I , simpli-fied PF and conventional PF, and derive their throughput andfairness expressions for BS 1 with partitioning group G1 andcorresponding probability assignment P .
V. THROUGHPUT AND FAIRNESS PERFORMANCE
We note that after FCS, the events {Ak1}Kk=1 occur. Thus,given Ak1 (k = 1, 2, . . . ,K), the density function of γk1in group G1 has changed from f(γk1) given by (5) to thefollowing conditional pdf
fc(γk1) = f(γk1|Ak1
)= f
(γk1|γk2 ≤ γk1, γk3 ≤ γk1
).(16)
Using the mixed form of Bayes rule [27, eq. (2.103a)] in (16),we have
fc(γk1) =Pr[γk2 ≤ γk1, γk3 ≤ γk1| γk1
]Pr[γk2 ≤ γk1, γk3 ≤ γk1
] f(γk1) (17)
which leads to, after manipulation and simplification
fc(γk1) =βk1γk1
Q
(μk2 − lnγk1
ς
)Q
(μk3 − lnγk1
ς
)
× exp[− (lnγk1 − μk1)2
2ς2
](18)
0 0.1 0.2 0.3 0.4 0.5 0.6 0.7 0.8 0.9 110
−3
10−2
10−1
100
101
102
103
γk1
pdf
0 0.1 0.2 0.3 0.4 0.5 0.6 0.7 0.8 0.9 110
−3
10−2
10−1
100
101
102
103
γk1
pdf
fc(γ
k1) with mean C/I=−5 dB
f(γk1
) with mean C/I=−5 dB
fc(γ
k1) with mean C/I=−10 dB
f(γk1
) with mean C/I=−10 dB
Fig. 3. The probability density functions (pdf’s) of C/I with and withoutFCS.
where βk1 is a constant quantity whose inverse value is givenby
1/βk1 =
∫ ∞
0
1xQ
(μk2 − lnx
ς
)Q
(μk3 − lnx
ς
)
× exp[− (lnx− μk1)2
2ς2
]dx.
In Fig. 3, we plot the pdf’s f(γk1) and fc(γk1) when a useris at the center of the active region for η2 = 1 and σ = 8(dB), with the mean C/I as the parameter. We can see thatfor a fixed mean C/I , FCS can help increase the probabilityPr[γk1 > γ0
], where γ0 > 0 is some critical value. This
implies that FCS can bring a statistical reduction of fadingdip for the instantaneous C/I .
Following [3], the throughput is defined as the average datarate which is equal to the number of data bits divided by thetotal transmission time. We use Rk1 bits/s (k = 1, 2, . . . ,K) todenote the instantaneous data rate for user k in G1 to receivedata from BS 1, and Sk1 to denote the corresponding systemaccess probability. The throughput is then expressed by
Λ =K∑k=1
Rk1Sk1 bits/s. (19)
Note that, in (19) the quantities Rk1 and Sk1 are deterministicvariables. If they are random variables, the throughput expres-sion should be defined by Λ = E
[∑Kk=1Rk1Sk1
], where E
denotes the expectation.The fairness metric can be defined in two forms. The first
form is defined in terms of the average data rate achieved byeach user, which is given by [28], [29, eq. (33)]
F =
(∑Kk=1 E
[Rk1Sk1
])2
K∑K
k=1
(E[Rk1Sk1
])2 =Λ2
K∑K
k=1
(E[Rk1Sk1
])2 .
(20)This definition has been used in the CDMA-HDR system [4],[6] to evaluate the PF scheme. The second definition of the
Authorized licensed use limited to: Sungkyunkwan University. Downloaded on February 27, 2009 at 05:02 from IEEE Xplore. Restrictions apply.
FU and KIM: SCHEDULING PERFORMANCE IN DOWNLINK WCDMA NETWORKS WITH AMC AND FAST CELL SELECTION 2585
TABLE IEVENT AND PROBABILITY ASSIGNMENT IN G1 FOR M = 3
Index l Event Probability Pl Pl value for scenario 6
1 A11A21A31 (1 − p11)(1 − p21)(1 − p31) 0.2964
2 A11A21A31 p11(1 − p21)(1 − p31) 0.1481
3 A11A21A31 (1 − p11)p21(1 − p31) 0.1481
4 A11A21A31 (1 − p11)(1 − p21)p31 0.1481
5 A11A21A31 p11p21(1 − p31) 0.0741
6 A11A21A31 (1 − p11)p21p31 0.0741
7 A11A21A31 p11(1 − p21)p31 0.0741
8 A11A21A31 p11p21p31 0.0370
fairness metric is based on the system access probability foreach user, which is [24]
F ′ =
(∑Kk=1 Sk1
)2
K∑Kk=1 S
2k1
=
(K
K∑k=1
S2k1
)−1
. (21)
This definition has been used in the WCDMA-HSDPA system[5], [7] to initially study the RR and maximum C/I schemes.In this paper we will evaluate both F and F ′. However, weshould stress that a fair scheduling scheme in terms of F maybecome unfair if F ′ is used, and vice versa. The values of Fand F ′ range from 1/K to 1. The value of 1 corresponds to atotally fair allocation (with equal average data rate or accessprobability for all users). A totally unfair allocation (with fullaverage data rate or chance of system access given to onlyone user) has a fairness of 1/K .
A. Throughput and fairness of Round Robin scheme
In the RR scheme, at any scheduling instant, the users areserviced in a round-robin fashion, i.e., the K data slots areassigned one at a time successively for each user, and all usersmust be serviced before reservicing a user. Thus, the systemaccess probability is 1/K for all users (i.e., Sk1 = 1/K). Thethroughput can be expressed by
ΛRR = E
[K∑k=1
1KRk1
]=
1K
K∑k=1
∫ ∞
0
Rk1fc(γk1) dγk1
(22)where Rk1 and fc(γk1) are from (11) and (18), respectively.Substituting (11) and (18) into (22) yields
ΛRR =1K
K∑k=1
∫ ∞
0
Wβk1 log2
(1 + αx
)x
Q
(μk2 − lnx
ς
)
×Q(μk3 − lnx
ς
)exp
[− (lnx− μk1)2
2ς2
]dx (23)
which can be computed numerically. The fairness F in termsof the average data rate can be evaluated as (24) shown atthe top of next page. Clearly, in terms of the system accessprobability, we have F ′
RR = 1, which states that the RRscheme is a totally fair allocation scheme.
B. Throughput and fairness of maximum C/I scheme
In the maximum C/I scheme, at any scheduling instant, allusers are ranked based on their C/I and then the packet data
is transmitted to the user that experiences the largest C/I .Conditioning on γk1, the access probability to BS 1 for userk would be the probability that each of γj1 (j = 1, 2, . . . ,Kand j �= k) is simultaneously smaller than γk1. Since {γj1} isa set of independent random variables, this access probabilitywill be the product of the independent probabilities that eachγj1 < γk1 for j �= k. Thus, the throughput for the maximumC/I scheme can be evaluated as
ΛC/I = E
{K∑k=1
Rk1Pr[
maxj �=k
{γj1} ≤ γk1
]}
=K∑k=1
∫ ∞
0
Rk1Pr[
maxj �=k
{γj1} ≤ γk1
]fc(γk1) dγk1
=K∑k=1
∫ ∞
0
Wβk1 log2
(1 + αx
)x
Q
(μk2 − lnx
ς
)
×Q(μk3 − lnx
ς
)exp
[− (lnx− μk1)2
2ς2
]
×{
K∏j=1j �=k
∫ x
0
βj1γj1
Q
(μj2 − lnγj1
ς
)Q
(μj3 − lnγj1
ς
)
× exp[− (lnγj1 − μj1)2
2ς2
]dγj1
}dx (25)
which can be computed numerically.Since the system access probability for user k is given by
SC/Ik1 =
∫ ∞
0
Pr
[maxj �=k
{γj1} ≤ γk1
]fc(γk1) dγk1 =∫ ∞
0
βk1
xQ
(μk2 − lnx
ς
)Q
(μk3 − lnx
ς
)exp
[−(lnx − μk1)2
2ς2
]
×{
K∏j=1j �=k
∫ x
0
βj1
γj1Q
(μj2 − lnγj1
ς
)Q
(μj3 − lnγj1
ς
)
× exp
[− (lnγj1 − μj1)
2
2ς2
]dγj1
}dx, (26)
the fairness metric F ′C/I is evaluated as
F ′C/I =
[K
K∑k=1
(SC/Ik1
)2]−1
. (27)
In terms of the average data rate, the fairness metric FC/I isexpressed by (28) shown at the top of next page. As the servedusers are the ones with the best channels in the maximum C/I
Authorized licensed use limited to: Sungkyunkwan University. Downloaded on February 27, 2009 at 05:02 from IEEE Xplore. Restrictions apply.
2586 IEEE TRANSACTIONS ON WIRELESS COMMUNICATIONS, VOL. 7, NO. 7, JULY 2008
scheme, we expect that ΛC/I will yield the highest throughput,whereas the values of F ′
C/I and FC/I will decrease as thenumber of users K increases since the users with poor channelconditions have little chance to access the system.
C. Throughput and fairness of proportional fair scheme
The PF scheme provides a compromise between the RR andmaximum C/I schemes. Thus, we expect that it can offera good trade-off between the throughput and fairness. ThePF scheduler has already been proposed and implemented forscheduling in real networks, such us Qualcomm’s 1xEVolutionsystem [6]. The basic feature of this scheduler is that in eachtransmission slot the packet data is only transmitted to theuser that experiences the largest ratio of the instantaneousachievable data rate to the average served data rate. In otherwords, the criterion for scheduling a user is based on the user’srelative data rate. Note that if the linear relationship (8) isused, the selection criterion based on the relative data ratewill be equivalent to that based on the relative C/I , definedas the instantaneous-C/I-to-mean-C/I ratio. This is becausein the case of the linear relationship (8), we have the relation
Rk1
E[Rk1
] =
[W
(Eb/I0)k1γk1
]E[
W(Eb/I0)k1
γk1
] =γk1
E[γk1] .
However, if the logarithmic relationship (11) is used, the rela-tive data rate criterion differs from the relative C/I criterion.In other words, the relative C/I criterion is less valid whenhigher-order modulation and coding are used. A simplifiedversion of the PF scheme is proposed in [23], where the userwith the highest priority in a transmission slot is determinedby the ratio of the instantaneous C/I to the average data rate.We define the instantaneous-C/I-to-mean-data-rate ratio δk1as
δk1 =γk1Rk1
(29)
where Rk1 denotes the average data rate.We first derive the throughput and fairness expressions for
the simplified PF scheme. The procedure is parallel to thatfollowed in the case of the maximum C/I scheme. Using(11) and (18), the average data rate Rk1 can be evaluated as
Rk1 =∫ ∞
0
Wβk1 log2
(1 + αx
)x
Q
(μk2 − lnx
ς
)(30)
×Q(μk3 − lnx
ς
)exp
[− (lnx− μk1)2
2ς2
]dx.
Since δk1 is a linear transformation of γk1 by the constant1/Rk1, the PDF of δk1 can be derived as [30]
fc(δk1) =βk1δk1
Q
(μk2 − lnδk1 − lnRk1
ς
)
×Q(μk3 − lnδk1 − lnRk1
ς
)(31)
× exp[− (lnδk1 + lnRk1 − μk1)2
2ς2
].
We note that {δk1}Kk=1 is a set of independent ran-dom variables. Hence, conditioning on δk1, the sys-tem access probability of user k is the product ofthe independent probabilities that each δj1 < δk1 forj �= k. The instantaneous data rate Rk1 is now givenby Rk1 = W log2(1 + αγk1) = W log2(1 + αRk1δk1). Thus,the throughput for the simplified PF scheme can be evaluatedas
ΛSPF = E
{K∑
k=1
Rk1Pr
[maxj �=k
{δj1} ≤ δk1
]}
=K∑
k=1
∫ ∞
0
Rk1Pr
[maxj �=k
{δj1} ≤ δk1
]fc(δk1) dδk1 = W
×K∑
k=1
∫ ∞
0
Q
(μk2 − lnx − lnRk1
ς
)Q
(μk3 − lnx − lnRk1
ς
)
× exp
[− (lnx + lnRk1 − μk1)
2
2ς2
]βk1 log2
(1 + αRk1x
)x
×{
K∏j=1j �=k
∫ x
0
βj1
δj1Q
(μj2 − lnδj1 − lnRj1
ς
)
×Q
(μj3 − lnδj1 − lnRj1
ς
)
× exp
[− (lnδj1 + lnRj1 − μj1)
2
2ς2
]dδj1
}dx. (32)
Since the system access probability of user k is now given
Authorized licensed use limited to: Sungkyunkwan University. Downloaded on February 27, 2009 at 05:02 from IEEE Xplore. Restrictions apply.
FU and KIM: SCHEDULING PERFORMANCE IN DOWNLINK WCDMA NETWORKS WITH AMC AND FAST CELL SELECTION 2587
by
SSPFk1 =∫ ∞
0
Pr[maxj �=k
{δj1} ≤ δk1
]fc(δk1) dδk1
=∫ ∞
0
Q
(μk2 − lnx− lnRk1
ς
)Q
(μk3 − lnx− lnRk1
ς
)
× exp[− (lnx+ lnRk1 − μk1)2
2ς2
]{ K∏j=1j �=k
∫ x
0
βj1δj1
×Q(μj2 − lnδj1 − lnRj1
ς
)Q
(μj3 − lnδj1 − lnRj1
ς
)
× exp[− (lnδj1 + lnRj1 − μj1)2
2ς2
]dδj1
}βk1x
dx. (33)
the fairness metric F ′SPF for the simplified PF scheme can be
evaluated as
F ′SPF =
[K
K∑k=1
(SSPFk1
)2]−1
. (34)
In terms of the average data rate, the fairness metric FSPFis expressed by (35) shown at the top of next page. Wenote that in the simplified PF scheme, the value of δk1 ismonitored by the average data rate Rk1. Thus, we expect thatF ′SPF and FSPF are larger than F ′
C/I and FC/I , respectively.Intuitively, this is due to the fact that the user with poorerchannel condition will get the relative C/I increased by thelower Rk1. This will assure fairness in terms of both F ′
SPF andFSPF . Also note that the average data rate Rk1 in (31) onlyrepresents the initial monitoring constant. Once the throughputΛkSPF for the k user is obtained by (32), Rk1 can be updatedrecursively using the algorithm proposed in [4], i.e., at timeslot t, we have
Rk1(t+ 1) = (1 − 1/tc)Rk1(t) + ΛkSPF /tc
where tc is a time window and ΛkSPF is the current throughputfor user k.
Next, we consider the throughput and fairness analysisfor the conventional PF scheme in which the throughputmonitoring is based on the user’s relative data rate, ζk1, whichis defined by
ζk1 =Rk1Rk1
=W
Rk1log2
(1 + αγk1
)(36)
where Rk1 is given by (30). Since the logarithm is a monotonicfunction, scheduling based on ζk1 given by (36) is akin tothat based on δk1 given by (29) − both assure fairness. Since{γk1}Kk=1 are independent, the random variables {ζk1}Kk=1 in(36) are also independent. Conditioning on ζk1, the systemaccess probability for user k is the product of the indepen-dent probabilities that each ζj1 < ζk1 for j �= k, namely
Pr[maxj �=k{ζj1} ≤ ζk1
], or equivalently,
Φ(γk1)=Pr
[γ11 ≤ (1 + αγk1)R11/Rk1 − 1
α, . . . ,
γ(k−1)1 ≤ (1 + αγk1)R(k−1)1/Rk1 − 1α
,
γ(k+1)1 ≤ (1 + αγk1)R(k+1)1/Rk1 − 1α
, . . . ,
γK1 ≤ (1 + αγk1)RK1/Rk1 − 1α
], (37)
which yields the solution as
Φ(γk1) =K∏
j=1j �=k
∫ (1+αγk1)Rj1/Rk1−1α
0
βj1γj1
Q
(μj2 − lnγj1
ς
)
×Q(μj3 − lnγj1
ς
)exp
[− (lnγj1 − μj1)2
2ς2
]dγj1. (38)
Hence, the throughput for the conventional PF scheme isevaluated as
ΛPF =K∑k=1
∫ ∞
0
Wβk1 log2
(1 + αγk1
)γk1
Q
(μk2 − lnγk1
ς
)
×Q(μk3 − lnγk1
ς
)Φ(γk1) exp
[− (lnγk1 − μk1)2
2ς2
]dγk1.(39)
The system access probability of user k is given by
SPFk1 =∫ ∞
0
Φ(γk1)fc(γk1)dγk1
=∫ ∞
0
βk1γk1
Q
(μk2 − lnγk1
ς
)Q
(μk3 − lnγk1
ς
)
×Φ(γk1) exp[− (lnγk1 − μk1)2
2ς2
]dγk1. (40)
Thus, the fairness metric F ′PF for the conventional PF scheme
is obtained as
F ′PF =
[K
K∑k=1
(SPFk1
)2]−1
. (41)
In terms of the average data rate, the fairness metric FPF isexpressed by
FPF =Λ2PF /K
K∑k=1
[∫ ∞
0
W log2
(1 + αγk1
)Φ(γk1)fc(γk1) dγk1
]2 .(42)
D. Ensemble average throughput
In Sections V.A - C, we have derived the throughputexpressions of four scheduling schemes for the serving BS1, assuming a specific partitioning group G1 with probabilityassignment P given by (15). Since there are 2M distinctways of assigning the M users to G1, the ensemble averagethroughput for BS 1 will be the sum of each throughputweighted by the corresponding probability of assignment. LetΛl denote the throughput for the lth assignment due to the RRscheme given by (23), or the maximum C/I scheme given
Authorized licensed use limited to: Sungkyunkwan University. Downloaded on February 27, 2009 at 05:02 from IEEE Xplore. Restrictions apply.
2588 IEEE TRANSACTIONS ON WIRELESS COMMUNICATIONS, VOL. 7, NO. 7, JULY 2008
by (25), or the simplified PF scheme given by (32), or theconventional PF scheme given by (39). Then, the ensembleaverage throughput for BS 1 can be expressed by
Λav =2M∑l=1
ΛlPl (43)
where Pl is the corresponding probability assignment and {Pl}is subject to the constraint given by (14). Clearly, in the casethat no user is served by BS 1 (e.g., l = 1 in Table 1), wehave Λl = 0, and in the case that only one user is served byBS 1 (e.g., l = 2, 3, or 4 in Table 1), the throughputs Λl areequal for all four scheduling schemes.
E. Peak data throughput
The result (43) gives the ensemble average data rate for BS1, which is also applicable to BS 2 and BS 3 by symmetry.Thus, it provides the average data throughput in the activeregion shown in Fig. 1. For comparison, in this subsection wewill also derive the peak data throughput in the active region.The peak data throughput is defined as the highest data ratethat can be supported at any instant. From (11), we see thatthis can be achieved by the maximum received C/I , and hencethe peak data throughput, denoted by Rmax, is formulated as
Rmax =∫ ∞
0
W log2
(1 + αγmax
)f(γmax) dγmax (44)
where γmax represents the maximum received C/I in theactive region. Note that, the definition of the peak datathroughput in (44) follows the idea of estimating the channelcapacity in Rayleigh fading environment presented in [31],which is not an absolute maximum value, but calculated in anaverage sense. This is because the γmax is a random variablethat varies in time.
For a fixed user k, the maximum received C/I fromthe BS set S due to FCS, denoted by γkmax, is given byγkmax = max
{γk1, γk2, γk3
}; γmax will then be the largest
random variable among{γkmax
}Mk=1
of all users, namely,γmax = max
k{γkmax}, or equivalently,
γmax = maxk,i
{γki}
k = 1, 2, · · · ,M ; i = 1, 2, 3. (45)
The CDF of γmax is the probability that the γki in all3M quantities are simultaneously less than or equal to somespecified value. In view of (7), the CDF of γmax is shown tobe
Γ(γmax) =M∏k=1
3∏i=1
Q
(μki − lnγmax
ς
). (46)
This is the distribution of the maximum received C/I in theactive region, selected from 3M quantities of three BSs and
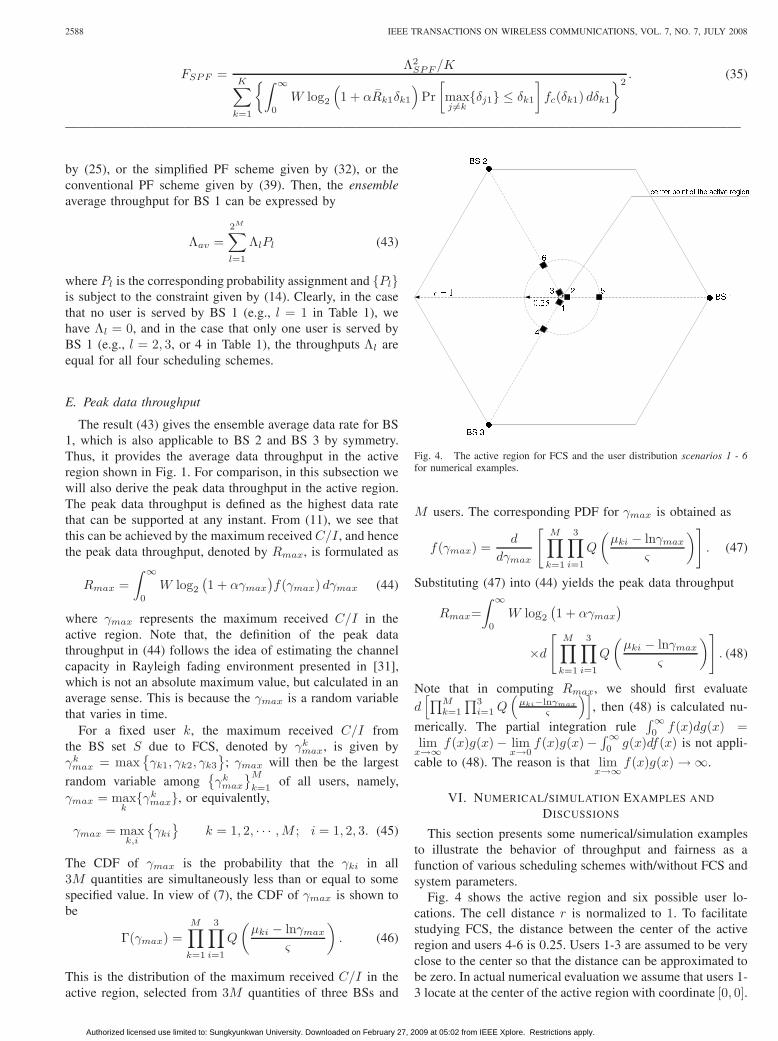
Fig. 4. The active region for FCS and the user distribution scenarios 1 - 6for numerical examples.
M users. The corresponding PDF for γmax is obtained as
f(γmax) =d
dγmax
[M∏k=1
3∏i=1
Q
(μki − lnγmax
ς
)]. (47)
Substituting (47) into (44) yields the peak data throughput
Rmax=∫ ∞
0
W log2
(1 + αγmax
)
×d[M∏k=1
3∏i=1
Q
(μki − lnγmax
ς
)]. (48)
Note that in computing Rmax, we should first evaluated[∏M
k=1
∏3i=1Q
(μki−lnγmax
ς
)], then (48) is calculated nu-
merically. The partial integration rule∫∞0 f(x)dg(x) =
limx→∞ f(x)g(x) − lim
x→0f(x)g(x) − ∫∞
0 g(x)df(x) is not appli-
cable to (48). The reason is that limx→∞ f(x)g(x) → ∞.
VI. NUMERICAL/SIMULATION EXAMPLES AND
DISCUSSIONS
This section presents some numerical/simulation examplesto illustrate the behavior of throughput and fairness as afunction of various scheduling schemes with/without FCS andsystem parameters.
Fig. 4 shows the active region and six possible user lo-cations. The cell distance r is normalized to 1. To facilitatestudying FCS, the distance between the center of the activeregion and users 4-6 is 0.25. Users 1-3 are assumed to be veryclose to the center so that the distance can be approximated tobe zero. In actual numerical evaluation we assume that users 1-3 locate at the center of the active region with coordinate [0, 0].
Authorized licensed use limited to: Sungkyunkwan University. Downloaded on February 27, 2009 at 05:02 from IEEE Xplore. Restrictions apply.
FU and KIM: SCHEDULING PERFORMANCE IN DOWNLINK WCDMA NETWORKS WITH AMC AND FAST CELL SELECTION 2589
0.05 0.1 0.15 0.2 0.25 0.3 0.35 0.4 0.450.5
1
1.5
2
α
Thr
ough
put g
ain
scenario 2
scenario 4
scenario 5
scenario 1
scenario 3
Fig. 5. Throughput gain versus α with Round Robin scheme.
We further assume that the bandwidth W , average envelopepower η2, and standard deviation σ (dB) are set to 3.84 MHz,1 and 8, respectively. Clearly, without FCS, only users 1, 2,3 and 5 can connect to BS 1. With FCS, there are 26 = 64distinct ways of assigning six users to G1 to be served byBS 1. We consider five scenarios in which only two users areconnected to BS 1, namely, senario 1: users 2 and 5 withoutFCS; scenario 2: users 2 and 5 with FCS; scenario 3: users1 and 2 without FCS; scenario 4: users 1 and 2 with FCS;and scenario 5: users 4 and 5 with FCS. This is sufficient toillustrate our discussions.
Fig. 5 plots the normalized throughput gains for the RRscheme against the parameter α. Specifically, we first computethe throughputs of the abovementioned five scenarios withRR scheme. The throughput gains are then evaluated bynormalizing each throughput with that of scenario 1. Recallfrom (10) that the parameter α is equivalent to (Eb/I0)k,which is required to achieve a certain PER performance. Inour numerical evaluation the value of α is assumed to be 0.1,0.2, 0.3 and 0.4, which corresponds to (Eb/I0)k = 8.4 dB, 5.4dB, 3.6 dB and 2.5 dB, respectively. It can be seen that FCScan substantially improve the throughput performance. Forexample, for α = 0.1, the throughput gain of scenario 2 (users2 and 5 with FCS) over scenario 1 (users 2 and 5 without FCS)is 1.85. Without FCS, the throughput of scenario 3 (users 1and 2 without FCS) is below the baseline (scenario 1). Thegain is approximately 0.7. With FCS this gain is increasedapproximately to 1.6 in scenario 4 (users 1 and 2 with FCS).The improvement is up to about 1.6/0.7 = 2.3. In order tovalidate the analysis, computer simulation results have alsobeen included in Fig. 5 and the subsequent Figs. 6 - 9. Thesimulation results are shown as the dotted lines in the figure.From the plots in Figs. 5 - 9 we see that the simulation resultsconfirm the feasibility of the theoretical analysis.
Figs. 6, 7 and 8 show the throughput comparisons of RR,maximum C/I , simplified PF and conventional PF with FCSfor scenario 2, scenario 5 and scenario 4, respectively. Besidesthe throughput of BS 1, the average data rate of each useris also given. For example, for scenario 2 in Fig. 6, curves
0.05 0.1 0.15 0.2 0.25 0.3 0.35 0.4 0.45
0.6
0.7
0.8
0.9
1
1.1
1.2
1.3
1.4
1.5
1.6
α
Thr
ough
put G
ain
(a) maximum C/I; (b) simplified PF; (c) conventional PF(d) Round Robin; (e) user 5 with maximum C/I(f) user 5 with simplified PF; (g) user 5 with conventional PF(h) user 2 with conventional PF; (i) user 2 with simplified PF(j) user 2 with maximum C/I
abc
d
efg
hij
Fig. 6. Throughput performance comparison for scenario 2.
0.05 0.1 0.15 0.2 0.25 0.3 0.35 0.4 0.45
0.6
0.8
1
1.2
1.4
1.6
α
Thr
ough
put G
ain
(a) maximum C/I; (b) simplified PF; (c) conventional PF(d) Round Robin; (e) user 5 with maximum C/I(f) user 5 with simplified PF; (g) user 5 with conventional PF(h) user 4 with conventional PF; (i) user 4 with simplified PF(j) user 4 with maximum C/I
abc
d
e
fg
hij
Fig. 7. Throughput performance comparison for scenario 5.
a-d represent the throughput gain of BS 1, while curves e-jrepresent the average data rate gain of users 2 and 5. Withoutloss of generality, in Figs. 6 - 8, we have chosen the throughputof BS 1 with RR scheme as a baseline.
From these three figures, several conclusions can be drawn.First, the RR scheme gives the worst performance of the fourschemes examined in this paper. This is expected since theRR scheme does not take into account the channel conditionsamong the users. Hence, although FCS can help prevent theusers with deep fade due to small-scale Rayleigh fading andlarge-scale lognormal fading from connecting to BS 1, thethroughput descreases when the fixed time slot allocation inthe RR scheme is made to the user with small C/I . Second,the throughput performance depends on the users’ location.In Fig. 8, the maximum C/I , simplified PF and conventionalPF schemes have the same throughput gain for scenario 4,while in Figs. 6 and 7 for scenario 2 and scenario 5, themaximum C/I scheme provides the best performance andthe simplified PF scheme outperforms the conventional PFscheme. Moreover, we see that as the users’ location differenceincreases, the performance gap between the individual users
Authorized licensed use limited to: Sungkyunkwan University. Downloaded on February 27, 2009 at 05:02 from IEEE Xplore. Restrictions apply.
2590 IEEE TRANSACTIONS ON WIRELESS COMMUNICATIONS, VOL. 7, NO. 7, JULY 2008
0.05 0.1 0.15 0.2 0.25 0.3 0.35 0.4 0.450.6
0.7
0.8
0.9
1
1.1
1.2
1.3
1.4
1.5
1.6
α
Thr
ough
put G
ain
Round Robinmaximum C/Isimplified PFconventional PFuser 1 or 2 with maximum C/Iuser1 or 2 with simplified PFuser 1 or 2 with conventional PF
Fig. 8. Throughput performance comparison for scenario 4.
0.05 0.1 0.15 0.2 0.25 0.3 0.35 0.4 0.45
1
1.5
2
2.5
3
3.5
4
4.5
5
α
Thr
ough
put G
ain
throughput without FCSensemble average throughput with Round Robin and FCSensemble average throughput with maximum C/I, simplifiedPF and conventional PF and FCSpeak data throughput
Fig. 9. Comparison of the ensemble average throughput and the peak datathroughput for scenario 6.
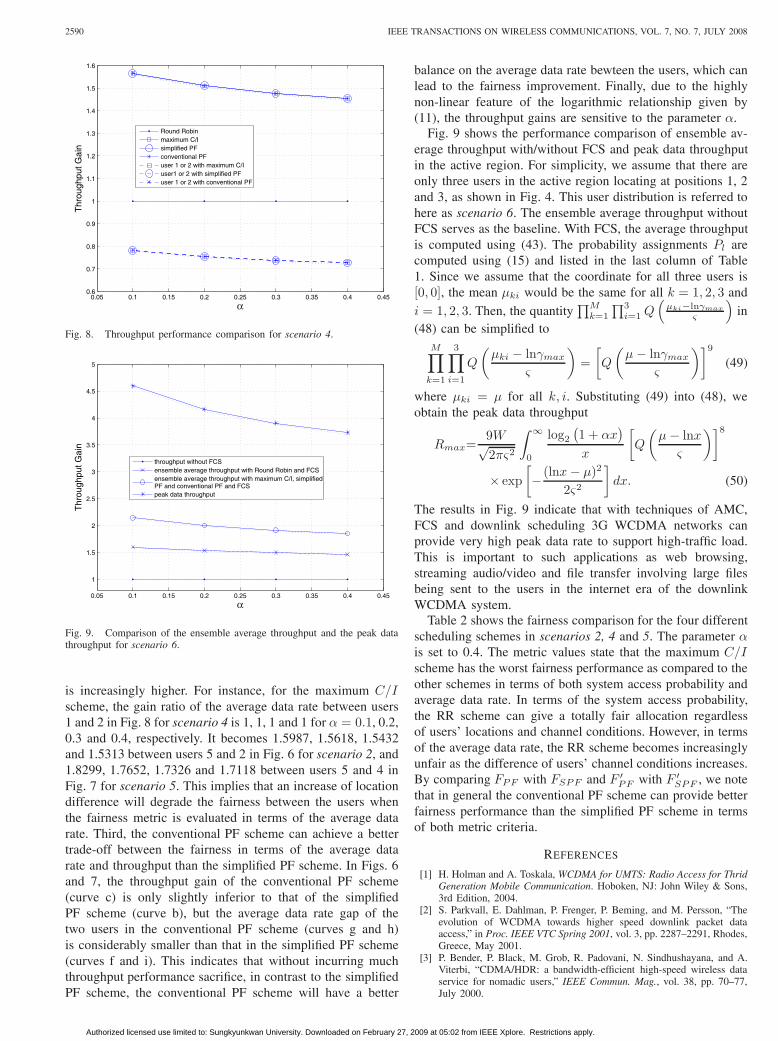
is increasingly higher. For instance, for the maximum C/Ischeme, the gain ratio of the average data rate between users1 and 2 in Fig. 8 for scenario 4 is 1, 1, 1 and 1 for α = 0.1, 0.2,0.3 and 0.4, respectively. It becomes 1.5987, 1.5618, 1.5432and 1.5313 between users 5 and 2 in Fig. 6 for scenario 2, and1.8299, 1.7652, 1.7326 and 1.7118 between users 5 and 4 inFig. 7 for scenario 5. This implies that an increase of locationdifference will degrade the fairness between the users whenthe fairness metric is evaluated in terms of the average datarate. Third, the conventional PF scheme can achieve a bettertrade-off between the fairness in terms of the average datarate and throughput than the simplified PF scheme. In Figs. 6and 7, the throughput gain of the conventional PF scheme(curve c) is only slightly inferior to that of the simplifiedPF scheme (curve b), but the average data rate gap of thetwo users in the conventional PF scheme (curves g and h)is considerably smaller than that in the simplified PF scheme(curves f and i). This indicates that without incurring muchthroughput performance sacrifice, in contrast to the simplifiedPF scheme, the conventional PF scheme will have a better
balance on the average data rate bewteen the users, which canlead to the fairness improvement. Finally, due to the highlynon-linear feature of the logarithmic relationship given by(11), the throughput gains are sensitive to the parameter α.
Fig. 9 shows the performance comparison of ensemble av-erage throughput with/without FCS and peak data throughputin the active region. For simplicity, we assume that there areonly three users in the active region locating at positions 1, 2and 3, as shown in Fig. 4. This user distribution is referred tohere as scenario 6. The ensemble average throughput withoutFCS serves as the baseline. With FCS, the average throughputis computed using (43). The probability assignments Pl arecomputed using (15) and listed in the last column of Table1. Since we assume that the coordinate for all three users is[0, 0], the mean μki would be the same for all k = 1, 2, 3 and
i = 1, 2, 3. Then, the quantity∏Mk=1
∏3i=1Q
(μki−lnγmax
ς
)in
(48) can be simplified toM∏k=1
3∏i=1
Q
(μki − lnγmax
ς
)=[Q
(μ− lnγmax
ς
)]9(49)
where μki = μ for all k, i. Substituting (49) into (48), weobtain the peak data throughput
Rmax=9W√2πς2
∫ ∞
0
log2
(1 + αx
)x
[Q
(μ− lnx
ς
)]8
× exp[− (lnx− μ)2
2ς2
]dx. (50)
The results in Fig. 9 indicate that with techniques of AMC,FCS and downlink scheduling 3G WCDMA networks canprovide very high peak data rate to support high-traffic load.This is important to such applications as web browsing,streaming audio/video and file transfer involving large filesbeing sent to the users in the internet era of the downlinkWCDMA system.
Table 2 shows the fairness comparison for the four differentscheduling schemes in scenarios 2, 4 and 5. The parameter αis set to 0.4. The metric values state that the maximum C/Ischeme has the worst fairness performance as compared to theother schemes in terms of both system access probability andaverage data rate. In terms of the system access probability,the RR scheme can give a totally fair allocation regardlessof users’ locations and channel conditions. However, in termsof the average data rate, the RR scheme becomes increasinglyunfair as the difference of users’ channel conditions increases.By comparing FPF with FSPF and F ′
PF with F ′SPF , we note
that in general the conventional PF scheme can provide betterfairness performance than the simplified PF scheme in termsof both metric criteria.
REFERENCES
[1] H. Holman and A. Toskala, WCDMA for UMTS: Radio Access for ThridGeneration Mobile Communication. Hoboken, NJ: John Wiley & Sons,3rd Edition, 2004.
[2] S. Parkvall, E. Dahlman, P. Frenger, P. Beming, and M. Persson, “Theevolution of WCDMA towards higher speed downlink packet dataaccess,” in Proc. IEEE VTC Spring 2001, vol. 3, pp. 2287–2291, Rhodes,Greece, May 2001.
[3] P. Bender, P. Black, M. Grob, R. Padovani, N. Sindhushayana, and A.Viterbi, “CDMA/HDR: a bandwidth-efficient high-speed wireless dataservice for nomadic users,” IEEE Commun. Mag., vol. 38, pp. 70–77,July 2000.
Authorized licensed use limited to: Sungkyunkwan University. Downloaded on February 27, 2009 at 05:02 from IEEE Xplore. Restrictions apply.
FU and KIM: SCHEDULING PERFORMANCE IN DOWNLINK WCDMA NETWORKS WITH AMC AND FAST CELL SELECTION 2591
[4] A. Jalali, R. Padovani, and R. Pankaj, “Data throughput of CDMA-HDR a high efficiency-high data rate personal communication wirelesssystem,” in Proc. IEEE VTC Spring 2000, vol. 3, pp. 1854–1858, Tokyo,May 2000.
[5] 3GPP Technical Specification, “Physical layer aspects of UTRA highspeed downlink packet access,” 3GPP TR 25.848 v4.0.0, Mar. 2001.
[7] Qualcomm, Inc., “HSDPA for improved downlink data transfer,” Qual-comm CDMA Technologies White Paper, Oct. 2004.
[8] S. Benedetto et al, “MHOMS: high-speed ACM modem for satelliteapplications,” IEEE Wireless Commun. Mag., vol. 12, pp. 66–77, Apr.2005.
[9] J. Yang, A. K. Khandani and N. Tin, “Statistical decision making inadaptive modulation and coding for 3G wireless systems,” IEEE Trans.Veh. Technol., vol. 54, pp. 2066–2073, Nov. 2005.
[10] H. Furukawa, K. Hamabe, and A. Ushirokawa, “SSDT − site selectiondiversity transmission power control for CDMA forward link,” IEEE J.Select. Areas Commun., vol. 18, pp. 1546–1554, Aug. 2000.
[11] A. Das et al, “Network controlled cell selection for the high speeddownlink packet access in UMTS,” in Proc. IEEE WCNC 2004, vol. 4,pp. 1975–1979, Mar. 2004.
[12] A. Sang, X. D. Wang, M. Madihian, and R. D. Gitlin, “A flexibledownlink scheduling scheme in cellular packet data systems,” IEEETrans. Wireless Commun., vol. 5, pp. 568–577, Mar. 2006.
[13] E. Lim and S. Kim, “Transmission rate scheduling with fairnessconstraints in downlink of CDMA data networks,” IEEE Trans. Veh.Technol., vol. 54, pp. 328–337, Jan. 2005.
[14] R. Kwan and C. Leung, “Downlink scheduling optimization in CDMAnetworks,” IEEE Commun. Lett., vol. 8, pp. 611–613, Oct. 2004.
[15] M. A. Haleem and R. Chandramouli, “Adaptive downlink schedulingand rate selection: a cross-layer design,” IEEE J. Select. Areas Commun.,vol. 23, pp. 1287–1297, June 2005.
[16] S. Y. Kim and H. M. Baek, “On the economic aspects of downlinkscheduling in DS-CDMA systems: base-station density perspective,”IEEE Trans. Veh. Technol., vol. 55, pp. 1594–1602, Sept. 2006.
[17] A. J. Viterbi, CDMA: Principles of Spread Spectrum Communications.Addison Wesley, 1995.
[18] 3GPP Technical Specification, “Stage 2 functional specification of userequipment (UE) positioning in UTRAN (Release 7),” 3GPP TS 25.305version 7.3.0, June 2006.
[19] 3GPP Technical Specification, “Location services (LCS), service de-scription, stage 1,” 3G TS 22.071 version 7.4.0, Dec. 2005.
[20] K. S. Gilhousen, I. M. Jacobs, R. Padovani, A. J. Viterbi, L. A. Weaver,and C. E. Wheatley, “On the capacity of a cellular CDMA system,”IEEE Trans. Veh. Technol., vol. 40, pp. 303–312, May 1991.
[21] G. L. Stuber, Principles of Mobile Communication. Boston: KluwerAcademic, 2nd Edition, 2001.
[22] F. Berggren and R. Jantti, “Asymptotically fair transmission schedulingover fading channels,” IEEE Trans. Wireless Commun., vol. 3, pp. 326–336, Jan. 2004.
[23] J. M. Holtzman, “Asymptotic analysis of proportional fair algorithm,” inProc. IEEE PIMRC 2001, vol. 2, pp. F33–F37, San Diego, Sept. 2001.
[24] H. Fu and D. I. Kim, “Analysis of throughput and fairness with downlinkscheduling in WCDMA networks,” IEEE Trans. Wireless Commun., vol.5, pp. 2164–2174, Aug. 2006.
[25] J. G. Proakis, Digital Communications, 4th ed. New York: McGraw-Hill,2001.
[26] M. Fisz, Probability Theory and Mathematical Statistics. New York:Wiley, 3rd Edition, 1963.
[27] J. M. Wozencraft and I. M. Jacobs, Principles of CommunicationEngineering. Waveland Press, 1990.
[28] D. M. Chiu and R. Jain “Analysis of the increase and decrease algorithmfor congestion avoidance in computer networks,” Computer Networksand ISDN System, vol. 17, pp. 1–14, June 1989.
[29] D. I. Kim, E. H. Hossain, and V. K Bhargava, “Downlink joint rate andpower allocation in cellular multirate WCDMA systems,” IEEE Trans.Wireless Commun., vol. 2, pp. 69–80, Jan. 2003.
[30] A. Papoulis, Probability, Random Variables, and Stochastic Processes.New York: McGraw-Hill, 3rd Edition, 1991.
[31] W. C. Y. Lee, “Estimate of channel capacity in Rayleigh fadingenvironment,” IEEE Trans. Veh. Technol., vol. 39, pp. 187–189, Aug.1990.
Hua Fu was with the School of Engineering andElectronics, University of Edinburgh, U.K. from2001 to 2003. From April, 2003 to January, 2004,he was with the School of Engineering Science,Simon Fraser University, Canada. Since January,2004, he has been with the Department of Electricaland Computer Engineering, National University ofSingapore. He was a Visiting Fellow at Simon FraserUniversity in August, 2007. His has conducted re-search in the areas of digital communication overfading channels, multiuser detection, digital signal
processing, and WCDMA mobile networks. He made contributions on re-ceiver design and performance analysis of MDPSK signaling over diversity,non-identically distributed, Rayleigh channels with symmetric/asymmetricfading spectrum and downlink scheduling analysis of 3GPP-WCDMA-HSDPA/3GPP2-CDMA-HDR mobile networks.
Dong In Kim (S’89-M’91-SM’02) received the B.S.and M.S. degrees in Electronics Engineering fromSeoul National University, Seoul, Korea, in 1980 and1984, respectively, and the M.S. and Ph.D. degreesin Electrical Engineering from the University ofSouthern California (USC), Los Angeles, in 1987and 1990, respectively.
From 1984 to 1985, he was a Researcher withKorea Telecom Research Center, Seoul. From 1986to 1988, he was a Korean Government GraduateFellow in the Department of Electrical Engineering,
USC. From 1991 to 2002, he was with the University of Seoul, Seoul,leading the Wireless Communications Research Group. From 2002 to 2007,he was a tenured Full Professor in the School of Engineering Science,Simon Fraser University, Burnaby, BC, Canada. From 1999 to 2000, hewas a Visiting Professor at the University of Victoria, Victoria, BC. Since2007, he has been with Sungkyunkwan University (SKKU), Suwon, Korea,where he is a Professor and SKKU Fellow in the School of Informationand Communication Engineering. Since 1988, he is engaged in the researchactivities in the areas of cellular radio networks and spread-spectrum systems.His current research interests include wideband, broadband, and ultrawideband(UWB) communications for high-data-rate wireless multimedia, cooperativeand cognitive radio (CR) techniques, and cross-layer design for CR systems.
Dr. Kim was an Editor for the IEEE Journal on Selected Areas inCommunications: Wireless Communications Series and also a Division Editorfor the Journal of Communications and Networks. He is currently an Editorfor Spread Spectrum Transmission and Access for the IEEE Transactionson Communications and an Editor for the IEEE Transactions on WirelessCommunications.
Authorized licensed use limited to: Sungkyunkwan University. Downloaded on February 27, 2009 at 05:02 from IEEE Xplore. Restrictions apply.