16
28 January 2021 Investor Presentation

28 January 2021
Investor Presentation

A WORLD OF INVESTMENTS2
Continuous growth
1.51 1.79 2.10
4.70 5.05 5.17
5.80
8.39 8.55
9.10
9.79
0.780.85
0.98
-
2.00
4.00
6.00
8.00
10.00
12.00
14.00
16.00
18.00
Jun 15 Jun 16 Jun 17 Jun 18 Jun 19 Jun-20 Dec-20
Growth in FUA ($ Billion)
Retail Institutional Superannuation H1 Revenue
1.89 2.62 2.664.75
9.3011.22 12.02
2.462.88
4.24
10.40
11.45
11.76
2.02
0.00
5.00
10.00
15.00
20.00
25.00
FY15 FY16 FY17 FY18 FY19 FY20 FY21
Growth in Revenue ($ Million)
Non-recurring income
Executing on our 3-year strategy is delivering improved performance
H2 Revenue
Up 4.2% pcp
Up 6.8% pcp

A WORLD OF INVESTMENTS3
Our 3 Year Plan
• Integrate clients to one backend, one client portal
• Provides operational efficiencies and client enhancements
• Funded One Platform Program
• Cost savings for shareholders FY21 and beyond
• Fully enables the 2nd strategic phase, GROW
• Grow Retail Managed Account & Super net inflows
• Invest into our sales team
• Grow Program - win new clients and more share from existing
• Drive new product and services
• Leverage our:
✓ One Managed Account Platform;
✓ Flexible investment management capability;
✓ Scalable portfolio rebalancing technology; and
✓ Competitive client fees.
• Compete strongly in the market
• Accelerate growth
• Outperform the listed Specialist Platform Provider (SPP) sector
• Key Outperform Goals;
✓ Relatively, grow net retail Managed Account inflows faster;
✓ Have the strongest improvement in EBITDA margin; and
✓ Improve our cost to income ratio
Time
Making good progress executing on our strategic plan
INTEGRATE
GROW
OUTPERFORM
Dec19 Jan 21

A WORLD OF INVESTMENTS4
Results summary
14.38
15.89
15.12
16.57
13
13.5
14
14.5
15
15.5
16
16.5
17
Jun 19 Dec-19 Jun-20 Dec-20
FUA ($b)
181
722
-57
98.7
-200
0
200
400
600
800
H2 FY19 H1 FY20 H2 FY20 H1 FY21
Net Funds Flow ($m)
9.3
11.5 11.211.7
12.02
6
7.5
9
10.5
12
H1 FY19 H2 FY19 H1 FY20 H2 FY20 H1 FY21
Revenue ($m)
1.05
1.74
1.20
1.60
1.81
0
0.5
1
1.5
2
H1 FY19 H2 FY19 H1 FY20 H2 FY20 H1 FY21
Underlying EBITDA ($m)
-0.80.5
2.1
1.6 1.4
-1
0
1
2
3
H1 FY 19 H2 FY19 H1 FY20 H2 FY20 H1 FY21
Net Operating Cashflow ($m)
11.8
15.2
10.7
13.715.0
0
5
10
15
20
H1 FY19 H2 FY19 H1 FY20 H2 FY20 H1 FY21
Underlying EBITDA Margin (%)
* FY19 EBITDA adjusted for one off and AAS16
* FY19 Revenue adjusted for one off * FY19 not adjusted for AAS16 reclassification

A WORLD OF INVESTMENTS5
H1 FY21 Execution ReportHUB24 deal Key milestones achieved
▪ With HUB24 we agreed how best to achieve pre migration streams of the One Platform Program;
▪ Agreed and jointly executing our approach to expand Xplore’s Sales and Marketing team;
▪ Conducted joint townhalls and webinars to engage with our clients and staff;
▪ Federal Court provided orders to convene Scheme Meetings for Security holders to vote;
▪ ASIC registered the Scheme Booklet in relation to the proposed acquisition of Xplore by HUB24;
▪ The Scheme Booklet has been made available to Xplore Security holders;
▪ An Independent Expert’s Report assessed the value of Xplore shares at between $0.192 and $0.231;
▪ The Scheme Meetings have been set up and scheduled for 12 February 2021; and
▪ The Schemes have been scheduled for a second court hearing for 18 February 2021.

A WORLD OF INVESTMENTS6
One Platform Creating business efficiencies and savings
✓ An additional $1.2m recurring annualised savings achieved, taking total saves to $2.3m;
✓ The second of three stages of the One Platform program, “Migration Readiness” was completed;
✓ In consultation with HUB24, the scope of the final stage, “Transition Delivery” was agreed; and
✓ Upgrading of EPI Data Feed to 4.3, through HUB Connect, Fees and MDA Reporting commenced.
1H FY21 Execution Report (cont.)
Grow Program Sustainably growing our business
✓ In consultation with HUB24, commenced recruitment to expand sales team by three new BDMs,
with the first BDM starting 1st February 2021;
✓ An additional two Advice Dealer Groups whitelabelled the Xplore Super & Pension WRAP; and
✓ Further product enhancements made to Xplore Super & Pension WRAP.

A WORLD OF INVESTMENTS7
During this period, our core focus will be continuing to deliver on the strategic objectives of the business in line with the FY21 business plan. Specifically we plan to:
• Finalise product enhancements including upgrades to our superannuation offer and FX capability;
• Target new clients for our expanded superannuation solutions services offer;
• Continue to focus on cost management and margin improvement;
• Move into the 2nd phase of our strategy, targeting new clients to grow our retail and superannuation businesses; and
• Keep safely navigating the ongoing pandemic, protecting our staff, whilst maintaining our customer proposition.
As per the Scheme Implementation Agreement (SIA) with HUB24 we will:
• Consult on how best to complete pre migration streams of the One Platform Program;
• Agree on our approach to expand our Sales and Marketing team, with a focus on MDA and key client engagement;
• Proactively engage with our clients and staff to protect their interests through the deal process; and
• Comply with terms of the SIA.
FY21 - Key prioritiesContinuing to deliver on the strategic plan while complying with the SIA

Financials Results
The Financial results shown in this release are preliminary unaudited results which have been provided ahead of the release of Xplore’s Appendix 4D and final auditor reviewed half year report for the 6 months ended 31 December 2020 which are due to be released in late February 2021. Please note that as the financial results shown in this release are not audited, they may be subject to change once the auditor’s review of the report has been completed.

A WORLD OF INVESTMENTS9
H1 FY21 Financial Results
H1 2021$’m
H1 2020$’m
CHANGE
Revenue $12.0 $11.3 6.2%
Direct costs ($2.3) ($2.8) (17.9%)
Gross Profit $9.7 $8.4 15.5%
Gross Profit Margin 81% 75% 8.0%
Other Income - $0.1 -
Operating expenses ($7.9) ($7.3) 8.2%
Underlying EBITDA $1.8 $1.2 50.0%
EBITDA Margin % 15.0% 10.7% 40.2%
One off items of expenditure(1) ($1.3) ($1.1) 18.2%
One off items of revenue (2) $0.9 - -
Depreciation & amortisation ($1.0) ($1.3) (23.1%)
Write off of Linear Software - ($10.8) -
NPBT $0.4 ($12.0) -
▪ Strong revenue growth prior comparable period (pcp)
▪ Improved Gross Margin and EBITDA margins
▪ Return to profitability for the period
▪ Deal related costs of $630k incurred during period
▪ Positive findings in AusIndustry review contributed $600k in one off revenue
1 Relates to investment into One Platform program expensed during the period and costs incurred in the scheme of arrangement with HUB24 and subsequent deal related activities.2. Relates primarily to the reversal of provision for disputed R&D claim given favourable findings by AusIndustry during the period and Government subsidies associated with the Covid-19 stimulus package.
Positive momentum with revenue and EBITDA growth on pcp

A WORLD OF INVESTMENTS10
FUA & Inflows
FUA ($ Billion) Dec-18 Jun-19 Sep-19 Dec-19 Mar-20 Jun-20 Sep-20 Dec-20
Opening FUA 13.77 13.29 14.38 14.99 15.89 14.51 15.12 15.53
Net Flows 0.03 - 0.01 0.23 0.49 0.02 - 0.08 - 0.03 0.13
Market Movement - 0.58 1.10 0.38 0.41 - 1.41 0.69 0.45 0.91
Closing FUA 13.22 14.38 14.99 15.89 14.51 15.12 15.53 16.57
Gross Flows ($m)
Retail 188.7 203.0 253.1 255.9 262.4 232.5 241.5 348.0
Institutional 346.5 537.0 565.5 669.9 482.6 317.9 324.7 207.5
Superannuation* 5.0 15.4 92.1 141.7 54.6 53.5 72.1
Net Flows ($m)
Retail 50.3 - 92.0 33.7 86.7 - 30.0 - 115.4 4.9 114.1
Institutional -23.8 115.0 227.7 343.2 - 54.9 23.0 - 56.1 - 34.9
Superannuation* - 34.0 - 29.4 60.2 104.0 14.5 22.5 48.2
* Superannuation businesses wholly owned by Xplore Wealth - Aracon Superannuation Pty Ltd and DIY Master Pty Ltd
FUA increased $1.0 Billion up 6.7% quarter on quarter (QoQ) to a record level of $16.57 Billion.

A WORLD OF INVESTMENTS11
H1 FY21 FUA and Revenue Composition
Institutional -FUA based24% (25%*)
Institutional - Account based
35% (35%*)
Retail35% (34%*)
Superannuation6% (6%*)
FUA – 31 December 2020 ($16.6b)
Institutional - FUA Based 8% (9%*)
Institutional -Account based
6% (7%*)
Retail76% (74%*)
Superannuation9% (10%*)
Other1% (0%*)
Revenue - 1H FY21 ($12.02m)
A diversified FUA and revenue base with majority of revenues flowing from higher margin retail book
*Comparative FUA splits as at 30 June 2020 *Comparative Revenue splits as at H1 FY20

A WORLD OF INVESTMENTS12
H1 FY21 Revenue Composition
Platform - FUA based /
Transaction fees56%
Platform Fees -Account based
6%
Superannuation services income
9%
Other income2%
Other platform related income
27%
Revenue – H1 FY20 ($11.2m)
Diversified revenue base by fee type
Platform - FUA based /
Transaction fees49%
Platform Fees - Account based7%
Superannuation services income
10%
Other income1%
Other platform related income
33%
Revenue – H1 FY21 ($12.02m)
A WORLD OF INVESTMENTS13
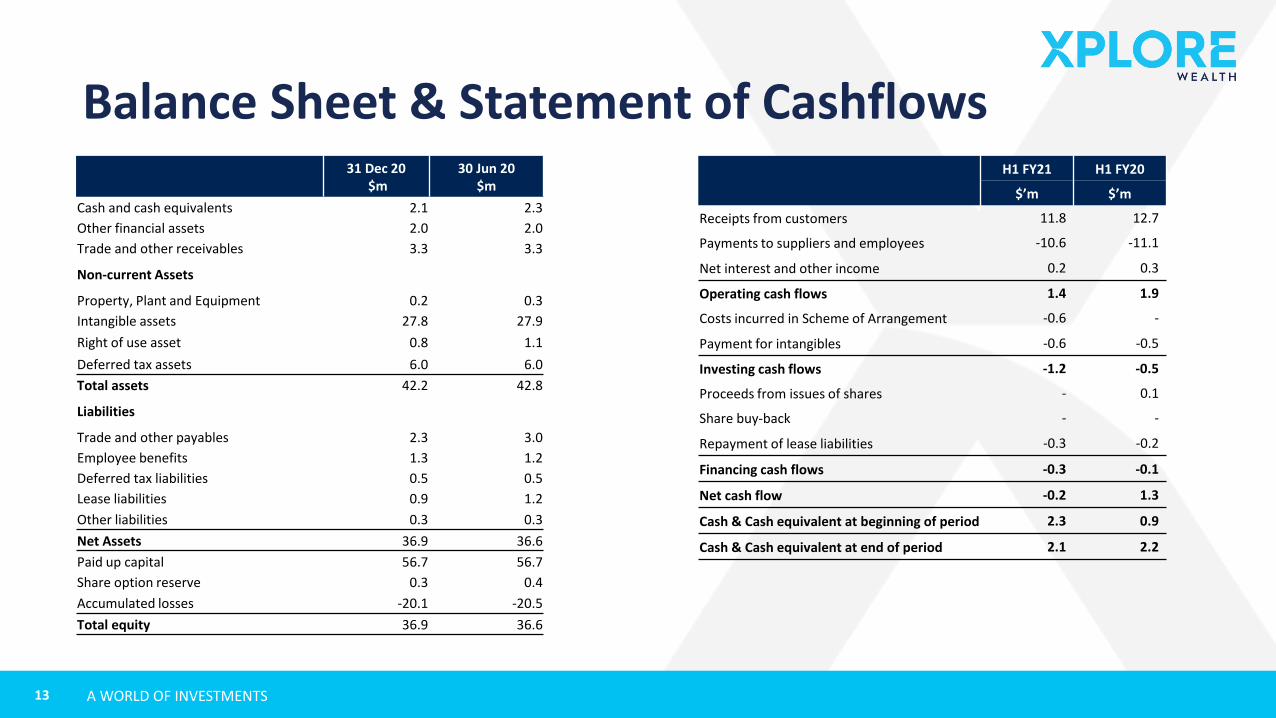
Balance Sheet & Statement of Cashflows31 Dec 20
$m30 Jun 20
$m
Cash and cash equivalents 2.1 2.3
Other financial assets 2.0 2.0
Trade and other receivables 3.3 3.3
Non-current Assets
Property, Plant and Equipment 0.2 0.3
Intangible assets 27.8 27.9
Right of use asset 0.8 1.1
Deferred tax assets 6.0 6.0
Total assets 42.2 42.8
Liabilities
Trade and other payables 2.3 3.0
Employee benefits 1.3 1.2
Deferred tax liabilities 0.5 0.5
Lease liabilities 0.9 1.2
Other liabilities 0.3 0.3
Net Assets 36.9 36.6
Paid up capital 56.7 56.7
Share option reserve 0.3 0.4
Accumulated losses -20.1 -20.5
Total equity 36.9 36.6
H1 FY21 H1 FY20
$’m $’m
Receipts from customers 11.8 12.7
Payments to suppliers and employees -10.6 -11.1
Net interest and other income 0.2 0.3
Operating cash flows 1.4 1.9
Costs incurred in Scheme of Arrangement -0.6 -
Payment for intangibles -0.6 -0.5
Investing cash flows -1.2 -0.5
Proceeds from issues of shares - 0.1
Share buy-back - -
Repayment of lease liabilities -0.3 -0.2
Financing cash flows -0.3 -0.1
Net cash flow -0.2 1.3
Cash & Cash equivalent at beginning of period 2.3 0.9
Cash & Cash equivalent at end of period 2.1 2.2

A WORLD OF INVESTMENTS14
Costs BreakdownH1 FY21 H1 FY20 Movement
$’m $’m
Operating Expenses
Employment related costs 5.8 5.4 7.4%
Computer and IT expenses 0.9 0.7 28.6%
Professional fees and Consulting 0.5 0.6 (16.6%)
Other expenses 0.7 0.6 16.6%
Total Operating Expenses 7.9 7.3 8.2%
Depreciation & amortisation
Depreciation & Amortisation 0.7 1.0 (30%)
Depreciation attributed to lease arrangements 0.3 0.3 -
1.0 1.3 (30%)
One-off expenses
Employment related - 0.6 -
Acquisition related 0.6 - -
One Platform – systems development 0.7 - -
R&D related - 0.5 -
1.3 1.1 18.2%
▪ Increase in costs generally in line with growth in the business
▪ Acquisition related costs pertain to the HUB24 deal entered into between Xplore and HUB24

visit
xplorewealth.com.au
Authorised for release by Michael Wright
Contact details
Mike WrightCEO Xplore Wealth Ltd
0407 641 996 | [email protected] | Suite 1, Level 5, 28 Margaret Street, Sydney NSW 2000
This presentation contains summary information about Xplore Wealth Limited (Company) (ASX: XPL) ABN 34 128 316 441 and its activities as at the date of presentation. The information in this presentation is of a general nature and does not purport to be complete or contain all information that a prospective investor should consider when evaluating an investment decision. Not an offer of securities or financial products: This presentation is not a prospectus, product disclosure statement or other offering document under Australian law (and will not be lodged with ASIC) or any other law. This presentation does not constitute an offer, invitation, solicitation or recommendation with respect to the purchase or sale of any securities or any financial product nor does it constitute financial product or investment advice nor take into account your investment objectives, taxation situation, financial situation or needs. An investor must not act on the basis of any matter contained in this presentation but must make its own assessment of the Company and conduct its own investigations and analysis. Before making an investment decision a prospective investor should consider whether such an investment is appropriate to their particular investment objectives and financial situation and seek appropriate advice, including legal, taxation and financial advice appropriate to their jurisdiction and circumstances. Financial data: All financial information in this presentation is in Australian dollars ($ or AUD) unless otherwise stated.

A WORLD OF INVESTMENTS16
DisclaimerSummary information This presentation contains summary information about Xplore Wealth Ltd (Company) (ASX: XPL) and its activities as at the date of presentation. The information in this presentation is of a general nature and does not purport to be complete or contain all information that a prospective investor should consider when evaluating an investment decision in the Company or that would be required in a prospectus or product disclosure statement prepared in accordance with the requirements of the Corporations Act 2001 (Cth) (Corporations Act). This presentation should be read in conjunction with the Company's other periodic news releases or ASX disclosure documents as available from time to time. Forward looking statements This presentation contains forward-looking statements and information that are necessarily subject to risks, uncertainties and assumptions. Many factors could cause actual results, performance or achievements of the Company to be materially different from those expressed or implied in this release including, amongst others, changes in general economic and business conditions, regulatory environment, results of advertising and sales activities, competition, and the availability of resources. Should one or more of these risks or uncertainties materialise, or should underlying assumptions prove incorrect, actual results may vary materially from those described in this presentation. Except as required by law, the Company assumes no obligation to update or correct the information in this presentation. To the maximum extent permitted by law, the Company and its subsidiaries and officers do not make any representation or warranty as to the likelihood of fulfilment of any forward-looking statements and disclaim responsibility and liability for any forward-looking statements or other information in this presentation.Not an offer of securities or financial productsThis presentation is not a prospectus, product disclosure statement or other offering document under Australian law (and will not be lodged with ASIC) or any other law. This presentation does not constitute an offer, invitation, solicitation or recommendation with respect to the purchase or sale of any securities or any financial product nor does it constitute financial product or investment advice nor take into account your investment objectives, taxation situation, financial situation or needs. An investor must not act on the basis of any matter contained in this presentation but must make its own assessment of the Company and conduct its own investigations and analysis. Before making an investment in the Company, a prospective investor should consider whether such an investment is appropriate to their particular investment objectives and financial situation and seek appropriate advice, including legal, taxation and financial advice appropriate to their jurisdiction and circumstances. Financial data All financial information in this presentation is in Australian dollars ($ or AUD) unless otherwise stated. Investors should note that this presentation may contain pro forma historical and forward looking financial information. The pro forma and forward looking financial information and the historical information, provided in this presentation is for illustrative purposes only and is not represented as being indicative of the Company’s views on its future financial condition and/or performance.The pro forma financial information has been prepared by the Company in accordance with the recognition and measurement principles of Australian Accounting Standards (AAS) and the Company’s adopted accounting policies of applicable accounting standards and other mandatory reporting requirements in Australia. Investors should also note that any pro forma financial information does not purport to be in compliance with Article 11 of Regulation S-X of the rules and regulations of the U.S. Securities and Exchange Commission (SEC). Such information does not purport to comply with Article 3-05 of Regulation S-X.Investors should be aware that certain financial measures included in this presentation are ‘non-IFRS financial information’ under ASIC Regulatory Guide 230: ‘Disclosing non-IFRS financial information’ published by ASIC and also ‘non-GAAP financial measures’ within the meaning of Regulation G under the U.S. Securities Exchange Act of 1934, as amended, and are not recognised under AAS and International Financial Reporting Standards (IFRS). The non-IFRS financial information / non-GAAP financial measures include EBITDA and EBIT. The Company believes the non-IFRS financial information / non-GAAP measures provide useful information to users in measuring the financial performance and conditions of the Company. The non-IFRS financial information / non-GAAP financial measures do not have a standardised meaning prescribed by AAS or IFRS. Therefore, the non-IFRS financial information is not a measure of financial performance, liquidity or value under the IFRS and may not be comparable to similarly titled measures presented by other entities, and should not be construed as an alternative to other financial measures determined in accordance with AAS or IFRS. Investors are cautioned, therefore, not to place undue reliance on any non-IFRS financial information / non-GAAP financial measures included in this presentation.


