Institutional Equities Visit Note Reuters: SUPI.BO; Bloomberg: SI IN Supreme Industries Plastic Industry Juggernaut Supreme Industries (SIL), a pioneer in PVC plastic pipe industry in India, has evolved as a multi-product and multi-segment behemoth over the years. Despite facing fierce competition from players in organised as well as unorganised segment, SIL has outsmarted its competitors and continues to be the market leader in most of its product segments. Having compounded its annual turnover and book value at a CAGR of 22% and 20%, respectively, over a long period of 50 years, SIL has given its minority shareholders “bang for the buck”. With 247mn Indian households (68% rural and 32% urban) and plastic pipe market size of US$3.3bn, we believe that PVC and CPVC pipe industry size is still like “a needle in a haystack”. Apart from the plastic pipe segment, SIL enjoys market leader status in protective packaging, material handling and plastic furniture segments. With visible medium-term capex plan, superior capital allocation capabilities of the management and a strong product portfolio, we are confident that SIL will continue to enjoy premium valuation and deliver no- holds-barred growth. Consistent increase in value added products (VAPs) to protect superior margins: SIL, through technical collaborations with foreign players, has consistently brought innovation in all it product segments. Through consistent efforts, sales contribution from VAPs increased from 30% in FY12 to 38% in FY17. Sales of VAPs witnessed a CAGR of 14% over the same period. We believe that contribution of VAPs (EBITDAM > 17%) to total sales will continue to grow and stay above 35% till FY20E, allowing SIL to reduce its dependency on key raw material price fluctuations (PVC, PE, PP) and protect its current margin level. Strong capex programme in line to drive medium-term growth: Currently, SIL has 387,000mt/63,000mt/62,000mt/28,000mt/450,000 unit capacity in plastic pipe/ packaging /industrial/consumer/composite cylinder segments, respectively, while in CPVC/Silpaulin it stands at ~21,000mt/27,000mt, respectively. In FY18, total plants of SIL will go up from 25 to 28 with total capex spending of Rs3,000mn-Rs3,500mn. SIL is expected to spend Rs12,000mn- Rs13,000mn over FY18-FY21 to build new capacity. With the new capacity, SIL has sufficient earnings visibility over the medium term. Well diversified product portfolio with a pan-India presence: SIL has got the most diversified product portfolio among its peers. SIL witnesses contribution from plastic pipe (56%), packaging (22%), industrial (14%), consumer (7%) and composite cylinder (0.2%) segments to its total sales. A diverse product portfolio has allowed SIL to reduce its dependency on any one end-user industry. SIL’s manufacturing base is spread across 11 States and Union Territories, thereby covering most parts of India. With new Greenfield expansion in Assam, SIL will make inroads into one of the least penetrated markets in India, giving it an edge over peers. Valuation: We expect volume/sales/EBITDA/PAT to post CAGR of 11%/14%/15%/17%, respectively, over FY17-FY19E. SIL stock currently trades at P/E of 30x FY18E and 26x FY19E earnings, respectively. We have valued the stock at 30xFY19E earnings (average two-year P/E at 30x) and retained Buy rating on it with a target price of Rs1,396, up 16% from the CMP. BUY Sector: Plastics CMP: Rs1,200 Target Price: Rs1,396 Upside: 16% Akhil Parekh Research Analyst [email protected]+91-22-3926 8093 Key Data Current Shares O/S (mn) 127.0 Mkt Cap (Rsbn/US$bn) 152.5/2.4 52 Wk H / L (Rs) 1,230/727 Daily Vol. (3M NSE Avg.) 71,796 Shareholding (%) 4QFY17 3QFY17 2QFY17 Promoter 49.7 49.7 49.7 Institutional 28.6 28.3 28.9 Non-Institutional 21.6 22.0 21.4 One Year Indexed Stock Performance Price Performance (%) 1 M 6 M 1 Yr Supreme Ind. 5.7 34.3 36.5 Nifty Index 2.2 20.2 16.0 Source: Bloomberg Y/E March (Rsmn) consolidated FY14 FY15 FY16 FY17 FY18E FY19E Revenues 39,622 42,552 29,748 44,623 50,755 58,363 YoY (%) 16.4 7.4 (6.8) 12.5 13.7 15.0 EBITDA 5,888 6,662 4,611 7,619 8,628 10,038 EBITDA (%) 14.9 15.7 15.5 17.1 17.0 17.2 Reported PAT 2,834 3,224 2,212 4,281 5,041 5,911 Adj PAT 2,585 3,224 2,212 4,281 5,041 5,911 FDEPS (Rs) 20.4 25.4 17.4 33.7 39.7 46.5 YoY (%) (8.9) 24.7 (8.7) 45.5 17.7 17.2 RoE (%) 27.0 28.6 23.3 28.4 28.6 29.7 RoCE (%) 22.7 22.5 18.2 21.7 23.0 24.7 Dividend Yield (%) 0.7 0.8 0.6 1.0 1.3 1.5 P/E (x) 59.0 47.3 51.7 35.6 30.2 25.8 P/BV (x) 14.7 12.6 11.6 9.0 8.3 7.1 EV/EBITDA (x) 26.5 23.0 25.2 20.0 17.6 15.0 *SIL changed its financial year end from June to March in FY16. FY16 is a 9 months period. For growth, numbers are annualized. Source: Company, Nirmal Bang Institutional Equities Research 80 90 100 110 120 130 140 150 Jun-16 Aug-16 Oct-16 Dec-16 Feb-17 Apr-17 Jun-17 SUPREME INDUSTRIES Nifty 50 23 June 2017
Transcript
Institutional Equities
Vis
it N
ote
Reuters: SUPI.BO; Bloomberg: SI IN
Supreme Industries
Plastic Industry Juggernaut Supreme Industries (SIL), a pioneer in PVC plastic pipe industry in India, has evolved as a multi-product and multi-segment behemoth over the years. Despite facing fierce competition from players in organised as well as unorganised segment, SIL has outsmarted its competitors and continues to be the market leader in most of its product segments. Having compounded its annual turnover and book value at a CAGR of 22% and 20%, respectively, over a long period of 50 years, SIL has given its minority shareholders “bang for the buck”. With 247mn Indian households (68% rural and 32% urban) and plastic pipe market size of US$3.3bn, we believe that PVC and CPVC pipe industry size is still like “a needle in a haystack”. Apart from the plastic pipe segment, SIL enjoys market leader status in protective packaging, material handling and plastic furniture segments. With visible medium-term capex plan, superior capital allocation capabilities of the management and a strong product portfolio, we are confident that SIL will continue to enjoy premium valuation and deliver no-holds-barred growth.
Consistent increase in value added products (VAPs) to protect superior margins: SIL, through technical collaborations with foreign players, has consistently brought innovation in all it product segments. Through consistent efforts, sales contribution from VAPs increased from 30% in FY12 to 38% in FY17. Sales of VAPs witnessed a CAGR of 14% over the same period. We believe that contribution of VAPs (EBITDAM > 17%) to total sales will continue to grow and stay above 35% till FY20E, allowing SIL to reduce its dependency on key raw material price fluctuations (PVC, PE, PP) and protect its current margin level.
Strong capex programme in line to drive medium-term growth: Currently, SIL has 387,000mt/63,000mt/62,000mt/28,000mt/450,000 unit capacity in plastic pipe/ packaging /industrial/consumer/composite cylinder segments, respectively, while in CPVC/Silpaulin it stands at ~21,000mt/27,000mt, respectively. In FY18, total plants of SIL will go up from 25 to 28 with total capex spending of Rs3,000mn-Rs3,500mn. SIL is expected to spend Rs12,000mn-Rs13,000mn over FY18-FY21 to build new capacity. With the new capacity, SIL has sufficient earnings visibility over the medium term.
Well diversified product portfolio with a pan-India presence: SIL has got the most diversified product portfolio among its peers. SIL witnesses contribution from plastic pipe (56%), packaging (22%), industrial (14%), consumer (7%) and composite cylinder (0.2%) segments to its total sales. A diverse product portfolio has allowed SIL to reduce its dependency on any one end-user industry. SIL’s manufacturing base is spread across 11 States and Union Territories, thereby covering most parts of India. With new Greenfield expansion in Assam, SIL will make inroads into one of the least penetrated markets in India, giving it an edge over peers.
Valuation: We expect volume/sales/EBITDA/PAT to post CAGR of 11%/14%/15%/17%, respectively, over FY17-FY19E. SIL stock currently trades at P/E of 30x FY18E and 26x FY19E earnings, respectively. We have valued the stock at 30xFY19E earnings (average two-year P/E at 30x) and retained Buy rating on it with a target price of Rs1,396, up 16% from the CMP.
*SIL changed its financial year end from June to March in FY16. FY16 is a 9 months period. For growth, numbers are annualized. Source: Company, Nirmal Bang Institutional Equities Research
Source: Bloomberg, Nirmal Bang Institutional Equities Research Source: Bloomberg, Nirmal Bang Institutional Equities Research
0
20,000
40,000
60,000
80,000
100,000
120,000
140,000
160,000
180,000
Ju
n-1
4
Au
g-1
4
Oct-
14
De
c-1
4
Fe
b-1
5
Ap
r-1
5
Ju
n-1
5
Au
g-1
5
Oct-
15
De
c-1
5
Fe
b-1
6
Ap
r-1
6
Ju
n-1
6
Au
g-1
6
Oct-
16
De
c-1
6
Fe
b-1
7
Ap
r-1
7
Ju
n-1
7
(Rsmn)
16x
14x
12x
10x
8x
0
200
400
600
800
1,000
1,200
1,400
Jun
-14
Au
g-1
4
Oct
-14
De
c-1
4
Fe
b-1
5
Ap
r-1
5
Jun
-15
Au
g-1
5
Oct
-15
De
c-1
5
Fe
b-1
6
Ap
r-1
6
Jun
-16
Au
g-1
6
Oct
-16
De
c-1
6
Fe
b-1
7
Ap
r-1
7
Jun
-17
(Rs)
25x
10x
15x
35x
20x
30x
Institutional Equities
3 Supreme Industries
Exhibit 3: Economic moats
Source: Company, Nirmal Bang Institutional Equities Research
Pan-India distribution network with manufacturing plants across the country
Starting from two tin shed establishments at Wadala and Naigaum in Mumbai with shareholder equity of Rs1.7mn, SIL has come a long way. In the past six decades, the company has set up 25 manufacturing plants in 11 states and Union territories with a wide distribution network comprising 2,973 distributors. SIL has consistenly expanded its reach and strengthened its distribution network at a CAGR of 10% over FY13-FY17. When SIL was not able to find suitable distributors to buy and stock its products for redistribution through the retail chain in any area, the company sold products directly to big retailers there. SIL has strengthened its supply chain to service those retailers in a cost-efficient manner.
Source: Company, Nirmal Bang Institutional Equities Research Source: Company, Nirmal Bang Institutional Equities Research
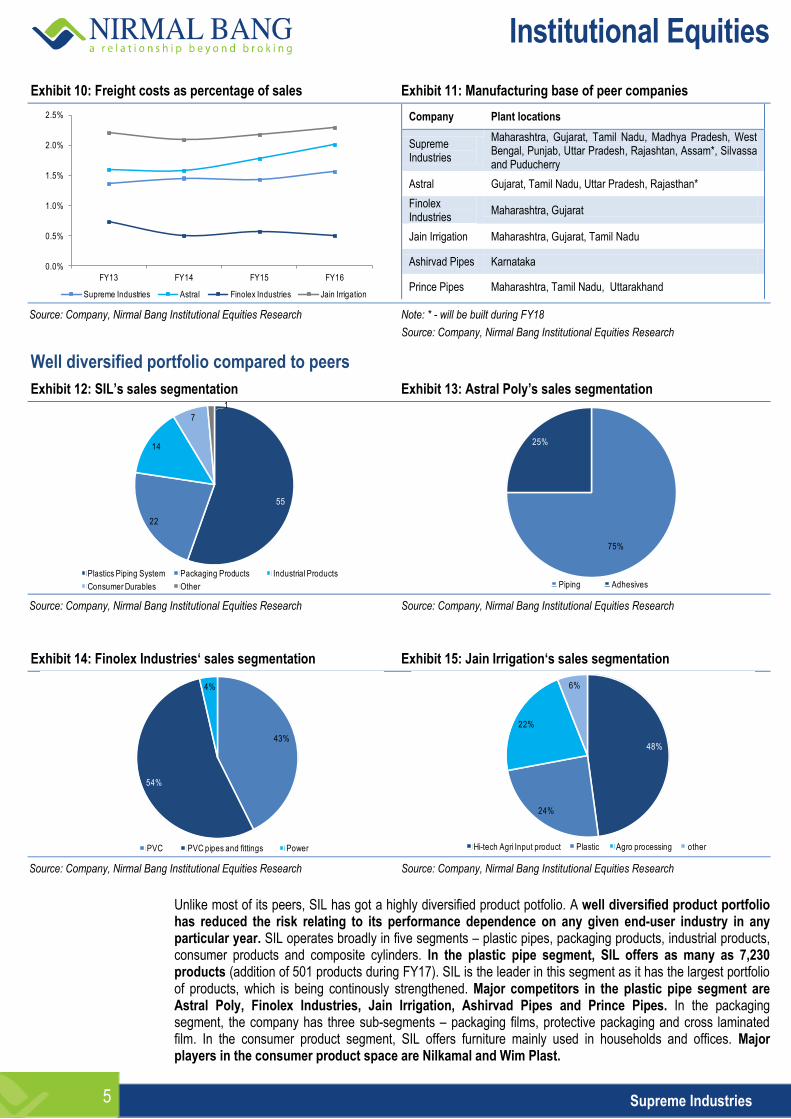
SIL has the widest reach among its peers such as Astral Poly, Finolex Industries, Jain Irrigation and Ashirvad Pipes. Its manufacturing plants are spread across India with plastic pipe plants at Jalgaon in Maharashtra, Malanpur in Madhya Pradesh, Kanpur in Uttar Pradesh and Kharagpur in West Bengal. In FY18, SIL intends to set up greenfield plastic product manufacturing complexes in South India and North East India. Currently, none of the peers of SIL have any plant in the eastern region. SIL, with its new plant in Assam, will be able to capture this market.
A wide pan-India manufacturing base and strong distribution network across all states helped SIL save on freight costs and have a faster turnaround time. SIL’s frieght costs, as a percentage of total sales, are down 40bps and 70bps compared to Astral Poly’s and Jain Irrigation’s freight cost to sales ratios, respectively.
Exhibit 8: Material handling product channel partners Exhibit 9: Peer distribution network
Source: Company, Nirmal Bang Institutional Equities Research Source: Company, Nirmal Bang Institutional Equities Research
Source: Company, Nirmal Bang Institutional Equities Research Source: Company, Nirmal Bang Institutional Equities Research
Unlike most of its peers, SIL has got a highly diversified product potfolio. A well diversified product portfolio has reduced the risk relating to its performance dependence on any given end-user industry in any particular year. SIL operates broadly in five segments – plastic pipes, packaging products, industrial products, consumer products and composite cylinders. In the plastic pipe segment, SIL offers as many as 7,230 products (addition of 501 products during FY17). SIL is the leader in this segment as it has the largest portfolio of products, which is being continously strengthened. Major competitors in the plastic pipe segment are Astral Poly, Finolex Industries, Jain Irrigation, Ashirvad Pipes and Prince Pipes. In the packaging segment, the company has three sub-segments – packaging films, protective packaging and cross laminated film. In the consumer product segment, SIL offers furniture mainly used in households and offices. Major players in the consumer product space are Nilkamal and Wim Plast.
Plastics Piping System Packaging Products Industrial Products
Consumer Durables Other
25%
Astral - sales segmentation
Piping Adhesives
75%
43%
54%
4%
Finolex Industries- sales segmentation
PVC PVC pipes and fittings Power
48%
24%
22%
6%
Jain Irrigation sales segmentation
Hi-tech Agri Input product Plastic Agro processing other
Institutional Equities
6 Supreme Industries
In the industrial product segment, SIL has two sub-segments – industrial components (consumer appliances, automobile components) and material handling system (crates, pallets, garbage bins). Maruti Suzuki India, Honda, Piaggio, Whirlpool India, etc are some of its clients. Material handling division has products such as crate for industrial, retailing, warehousing dairy, fishery, fruit and vegetable vending entities, bottle crate for soft drink and beverage industry, pallet for warehousing, roto-moulded crate and garbage bin. As a part of the new inititative, SIL forayed into composite cylinders. Some of its clients include the Bangladesh government and Hindustan Petroleum Corporation or HPCL (educational orders as of now). Major competitors in composite cylinders segment is Time Technoplast.
Exhibit 16: Business verticals image
Source: Company, Nirmal Bang Institutional Equities Research
Having a diversified product portfolio catering to varying industries has not enabled SIL to reduce volatility in its growth and operating margin over a long period of time, but has given it an edge at the operating margin level against its peers. The variance in operating margin of SIL in the past six years, FY12-FY17,is 0.5 which is well below that of its peers – Astral Poly’s 1.5, Finolex Industries’ 15.9 and Jain Irrigation’s 6.0.
Exhibit 17: Low variance in EBITDA margin of SIL improvement Exhibit 18: Medium variance in EBITDA margin of Astral Poly
Source: Company, Nirmal Bang Institutional Equities Research Source: Company, Nirmal Bang Institutional Equities Research
16.1
15.7
14.9
15.715.5
17.1
13.5
14.0
14.5
15.0
15.5
16.0
16.5
17.0
17.5
FY12 FY13 FY14 FY15 FY16 FY17
(%)
14.2 14.2
14.8
11.812.1
13.5
10.0
10.5
11.0
11.5
12.0
12.5
13.0
13.5
14.0
14.5
15.0
15.5
FY12 FY13 FY14 FY15 FY16 FY17
(%)
Institutional Equities
7 Supreme Industries
Exhibit 19: High variance in EBITDA margin of Jain Irrigation Exhibit 20: Very high variance in EBITDA margin of Finolex Ind.
Source: Company, Nirmal Bang Institutional Equities Research Source: Company, Nirmal Bang Institutional Equities Research
Market leadership despite fierce competition
Plastic pipes
SIL is market leader in the plastic pipe segment with a total capacity of 387,000mt. Plastic pipe segment is an oligopolostic market dominated by five big players – SIL, Finolex Industries, Ashirvad Pipes, Astral Poly and Jain Irrigation. The total market size of is ~Rs280,000mn with 60% of the market captured by organiseed players and the rest 40% by unorganised entities.
Exhibit 21: Indian Plastic Piping Industry
Source:Company, Nirmal Bang Institutional Equities
The plastic pipe segment is fiercely competitive segment in India, Despite this, SIL has been able to retain its market leader status. Currently, SIL holds 15% share in the organised plastic pipe segment and 9% in the total pipe segment in India. SIL has been able to retain its leader position by continously expanding its distribution channel and retail touch points. As of now, SIL has 914 channel partners with more than 25,000 retail touch points. Also, SIL has consistently increased its kitty of plastic products. As of FY17-end, SIL had 7,300 products for 23 different application systems. SIL is the only company in India supplying pipes and fitttings manufactured from all major polymers – PVC, CPVC, PE and PPR. Astral Poly manufactures pipes using PVC and CPVC, Finolex Industries and Jain Irrigation mainly use PVC for pipe production while Ashirvad Pipes is the leader in uPVC column pipes.
19.0
15.6
13.712.6 13.0 13.0
0
2
4
6
8
10
12
14
16
18
20
FY12 FY13 FY14 FY15 FY16 FY17
(%)
10.0
14.7 14.2
7.5
14.2
18.8
0
2
4
6
8
10
12
14
16
18
20
FY12 FY13 FY14 FY15 FY16 FY17
(%)
Domestic Plastic Piping
(Rs280,000mn)
Organised: 60%
Rs168,000mn
Supreme Industries: ~Rs24,500mn
Finolex Industries: Rs22,000mn
Astral Poly: Rs14,750mn
Jain Irrigation: Rs16,615mn
Unorganised: 40%
Rs112,000mn
Institutional Equities
8 Supreme Industries
Exhibit 22: Distributor/Dealer network of different players in plastic piping segment
Company Distribution channel partners & retail touch points (RTPs) – plastic pipes
Supreme Industries 914; 25,000+ RTPs
Astral Poly 750; 25000 RTPs
Finolex Industries* 850; 18,000 RTPs
Ashirvad Pipes 1800; 16,000 RTPs
Jain Irrigation* 6,572
* Includes channel partners for all its products and not just plastic pipes.
Source: Company, Nirmal Bang Institutional Equities Research
Packaging products
SIL offers speciality films, protective packaging products and cross-laminated film products. The company has tie-ups with global industry leaders, thereby giving it access to latest technology and innovations.In the speciality film segment, SIL sells high value added products such as high gloss film, thermoforming films and pouches, and bulk bags. Competition has been increasing with new players entering this segment and existing players raising their capacity. However, SIL has been able to retain its customer base and grow, albeit at a moderate pace, because of the high quality of its products and servicing standards.
SIL is among the market leaders in the protecitve packaging segment with around 25% market share. In this segment, SIL mainly caters to packaging, civil and insulation sectors. New applications and strong focus on product development has kept other players at bay. Many informal players operate in this segment who cannot compete with SIL in terms of its quality and servicing standards.
Exhibit 23: Market size of protective packaging products offered by SIL
Source: Company, Nirmal Bang Institutional Equities Research
SIL is the only company in India which has the technology for manufacturing cross- laminated films. The company sells this product under the brand name Silpaulin. Silpaulin contributes ~10% to SIL’s total sales. Similar to protective packaging and packaging films, there are many unorganised players in this segment in India. With the Goods and Services Tax or GST rollout, we believe SIL will be able to capture some market share from these unorganised players. SIL also made a maiden entry in the US market. SIL sent its first consignment of tarpaulins in March 2017 to an US entity which will be selling Silpaulin through online websites. SIL is in negotitaons with retail chain stores in the US for selling Silpaulin in stores and through online websites. SIL has also entered new markets such as the UK, Denmark and Australia.
SIL has been able to create an entry barrier in this segment by patenting its technology. Apart from this, the company has been able to develop several additional fabricated applications other than tarpaulin from the film which has enabled it to capture market share from incumbent players.
Consumer products
SIL is the second-largest player in this segment with current processing capacity of ~30,000mt. SIL is the first player in the industry to use gas injection technology in its moulding process. It is also the first in the industry to manufacture blow moulded furniture for various uses. The growth in this business can mainly be attributed to SIL’s focus on increasing its distribution set-up (currently has 814 channel partners) and wide acceptance of its products in the premium segment.
Institutional Equities
9 Supreme Industries
Exhibit 24 : Plastic furniture – peer sales Exhibit 25: SIL’s market share in plastic furniture industry
Source: Company, Nirmal Bang Institutional Equities Research Source: Company, Nirmal Bang Institutional Equities Research
SIL has been increasing its product portfolio in the consumer segment YoY. SIL is also exploring export market opportunities for its products. This segment has 60% organised players while the rest 40% is dominated by unorganised players. With GST rollout ,we expect some volume benefit to flow in for the likes of SIL, Nilkamal and Wim Plast.
Industrial products
SIL is a major player in the industrial product segment, operating in two sub-segments – industrial components and material handling products. The company is the first to launch injection-moulded pallets. The industrial component segment mainly caters to automobile and consumer appliance industries. Some of its clients in the automobile component segment include Piaggio, Honda, Bajaj Auto etc. Clients in consumer appliance segment include air-conditioner or AC manufacturers and washing machine manufacturers such as Whirlpool of India.
The material handling division manufactures industrial crates, pallets, and bottle crates. One of the major reason why SIL has been successful in this segment is because it has designed a crate model to service some large customers and has been successful in obtaining sizable business. The company is ensured of sustained business from this segment for the next few years. Apart from crates, SIL has managed to gain expertise in the manufacture of pallets, used expecially in supply chain and warehousing segments. SIL currently holds 13.5% market share in this segment having a market size of Rs18,000mn.
Exhibit 26: SIL’s market share in Material handling sub-segment
Source: Company, Nirmal Bang Institutional Equities Research
3,130
21,000
3,570
1,268 1,050
-
5,000
10,000
15,000
20,000
25,000
Supreme Industries
Nilkamal Wim Plast Prima Plastics National plastics
(Rsmn)
10%
70%
12%
4%3%
Supreme Industries Nilkamal Wim Plast Prima Plastics National plastics
14%
86%
Supreme Industries Other
Institutional Equities
10 Supreme Industries
Composite cylinders
As a part of the new initiatives SIL forayed into this segment in 2012. Apart from SIL, Time Technoplast is the only other company in India operating in this segment. SIL currently has capacity of 450,000 units per year while in case of Time Technoplast it is 700,000 units per year.
Entry barriers in this segment are extremely high, given the number of approvals required from government bodies. SIL has signed a Memorandum of Understanding or MoU with the Bangladesh government for 250,000 composite LPG cylinders and received an initial order for 30,000 units in 4QFY17. Apart from the Bangladesh government, SIL is trying to get orders from Indian oil marketing companies (OMCs). SIL has received initial educational order from Hindustan Petroleum Corporation (HPCL).
Product innovation and technical collaboration
SIL, over the years, went for technical collaborations with international players to supplement its production capability and cater to new applications coupled with a low-cost manufacturing base.
Exhibit 27: Technical collabtorators of SIL
Company Product line
Rasmussen Polymer Development, Switzerland Cross-laminated films
Wavin, Netherlands Plastic Piping systems
Foam Partner, Switzerland Reticulated PU foam
Sanwa Kako, Japan 2 stage foam
PE Tech, Korea Cross-linked foam
Kumi Kasai, Japan Automotive components
Lomold (PTY) ltd. Composite pallets
Kautex GMBH Composite LPG cylinders
Spears Mfg. Co. LA, USA Fire sprinklers pipes from CPVC
Source: Company, Nirmal Bang Institutional Equities Research
SIL’s strong technical collaborations with international players have enabled it to introduce various path-breaking technologies.In the plastic pipe segment, SIL introduced S.W.R drainage system, silent pipe system, acqua gold high pressure plumbing system, hot and cold water system, underground drainage system, CPVC fire sprinklers, and HDPE pipe system for sewerage and drainage etc. In the furniture segment, SIL has been a pioneer in lacquered furniture, upholstered moulded plastic furniture etc. SIL is the only Indian company which has the technology to manufacture patented cross-laminated film products under its brand Silpaulin. Silpaulin is one-seventh the weight of conventional cotton tarpaulin, but also has a high strength-to-weight ratio. The company has launched many innovative products in India in the packaging segment which mainly includes reticulated foam for air filtration, sound absorbing open cell foam, high temperature and fire-resistant melamine foam, waterproofing membrane made from composites of foam products, bonded foam for acoustic insulation, floor protector made from foam and XF film. In the industrial products segment, SIL is the first to launch injection-moulded plastic pallets.
Through sustained product innovation, SIL increased its product portfolio catering to multiple industries. Strong technical collaboration has enabled SIL to increase the contribution from value added products (operating margin of > 17%) from 29.8% in FY12 to 37.5% in FY17. Sales of these value-added products rose from Rs8,350mn to Rs16,412mn over FY12-FY17.
Institutional Equities
11 Supreme Industries
Investment Arguments: Key growth and margin drivers
Government initiatives and higher contribution from VAPs to drive top-line growth of plastic pipe segment
The plastic pipe segment is core business segment of SIL. The company’s growth over FY13-FY17 was mainly driven by 8% volume growth and 3% value growth of plastic pipe segment. Contribution from this segment moved up swiftly from 49.9% in FY13 to 55.4% in FY17. Operating margin of this segment broadly remained flattish (on a high base of 16% in FY13) over FY13-FY17. We expect volume/sales from this segment to post a CAGR of 12%/17%, respectively, over FY17-FY19E mainly on account of: 1) Government initiatives such as Housing For All and Swach Bharat Mission. 2) Capacity addition in Assam and Telangana. 3) Conversion from GI (galvanised iron) pipes to PVC pipes. 4) A normal monsoon.
Note: SIL changed its financial year end from June to March in FY16. FY16 is a 9 months period. For growth, numbers are annualized.
Source: Company, Nirmal Bang Institutional Equities Research
Note: SIL changed its financial year end from June to March in FY16. FY16 is a 9 months period. For growth, numbers are annualized.
Source: Company, Nirmal Bang Institutional Equities Research
New capacities & higher VAP contribution to drive plastic
piping segment growth
New capacity addition to drive industrial component growth
Growth in VAPs to keep margins protected
Supreme Petrochem (29.99%) to be positive PAT contributor
175,513 187,953
204,264
163,031
235,257
261,135
293,777
-
50,000
100,000
150,000
200,000
250,000
300,000
350,000
FY13 FY14 FY15 FY16 FY17 FY18E FY19E
(mt)
17,020
20,601 21,125
16,053
24,530
28,590
33,772
-
5,000
10,000
15,000
20,000
25,000
30,000
35,000
40,000
FY13 FY14 FY15 FY16 FY17 FY18E FY19E
(Rsmn)
Institutional Equities
12 Supreme Industries
Exhibit 30: Operating profit margin of plastic pipes Exhibit 31: Rising contribution of plastic pipes to total sales
Source: Company, Nirmal Bang Institutional Equities Research Source: Company, Nirmal Bang Institutional Equities Research
Demonetisation in 3QFY17 and its spill-over effect in 4QFY17 led to moderate volume growth of 9% in FY17. The major impact was on agricultural pipe segment. However, with expectation of a better monsoon in FY18, we believe that demand from the agricultural sector for plastic pipes will revive. Apart from a better monsoon, the Central government’s initiative of Housing for All by 2022 will drive incremental volume growth for SIL’s plastic pipe segment. Prime Minister Mr. Narendra Modi aims to build 50mn houses over the next five years. Affordable housing itself is expected to lead the plastic pipe segment’s CAGR to 14% over FY17-FY24E, as per industry reports. SIL Astral Poly, Finolex Industries and Ashirvad Pipes, being the key players in the housing segment, will be natural benefeciaries of the government’s housing drive. Swach Bharat Mission is another flagship programme of the government, under which it intends to construct individual houshold toilets, cluster toilets and commumity toilets. As per an industry report, ~55% of the Indian households still lack basic sanitation facilities. This provides a huge opportunity for PVC and sewrage pipe manufacturers such as SIL.
We believe that with these two flagship initiatives of the government, capacity addition in plastic pipe units at Assam and Telangana is another important growth lever that will lead to healthy volume growth for SIL. Currently,no big plastic pipe player has an installed capacity in the eastern region. SIL is the first company to build a plant in Assam. With no competition and the first-mover advantage, we expect SIL to capture significant market share in the eastern region.
Apart from the above stated growth levers, a normal monsoon and sustained conversion from GI pipes to PVC pipes will drive SIL’s plastic pipe segment’s volume growth. We expect this segment to post a 12% volume CAGR over FY17-FY19E. With a slightly better contribution from value added products, we believe the plastic pipe segment’s realisation will post a CAGR of 5% over FY17-FY19E, leading to top-line growth of 17% for the plastic pipe segment.
New capacity addition at Rajasthan plant for industrial components to be another growth lever
In the industrial products segment, there are two sub-segments: 1) Industrial components. 2)Material handling. Automotive and consumer durable are the two major segments to which SIL’s inustrial components segment caters to. The material handling segment manufactures crates and pallets for soft drink, beverage, industrial, warehousing, retailing, dairy and fishery entities. The industrial product segment, as a whole, remained sluggish during FY13-FY17 and has grown 1%. However, we believe this segment will revive mainly on account of: 1) New plant at Rajasthan for industrial components. 2) Sustained demand from soft drink and beverage industries.
Note: SIL changed its financial year end from June to March in FY16. FY16 is a 9 months period. For growth, numbers are annualized.
Source: Company, Nirmal Bang Institutional Equities Research
Note: SIL changed its financial year end from June to March in FY16. FY16 is a 9 months period. For growth, numbers are annualized.
Source: Company, Nirmal Bang Institutional Equities Research
Exhibit 34: Industrial component operating profit margin Exhibit 35: Industrial component segment’s contribution to total sales
Source: Company, Nirmal Bang Institutional Equities Research Source: Company, Nirmal Bang Institutional Equities Research
The industrial component segment, which caters to automotive and consumer durable entities, was partially impacted during the demonetisation period. However, since the start of 4QFY17, demand picked up on expectation of a better monsoon. The segment grew13% and 11% in volume/value terms, respectively, in FY17. In FY17, the company started supplies for the SR150 two-wheeler project of Piaggio. Apart from this, SIL supplied for Honda City car (domestic and export markets), SUV and new mini SUV models in FY17. Development of components of several models of Maruti Suzuki India and Honda is currently on. SIL is expected to get new business from existing clients for their new vehicle progamme.
On the consumer appliance side, SIL achieved healthy growth driven by good demand from Whirlpoool of India to meet the requirement of its washing machine segment. Apart from Whirlpool of India, there was encouraging demand from other appliance manufacturers such as Samsung and Bosch. We believe that with consistency in quality and cost-effectiveness, SIL will maintain a healthy volume growth in this segment.
SIL is expected to start greenfield expansion of its plant in Giloth, Rajasthan, for manufacturing componets for Daikin ACs. We expect incremental volume from this plant to start flowing in FY18.
The material handling segment, which caters to the soft drink and beverage industries, is expected to deliver sustained growth over FY18-FY19. The bottle crate business bounced back in FY17 by registering a growth of 26%. Bottle crate segment is expected to grow 20% over the next couple of years. SIL is also expected to benefit from the Swachh Bharat Mission of the governmenti n various states. The long range of garbage bins, pallets and sustained customised addition will yield better results for SIL. The company is expected to double it sales from the current level in the next one year.
Thus, with new plant addition at Rajasthan, healthy growth in bottle crate and garbage bin sales and steady growth in the automobile component segment will lead to volume/value growth of 11%/14%, respectively over FY17-FY19E.
39,793
33,621 37,470
26,039
38,984 42,882
48,028
-
10,000
20,000
30,000
40,000
50,000
60,000
FY13 FY14 FY15 FY16 FY17 FY18E FY19E
(mt)
6,070 6,002 6,482
4,157
6,230
7,059
8,143
-
1,000
2,000
3,000
4,000
5,000
6,000
7,000
8,000
9,000
FY13 FY14 FY15 FY16 FY17 FY18E FY19E
(Rsmn)
12.0%
10.9%
12.1% 12.3%
13.4%
0%
2%
4%
6%
8%
10%
12%
14%
16%
FY13 FY14 FY15 FY16 FY17
EBITDAM (%)
17.816.7
15.214.0 14.1
0
2
4
6
8
10
12
14
16
18
20
FY13 FY14 FY15 FY16 FY17
Sales contribution (%)(%)
Institutional Equities
14 Supreme Industries
Sustained growth in value added products (VAPs) to keep margins elevated
SIL has consistenly launched products catering to niche applicationswhich led to the rise in value-added products (operating margin of >17%). Sales contribution from value added products posted a CAGR of 14% over FY12-FY17. Sales from value added products, as percentage of total sales, increased from 30% in FY12 to 38% in FY17. SIL’s sales from cross-laminated films (Silpaulin) and composite cylinders completely come under the VAP category.
Source: Company, Nirmal Bang Institutional Equities Research Source: Company, Nirmal Bang Institutional Equities Research
Sales of composite cylinders are expected to pick up from FY18. SIL has already delivered 30,000 units to the Bangladesh government in FY17. The MoU with the Bangladesh government is for supply of 250,000 units. Sales to HPCL and other Indian OMCs are expected to show some traction in the next two years.SIL has also made a breakthrough in overseas markets, manly Russia and South Korea.
Sales of value added products from the plastic pipe segment consistently increased over FY12-FY17. Their contribution went up from 23% of the plastic pipe segment’s sales to 32% by the end of FY17. Except for a small decline in FY17, sales contribution from value added products in the plastic pipe segment increased every year for the past six years. Sales of value added products in the plastic pipe segment posted a CAGR of 21% over FY12-FY17. We expect a similar trend over FY17-FY19E.
SIL’s management has smartly increased the share of value added products in segments where it expects modest growth. Moulded furniture segment posted a CAGR of just 3.2% over FY12-FY17. However, over the same period the sales contribution from value added products in that segment went up from 36% in FY12 to 52% in FY17. SIL has set up a greenfield project to manufacture blow moulded furniture at Kharagpur with an initial investment of Rs240mn. The company launched four models in the blow moulded furniture segment and expects to launch seven more by the end of 2QFY18.
23%
27%
28%
30%
33%
32%
20%
22%
24%
26%
28%
30%
32%
34%
36%
FY12 FY13 FY14 FY15 FY16 FY17
36%38%
49%48% 48%
52%
20%
25%
30%
35%
40%
45%
50%
55%
FY12 FY13 FY14 FY15 FY16 FY17
36%35%
32%30%
33%
44%
20%
25%
30%
35%
40%
45%
50%
FY12 FY13 FY14 FY15 FY16 FY17
30%
31%32%
34%
37%38%
20%
22%
24%
26%
28%
30%
32%
34%
36%
38%
40%
FY12 FY13 FY14 FY15 FY16 FY17
Institutional Equities
15 Supreme Industries
Exhibit 40: VAP sales growth in plastic pipe segment Exhibit 41: VAP sales growth in moulded furniture segment
Source: Company, Nirmal Bang Institutional Equities Research Source: Company, Nirmal Bang Institutional Equities Research
Exhibit 42: Total VAP sales growth
Note: SIL changed its financial year end from June to March in FY16. FY16 is a 9 months period. For growth, numbers are annualized.
Source: Company, Nirmal Bang Institutional Equities Research
SIL’s profitability is moderately susceptible to volatility in the prices of its key raw materials – poly vinyl chloride (PVC), polyethylene, and polypropylene (PP). Prices of all these raw materials are linked to crude oil prices. SIL has continously strived to reduce the linkage of its performance to crude oil prices by increasing the proportion of high-margin speciality products in its portfolio. Thus, with the rising contribution of value added products in the plastic pipe and composite cylinders segments, we expect the margins to remain protected at above 17% level in FY18 and FY19.
Other key drivers
Supreme Petrochem: A joint venture between SIL and the Rajan Raheja group, Supreme Petrochem entered the polystyrene market with a capacity of 66,000mt per annum. in October 1995 by setting up a plant on a 332-acre complex at Amdoshi in Maharashtra. Over a period of 21 years, the company expanded its capacity in the verticals stated below. SIL owns 29.99% stake in Supreme Petrochem (SPL).
Exhibit 43: SPL’s product portfolio and respective capacities of individual products
Source: Company, Nirmal Bang Institutional Equities Research
3,057
4,532
5,713
6,407
5,359
7,786
-
1,000
2,000
3,000
4,000
5,000
6,000
7,000
8,000
9,000
FY12 FY13 FY14 FY15 FY16 FY17
(Rsmn)
972 1,052
1,259 1,314
1,050
1,631
-
200
400
600
800
1,000
1,200
1,400
1,600
1,800
FY12 FY13 FY14 FY15 FY16 FY17
(Rsmn)
9,801
11,815
14,140
15,872
12,467
18,554
-
2,000
4,000
6,000
8,000
10,000
12,000
14,000
16,000
18,000
20,000
FY12 FY13 FY14 FY15 FY16 FY17
(Rsmn)
Institutional Equities
16 Supreme Industries
Over the years, SPL acquired an unit at Manali near Chennai. All these investments were made with original equity capital. SPL has bought back and extinguished 1.87mn shares through its two buy-back programmes in FY09 and FY14, respectively, and reduced its share capital to Rs18.7mn. SPL is now a debt-free company. SPL’s sales/EBITDA/PAT over the past five years (FY13-FY17) have shown a CAGR of -0.4%/15.6%/25.3%, respectively. We believe that SPL will remain a positive contributor to SIL revenues at the PAT level.
Andheri commerical complex chamber
SIL owns a commercial complex in Andheri, Mumbai, spread over a total area of 94,000 sq.ft. Total construction includes ground plus10 storeys and two levels of basement. Other facilities in the complex include a health club, conference room, parking space for more than 350 cars and diesel generator back-up, The green building has platinum rating from the USGBC, pocket terraces at different levels, terrace garden, cafeteria, six high-speed elevators and two service elevators.
Total saleable area is ~0.28mn sq.ft. with the total project cost being Rs1,450mn. Till March 2017, SIL sold 0.21mn sq.ft. with the net proceeds being Rs3,380mn. One unit on the ground floor is kept for company use. Estimated sales from the unsold area is ~Rs1,000mn – Rs1,200mn. SIL can monetise this real estate in the near future. This cash can possibly be used to repay remaining debt or utilised for capacity expansion.
Note: Except for Supreme Industries, others are Bloomberg Estimates
Source: Bloomberg, Company, Nirmal Bang Institutional Equities Research
Supreme Industries among its peers has got the best EBITDA margins (exl. Wim Plast) and superior asset turnover leading to Return on Invested Capital (RoIC), Return on Capital (RoC) and Return on Equity (RoE) of 20%/22%/28% respectively, better than all its peers. Cash conversion cycle too at 43 days is best among the competitors.
Even though SIL has grown at modest pace of 9% at top-line and 12% at bottom-line over FY12-17, we are of opinion that high returns on invested capital are far more sustainable than high growth rates over long period of time.
Though currently Astral Poly enjoys premium valuation among its peers on account of superior future growth prospects, we believe that with expected 18% CAGR growth over FY17-19E and consistent very high RoIC and RoE, Supreme Industries’ valuation will move more towards the likes of Astral Poly’s.
Institutional Equities
17 Supreme Industries
Financials
SIL’s sutained competitive advantage over a long period is reflected by its strong financials. SIL’s minority shareholder-friendly management has rewarded its shareholders by going for share buyback, bonus issue of shares and healthy dividend payout.
Note: SIL has changed its financial year-end from June to March from FY16 and therefore FY16 is taken as 9MFY16. We have annualised the numbers to calculate growth and other ratios.Total and blended numbers excludes composite cylinder numbers
Source: Company, Nirmal Bang Institutional Equities Research
Institutional Equities
20 Supreme Industries
Company Profile
Supreme Industries Limited is India's leading plastic processing company with seven business divisions. The company has forayed into different types of plastic processing in Injection Moulding, Rotational Moulding (ROTO), Extrusion, Compression Moulding, Blow Moulding etc. Supreme Industries limited offers wide range of plastic products with a variety of applications in Moulded Furniture, Storage & Material Handling Products, XF Films & Products, Performance Films, Industrial Moulded Products, Protective Packaging Products, Composite Plastic Products, Plastic Piping System & Petrochemicals.
Company also offers the widest and most comprehensive range of plastic products in India. It has got the widest and most comprehensive range of plastic products in India. Our 25 advanced plants are powered by technology from world leaders, and complement our extensive facilities for R & D and new product development. In fact, Supreme is credited with pioneering several products in India. These include Cross- Laminated Films, HMHD Films, Multilayer Films, SWR Piping Systems and more.
Other Current assets 2,063 2,196 2,150 2,040 2,566 2,951
Total Current assets 9,661 11,040 10,388 13,361 13,187 16,403
Creditors 2,777 3,004 3,383 4,533 4,447 5,101
Other current liabilities 2,732 3,627 2,455 3,228 3,553 4,377
Total current liabilities 5,509 6,632 5,838 7,760 8,000 9,478
Net current assets 4,152 4,409 4,550 5,601 5,187 6,925
Total Assets 16,285 16,939 18,333 20,455 21,402 24,354
Note: SIL has changed its financial year-end from June to March from FY16 and therefore FY16 is taken as 9MFY16. We have annualised the numbers to calculate growth and other ratios.
Source: Company, Nirmal Bang Institutional Equities Research
Exhibit 58: Cash flow
Y/E March (Rsmn) FY14 FY15 FY16 FY17 FY18E FY19E
EBIT 4,873 5,273 3,566 6,076 6,860 8,059
(Inc.)/Dec in working capital (1,427) 1,288 (1,670) (542) 677 (1,153)
Cash flow from operations 3,445 6,561 1,896 5,534 7,537 6,907
Net cash from operations 1,245 4,256 673 3,622 5,185 4,154
Capital expenditure (-) (1,468) (1,665) (2,244) (2,113) (3,146) (3,193)
Net cash after capex (223) 2,591 (1,571) 1,508 2,040 960
Inc./(Dec.) in short-term borrowing (301) (480) 1,881 (1,321) (400) (300)
Inc./(dec.) in long-term borrowing 329 (317) (1,681) (474) (75) (75)
Inc./(Dec.) in preference capital - - - - - -
Inc./(dec.) in borrowings 28 (798) 200 (1,794) (475) (375)
(Inc.)/Dec. in investments 24 (133) (55) (483) - -
Equity issue/(Buyback) (0) 0 0 - - -
Cash from Financial Activities 51 (931) 145 (2,278) (475) (375)
Others 206 (116) (117) 1,278 (1,301) 0
Opening cash 239 274 1,818 289 798 1,062
Closing cash 274 1,818 289 798 1,062 1,647
Change in cash 35 1,545 (1,529) 509 264 585
Source: Company, Nirmal Bang Institutional Equities Research
Exhibit 60: Key ratios
Y/E March FY14 FY15 FY16 FY17 FY18E FY19E
Per share (Rs)
EPS 20.4 25.4 23.2 33.7 39.7 46.5
Book value 81.8 95.4 103.5 133.5 144.0 169.3
Valuation (x)
P/E 59.0 47.3 51.7 35.6 30.2 25.8
P/sales 3.8 3.6 3.8 3.4 3.0 2.6
P/BV 14.7 12.6 11.6 9.0 8.3 7.1
EV/EBITDA 26.5 23.0 25.2 20.0 17.6 15.0
EV/sales 3.9 3.6 3.9 3.4 3.0 2.6
Return ratios (%)
RoCE 22.7 22.5 18.2 21.7 23.0 24.7
RoE 27.0 28.6 23.3 28.4 28.6 29.7
Margins (%)
EBITDA margin 14.9 15.7 15.5 17.1 17.0 17.2
PBIT margin 12.3 12.4 12.0 13.6 13.5 13.8
PBT margin 10.5 11.1 10.8 13.1 13.4 13.7
PAT margin 6.5 7.6 7.4 9.6 9.9 10.1
Turnover ratios
Asset turnover (x) 2.4 2.5 2.2 2.2 2.4 2.4
Avg. inventory period (days) 53 47 60 62 60 65
Avg. collection period (days) 21 20 21 19 18 19
Avg. payment period (days) 30 30 36 38 38 38
Solvency ratios (x)
Debt-equity 0.5 0.3 0.3 0.1 0.1 0.1
Interest coverage 6.4 9.1 17.2 20.1 51.1 75.3
Debt/EBITDA 0.8 0.6 0.7 0.3 0.2 0.1
Growth (%)
Sales 16.4 7.4 (6.8) 12.5 13.7 15.0
EBITDA 9.9 13.1 (7.7) 23.9 13.3 16.3
PAT (9.0) 24.7 (8.5) 45.1 17.7 17.2
Source: Company, Nirmal Bang Institutional Equities Research
Institutional Equities
23 Supreme Industries
Rating track Date Rating Market price (Rs) Target price (Rs)
14 December 2012 Buy 292 385
24 January 2013 Buy 296 385
26 April 2013 Buy 314 385
9 July 2013 Buy 332 385
19 July 2013 Buy 360 450
7 October 2013 Buy 343 450
30 October 2013 Hold 395 450
7 January 2014 Hold 424 450
23 January 2014 Hold 452 491
11 April 2014 Hold 484 491
25 April 2014 Hold 479 491
4 July 2014 Accumulate 550 621
22 July 2014 Accumulate 589 621
10 October 2014 Accumulate 643 621
20 October 2014 Buy 588 683
23 January 2015 Accumulate 596 622
27 April 2015 Accumulate 669 643
10 July 2015 Accumulate 672 643
27 July 2015 Accumulate 628 617
13 October 2015 Accumulate 634 617
30 October 2015 Under Review 638 -
27 January 2016 Under Review 689 -
22 April 2016 Under Review 798 -
29 July 2016 Under Review 924 -
28 October 2016 Under Review 904 -
27 January 2017* Buy 911 1,145
2 May 2017 Buy 1,088 1,398
* Coverage transferred to Akhil Parekh
Institutional Equities
24 Supreme Industries
Disclaimer
Stock Ratings Absolute Returns
BUY > 15%
ACCUMULATE -5% to15%
SELL < -5%
This report is published by Nirmal Bang’s Institutional Equities Research desk. Nirmal Bang group has other business units with independent research teams separated by Chinese walls, and therefore may, at times, have different or contrary views on stocks and markets. Reports based on technical and derivative analysis may not match with reports based on a company's fundamental analysis. This report is for the personal information of the authorised recipient and is not for public distribution. This should not be reproduced or redistributed to any other person or in any form. This report is for the general information for the clients of Nirmal Bang Equities Pvt. Ltd., a division of Nirmal Bang, and should not be construed as an offer or solicitation of an offer to buy/sell any securities.
We have exercised due diligence in checking the correctness and authenticity of the information contained herein, so far as it relates to current and historical information, but do not guarantee its accuracy or completeness. The opinions expressed are our current opinions as of the date appearing in the material and may be subject to change from time to time without notice.
Nirmal Bang or any persons connected with it do not accept any liability arising from the use of this document or the information contained therein. The recipients of this material should rely on their own judgment and take their own professional advice before acting on this information. Nirmal Bang or any of its connected persons including its directors or subsidiaries or associates or employees or agents shall not be in any way responsible for any loss or damage that may arise to any person/s from any inadvertent error in the information contained, views and opinions expressed in this publication.
Nirmal Bang Equities Private Limited (hereinafter referred to as “NBEPL”) is a registered Member of National Stock Exchange of India Limited, Bombay Stock Exchange Limited. NBEPL has registered with SEBI as a Research Entity in terms of SEBI (Research Analyst) Regulations, 2014. (Registration No: INH000001436 -19.08.2015 to 18.08.2020).
NBEPL or its associates including its relatives/analyst do not hold any financial interest/beneficial ownership of more than 1% in the company covered by Analyst.
NBEPL or its associates/analyst has not received any compensation from the company covered by Analyst during the past twelve months. NBEPL /analyst has not served as an officer, director or employee of company covered by Analyst and has not been engaged in market-making activity of the company covered by Analyst.
The views expressed are based solely on information available publicly and believed to be true. Investors are advised to independently evaluate the market conditions/risks involved before making any investment decision.
Access all our reports on Bloomberg, Thomson Reuters and Factset.