2D & 3D Nonlinear Dynamic Analysis of an Asphaltic Concrete Core Rockfill Dam (a Case Study) A. Akhtarpour Ph.D., Maharab Consulting Engineers Co., Mashhad, Iran. [email protected]A. Khodaii Ph.D., Department of Civil and Environmental Engineering, Amirkabir University of Technology, Tehran, Iran. ABSTRACT: 2D & 3D nonlinear numerical analyses have been performed for the highest dam with asphalt concrete core in Iran (Shur River Dam) under seismic forces. The dam has 85 meters height and is under Construction in an area with high earthquake hazard with MDE equal to 0.8 g. Different stages of construction and impounding were analyzed using the hyperbolic model with Finite Difference Method. Nonlinear dynamic analyses were performed to investigate asphaltic core behavior under earthquake loading. Both 2D & 3D analysis confirms that earthquake shock can lead to developing some small cracks and increasing permeability of asphalt in the upper part of the core, also maximum vertical deformations occur near the crest and at the lower part of the upstream slope. But there are some differences between 2 & 3D analysis. The pattern of the core deformation in 2D analysis includes settlements of the shells behind the asphaltic core and the core remains upright but 3D analysis shows that the core can settle with the neighbor shells. Furthermore 2D analysis shows more settlements and less crest accelerations in comparison with 3D analysis. Shear strains in the asphaltic core have different trends in the two types of analyses. Keywords: Dynamic behavior, 2 & 3D nonlinear dynamic analysis, Asphaltic concrete core dam, High seismic hazard 1. INTRODUCTION Asphaltic concrete has been used for 50 years as an impervious interior core in hydraulic structures such as embankment dams (Hoeg 1993, ICOLD 1992). Monitoring of these dams has indicated their good behavior during construction and operation for many years. However, most of the dams have been constructed in regions with low or moderate earthquake hazard and there is not any publication on actual dam behavior under severe earthquakes, so behavior of asphaltic concrete as an impervious water barrier in high seismic hazard areas needs more attention and exploration (Hoeg 2005). Recently some researchers published a few publications on the dynamic response of the asphaltic core dams (Salemi 2003, Feizi 2004, and Ghanooni 2002). They concluded that there are some concerns about possibility of cracking in the upper part of the asphaltic core. The data from Shur dam with the height of 85 m which is under construction was selected as a study case. Results of 2D nonlinear numerical dynamic analysis by authors have been published in the past (Akhtarpour and Khodaii 2009). In this study a comparison between 2 and 3D analysis is presented. 2. THE SHUR RIVER DAM Shur dam that is under construction in south of Kerman province, is the highest concrete core rockfill dam in Iran. It has a height of about 85 meters and is located in a U shaped long valley. The crest length of the dam is about 450m and the vertical asphaltic concrete core, as a watertight element, has 1.2m width at the bottom decreasing to 0.6 m on the top, and is surrounded by filters (zones 2a) and transitions in upstream and downstream (zones 2b). The seismicity of the region is very high with MDE equal to 0.8g (ATC 2008). Figure 1. Typical cross section of the Shur dam 3. FINITE DIFFERENCE METHOD 3.1. Overview Two and three dimensional, dynamic deformation analysis of the Shur River Dam was performed using FLAC program and its built-in elasto-plastic model of
Transcript
2D & 3D Nonlinear Dynamic Analysis of an Asphaltic Concrete Core Rockfill Dam (a Case Study)
Ph.D., Department of Civil and Environmental Engineering, Amirkabir University of Technology, Tehran, Iran. 1 ABSTRACT: 2D & 3D nonlinear numerical analyses have been performed for the highest dam with asphalt concrete core in Iran (Shur River Dam) under seismic forces. The dam has 85 meters height and is under Construction in an area with high earthquake hazard with MDE equal to 0.8 g. Different stages of construction and impounding were analyzed using the hyperbolic model with Finite Difference Method. Nonlinear dynamic analyses were performed to investigate asphaltic core behavior under earthquake loading. Both 2D & 3D analysis confirms that earthquake shock can lead to developing some small cracks and increasing permeability of asphalt in the upper part of the core, also maximum vertical deformations occur near the crest and at the lower part of the upstream slope. But there are some differences between 2 & 3D analysis. The pattern of the core deformation in 2D analysis includes settlements of the shells behind the asphaltic core and the core remains upright but 3D analysis shows that the core can settle with the neighbor shells. Furthermore 2D analysis shows more settlements and less crest accelerations in comparison with 3D analysis. Shear strains in the asphaltic core have different trends in the two types of analyses. Keywords: Dynamic behavior, 2 & 3D nonlinear dynamic analysis, Asphaltic concrete core dam, High seismic hazard
1. INTRODUCTION Asphaltic concrete has been used for 50 years as an impervious interior core in hydraulic structures such as embankment dams (Hoeg 1993, ICOLD 1992). Monitoring of these dams has indicated their good behavior during construction and operation for many years. However, most of the dams have been constructed in regions with low or moderate earthquake hazard and there is not any publication on actual dam behavior under severe earthquakes, so behavior of asphaltic concrete as an impervious water barrier in high seismic hazard areas needs more attention and exploration (Hoeg 2005). Recently some researchers published a few publications on the dynamic response of the asphaltic core dams (Salemi 2003, Feizi 2004, and Ghanooni 2002). They concluded that there are some concerns about possibility of cracking in the upper part of the asphaltic core. The data from Shur dam with the height of 85 m which is under construction was selected as a study case. Results of 2D nonlinear numerical dynamic analysis by authors have been published in the past (Akhtarpour and Khodaii 2009). In this study a comparison between 2 and 3D analysis is presented. 2. THE SHUR RIVER DAM
Shur dam that is under construction in south of Kerman province, is the highest concrete core rockfill dam in Iran. It has a height of about 85 meters and is located in a U shaped long valley. The crest length of the dam is about 450m and the vertical asphaltic concrete core, as a watertight element, has 1.2m width at the bottom decreasing to 0.6 m on the top, and is surrounded by filters (zones 2a) and transitions in upstream and downstream (zones 2b). The seismicity of the region is very high with MDE equal to 0.8g (ATC 2008).
Figure 1. Typical cross section of the Shur dam
3. FINITE DIFFERENCE METHOD 3.1. Overview Two and three dimensional, dynamic deformation analysis of the Shur River Dam was performed using FLAC program and its built-in elasto-plastic model of
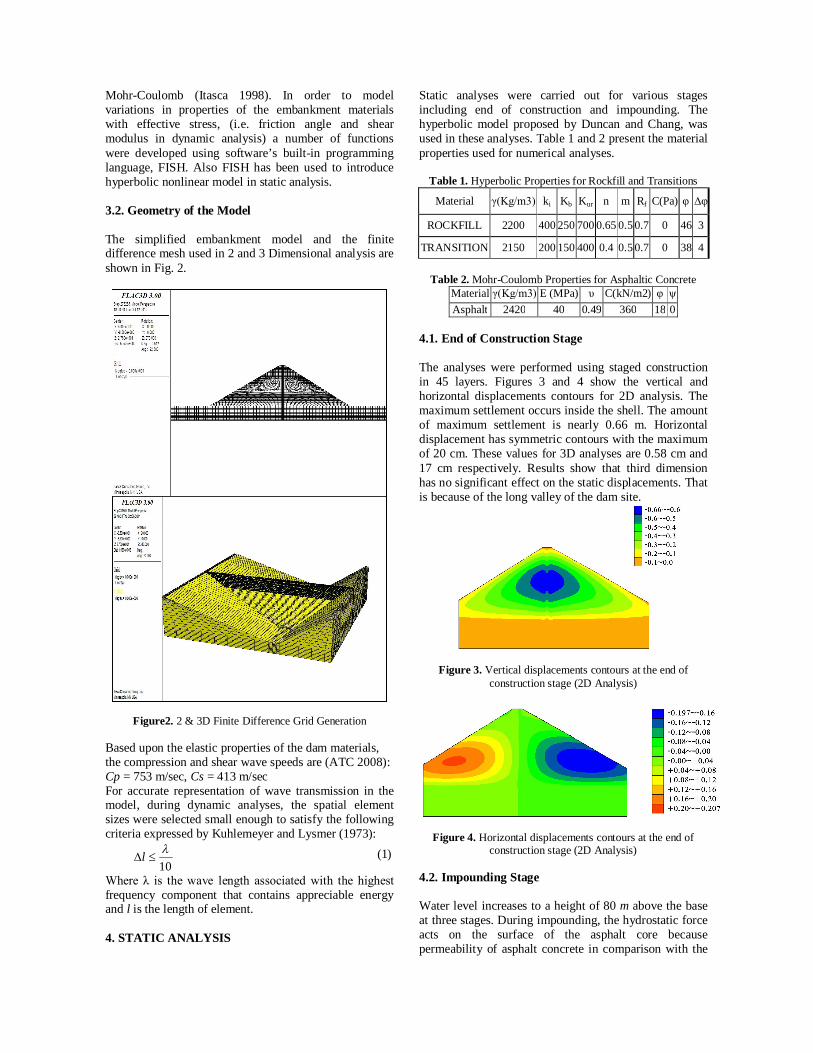
Mohr-Coulomb (Itasca 1998). In order to model variations in properties of the embankment materials with effective stress, (i.e. friction angle and shear modulus in dynamic analysis) a number of functions were developed using software’s built-in programming language, FISH. Also FISH has been used to introduce hyperbolic nonlinear model in static analysis. 3.2. Geometry of the Model The simplified embankment model and the finite difference mesh used in 2 and 3 Dimensional analysis are shown in Fig. 2.
Figure2. 2 & 3D Finite Difference Grid Generation
Based upon the elastic properties of the dam materials, the compression and shear wave speeds are (ATC 2008): Cp = 753 m/sec, Cs = 413 m/sec For accurate representation of wave transmission in the model, during dynamic analyses, the spatial element sizes were selected small enough to satisfy the following criteria expressed by Kuhlemeyer and Lysmer (1973):
10
l (1)
Where λ is the wave length associated with the highest frequency component that contains appreciable energy and l is the length of element. 4. STATIC ANALYSIS
Static analyses were carried out for various stages including end of construction and impounding. The hyperbolic model proposed by Duncan and Chang, was used in these analyses. Table 1 and 2 present the material properties used for numerical analyses.
Table 1. Hyperbolic Properties for Rockfill and Transitions ∆φ φ C(Pa) Rf m n Kur Kb ki γ(Kg/m3) Material
3 46 0 0.7 0.5 0.65 700 250 400 2200 ROCKFILL
4 38 0 0.7 0.5 0.4 400 150 200 2150 TRANSITION
Table 2. Mohr-Coulomb Properties for Asphaltic Concrete
ψ φ C(kN/m2) υ E (MPa) γ(Kg/m3) Material 0 18 360 0.49 40 2420 Asphalt
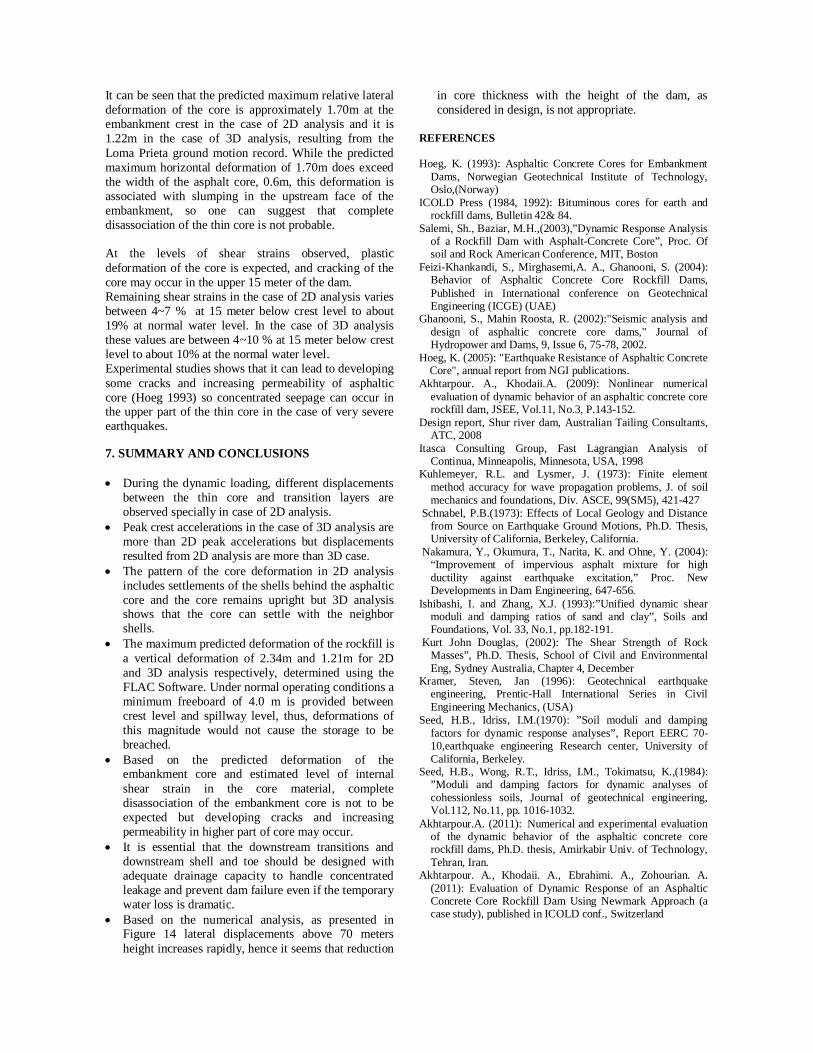
4.1. End of Construction Stage The analyses were performed using staged construction in 45 layers. Figures 3 and 4 show the vertical and horizontal displacements contours for 2D analysis. The maximum settlement occurs inside the shell. The amount of maximum settlement is nearly 0.66 m. Horizontal displacement has symmetric contours with the maximum of 20 cm. These values for 3D analyses are 0.58 cm and 17 cm respectively. Results show that third dimension has no significant effect on the static displacements. That is because of the long valley of the dam site.
Figure 3. Vertical displacements contours at the end of construction stage (2D Analysis)
Figure 4. Horizontal displacements contours at the end of construction stage (2D Analysis)
4.2. Impounding Stage Water level increases to a height of 80 m above the base at three stages. During impounding, the hydrostatic force acts on the surface of the asphalt core because permeability of asphalt concrete in comparison with the
shell and transition materials is very low. The adopted mobility coefficients and porosities for different materials are presented in Table 3.
A coupled flow and mechanical analysis has been done for modeling this stage. Figure 5 shows the predicted pore pressure contours after first filling to full supply level. The pattern of the pore pressure contours appears to be reasonable.
Figure 5. Pore pressure contours after impounding 5. DYNAMIC ANALYSIS 5.1. Input Ground Motion ATC Consulting Engineers Co. (2008) in their seismicity report on the Sarcheshmeh site has proposed three alternative ground motion records suitable for seismic analysis. From the two horizontal components of the acceleration-time histories the most severe component was used for the modeling. All waves were normalized to MDE acceleration. Figure 6 shows time histories of the earthquakes have been used in the analysis.
Most of the energy in the input motions is at frequencies less than 15, 15 and 20 Hz for Loma Prieta, Cape Mendocino and Nahanni earthquakes respectively. The seismic records were filtered to remove frequencies greater than the above frequencies .The filtering process was performed to limit the size of elements and to ensure accurate wave transmission. After filtering was completed, the waves were corrected for a base line drift (i.e. continuing residual displacement after the motion has finished).Finally the input motion to the model was applied as a shear stress boundary in order to establish quiet boundary conditions along the same boundary as the dynamic input as suggested by the software manual.
-0.8
-0.6
-0.4
-0.2
0
0.2
0.4
0.6
0.8
1
0 5 10 15 20
Time
Acc
eler
atio
n(g) Nahhani Earthquake
-1
-0.8
-0.6
-0.4
-0.2
0
0.2
0.4
0.6
0 5 10 15 20
Time
Acc
eler
atin
(g)
Loma Prieta Earthquake
-1
-0.8
-0.6
-0.4
-0.2
0
0.2
0.4
0.6
0 5 10 15 20 25Time
Acc
eler
atio
n(g) cape mendosino Earthquake
Figure 6. Time history for Nahhani, Loma Prieta and Cape Mendocino earthquakes
5.2. Material Properties Stiffness and damping properties of the embankment materials used in the FDM analysis are summarized in Table 4, and are discussed in the following Sections.
Table 4. Dynamic Properties of Embankment Material Modulus Reduction &
* Ϭm is the mean effective stress 5.2.1. Rockfill friction angle
K. J. Douglas (2002) after analyzing a large database of test results, developed equation (2) for shear strength of rockfills:
31 '.' RFI (2) The best estimation for α is 0.8726 and RFI is a
multiplier depending on initial porosity, angularity, maximum particle size, percent of fines and unconfined compressive strength. RFI considered being 4.8607 for the shur dam rockfill (Akhtarpour and Khodaii 2008). 5.2. 2. Shear modulus The small strain shear modulus, Gmax, was determined using the methods described by Kramer (1996) and the seismic refraction test results of the main dam foundation area (ATC 2008). Gmax for the bedrock was calculated using the average shear wave velocity of 1050 m/s (measured in seismic refraction tests). For Zone 2 and Zone 3, the Gmax values were determined using the empirical relationship developed by Seed & Idriss (1970) as follows:
5.0max2max .220 mKG (3)
Where K2max is the shear modulus coefficient and it is a function of relative density and soil types. For a good quality rockfill (i.e. Zone 3), K2max ranges from 120 at the surface to 180 at depths of 100m. A value of 170 was adopted for Zone 3 rockfill. For the transition zones (Zone 2) a value of 90 was adopted (Seed 1984). Based on the large number of triaxial tests on the asphaltic concrete performed by Akhtarpour (2011), an equation was developed for Gmax of the asphalt in 22 ° temperature as below:
37.0maxmax )
100.( mKG , Kmax=321 (4)
5.2. 3. Damping An initial damping ratio of 1% was assumed for all materials as the hysteretic damping could not completely damp the high frequency components of the dynamic inputs.The adopted curves for bedrock are from Schnabel (1973), and the curves for Zone 2 and Zone 3 are from Ishibashi et al. (1993). These curves were applied to the materials in the numerical analysis. This was carried out using the built-in default hysteretic model. The default hysteretic model is the S shaped curve of modulus versus logarithm of cyclic strain which has been represented by a third degree equation, with zero slopes at both small strain and large strain. This model requires two parameters, L1 and L2 which were obtained by curve fitting on the modulus reduction curves. The Adopted Curves for Asphaltic Concrete are from Nakamura (2004) using curve fitting method on default build-in hysteretic model. Figure 7 illustrates assumed curves for asphaltic core. As it can be seen, the built-in default hysteretic model has some deviation from Nakamura, especially in middle range of shear strains.
0
0.2
0.4
0.6
0.8
1
1.2
1.00E-05 1.00E-04 1.00E-03 1.00E-02Shear Strainγ
Shea
r Mod
ulus
Rat
io(G
/Gm
ax)
0
0.1
0.2
0.3
0.4
0.5
0.6
Dam
pin
Rat
io
NAKAMURA2004FLAC-SIG3 Function
Figure 7. Reduction of shear modulus and damping ratio for asphaltic concrete core
6. SUMMARY OF ANALYSIS OF RESULTS The general pattern of deformation as a result of seismic loading is shown in Figure 8. It is evident that the predicted pattern of deformation involves settlement and slumping of the rockfill on either side of the core, while in 2D analyses the core generally remains upright, protruding from the slumped rockfill, with some lateral deformation. This is in agreement with typical behavior reported of this type of dams (Ghanooni 2002, Salemi 2003, and Feizi 2004). But in the case of 3D analysis the asphaltic core settles with the downstream shell. The main reason is possibility of lateral displacements in the asphaltic core that can lead to settlement of the core.
Figure 8. General pattern of deformation (2D analysis) As an example Crest acceleration and vertical deformation as a function of time are shown in Figures 11 and 12, for the Loma Prieta ground motion record in 2 and 3D analysis respectively. The results of the analyses are summarized in Table 4.
Crest Acceleration- Lomaprieta Earthquake
-15
-10
-5
0
5
10
15
0 5 10 15 20
Time (sec)
Acc
eler
atio
n (m
/s2)
Settlement (m)- Lomaprieta earthquake
-3
-2.5
-2
-1.5
-1
-0.5
0
0.5
0 5 10 15 20
Time (sec)
Sett
lem
ent (
m)
Figure 9. Crest acceleration and vertical deformation vs. time
for Loma Prieta earthquake (2D analysis)
Crest acceleration-Lomaprieta Erathquake
-15
-10
-5
0
5
10
15
0 5 10 15 20
Time(sec)
Acc
eler
atio
n (m
/s2)
Crest Settlement- Lomaprieta Earthquake
-1.4
-1.2
-1
-0.8
-0.6
-0.4
-0.2
0
0.2
0 5 10 15 20Time(sec)
Sett
lem
ent (
m)
Figure 10. Crest acceleration and vertical deformation vs. time
for Loma Prieta earthquake (3D analysis)
Table 4. Summary of Predicted Displacements (2D & 3D)
Earthquake
Peak Crest Acceleration
(g)
Predicted Crest Settlement, m
Core Horizontal Relative
Displacement, m U/S Core D/S Loma Prieta 1.189 -2.34 0.13 -0.36 -1.702
Nahanni 1.378 -1.016 -0.1 -0.12 -0.72 ¹ Positive horizontal displacements indicates movement in the downstream direction and vice versa
The predicted peak crest acceleration for 2D analysis varies between 0.99g to 1.2g as compared to the input peak acceleration of 0.8g implying an amplification of 1.24 to 1.5. For the 3D analysis these values are 1.1g to 1.37g for crest acceleration and 1.37 to 1.71 for amplification factor. These ranges of amplifications are expected for rockfill embankment dams based on past experience reported in many studies. It is evident that the predicted highest vertical displacement occurs at the embankment crest. These displacements attenuate rapidly with depth and indicate no evidence of significant movements of concern. The maximum crest settlement resulted from the Loma Prieta ground motion record with vertical displacements of 2.34m (Figure 9) in the case of 2D analysis and it is 1.21m (Figure 10) for 3D analysis. These values for 2D nonlinear analysis are in a good agreement with the Newmark approach deformation analysis for the dam published by authors (Akhtarpour et al. 2011). The results of the FDM analysis indicate that the maximum deformations will occur near the crest and at the lower part of the upstream slope. The magnitude of the estimated deformations appears to be large but would not be sufficient to cause loss of storage under normal operating conditions. Shear strains and lateral displacement in center of the embankment core resulting from each of the ground motion records analyzed are shown in Fig.11.
0
10
20
30
40
50
60
70
80
90
- 2.5 -2 -1.5 - 1 -0.5 0 0.5
Lateral Displacement (m)
Hei
ght (
m)
Nahhani
Loma Prieta
Cape Mendocino
0
10
20
30
40
50
60
70
80
90
-2 -1.5 -1 -0.5 0 0.5
Lateral Displacement (m)
Heig
ht (m
)
Nahhani
Loma Prieta
Cape Mendocino
0
10
20
30
40
50
60
70
80
90
0 5 10 15 20 25 30 35 40
Shear Strains(%)
Hei
ght (
m)
Nahhani
Loma Prieta
Cape Mendocino
0
10
20
30
40
50
60
70
80
90
0 5 10 15 20 25 30
Shear Strains(%)
Hei
ght (
m)
Nahhani
Loma Prieta
Cape Mendocino
(A) (B) Figure 11. Shear strains and lateral displacement of asphaltic core after earthquake loading (A): 2D analysis (B):3D analysis
Top of Asphalt
Downstream Side
Upstream Side
Top of Asphalt
Downstream Side
Upstream Side
It can be seen that the predicted maximum relative lateral deformation of the core is approximately 1.70m at the embankment crest in the case of 2D analysis and it is 1.22m in the case of 3D analysis, resulting from the Loma Prieta ground motion record. While the predicted maximum horizontal deformation of 1.70m does exceed the width of the asphalt core, 0.6m, this deformation is associated with slumping in the upstream face of the embankment, so one can suggest that complete disassociation of the thin core is not probable. At the levels of shear strains observed, plastic deformation of the core is expected, and cracking of the core may occur in the upper 15 meter of the dam. Remaining shear strains in the case of 2D analysis varies between 4~7 % at 15 meter below crest level to about 19% at normal water level. In the case of 3D analysis these values are between 4~10 % at 15 meter below crest level to about 10% at the normal water level. Experimental studies shows that it can lead to developing some cracks and increasing permeability of asphaltic core (Hoeg 1993) so concentrated seepage can occur in the upper part of the thin core in the case of very severe earthquakes. 7. SUMMARY AND CONCLUSIONS During the dynamic loading, different displacements
between the thin core and transition layers are observed specially in case of 2D analysis.
Peak crest accelerations in the case of 3D analysis are more than 2D peak accelerations but displacements resulted from 2D analysis are more than 3D case.
The pattern of the core deformation in 2D analysis includes settlements of the shells behind the asphaltic core and the core remains upright but 3D analysis shows that the core can settle with the neighbor shells.
The maximum predicted deformation of the rockfill is a vertical deformation of 2.34m and 1.21m for 2D and 3D analysis respectively, determined using the FLAC Software. Under normal operating conditions a minimum freeboard of 4.0 m is provided between crest level and spillway level, thus, deformations of this magnitude would not cause the storage to be breached.
Based on the predicted deformation of the embankment core and estimated level of internal shear strain in the core material, complete disassociation of the embankment core is not to be expected but developing cracks and increasing permeability in higher part of core may occur.
It is essential that the downstream transitions and downstream shell and toe should be designed with adequate drainage capacity to handle concentrated leakage and prevent dam failure even if the temporary water loss is dramatic.
Based on the numerical analysis, as presented in Figure 14 lateral displacements above 70 meters height increases rapidly, hence it seems that reduction
in core thickness with the height of the dam, as considered in design, is not appropriate.
REFERENCES Hoeg, K. (1993): Asphaltic Concrete Cores for Embankment
Dams, Norwegian Geotechnical Institute of Technology, Oslo,(Norway)
ICOLD Press (1984, 1992): Bituminous cores for earth and rockfill dams, Bulletin 42& 84.
Salemi, Sh., Baziar, M.H.,(2003),”Dynamic Response Analysis of a Rockfill Dam with Asphalt-Concrete Core”, Proc. Of soil and Rock American Conference, MIT, Boston
Feizi-Khankandi, S., Mirghasemi,A. A., Ghanooni, S. (2004): Behavior of Asphaltic Concrete Core Rockfill Dams, Published in International conference on Geotechnical Engineering (ICGE) (UAE)
Ghanooni, S., Mahin Roosta, R. (2002):"Seismic analysis and design of asphaltic concrete core dams," Journal of Hydropower and Dams, 9, Issue 6, 75-78, 2002.
Hoeg, K. (2005): "Earthquake Resistance of Asphaltic Concrete Core", annual report from NGI publications.
Akhtarpour. A., Khodaii.A. (2009): Nonlinear numerical evaluation of dynamic behavior of an asphaltic concrete core rockfill dam, JSEE, Vol.11, No.3, P.143-152.
Design report, Shur river dam, Australian Tailing Consultants, ATC, 2008
Itasca Consulting Group, Fast Lagrangian Analysis of Continua, Minneapolis, Minnesota, USA, 1998
Kuhlemeyer, R.L. and Lysmer, J. (1973): Finite element method accuracy for wave propagation problems, J. of soil mechanics and foundations, Div. ASCE, 99(SM5), 421-427
Schnabel, P.B.(1973): Effects of Local Geology and Distance from Source on Earthquake Ground Motions, Ph.D. Thesis, University of California, Berkeley, California.
Nakamura, Y., Okumura, T., Narita, K. and Ohne, Y. (2004): “Improvement of impervious asphalt mixture for high ductility against earthquake excitation,” Proc. New Developments in Dam Engineering, 647-656.
Ishibashi, I. and Zhang, X.J. (1993):”Unified dynamic shear moduli and damping ratios of sand and clay”, Soils and Foundations, Vol. 33, No.1, pp.182-191.
Kurt John Douglas, (2002): The Shear Strength of Rock Masses”, Ph.D. Thesis, School of Civil and Environmental Eng, Sydney Australia, Chapter 4, December
Kramer, Steven, Jan (1996): Geotechnical earthquake engineering, Prentic-Hall International Series in Civil Engineering Mechanics, (USA)
Seed, H.B., Idriss, I.M.(1970): ”Soil moduli and damping factors for dynamic response analyses”, Report EERC 70-10,earthquake engineering Research center, University of California, Berkeley.
Seed, H.B., Wong, R.T., Idriss, I.M., Tokimatsu, K.,(1984): ”Moduli and damping factors for dynamic analyses of cohessionless soils, Journal of geotechnical engineering, Vol.112, No.11, pp. 1016-1032.
Akhtarpour.A. (2011): Numerical and experimental evaluation of the dynamic behavior of the asphaltic concrete core rockfill dams, Ph.D. thesis, Amirkabir Univ. of Technology, Tehran, Iran.
Akhtarpour. A., Khodaii. A., Ebrahimi. A., Zohourian. A. (2011): Evaluation of Dynamic Response of an Asphaltic Concrete Core Rockfill Dam Using Newmark Approach (a case study), published in ICOLD conf., Switzerland