30
ASPHALTIC CONCRETE PAVEMENT DESIGN INCORPORATING LIFE CYCLE ANALYSIS – CASE STUDY OF BENIN JOHN BERNARD KORANTENG-YORKE P. O. BOX KD 610, KANDA, ACCRA, GHANA [email protected]

ASPHALTIC CONCRETE PAVEMENT DESIGN INCORPORATING
LIFE CYCLE ANALYSIS – CASE STUDY OF BENIN
JOHN BERNARD KORANTENG-YORKE
P. O. BOX KD 610, KANDA, ACCRA, GHANA

ABSTRACT
Most road pavement design methods currently in use do not give opportunity to
undertake critical evaluation of life cycle of the performance of the newly design
road pavement. In the absence of this assessment, it is always assumed that existing
road agency’s maintenance management systems will have the capacity to meet the
maintenance requirements. The setting of road maintenance policies used in the road
maintenance management systems are also not informed by the respective road
pavement designs. In some instances, a general rule is used to establish the
maintenance policy, say, all asphaltic concrete roads are due for overlay at 10 years
interval. The challenge is that current practice in road pavement design and the
maintenance are not coterminous. This paper presents an objective methodology
using Mechanistic-Empirical (M-E) pavement design approach and HDM-4 life cycle
modelling to address these problems using Benin as a case study. The case study has
given a practical demonstration of how to select and calibrate the M-E design tool
appropriate for Benin condition. Estimation of the Residual Life of the existing road
pavements to determine the investment options (rehabilitation, reconstruction,
upgrading, etc.) and the selection of appropriate pavement designs were achieved.
The selected investment options were optimised by economic analysis with the
HDM-4 which was also used to carry out Life Cycle Analysis of the optimised
pavement design to establish the maintenance regime. Finally, the financial outlay
during the design lives of the respective optimum pavement designs was
established.
Keywords; Mechanistic-Empirical design, HDM-4, Life-Cycle Analysis, Road
Maintenance, Kenlayer

1
1.0. INTRODUCTION
As part of preparation of Benin’s application for Second Compact under the
Millennium Challenge Account (MCA), selection and justification of the project
roads were required to be technically demonstrated. The Millennium Challenge
Corporation (MCC) required the following of the project roads;
A 20-year design life will be adopted;
Incorporation of parts of the existing pavement layers;
Carry out a deflection survey at selected locations to determine residual life for
20-year projection;
Propose optimised pavement design options for various road sections;
Demonstrations of several rehabilitation/reconstruction options identified for
each road project the selection of the most economically effective solution; and
Recommendation of a maintenance strategy for the completed road for each
project alternative, covering routine and periodic, including cost estimates and
implementation.
2.0. OBJECTIVE
Koranteng-Yorke, Ghataora and Odoki (2014) have developed a rational approach
for tropical pavement design using life cycle principles. The objective of this paper is
to demonstrate the practicality of the approach and how it has been applied to
achieving all expected deliverables under the Benin Case Study.
3.0. METHODOLOGY
In order to address MCC’s requirements, the following methodology was adopted;
1. Selection of a design approach and field validation of the underlying
principles.

2
2. Examination of the design tools and selection of most appropriate tool that
addresses Benin situation and with the capacity to design different types of
pavements based on local data.
3. Calibration of the design tool based on field deflection information.
4. Estimation of projected traffic and establishing the residual life of existing
pavement to inform the type of intervention.
5. Production of pavement designs using local materials.
6. Calibration of the HDM-4 model for Benin environment.
7. Selection of optimum pavement design via HDM-4 economic analysis.
8. Carry out life cycle cost analysis for respective optimum pavement designs
using HDM-4.
9. Selecting of a maintenance regime over the design life which gives a
minimum overall transport cost.
10. Financial assessment of optimum pavement over the design life for planning
and budgeting.
4.0. PAVEMENT DESIGN
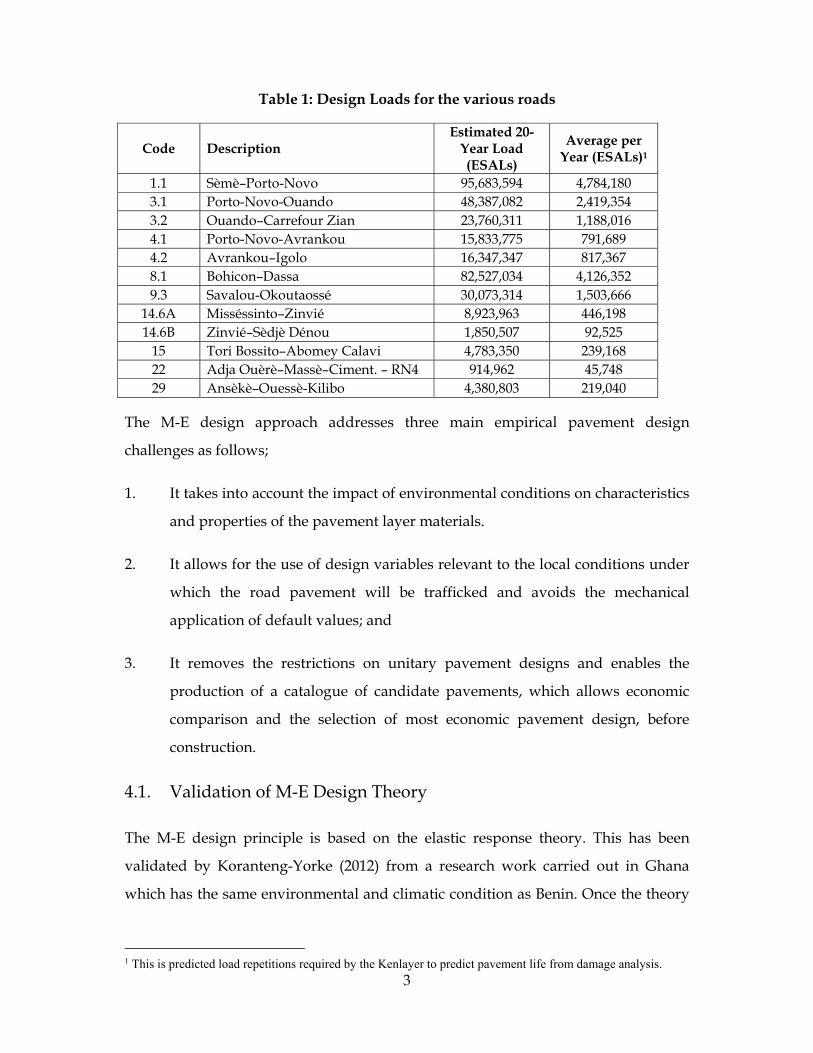
Lister et al (1982) established that in situation where, traffic volume is exceeding 10
million equivalent standard axle loads (ESALs), using empirical design method is
inaccurate. Most of the roads used under this case study have their projected traffic
loads exceeding 10 million ESALs. Table 1 shows the 12 project roads. From the
table, only four have projected traffic below 10 million ESALs. Therefore
Mechanistic-Empirical (M-E) Design approach was adopted because of its capacity
to design for uncontrolled traffic situation.
3
Table 1: Design Loads for the various roads
Code Description Estimated 20-
Year Load (ESALs)
Average per Year (ESALs)1
1.1 Sèmè–Porto-Novo 95,683,594 4,784,180 3.1 Porto-Novo-Ouando 48,387,082 2,419,354 3.2 Ouando–Carrefour Zian 23,760,311 1,188,016 4.1 Porto-Novo-Avrankou 15,833,775 791,689 4.2 Avrankou–Igolo 16,347,347 817,367 8.1 Bohicon–Dassa 82,527,034 4,126,352 9.3 Savalou-Okoutaossé 30,073,314 1,503,666
14.6A Misséssinto–Zinvié 8,923,963 446,198 14.6B Zinvié–Sèdjè Dénou 1,850,507 92,525
15 Tori Bossito–Abomey Calavi 4,783,350 239,168 22 Adja Ouèrè–Massè–Ciment. – RN4 914,962 45,748 29 Ansèkè–Ouessè-Kilibo 4,380,803 219,040
The M-E design approach addresses three main empirical pavement design
challenges as follows;
1. It takes into account the impact of environmental conditions on characteristics
and properties of the pavement layer materials.
2. It allows for the use of design variables relevant to the local conditions under
which the road pavement will be trafficked and avoids the mechanical
application of default values; and
3. It removes the restrictions on unitary pavement designs and enables the
production of a catalogue of candidate pavements, which allows economic
comparison and the selection of most economic pavement design, before
construction.
4.1. Validation of M-E Design Theory
The M-E design principle is based on the elastic response theory. This has been
validated by Koranteng-Yorke (2012) from a research work carried out in Ghana
which has the same environmental and climatic condition as Benin. Once the theory
1 This is predicted load repetitions required by the Kenlayer to predict pavement life from damage analysis.

4
is validated, predictions of stresses and strains could be performed for any flexible-
pavement design during any period of the year.
The elastic theory shows that the asphaltic concrete layer undergoes plastic
deformation. The theoretical elastic response is shown below as Figure 1.
Figure 1 – Elastic Response Theory
The theory was validated in the field using FWD equipment. Figure 2 gives the
actual elastic behaviour of the asphaltic concrete layer.
Figure 2 – Field Elastic Behaviour
4.2. Selection of M-E Design Tools
Three M-E design tools were evaluated with the objective of establishing which tool
is most appropriate and with the capacity to simulate Benin local traffic loading

5
conditions and also to meet MCC’s requirements. The following M-E packages were
evaluated; Alize-LCPC2, WinJulea and KENLAYER.
The capabilities and limitations of the tools have been summarized in Table 2.
Considering the design requirements by MCC, Kenlayer was found to be most
suitable.
Table 2: Summary of Results from the Evaluation of M-E Design Tools
Design Requirement Kenlayer Alize LCPC
WINJulea
Calibration of tool √ × × Estimation of in-place responses to reference loads
√ √ √
Allowance for different material characterization √ × × Establishing critical stresses and strains and their points in pavement layers
√ √ ×
Establishing residual life and modelling future performance from only existing pavement properties
√ × ×
Modelling of new pavements with projected traffic
√ √ ×
Conformance to French Design Method √ √ × Readily available pavement catalogue to select from
× √ ×
√ - Applicable × - Not Applicable
4.3. Kenlayer M-E Design
4.3.1. Selection of Pavement Properties
From the field geotechnical investigation, the structure of the existing pavements
and the nature of the materials were established. The existing materials are;
Asphaltic Concrete Surfacing (AC)
Double Surface Dressing (DSD)
Cement Stabilised Laterite (CSL)
2 Laboratoire Central des Ponts & Chaussées (LCPC)

6
Laterite Subbase (SB)
Subgrade (SG)
The following materials were also to be considered as per MCCs recommendation;
Dense Bitumen Macadam (DBM)
Bituminous Foam Mix (BFM)
Graded Crushed Stones (GCS)
Due to the similar nature of Benin’s climatic and environmental conditions to Ghana,
Nigeria and other countries in West Africa, where information were not available for
a selected pavement material, typical values found in works done within countries
in the sub-region were considered. Table 3 below shows the structure of the existing
pavements.
Table 3: Characteristics of Existing Pavements
Road Name No. Layer No.
Existing Pavement Material
Thickness (cm)
Material Characterization
Sèmè–Pont de Porto-Novo
1.1
1 AC 5 Viscoelastic 2 CSL 20 Linear 3 SB 25 Nonlinear 4 SG - Linear
Porto-Novo-Ouando
3.1
1 AC 4 Viscoelastic 2 CSL 25 Linear 3 SB 20 Nonlinear 4 SG - Linear
Ouando–Carrefour de
Zian 3.2
1 AC 5 Viscoelastic 2 CSL 20 Linear 3 DSD 3 Linear 4 SG - Linear
Porto-Novo-Avrankou
4.1
1 AC 4 Viscoelastic 2 CSL 15 Linear 3 SB 20 Nonlinear 4 SG - Linear
Avrankou–Igolo 4.2
1 AC 4 Viscoelastic 2 CSL 22 Linear 3 SB 20 Nonlinear 4 SG - Linear
Bohicon–Dassa 8.1 1 AC 7 Viscoelastic 2 CSL 20 Linear 3 DSD 3 Linear

7
Road Name No. Layer No.
Existing Pavement Material
Thickness (cm)
Material Characterization
4 SG - Linear
Savalou-Okoutaossé
9.3
1 DSD 2.8 Viscoelastic 2 CSL 20 Linear 3 SB 25 Nonlinear 4 SG - Linear
Table 4 shows the various selected pavement materials and their properties
considered for the proposed pavement design.
Table 4: Properties of pavement materials
Material
Elastic Modulus
MR (Kpa)
Poisson Ratio
PR
Unit Weight (kN/m3)
Material Characterization Reference
Asphaltic Concrete
AC 2,589,500 0.35 22.8 Viscoelastic FWD Data*
Double Surface Dressing
DSD N.A. - - - -
Cement Stabilized Laterite
CSL 565,000 0.2 21.2 Linear Samb et al
(2013)
Subgrade SG varies 0.45 19.6 Linear Geotechnical
Report
Subbase SB 453,000 0.35 21.2 Nonlinear FWD Data*
Dense Bitumen Macadam
DBM 2,589,500 0.35 22.8 Viscoelastic FWD Data*
Selected Fill FILL 190,500 0.35 21.2 Nonlinear FWD Data*
Graded Crushed Stone
GCS 856,000 0.35 21.2 Nonlinear FWD Data*
Stabilized with Bituminous
Foam BFM 2,450,000 0.35 22.8 Linear
Marquis et al (2003)
All input parameters required by the Kenlayer have been discussed in detail by
Huang (2004) and Koranteng-Yorke (2012) and have selected typical values for
tropical soils.

8
4.3.2. Calibration of Kenlayer
In order to ensure that results obtained from the Kenlayer are reliable, calibration of
the Kenlayer was undertaken. Table 5 gives the results of the calibration.
Table 5: Summary of results from calibration
Road Measured Deflection
- Benkelman Beam (cm)
Estimated Surface
Deflection - Kenlayer (cm)
Design Resilient Modulus
(kPa)
Platform depth (cm)
1.1 0.043 0.04301 58,412 50.00 3.1 0.055 0.05505 40,728 49.00 3.2 0.060 0.06083 49,383 28.00 4.1 0.058 0.05800 46,163 39.00 4.2 0.053 0.05302 45,504 46.00 8.1 0.064 0.06400 44,839 30.00 9.3 0.089 0.08901 21,363 47.80
4.3.3. Estimation of Residual Life of Existing Road Pavements
After establishing the resilient moduli of the subgrade layers, the residual life of the
existing pavements were assessed to inform the type and level of intervention
required to meet the design objectives. Table 6 gives information on the residual life
of the road pavements.
Table 6: Residual lives of existing pavements
Road Layer No.
Existing Pavement Material
Thickness (cm)
Estimated 20-Year
Load (CSA)
Allowable Traffic Load3 (million CSA)
Residual Life4
1.1 1 AC 5
95.684 13.04 2.73 2 CSL 20 3 SB 25
3.1 1 AC 4
48.387 4.495 1.86 2 CSL 25 3 SB 20
3.2 1 AC 5 23.760 1.825 1.54
3 The allowable load repetitions is the maximum number of standard axle load passes that the pavement can take before it yields or fail. 4 This is the number of years remaining for the pavement to yield or fail considering the 20 year projected traffic for the various roads.

9
Road Layer No.
Existing Pavement Material
Thickness (cm)
Estimated 20-Year
Load (CSA)
Allowable Traffic Load3 (million CSA)
Residual Life4
2 CSL 20 3 DSD 3
4.1 1 AC 4
15.834 2.169 2.74 2 CSL 15 3 SB 20
4.2 1 AC 4
16.347 4.361 5.34 2 CSL 22 3 SB 20
8.1 1 AC 7
82.527 1.675 0.41 2 CSL 20 3 DSD 3
9.3 1 DSD 2.8
30.073 0.793 0.53 2 CSL 20 3 SB 25
4.3.4. Design of Pavements for Reconstruction Option
The selection of pavement thickness was guided by consideration of the traffic load,
materials of pavement layers and modulus of subgrade. For each road, 2 pavement
options for reconstruction were considered based on the type of base material.
The following limits, as recommended by Austroads Guide to Pavement Technology
(2014), were set as a guide to practical design of pavement structures;
1. The asphaltic concrete wearing course shall not be less than 40mm.
2. All base layers shall not be less than 100mm.
3. The lateritic gravel subbase layer shall not be less than 200mm.
4. Capping layers shall not be less than 400mm.
The summary of results after the Kenlayer runs are given in Table 7.

10
Table 7: Reconstruction Options for Existing Bituminous Roads
Road Name (Code) Layer No.
Option 1 Option 2
Layers Thickness (cm)
Design Life
(Years) Layers Thickness
(cm)
Design Life
(Years)
Seme-Port Novo (1.1)
1 AC 5
22
AC 5
22 2 GCS 20 BFM 20 3 CSL 20 CSL 15 4 SB 30 SB 28
Port Novo Pont- Ouando (3.1)
1 AC 4
22
AC 4
23 2 GCS 23 BFM 20 3 CSL 20 CSL 15 4 SB 30 SB 30
Ouando – Zian Carrefour (3.2)
1 AC 4
23
AC 4
22 2 GCS 15 BFM 12 3 CSL 15 CSL 15 4 SB 30 SB 30
Porto Novo – Avrankou (4.1)
1 AC 4
22
AC 4
23 2 GCS 12 BFM 12 3 CSL 15 CSL 13 4 SB 30 SB 30
Avrankou -Igolo (4.2)
1 AC 4
23
AC 4
21 2 GCS 13 BFM 12 3 CSL 15 CSL 13 4 SB 30 SB 30
Bohicon – Dassa (8.1)
1 AC 5
22
AC 5
21 2 GCS 26 BFM 18 3 CSL 20 CSL 20 4 SB 30 SB 30
Savalou - Okutaosse (9.3)
1 AC 5
22
AC 5
23 2 GCS 28 BFM 20 3 CSL 23 CSL 22 4 SB 30 SB 30
5.0. ECONOMIC EVALUATION OF PAVEMENTS
5.1. Calibration of HDM-4 for Benin Condition
One of the basic requirement in the use of the HDM-4 is the configuration and
calibration of the tool to simulate local conditions and to improve on the reliability of
its output.

11
Configuration of HDM-4 model is basically restructuring of the default values in line
with local conditions, standards and practices. The primary objective of
configuration is to make the analysis from the model relevant and compatible to the
particular environment it is being used. Configuration focused on the climate, traffic
categories, among others.
5.1.1. Climate Data
Benin’s Direction Nationale de la Meteorologie (DNM) has given climate data for the
respective climatic zone over the last 30 years. This has been used to compute
averages for climate parameters required for the HDM-4.
The following four climate zones was used to configure the HDM-4:
Sub-Equatorial Zone average 1200 mm per annum (Zone 1)
Sudaneese–SudZone average of 1200per annum (Zone 2a)
Sudaneese –Nord Zone average of 900 per annum (Zone 2b)
Atacorien average of 1300mm per annum (Zone 3)
Climatic data required for Benin are as summarised in Table 8.

12
Table 8: Representative Average Zonal Climatic Attributes N
ame
Des
crip
tion
Moi
stu
re
Cla
ssif
icat
ion
Tem
per
atu
re
Cla
ssif
icat
ion
Nu
mb
er o
f D
ays
wh
en T
emp
erat
ure
E
xcee
ds
32o C
Ave
rage
T
emp
erat
ure
Ran
ge
(oC
)
Free
ze I
nd
ex
Moi
stu
re I
nd
ex
Mea
n M
onth
ly
Pre
cip
itat
ion
Mea
n T
emp
erat
ure
Du
rati
on o
f D
ry
Sea
son
(mon
th)
Per
cen
tage
of
Dri
vin
g on
Sn
ow
Cov
ered
Roa
ds
Per
cen
tage
of
Dri
vin
g D
one
on
Wat
er C
over
ed
Roa
ds
Zone 1 Sub-Equatorial
Zone average 1200 mm per annum
Sub humid
Tropical 179 8.66 0 12 98.07 27.93 6 0 50%
Zone 2a Sudaneese – Sud Zone average of 1200 per annum
Sub humid
Tropical 225 12.79 0 3.2 98.40 27.46 6 0 50%
Zone 2b Sudaneese – Nord Zone average of 900 per annum
Sub humid
Tropical 270 12.45 0 -11.5 83.48 28.28 6 0 50%
Zone 3 Atacorien average
of 1300mm per annum
Sub humid
Tropical 241 11.42 0 3.9 100.10 27.45 5 0 58%

13
5.1.2. Traffic Categories
The traffic classes used to set the threshold High, Medium and Low traffic for the
various functional classes (RNIE, RN and RC) and AADT in Benin are given in Tables 9
and 10 respectively.
Table 9: Traffic Categories for the Functional Classes
Traffic Category Code RNIE Roads RN Roads RC Roads
High Traffic H PL>750 PL>750 PL>150 Medium Traffic M 300 < PL< 750 300 < PL< 750 50 < PL <150 Low Traffic L PL< 300 PL< 300 PL< 50
Table 10: Traffic Categories based on AADT
Traffic Category Code Paved Unpaved Concrete
High Traffic H ≥ 7500 ≥ 800 ≥ 1500 Medium Traffic M ≥ 750 ≥ 175 ≥ 7500 Low Traffic L ≥ 300 ≥ 75 ≥ 3000
5.1.3. Calibration
Calibration of HDM-4 is intended to improve the accuracy of predicted pavement
performance and vehicle resource consumption. The pavement deterioration models
incorporated in HDM-4 were developed from results of large field experiments
conducted in several countries. Level 2 calibration was undertaken. Due to in sufficient
data for the analysis, the cross-sectional method was used. The main activity
undertaken was the calibration of the deterioration models.

14
Cracking is very predominant on Benin road network. Information obtained from
experienced engineers is that cracking is initially seen on bituminous roads between 2
and 3 years after construction.
The cracking initiation factors Kci were calculated for each climatic zone. The summaries
of calibrated crack initiation and progression adjustment factors for the selected climate
zones of Benin are given below in Tables 11 and 12.
Table 11: Cracking for Sub-Equatorial Zone 1
Pavement Type Mean Observed
Values (yrs) Mean Predicted Values (Years) Kci Kcp = 1/Kci
AMGB 2.5 4 0.625 1.6 AMSB 2.5 5 0.5 2.0 STGB 2.5 9 0.278 3.60
Table 12: Cracking for Atacorien Zone 3
Pavement Type
Mean Observed Values (yrs)
Mean Predicted Values (Years) Kci Kcp = 1/Kci
STGB 2.5 9 0.278 3.60 STSB 2.5 10 0.25 4.0
5.2. Results of Economic Analysis of Ouando – Zian Carrefour Section
Out of the total of 7 project roads, Ouando – Zian Carrefour has been selected to
demonstrate the economic and financial evaluation using HDM-4.
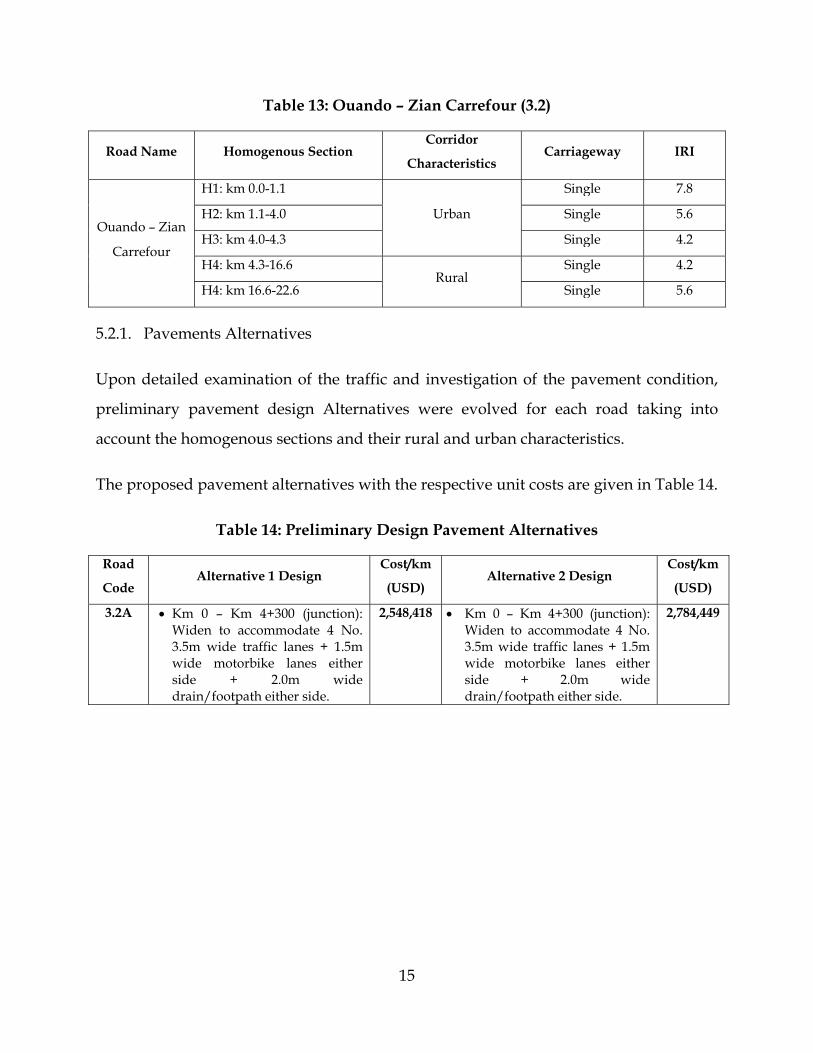
This road is as single carriageway (see Table 13). The first 4.3 km lies in an urban
enclave. The strategy is to explore the benefits of dualising the urban section to ensure
adequate capacity in line with Benin Government plan over the medium term.
15
Table 13: Ouando – Zian Carrefour (3.2)
Road Name Homogenous Section Corridor
Characteristics Carriageway IRI
Ouando – Zian
Carrefour
H1: km 0.0-1.1
Urban
Single 7.8
H2: km 1.1-4.0 Single 5.6
H3: km 4.0-4.3 Single 4.2
H4: km 4.3-16.6 Rural
Single 4.2
H4: km 16.6-22.6 Single 5.6
5.2.1. Pavements Alternatives
Upon detailed examination of the traffic and investigation of the pavement condition,
preliminary pavement design Alternatives were evolved for each road taking into
account the homogenous sections and their rural and urban characteristics.
The proposed pavement alternatives with the respective unit costs are given in Table 14.
Table 14: Preliminary Design Pavement Alternatives
Road
Code Alternative 1 Design
Cost/km
(USD) Alternative 2 Design
Cost/km
(USD)
3.2A Km 0 – Km 4+300 (junction): Widen to accommodate 4 No. 3.5m wide traffic lanes + 1.5m wide motorbike lanes either side + 2.0m wide drain/footpath either side.
2,548,418
Km 0 – Km 4+300 (junction): Widen to accommodate 4 No. 3.5m wide traffic lanes + 1.5m wide motorbike lanes either side + 2.0m wide drain/footpath either side.
2,784,449
16
Road
Code Alternative 1 Design
Cost/km
(USD) Alternative 2 Design
Cost/km
(USD)
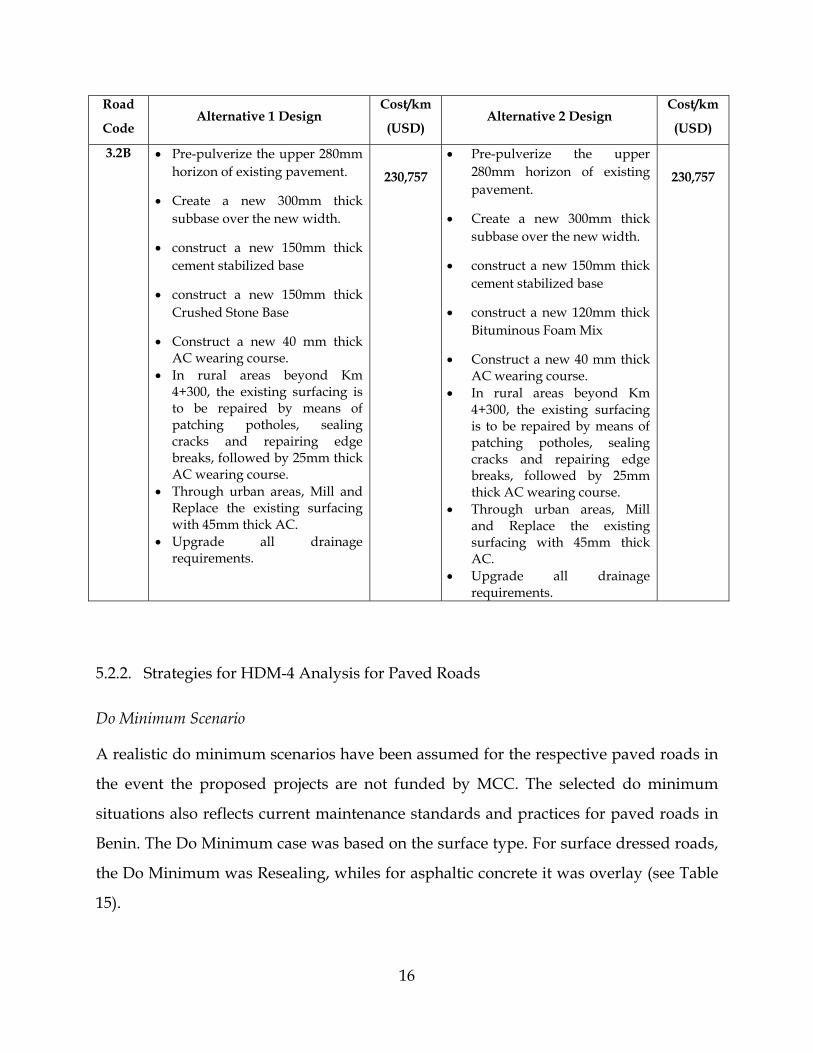
3.2B Pre-pulverize the upper 280mm horizon of existing pavement.
Create a new 300mm thick subbase over the new width.
construct a new 150mm thick cement stabilized base
construct a new 150mm thick Crushed Stone Base
Construct a new 40 mm thick AC wearing course.
In rural areas beyond Km 4+300, the existing surfacing is to be repaired by means of patching potholes, sealing cracks and repairing edge breaks, followed by 25mm thick AC wearing course.
Through urban areas, Mill and Replace the existing surfacing with 45mm thick AC.
Upgrade all drainage requirements.
230,757
Pre-pulverize the upper 280mm horizon of existing pavement.
Create a new 300mm thick subbase over the new width.
construct a new 150mm thick cement stabilized base
construct a new 120mm thick Bituminous Foam Mix
Construct a new 40 mm thick AC wearing course.
In rural areas beyond Km 4+300, the existing surfacing is to be repaired by means of patching potholes, sealing cracks and repairing edge breaks, followed by 25mm thick AC wearing course.
Through urban areas, Mill and Replace the existing surfacing with 45mm thick AC.
Upgrade all drainage requirements.
230,757
5.2.2. Strategies for HDM-4 Analysis for Paved Roads
Do Minimum Scenario
A realistic do minimum scenarios have been assumed for the respective paved roads in
the event the proposed projects are not funded by MCC. The selected do minimum
situations also reflects current maintenance standards and practices for paved roads in
Benin. The Do Minimum case was based on the surface type. For surface dressed roads,
the Do Minimum was Resealing, whiles for asphaltic concrete it was overlay (see Table
15).

17
Table 15: Do Minimum Scenario by Road Section
Alternative
Description Surface Type Details of Improvement/Maintenance
Base Alternative
(Do-Minimun) Asphaltic Carry out 25 mm thick overlay
Road Improvement and Maintenance Strategies
All homogeneous sections were subjected to a series of Intervention Options and the
appropriated maintenance required over the analysis period of 20 years after the
investments. Table 16 gives the details of the respective options.
Table 16: Details of Improvement and Maintenance Standards
Option Alternative Description Details of Improvement/Maintenance
1
Rehabilitation of Paved Roads -
Surface Treated (ST) or Asphaltic
Concrete (AC)
It entails the following activities :
Partial Widening to the Standard Carrriageway Width Improvement and Repair of Drainage Structures Pavement works –See cross-section below Intervention is in Calendar Year 2017 Construction Period – 2 years (2017-2018)
Schedule Maintenance
Perform Paved Road Routine Maintenance Annually Annual Routine Maintenance for Paved Roads Resealing/Overlay (25mm) @ 6IRI
2 Upgrading of Surface Treated (ST)
to Asphaltic Concrete (AC)
Improvement Activities include the following activities:
Partial Widening to the standard carriageway width Improving and repair of drainage facilities Pavement Works – See cross-section below Calendar year of intervention 2017 Construction Period 3 years (2017-2019)
Schedule Maintenance
Perform Paved Routine Maintenance Annually Schedule Resealing @ 6yrs interval Start year 2019-2040

18
Option Alternative Description Details of Improvement/Maintenance
3 Upgrading of Single Carriageway
to 2-Lane Dual Carriageway
Improvement Activities include the following activities:
Partial Widening to the standard carriageway width Improving and repair of drainage facilities Pavement Works – See cross-section below Calendar year of intervention 2017 Construction Period 3 years (2017-2019)
Schedule Maintenance
Perform Paved Routine Maintenance Annually Schedule Overlay 50mm @ 6yrs interval Start year 2019-2040
5.2.3. Project Economic Evaluation Parameters
Discount Rate
A discount rate of 10% has been adopted for this project in line with guidance from the
MCC for infrastructure investment in Benin.
Residual Value
Residual value has been assumed the paved road to be 15% at the end of design period
of 20 years. It is expected that the economic life of the road will be beyond the design
period.
The minimum target Economic Internal Rate of Return (EIRR) to qualify for investment
is 10.0%, thus investment with EIRR less than 10% may not be recommended to MCC
for investment.
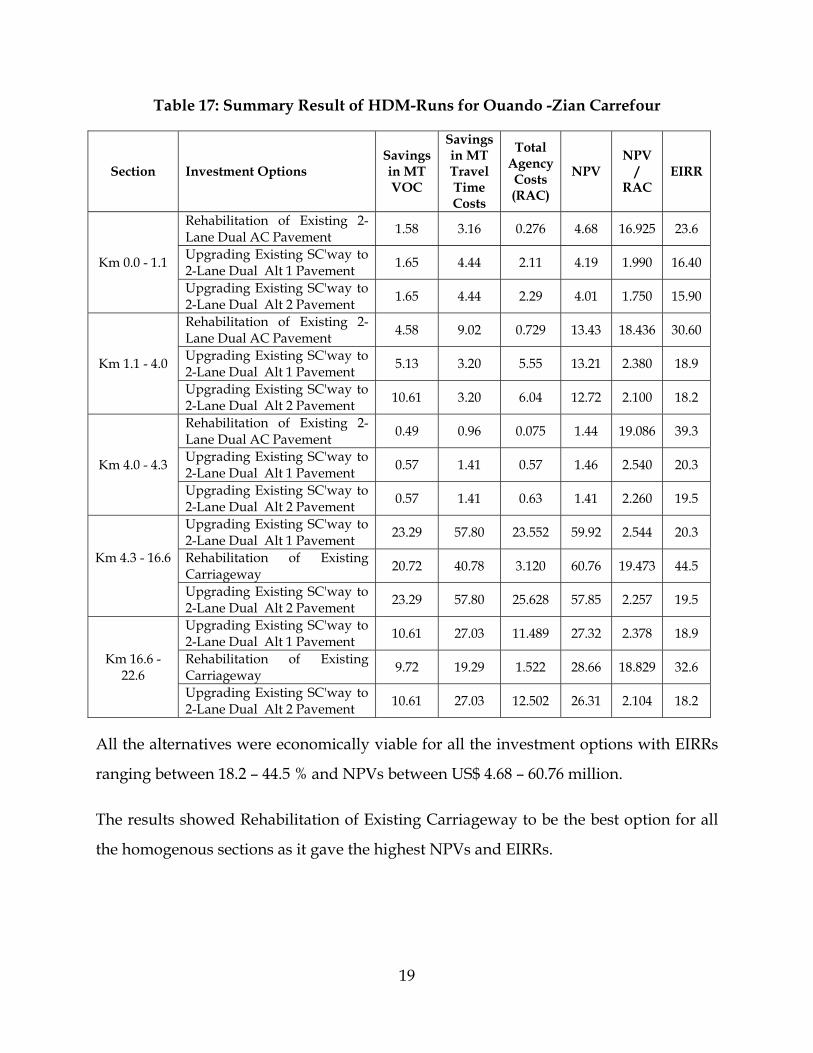
5.2.4. Results of the Economic Evaluation
Three options were considered for the HDM-4 runs for all the homogenous sections.
Summary of the HDM-4 results is given in Tables 17.
19
Table 17: Summary Result of HDM-Runs for Ouando -Zian Carrefour
Section Investment Options Savings in MT VOC
Savings in MT Travel Time Costs
Total Agency Costs (RAC)
NPV NPV
/ RAC
EIRR
Km 0.0 - 1.1
Rehabilitation of Existing 2-Lane Dual AC Pavement
1.58 3.16 0.276 4.68 16.925 23.6
Upgrading Existing SC'way to 2-Lane Dual Alt 1 Pavement
1.65 4.44 2.11 4.19 1.990 16.40
Upgrading Existing SC'way to 2-Lane Dual Alt 2 Pavement
1.65 4.44 2.29 4.01 1.750 15.90
Km 1.1 - 4.0
Rehabilitation of Existing 2-Lane Dual AC Pavement
4.58 9.02 0.729 13.43 18.436 30.60
Upgrading Existing SC'way to 2-Lane Dual Alt 1 Pavement
5.13 3.20 5.55 13.21 2.380 18.9
Upgrading Existing SC'way to 2-Lane Dual Alt 2 Pavement
10.61 3.20 6.04 12.72 2.100 18.2
Km 4.0 - 4.3
Rehabilitation of Existing 2-Lane Dual AC Pavement
0.49 0.96 0.075 1.44 19.086 39.3
Upgrading Existing SC'way to 2-Lane Dual Alt 1 Pavement
0.57 1.41 0.57 1.46 2.540 20.3
Upgrading Existing SC'way to 2-Lane Dual Alt 2 Pavement
0.57 1.41 0.63 1.41 2.260 19.5
Km 4.3 - 16.6
Upgrading Existing SC'way to 2-Lane Dual Alt 1 Pavement
23.29 57.80 23.552 59.92 2.544 20.3
Rehabilitation of Existing Carriageway
20.72 40.78 3.120 60.76 19.473 44.5
Upgrading Existing SC'way to 2-Lane Dual Alt 2 Pavement
23.29 57.80 25.628 57.85 2.257 19.5
Km 16.6 - 22.6
Upgrading Existing SC'way to 2-Lane Dual Alt 1 Pavement
10.61 27.03 11.489 27.32 2.378 18.9
Rehabilitation of Existing Carriageway
9.72 19.29 1.522 28.66 18.829 32.6
Upgrading Existing SC'way to 2-Lane Dual Alt 2 Pavement
10.61 27.03 12.502 26.31 2.104 18.2
All the alternatives were economically viable for all the investment options with EIRRs
ranging between 18.2 – 44.5 % and NPVs between US$ 4.68 – 60.76 million.
The results showed Rehabilitation of Existing Carriageway to be the best option for all
the homogenous sections as it gave the highest NPVs and EIRRs.

20
5.2.5. Sensitivity Analysis
A sensitivity analysis was conducted on the results of the HDM-4. The main objective is
to test the robustness of the selected option for implementation. The following scenarios
have been modelled within the sensitivity analysis:
+20% scheme capital costs -20% scheme capital costs -20% base year traffic (motorised) +20% base year traffic (motorised) Low traffic growth (pessimistic scenario) High traffic growth (optimistic scenario)
In order to establish the reliability of the selected option under the different scenarios, a
sensitivity analysis was carried out on all the investment options. The NPVs under
various sensitivity scenarios are summarised in Tables 18 and 19.
Table 18: NPVs from Sensitivity Analysis for Overlay Existing 2-Lane Dual AC Pavement - Ouando -Zian Carrefour
Sensitivity Net Present Value (NPV)
Km 0.0-1.1 Km 1.1-4.0 Km 4.0-4.3 +20% Increase in AADT 6.792 19.233 2.049 +20% Increase in Capital Cost 4.639 13.332 1.428 +50% High Traffic Growth (Optimistic Scenario) 8.035 22.309 2.358 -20% Decrease in AADT 2.541 7.577 0.823 -20% Decrease in Capital Cost 4.716 13.535 1.449 -50% Low Traffic Growth (Pessimistic Scenario) 2.030 6.428 0.713 Base Sensitivity Scenario 4.678 13.433 1.439
Table 19: NPVs from Sensitivity Analysis for Rehabilitation of Existing Carriageway - Ouando -Zian Carrefour
Sensitivity Net Present Value (NPV)
Km 4.3-16.6 Km 16.6-22.6 +20% Increase in AADT 83.393 39.496 +20% Increase in Capital Cost 60.332 28.451 +50% High Traffic Growth (Optimistic Scenario) 96.406 46.026 -20% Decrease in AADT 35.635 16.604 -20% Decrease in Capital Cost 61.191 28.870 -50% Low Traffic Growth (Pessimistic Scenario) 31.343 14.331 Base Sensitivity Scenario 60.762 28.660

21
The sensitivity tests show that the selected investment for the all the homogenous
sections are sufficiently robust to achieve the specified criteria of economic viability
under each of the modelled scenarios, for both optimistic and pessimistic cases.
6.0. LIFE CYCLE ANALYSIS OF THE OPTIMUM PAVEMENT
There is the need to subject the respective roads to critical maintenance needs
assessment to ensure that timing of the maintenance interventions is optimised. The
HDM-4 has the capacity to model the Life-Cycle of road pavement over a period of 40
years. The Life Cycle Analysis takes into consideration the initial capital cost and the
various maintenance cost over the intended life of the pavement.
The overall objective of carrying out the Life-Cycle analysis is to minimise the Total
Transport Cost on a given road. In order to minimise the transport cost The User and
Road Agency cost streams for the Life Cycle period are added to establish the minimum
transport cost.
6.1. Maintenance Standards and Strategies
All the sections were subjected to number of probable maintenance policy alternatives,
with the intention to obtain a life cycle Cost which is most economic at least total
transport cost. The policies consisted of different maintenance strategies, with
scheduled time and responsive maintenance interventions. Roughness levels and %
damage area were used to set the triggers for the responsive maintenance.
In order to have a fair basis for selection of life cycle option, the NPV, Agency Cost with
respect to construction and maintenance Cost and the Vehicle Operating Cost (VOC) for
various construction option and maintenance strategies were examined at a unit rate
(i.e. Cost or benefit per kilometre). Table 20 gives the summary of the maintenance

22
standards and alternatives used. The Maintenance Policy Alternative matrix has been
evolved based on maintenance standard used by MTPT to trigger interventions.
Table 20: Maintenance Policy Alternatives for Asphaltic Concrete
Periodic Maintenance
25 mm Overlay
Type of Trigger Trigger Level
Schedule
5 Years Interval 6 Years Interval 7 Years Interval 8 Years Interval 9 Years Interval 10 Years Interval
Responsive
IRI
4IRI 5IRI 6IRI 7IRI
Damage Area
50% 40% 30% 25%
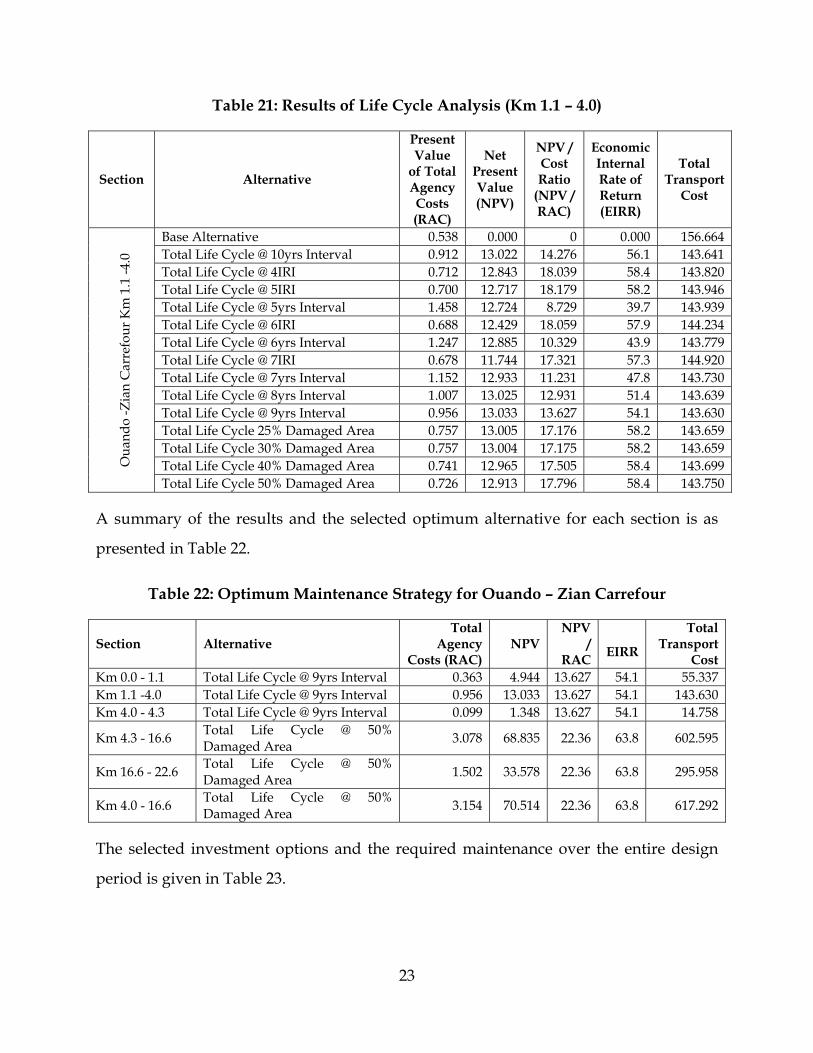
6.2. Results of the Life Cycle Analysis
From Table 20 maintenance policy alternatives were subjected to Life Cycle Analysis to
determine which maintenance policy is most economic and with the Least Total
Transport Cost. Results are as presented in Table 21.
All the alternatives include basic Routine Maintenance, such as drainage cleaning,
vegetation clearing, repair of shoulder and miscellaneous activities. The Routine
Maintenance intervention used under this project is scheduled annually in line with
Benin road maintenance practices.
23
Table 21: Results of Life Cycle Analysis (Km 1.1 – 4.0)
Section Alternative
Present Value
of Total Agency Costs (RAC)
Net Present Value (NPV)
NPV / Cost Ratio
(NPV / RAC)
Economic Internal Rate of Return (EIRR)
Total Transport
Cost
Ou
and
o -Z
ian
Car
refo
ur K
m 1
.1 -4
.0
Base Alternative 0.538 0.000 0 0.000 156.664 Total Life Cycle @ 10yrs Interval 0.912 13.022 14.276 56.1 143.641 Total Life Cycle @ 4IRI 0.712 12.843 18.039 58.4 143.820 Total Life Cycle @ 5IRI 0.700 12.717 18.179 58.2 143.946 Total Life Cycle @ 5yrs Interval 1.458 12.724 8.729 39.7 143.939 Total Life Cycle @ 6IRI 0.688 12.429 18.059 57.9 144.234 Total Life Cycle @ 6yrs Interval 1.247 12.885 10.329 43.9 143.779 Total Life Cycle @ 7IRI 0.678 11.744 17.321 57.3 144.920 Total Life Cycle @ 7yrs Interval 1.152 12.933 11.231 47.8 143.730 Total Life Cycle @ 8yrs Interval 1.007 13.025 12.931 51.4 143.639 Total Life Cycle @ 9yrs Interval 0.956 13.033 13.627 54.1 143.630 Total Life Cycle 25% Damaged Area 0.757 13.005 17.176 58.2 143.659 Total Life Cycle 30% Damaged Area 0.757 13.004 17.175 58.2 143.659 Total Life Cycle 40% Damaged Area 0.741 12.965 17.505 58.4 143.699 Total Life Cycle 50% Damaged Area 0.726 12.913 17.796 58.4 143.750
A summary of the results and the selected optimum alternative for each section is as
presented in Table 22.
Table 22: Optimum Maintenance Strategy for Ouando – Zian Carrefour
Section Alternative Total
Agency Costs (RAC)
NPV NPV
/ RAC
EIRR
Total Transport
Cost Km 0.0 - 1.1 Total Life Cycle @ 9yrs Interval 0.363 4.944 13.627 54.1 55.337 Km 1.1 -4.0 Total Life Cycle @ 9yrs Interval 0.956 13.033 13.627 54.1 143.630 Km 4.0 - 4.3 Total Life Cycle @ 9yrs Interval 0.099 1.348 13.627 54.1 14.758
Km 4.3 - 16.6 Total Life Cycle @ 50% Damaged Area
3.078 68.835 22.36 63.8 602.595
Km 16.6 - 22.6 Total Life Cycle @ 50% Damaged Area
1.502 33.578 22.36 63.8 295.958
Km 4.0 - 16.6 Total Life Cycle @ 50% Damaged Area
3.154 70.514 22.36 63.8 617.292
The selected investment options and the required maintenance over the entire design
period is given in Table 23.

24
Table 23: Summary of Selected Investment Options
Section Capital Investment Maintenance
Routine Periodic Ouando – Carrefour Zian
Rehabilitation of Existing Carriageway
Annual Overlay @ 9yrs Interval
During the period 2017 – 2041, it is estimated that an amount of US$ 14.89 Million will
be required as investment for Ouando-Zian Carrefour road. MCC will be required to
provide US$ 5.22 Million during the compact period. Government of Benin will
responsible for the maintenance at a cost of US$ 9.67 Million over the entire design life
(see Table 24).
Table 24: Summaries of Financial Cost of Road Works for the Period 2017-2041
Code Section Financial Cost of Works (Million US$) Total
(Million US$) Improvement Periodic Routine
3.2 Ouando - Zian Carrefour 5.22 8.18 1.49 14.89
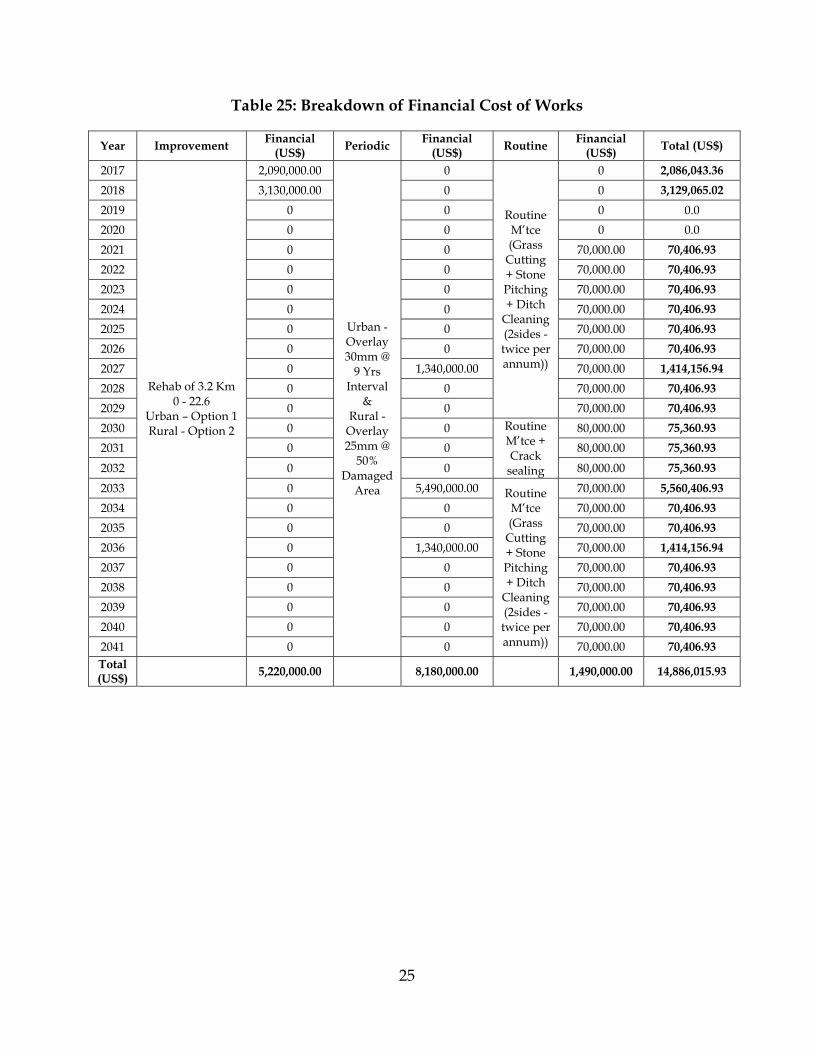
The breakdown of the financial cost of works for the entire life cycle of the road is as
presented in Table 25.
Figure 3 shows a typical roughness profile before and after the initial investment and
the maintenance of the entire life of the road.
25
Table 25: Breakdown of Financial Cost of Works
Year Improvement Financial
(US$) Periodic Financial
(US$) Routine Financial
(US$) Total (US$)
2017
Rehab of 3.2 Km 0 - 22.6
Urban – Option 1 Rural - Option 2
2,090,000.00
Urban - Overlay 30mm @
9 Yrs Interval
& Rural -
Overlay 25mm @
50% Damaged
Area
0
Routine M’tce (Grass
Cutting + Stone Pitching + Ditch
Cleaning (2sides - twice per annum))
0 2,086,043.36
2018 3,130,000.00 0 0 3,129,065.02
2019 0 0 0 0.0
2020 0 0 0 0.0
2021 0 0 70,000.00 70,406.93
2022 0 0 70,000.00 70,406.93
2023 0 0 70,000.00 70,406.93
2024 0 0 70,000.00 70,406.93
2025 0 0 70,000.00 70,406.93
2026 0 0 70,000.00 70,406.93
2027 0 1,340,000.00 70,000.00 1,414,156.94
2028 0 0 70,000.00 70,406.93
2029 0 0 70,000.00 70,406.93
2030 0 0 Routine M’tce + Crack
sealing
80,000.00 75,360.93
2031 0 0 80,000.00 75,360.93
2032 0 0 80,000.00 75,360.93
2033 0 5,490,000.00 Routine M’tce (Grass
Cutting + Stone Pitching + Ditch
Cleaning (2sides - twice per annum))
70,000.00 5,560,406.93
2034 0 0 70,000.00 70,406.93
2035 0 0 70,000.00 70,406.93
2036 0 1,340,000.00 70,000.00 1,414,156.94
2037 0 0 70,000.00 70,406.93
2038 0 0 70,000.00 70,406.93
2039 0 0 70,000.00 70,406.93
2040 0 0 70,000.00 70,406.93
2041 0 0 70,000.00 70,406.93 Total (US$)
5,220,000.00
8,180,000.00
1,490,000.00 14,886,015.93

26
3.2.1-H1U Road Class: Inter-State Highway - RNIE
Length: 1.10km
Width: 7.00m Curvature: 3.00deg/km
2.0
4.0
6.0
8.0
10.0
12.0
14.0
16.0
2017
2018
2019
2020
2021
2022
2023
2024
2025
2026
2027
2028
2029
2030
2031
2032
2033
2034
2035
2036
2037
2038
2039
2040
2041
Base AlternativeOverlay 30mm @9yrs Interval
Year
Ave
rag
e R
ou
gh
nes
s (m
/km
)
Figure 3: Typical Roughness profile of Ouando-Zian Carrefour road
7.0. CONCLUSION
The Life Cycle approach using the Rational Pavement Design Method addresses all
issues from design through the maintenance regime and finally the financial budgeting
issues.
The methodology can be used to update the pavement management system of the Road
Agency. It is practical and engineers can be trained to use it. The inputs can be obtained
locally without using assumptions which are alien to a given environment.
From the economic analysis, the life cycle cost of the road investment is known before
construction starts. It will ensure proper planning and programming of maintenance
activities during the design life of the pavement. It will also help proper monitoring by
funding agencies of government maintenance responsibilities after initial investment by
the developing partners.

27
8.0. RECOMMENDATIONS
1. It is recommended that M-E pavement design parameters be developed for
countries especially the field temperature of the AC layer.
2. A research can be undertaken to develop a system that links the M-E tool to
HDM-4 as one package.
3. This approach can be used to update the maintenance management system of the
Road Agency.

28
REFERENCES
1. Lister N.W., Kennedy C.K. and Ferne B.W. (1982). The TRRL Method for Planning
and Design of Structural Maintenance. Proceedings Fifth International Conference
on the Structural Design of Asphalt Pavements, University of Michigan Vol. 1, Delf
1982, pp 709-724.
2. Safety and Service Division Pavement Design – Supplement to the Austroads Guide
to Pavement Technology Part 2: Pavement Structural Design (2014), Version 4,
Department of Planning and Transportation, South Australia.
3. Huang, Y.H. (2004) Pavement Analysis and Design. Upper Saddle River: Prentice
Hall Inc.
4. Koranteng-Yorke J. B., Ghataora Gurmel and Odoki J. B. (2014), Rational Approach
for Tropical Pavement Design Using Life Cycle Principles – Case Study of Ghana,
International Journal of Pavement Engineering, Taylor and Francis, United Kingdom
5. Millennium Challenge Corporation (2014), Scope of Services – Preliminary
Screening, Feasibility and Prioritization Study – Benin Roads Project.
6. Koranteng-Yorke, J. B. (2012). A proposed framework for asphaltic concrete
pavement design for tropical soils–case study of Ghana (Doctoral dissertation,
University of Birmingham).
7. Brian Marquis, Dale Peabody, Rajib Mallick and Tim Soucie (2003),Determination of
Structural Layer Coefficient for Roadway Recycling Using Foamed Asphalt, Final
Report submitted to the Recycled Materials Resource Centre, University of New
Hampshire, Worcester Polytechnic Institute.
8. Fatou Samb, Meissa Fall, Yves Berthaud and Makhaly Bâ (2013), Resilient Modulus
of Compacted Lateritic Soils from Senegal at OPM Conditions, accessed at
http://dx.doi.org/10.4236/gm.2013.34021


