Page 1
1
RESISTANCE OF AGED ASPHALTIC CONCRETE TO WAVE ATTACK
Arjan K. de Looff1 Martin F.C. van de Ven
2 Robert `t Hart
3
In this paper the resistance of aged asphaltic concrete to wave attack is considered. This is done by
comparing the flexural strength of three dike revetments that vary from age and construction quality.
Ageing influences the strength of asphaltic concrete. For aged asphaltic concrete the regular fatigue
curves describe the strength incorrect. Therefore an adapted fatigue curve has been developed which
takes into account the flexural strength at one load repetition.
INTRODUCTION
Application of asphaltic concrete revetments
Asphaltic concrete is used as a sea dike revetment to protect the dike body from
erosion. It is a commonly used revetment type in The Netherlands but asphaltic
concrete coastal revetments are applied in many other countries as well,
including Germany, United Kingdom, Italy and Japan. The Shell bitumen
hydraulic engineering handbook (Schönian, 1999) gives a detailed description of
the application of asphalt in coastal engineering worldwide. In The Netherlands
application on a large scale took place after the flooding of part of the Southwest
of The Netherlands in 1953. After this disaster a great number of dikes had to be
repaired quickly and this was possible with the use of asphalt as a revetment
material. Asphalt could be placed much faster then the materials usually applied
at that time, such as basalt columns. Asphalt was used on a large scale as well to
protect the sand body of the dams that were constructed to close the estuaries in
the Southwest of the Netherlands. The most common asphalt types are asphaltic
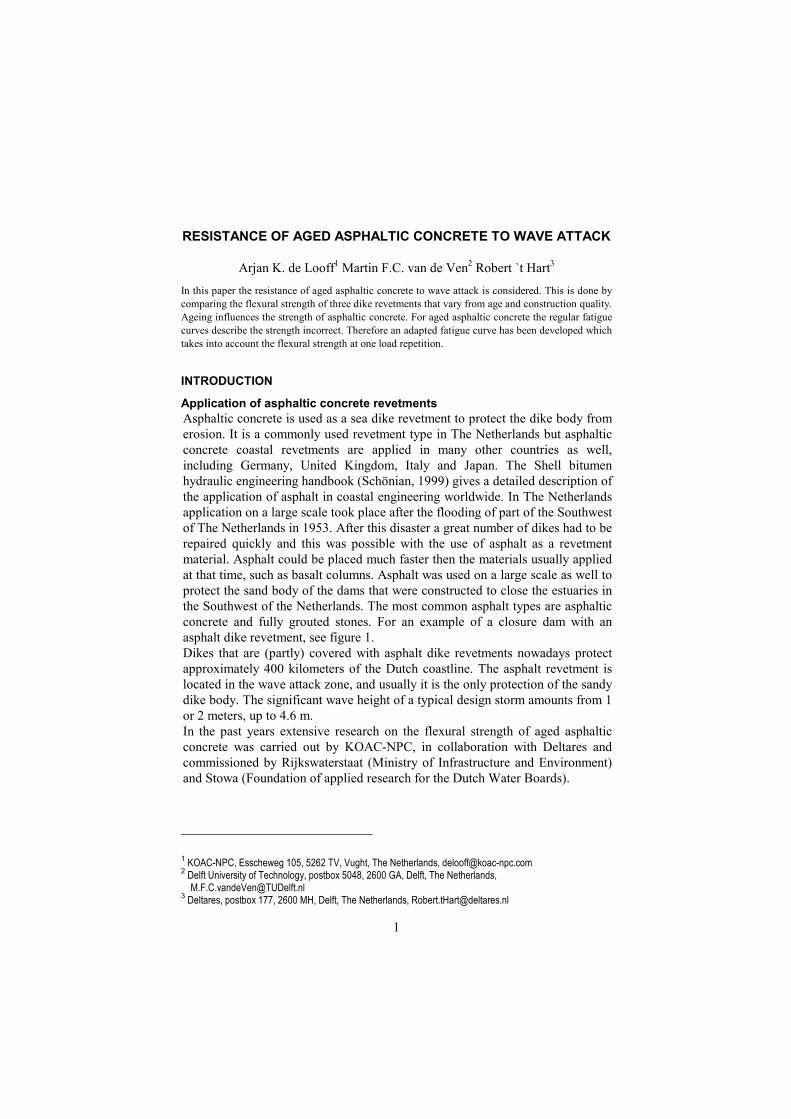
concrete and fully grouted stones. For an example of a closure dam with an
asphalt dike revetment, see figure 1.
Dikes that are (partly) covered with asphalt dike revetments nowadays protect
approximately 400 kilometers of the Dutch coastline. The asphalt revetment is
located in the wave attack zone, and usually it is the only protection of the sandy
dike body. The significant wave height of a typical design storm amounts from 1
or 2 meters, up to 4.6 m.
In the past years extensive research on the flexural strength of aged asphaltic
concrete was carried out by KOAC-NPC, in collaboration with Deltares and
commissioned by Rijkswaterstaat (Ministry of Infrastructure and Environment)
and Stowa (Foundation of applied research for the Dutch Water Boards).
1 KOAC-NPC, Esscheweg 105, 5262 TV, Vught, The Netherlands, [email protected]
2 Delft University of Technology, postbox 5048, 2600 GA, Delft, The Netherlands,
[email protected] 3 Deltares, postbox 177, 2600 MH, Delft, The Netherlands, [email protected]
Page 2
2
R2 = 0,929
0,0
1,0
2,0
3,0
4,0
5,0
6,0
7,0
0,0 0,2 0,4 0,6 0,8
log(σo)
log(N
)
fatigue tests
5% confidence interval
fatigue curve (mean)
Figure 1. The Brouwersdam a closure dam with an asphalt dike revetment (source:
Rijkswaterstaat, www.kustfoto.nl)
Resistance to fatigue, the classical approach
Asphalt is sensitive to fatigue and therefore the fatigue properties are used to
express the flexural strength. The fatigue properties, the relation between the
bending stress in a material (σ) and the number of loadings to failure (Nf) are
normally assumed to be linear on a log-log scale. In figure 2 an example is given
of a fatigue curve for a asphaltic concrete dike revetment.
Figure 2. Fatigue curve (Flaauwe werk dike)
The fatigue properties are derived with three point bending tests on specimens
from the revetment. Twenty years ago this test was developed to determine the
actual strength of asphaltic concrete dike revetments (Montauban and Van de
Ven, 1993). Fatigue tests are carried out by applying a sinusoidal force with a
positive offset on a beam (220x50x50mm) by a temperature of 5°C and a loading
frequency of 1 Hertz, see figure 3.The force is chosen such that the beam will
yield at 100 to 50.000 load repetitions.
Page 3
3
R2 = 0,5016
0,0
1,0
2,0
3,0
4,0
5,0
6,0
7,0
-0,4 -0,2 0,0 0,2 0,4 0,6 0,8
log(σo)
log(N
)
fatigue tests
5% confidence interval
fatigue curve (mean)
R2 = 0,2703
0,0
1,0
2,0
3,0
4,0
5,0
6,0
7,0
0,0 0,2 0,4 0,6 0,8
log(σo)
log(N
)
fatigue tests
5% confidence interval
fatigue curve (mean)
Figure 3. three point bending test, start of yielding
The fatigue properties can be expressed with:
)log()log()log( of akN σ⋅−= (1)
In which: Nf = number of loads to failure at stress level σo, σo = applied bending
stress (N/mm2), a and k = coefficient and intercept of the fatigue curve.
Experience with this model has shown several limitations, especially with aged
asphaltic concrete. The variation in the result of fatigue tests increases with the
age of the asphalt, resulting in a less reliable fatigue curve. This unreliable fit
often results in a flat, less inclined fatigue curve. Extrapolating the curve to one
load repetition suggests a very high flexural strength, see figure 4. This is in
contradiction with the fact that the overall strength was found to be decreasing in
time. For this reason an adapted material model has been developed.
Figure 4. Fatigue curve of the Hondsbossche seawall (left) and the Hellegatsdam
(right), both revetments with aged asphaltic concrete
Page 4
4
AGEING
The properties of asphalt are changing in time due to the exposure to oxygen,
water and ultraviolet light. The most important ageing mechanisms influencing
the strength in time are stripping of the mixture and hardening of the bitumen.
Stripping
Intrusion of moisture causes a loss of adhesion; stripping of the revetment.
Stripping is separation of the bitumen from the aggregate surfaces due to the
action of moisture. Stripping reduces the flexural strength of the asphaltic
concrete. In Dutch practice asphaltic concrete is covered with a surface treatment
to avoid direct contact with water. A low void ratio slows down the process of
stripping. A salt environment can accelerate the process of stripping.
Hardening of bitumen
Exposure to light and atmosphere causes hardening of the bitumen. This
influences the material properties such as the stiffness modulus, yield stress and
the elongation at break. Hardening of the bitumen causes the material to become
more brittle; the flexural strength increases and the elongation at break
decreases. As a result the material becomes more sensitive for cracking. Cracks
in aged asphaltic concrete are often temperature cracks, caused by hardening of
the bitumen. Higher temperatures and larger void ratios leads to a higher rate of
hardening.
Both process influence the flexural strength of asphaltic concrete in time causing
a decrease of the average strength and an increase of the variation in strength.
ADAPTED MATERIAL MODEL
Case studies
A material model that gives a good description of the strength at a limited
number of load repetitions is needed for safety assessments on asphaltic concrete
dike revetments. To feed this model with data a new test was introduced:
determination of the flexural strength at one load repetition on beams using a the
three point bending test. The following test conditions are used: a temperature of
5°C and a loading rate of 0,35 mm/s (which leads to an elongation rate which is
approximately equal to the elongation rate in the fatigue tests).
Tests were carried out material taken from several dikes to determine both the
fatigue properties and the flexural strength. For this purpose cores with a
diameter of 250 mm were drilled out of the revetment. From every core two
beams (220x50x50 mm) were taken. It is assumed that the properties of the two
beams are equal. The first beam was used to determine the flexural strength (at
one load repetition) the second beam was used to perform a fatigue test. The
results of the fatigue tests are presented in the figures 2 and 4. Some basic
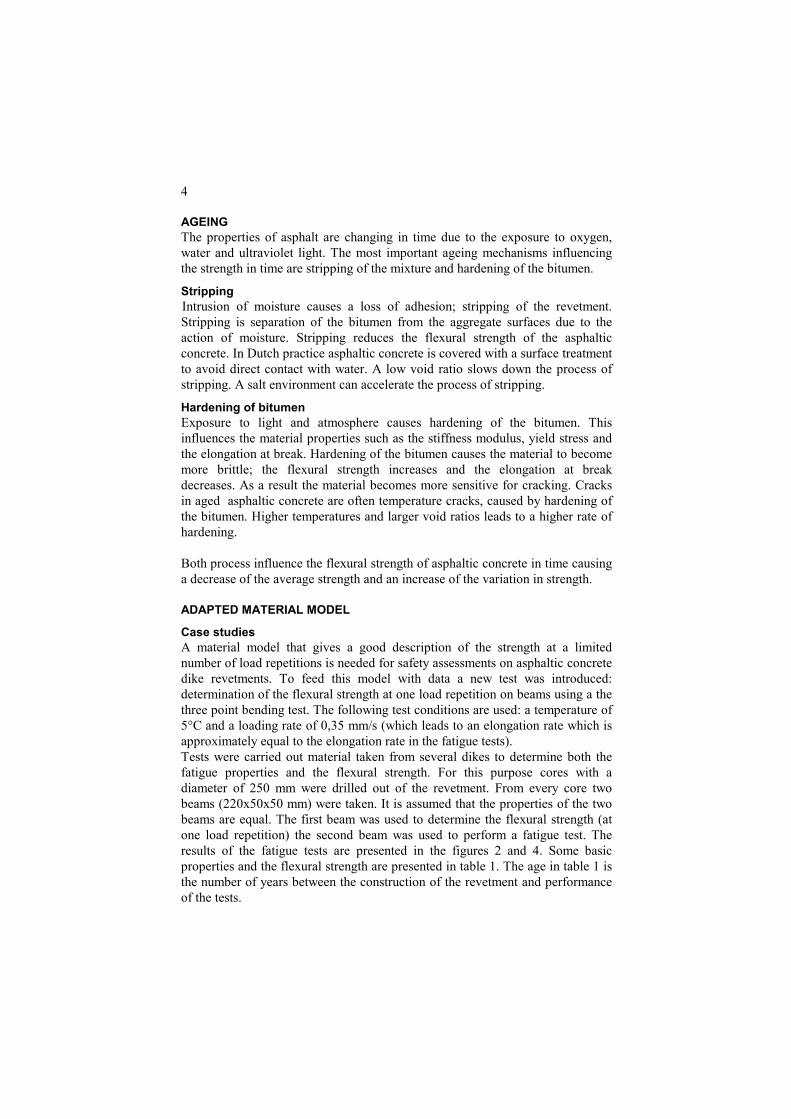
properties and the flexural strength are presented in table 1. The age in table 1 is
the number of years between the construction of the revetment and performance
of the tests.
Page 5
5
Table 1: basic data of dike revetments in case studies
voids (%) flexural strength (MPa) dike Age
(years) n x s n x s
Hellegatsdam 48 7 8,9 4,5 7 4,8 3,4
Hondsbossche 34 8 5,6 3,4 8 5,5 1,3
Flaauwe werk 22 8 3,8 0,9 8 5,4 0,7
In table 1 is n = number of samples, x = mean, s = standard deviation
Both age of the revetment and void ratio are indicators for the asphalt quality
and strength. The asphalt quality decreases in time and a high void ratio results
in a accelerated process of stripping.
The considered revetments are three typical examples from the total population.
The Hellegatsdam was constructed six years after the flooding in 1953 and has a
high average and standard deviation of the void ratio. This results in a revetment
with both locations with a high strength, due to hardening of the bitumen, an a
low strength, due to stripping. The overall asphalt quality is poor.
The Hondsbossche seawall was constructed in 1970. As a result of
improvements in mixture design both average and standard deviation of the void
ratio are less, compared with the Hellegatsdam. The asphalt quality can be
classified as moderate.
The Flaauwe werk dike was constructed in 1984 with modern equipment and
further optimized mixture design. This resulted in a low average and a low
standard deviation of the void ratio. The Flaauwe werk dike has a revetment with
a good asphalt quality.
Determining the adapted fatigue curves
Based on of a large set of experimental data the following basic principles for
the material model were established:
• The model should take into account the flexural strength at one load
repetition and should therefore be curvilinear on a log-log scale.
• The model should be suitable to deal with a large variation in the test
results. To reduce the variation (σo/σb) ), with σo = applied bending
stress in the fatigue test and σb= flexural strength at one load repetition,
is used as the independent variable instead of σo: Variation in Nf given a
σo can mostly be explained by the variation in σb. This method is also
known from fatigue curves for concrete pavements in road engineering.
From the literature, no examples are known of a curvilinear fatigue curve on a
log-log scale. Therefore a new model had to be developed. It was preferred to
develop a model based on linear regression because this allows to determine the
confidence interval and thus a comparison can be made with the confidence
interval of the traditional fatigue curve. With the following relation, estimates for
α and β can be determined with the use of linear regression:
Page 6
6
))log()log(log()log()((loglog obfN σσαβ −+= (2)
In which: Nf = number of loads to failure at stress level σ, σo = applied bending
stress in fatigue test (N/mm2), σb = flexural strength at one load repetition, α and
β= regression coefficients.
From a statistic point of view this is not an elegant solution because the
measured variable Nf is made depended from both the independent variable σo
and the measured variable σb. As a part of the research project a Bayesian
analysis was carried out (Telman, 2008) and it turned out that the more practical
approach, as presented in this paper, did not lead to significantly different
results. Data derived from both flexural strength tests and fatigue tests are given
in table 2.
Table 2: flexural strength an fatigue test results
Flaauwe werk Hondsbossche zeewering Hellegatsdam
σb σo Nf σb σo Nf σb σo Nf
6,7 1,7 29103 6,7 1,8 36035 2,9 1,4 1500
5,4 1,4 26544 5,2 1,8 6591 9,5 2,9 3000
5,2 1,5 22908 6,7 2,5 9635 1,7 0,8 5500
4,9 1,7 7386 4,2 1,7 3498 3,3 0,6 50000
4,7 2,3 2986 6,5 3,0 3078 8,3 1,6 18500
4,9 2,8 2046 4,8 2,3 1603 1,0 0,6 14000
5,0 3,0 1442 6,7 3,6 849 6,6 3,4 1000
6,3 3,9 556 3,4 2,1 899
The calculated values for α and β are presented in Table 3.
Table 3: values for α and β
Dike α β
Hellegatsdam 0,23 4,59
Hondsbossche 0,44 5,53
Flaauwe werk 0,39 5,46
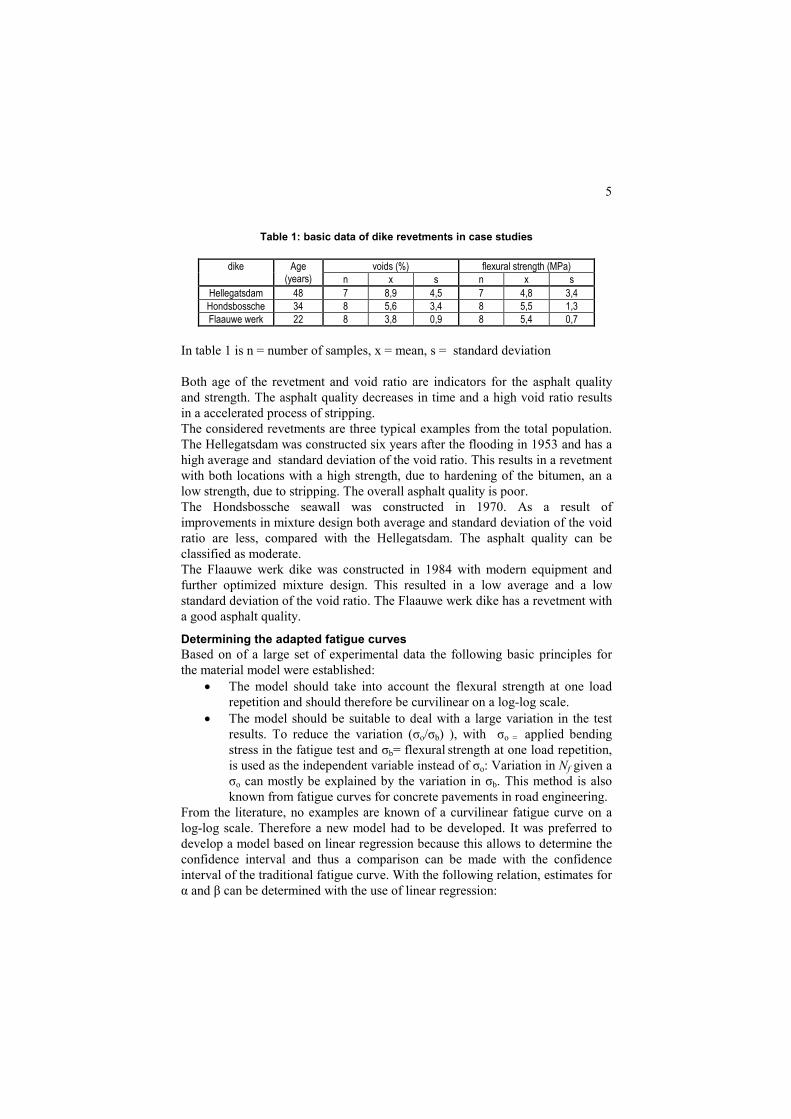
In figure 5 the resulting fatigue curves for the three considered revetments are
presented.
Page 7
7
Figure 5. fatigue curves with a double log-log scale: Hellegatsdam (upper left),
Hondsbossche seawall (upper right) and Flaauwe werk dike (bottom).
Presenting the relation on a log-log scale gives:
ασσβ ))log()(log()log( obfN −= (3)
Comparing the fatigue curves with the fatigue curves in figure 2 and 4 leads to
the following conclusions:
• Flaauwe werk dike: The reliability of the original fatigue curve is high
and remains unchanged with the adapted approach.
• Hondsbossche seawall: The reliability of the original fatigue curve is
low and improves significantly with the adapted approach.
• Hellegatsdam: The reliability of the original fatigue curve is low and
remains low with the adapted approach.
In figure 6 the resulting fatigue curves for the three considered revetments are
presented.
R2 = 0,9062
0,0
0,2
0,4
0,6
0,8
1,0
1,2
1,4
-2,0 -1,5 -1,0 -0,5 0,0 0,5 1,0
log( log(σb) - log(σo) )lo
g(
log(N
) )
test results
5% confidence level
fatigue curve (mean)
R2 = 0,36360,0
0,2
0,4
0,6
0,8
1,0
1,2
1,4
1,6
1,8
2,0
-2,0 -1,5 -1,0 -0,5 0,0 0,5 1,0
log( log(σb) - log(σo) )
log(
log(N
) )
test results
5% confidence interval
fatigue curve (mean)
R2 = 0,9497
0,0
0,2
0,4
0,6
0,8
1,0
1,2
1,4
-2,0 -1,5 -1,0 -0,5 0,0 0,5 1,0
log( log(σb) - log(σo) )
log(
log(N
) )
test results
5% confidence interval
fatigue curve (mean)
Page 8
8
R2 = 0,9062
0,0
1,0
2,0
3,0
4,0
5,0
6,0
7,0
0,0 0,2 0,4 0,6 0,8 1,0log(σb) - log(σo)
log(N
)
test results
fatigue curve (mean)
R2 = 0,9497
0,0
1,0
2,0
3,0
4,0
5,0
6,0
0,0 0,2 0,4 0,6 0,8 1,0log(σb) - log(σo)
log(N
)
test results
fatigue curve (mean)
Figure 6. fatigue curves with a log-log scale: Hellegatsdam (upper left),
Hondsbossche seawall (upper right) and Flaauwe werk dike (bottom)
Design curves
With the presented method the average strength under repeated loading can be
determined. For both design purposes and performing safety assessments a more
conservative curve is required. The design curve should represent both a
characteristic flexural strength at one load repetition and – for a good asphalt
quality - a characteristic curve in the area of the fatigue tests which is
approximately equal to the classic linear fatigue curve. For this, several options
are developed and compared. The most relevant options are presented in figure
7.
R2 = 0,3636
0,0
1,0
2,0
3,0
4,0
5,0
6,0
0,0 0,2 0,4 0,6 0,8 1,0log(σb) - log(σo)
log(N
)
test results
fatigue curve (mean)
Page 9
9
0
1
2
3
4
5
6
0,0 0,1 0,2 0,3 0,4 0,5 0,6 0,7 0,8 0,9 1,0
log(σo)
log(N
)
Bayes_mean
Bayes_char
regr_mean
old_mean
old_char
flexural strength tests
fatigue tests
Figure 7. several design curves compared (Flaauwe werk dike)
The presented line regr_mean is a combination of the mean fatigue curve as
presented in figure 6 and a 5% characteristic value for the flexural strength at
one load repetition. Again this is not an ideal solution from a statistic point of
view; the curve does not explicitly take into account variation contained in the
fatigue tests. The variation in the flexural strength tests now represent the
uncertainty in the results of the fatigue tests as well. In practice the method meets
the requirements. In figure 8 the design fatigue curves for the Hellegatsdam and
the Hondsbossche seawall are given.
Figure 8. design curves Hellegatsdam (left) and Hondsbossche seawall (right)
The fatigue curves show a decreasing influence of fatigue for poor asphalt
quality. The characteristic value of the flexural strength at one load repetition
can be used to characterize the strength instead of the fatigue curve. The results
of the flexural strength tests and the fatigue tests have equal stress levels.
0,0
1,0
2,0
3,0
4,0
5,0
6,0
-1,00 -0,50 0,00 0,50 1,00 1,50
log(σo)
log(N
)
fatigue tests
f lexural strength tests
5% conf. level fl. strength
fatigue curve (design)
fatigue curve (mean)
0,0
1,0
2,0
3,0
4,0
5,0
6,0
-1,00 -0,50 0,00 0,50 1,00 1,50
log(σo)
log(N
)
fatigue tests
flexural strength tests
5% conf. level f.l strength
new design
new mean
Page 10
10
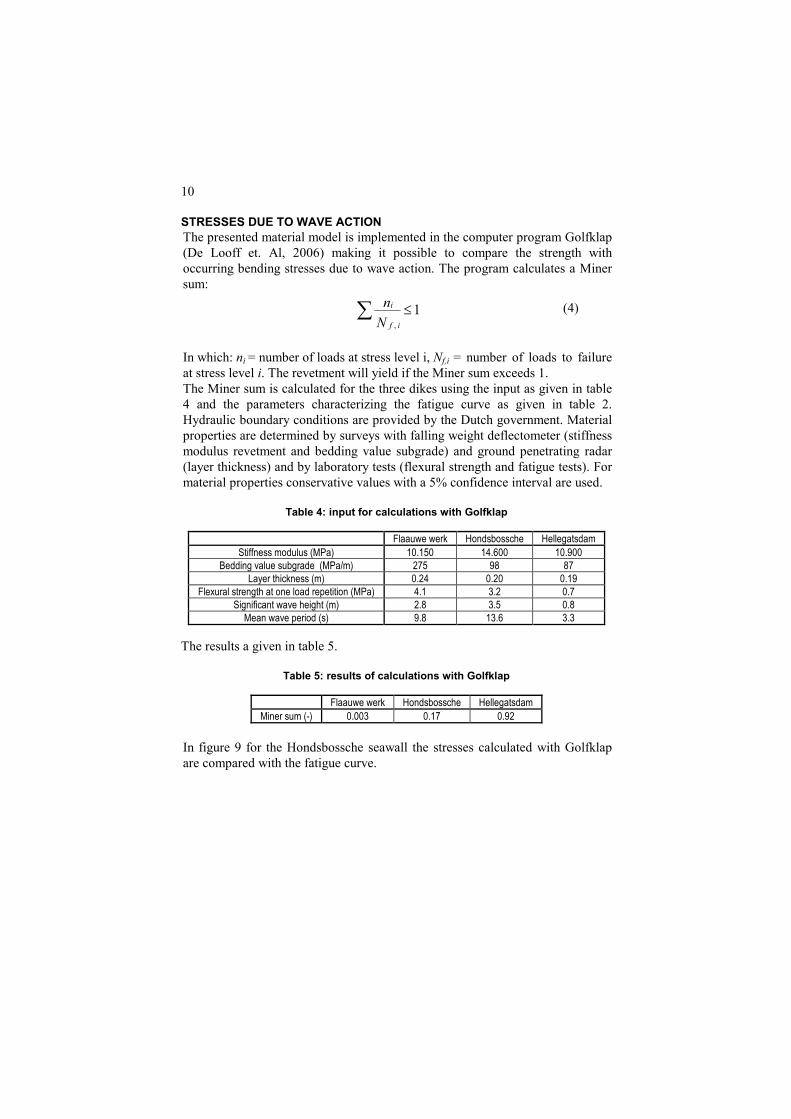
STRESSES DUE TO WAVE ACTION
The presented material model is implemented in the computer program Golfklap
(De Looff et. Al, 2006) making it possible to compare the strength with
occurring bending stresses due to wave action. The program calculates a Miner
sum:
1,
N
n
if
i ≤∑ (4)
In which: ni = number of loads at stress level i, Nf,i = number of loads to failure
at stress level i. The revetment will yield if the Miner sum exceeds 1.
The Miner sum is calculated for the three dikes using the input as given in table
4 and the parameters characterizing the fatigue curve as given in table 2.
Hydraulic boundary conditions are provided by the Dutch government. Material
properties are determined by surveys with falling weight deflectometer (stiffness
modulus revetment and bedding value subgrade) and ground penetrating radar
(layer thickness) and by laboratory tests (flexural strength and fatigue tests). For
material properties conservative values with a 5% confidence interval are used.
Table 4: input for calculations with Golfklap
Flaauwe werk Hondsbossche Hellegatsdam
Stiffness modulus (MPa) 10.150 14.600 10.900
Bedding value subgrade (MPa/m) 275 98 87
Layer thickness (m) 0.24 0.20 0.19
Flexural strength at one load repetition (MPa) 4.1 3.2 0.7
Significant wave height (m) 2.8 3.5 0.8
Mean wave period (s) 9.8 13.6 3.3
The results a given in table 5.
Table 5: results of calculations with Golfklap
Flaauwe werk Hondsbossche Hellegatsdam
Miner sum (-) 0.003 0.17 0.92
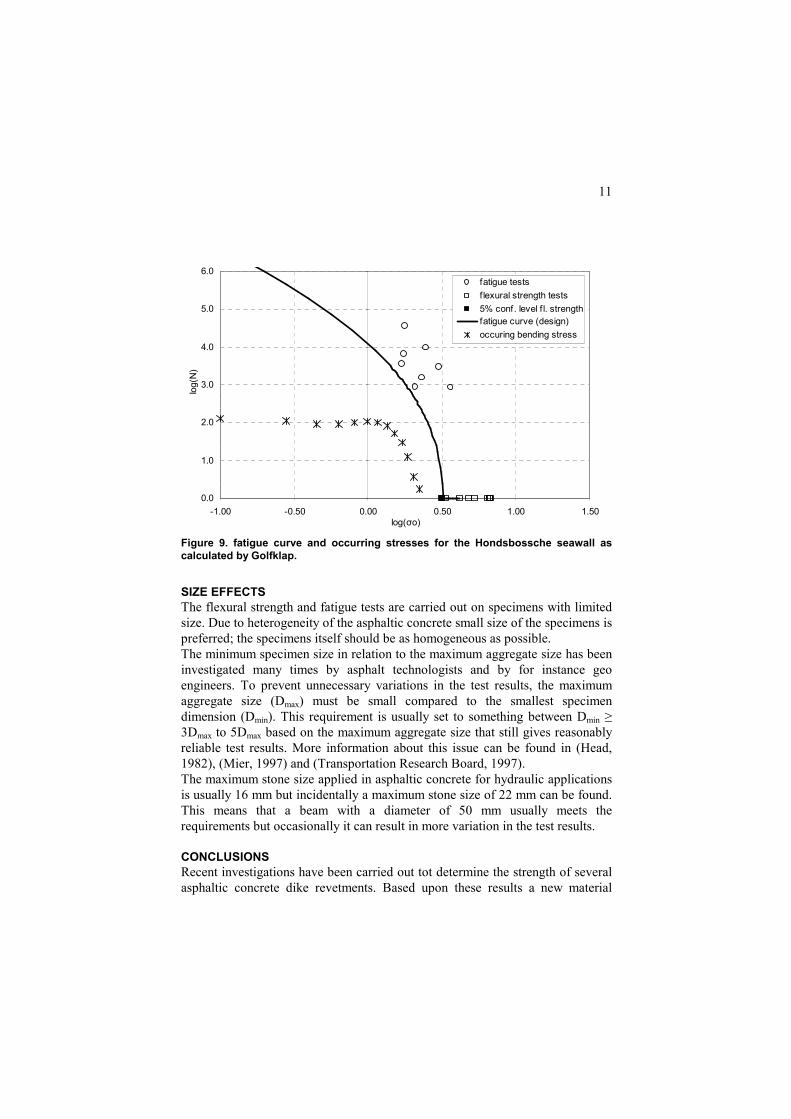
In figure 9 for the Hondsbossche seawall the stresses calculated with Golfklap
are compared with the fatigue curve.
Page 11
11
0.0
1.0
2.0
3.0
4.0
5.0
6.0
-1.00 -0.50 0.00 0.50 1.00 1.50
log(σo)
log
(N)
fatigue tests
f lexural strength tests
5% conf. level f l. strength
fatigue curve (design)
occuring bending stress
Figure 9. fatigue curve and occurring stresses for the Hondsbossche seawall as
calculated by Golfklap.
SIZE EFFECTS
The flexural strength and fatigue tests are carried out on specimens with limited
size. Due to heterogeneity of the asphaltic concrete small size of the specimens is
preferred; the specimens itself should be as homogeneous as possible.
The minimum specimen size in relation to the maximum aggregate size has been
investigated many times by asphalt technologists and by for instance geo
engineers. To prevent unnecessary variations in the test results, the maximum
aggregate size (Dmax) must be small compared to the smallest specimen
dimension (Dmin). This requirement is usually set to something between Dmin ≥
3Dmax to 5Dmax based on the maximum aggregate size that still gives reasonably
reliable test results. More information about this issue can be found in (Head,
1982), (Mier, 1997) and (Transportation Research Board, 1997).
The maximum stone size applied in asphaltic concrete for hydraulic applications
is usually 16 mm but incidentally a maximum stone size of 22 mm can be found.
This means that a beam with a diameter of 50 mm usually meets the
requirements but occasionally it can result in more variation in the test results.
CONCLUSIONS
Recent investigations have been carried out tot determine the strength of several
asphaltic concrete dike revetments. Based upon these results a new material
Page 12
12
model has been developed to describe the flexural strength of asphaltic concrete.
This new model has been integrated in the latest version of Golfklap. With this
computer model asphalt dike revetments can be designed and evaluated on wave
impacts (De Looff et. al., 2006).
ACKNOWLEDGMENTS
Peter Blommaart (Rijkswaterstaat, Ministry of infrastructure and Environment)
and Ludolph Wentholt (Stowa) are acknowledged for providing the funding for
this research.
REFERENCES Head, K., Manual of Soil Laboratory Testing, Vol. 2: Permeability, Shear Strength and
Compressibility Tests, Pentech Press Limited, Estover Road, Plymouth, Devon, ISBN 0-7273-
305-31, 1982
de Looff, Arjan K., Robert 't Hart, Kees C. Montauban, Martin F.C. van de Ven, 2006, GOLFKLAP,
a model to determine the impact of waves on dike structures with an asphaltic concrete layer,
Proceeding of the 30th international conference Coastal Engineering 2006, Volume 4, 241-263.
Mier, J.G.M. van, Vervuurt, A. and Schlangen, E., Boundary and Size Effects in Uniaxial Tensile
Tests: A Numerical and Experimental Study, Proceeding of Fracture and Damage in Quasibrittle
Structures, Eds. Bazant et al, ISBN 0-419-19280-8, 1994
Montauban, C.C. and Van de Ven, M.F.C. 1993. Determination of mechanical properties of
hydraulic asphaltic concrete by means of a three-point bending test, Eurobitume conference 1993.
Schönian, E., The Shell bitumen hydraulic engineering handbook, Shell International Petroleum
Company Ltd, London, 1999.
Telman, J. Comparison of the Bayesian model and the regression model (in Dutch), TNO, Delft,
September 2008.
Transportation Research Board, Design and Evaluation of Large-Stone Asphalt Mixes, National
Cooperative Highway Research Program (NCHRP), Texas Transportation Institute & Texas A&M
University System, Report number 386, National Academy Press, Washington D.C. 1997
Page 13
13
KEYWORDS – CSt2011
P0172
RESISTANCE OF AGED ASPHALTIC CONCRETE TO WAVE ATTACK
1st
Author: Looff, Arjan K. de
2nd
Author: Ven, Martin F.C. van de
3rd
Author: Hart, Robert `t
Ageing
Asphaltic concrete
Dike revetments
Fatigue
Flexural strength
Wave impact