31
fcx.com 2 nd Quarter 2018 Earnings Conference Call July 25, 2018

fcx.com
2nd Quarter 2018 Earnings Conference Call
July 25, 2018

Cautionary Statement
Regarding Forward-Looking Statements This presentation contains forward-looking statements in which FCX discusses its potential future performance. Forward-looking statements are all statements other than statements of historical facts, such as projections or expectations relating to ore grades and milling rates, production and sales volumes, unit net cash costs, operating cash flows, capital expenditures, the transaction contemplated by the non-binding Heads of Agreement between FCX, PT Freeport Indonesia (PT-FI),PT Indonesia Asahan Aluminium (Persero) (Inalum) and Rio Tinto, exploration efforts and results, development and production activities and costs, liquidity, tax rates, the impact of copper, gold and molybdenum price changes, the impact of deferred intercompany profits on earnings, reserve estimates, future dividend payments, and share purchases and sales. The words “anticipates,” “may,” “can,” “plans,” “believes,” “estimates,” “expects,” “projects,” "targets," “intends,” “likely,” “will,” “should,” “to be,” ”potential" and any similar expressions are intended to identify those assertions as forward-looking statements. The declaration of dividends is at the discretion of our Board of Directors (Board) and will depend on our financial results, cash requirements, future prospects, and other factors deemed relevant by the Board.
FCX cautions readers that forward-looking statements are not guarantees of future performance and actual results may differ materially from those anticipated, projected or assumed in the forward-looking statements. Important factors that can cause FCX's actual results to differ materially from those anticipated in the forward-looking statements include supply of and demand for, and prices of, copper, gold and molybdenum; mine sequencing; production rates; potential inventory adjustments; potential impairment of long-lived mining assets; FCX’s ability to complete the transaction contemplated by the non-binding Heads of Agreement, which is subject to the negotiation and documentation of definitive agreements, including purchase and sale agreements, the extension and stability of PT-FI’s long-term mining rights through 2041 in a form acceptable to FCX and Inalum, a shareholders’ agreement between FCX and Inalum providing for continuity of FCX’s management of PT-FI’s operations and addressing governance arrangements, and resolution of administrative sanctions and environmental regulatory matters pending before Indonesia’s Ministry of Environment and Forestry satisfactory to the Indonesian Government, FCX and Inalum, the terms of all of which will be subject to FCX Board approval; PT-FI’s ability to obtain an extension of its temporary IUPK after July 31, 2018; the potential effects of violence in Indonesia generally and in the province of Papua; industry risks; regulatory changes; political risks; labor relations; weather- and climate-related risks; environmental risks (including resolution of the administrative sanctions and other environmental matters pending before the Indonesian Ministry of Environment and Forestry); litigation results (including the final disposition of Indonesian tax disputes and the outcome of Cerro Verde’s royalty dispute with the Peruvian national tax authority); and other factors described in more detail under the heading “Risk Factors” in FCX's Annual Report on Form 10-K for the year ended December 31, 2017, filed with the U.S. Securities and Exchange Commission (SEC) as updated by FCX’s subsequent filings with the SEC.
Investors are cautioned that many of the assumptions upon which FCX's forward-looking statements are based are likely to change after the forward-looking statements are made, including for example commodity prices, which FCX cannot control, and production volumes and costs, some aspects of which FCX may not be able to control. Further, FCX may make changes to its business plans that could affect its results. FCX cautions investors that it does not intend to update forward-looking statements more frequently than quarterly notwithstanding any changes in its assumptions, changes in business plans, actual experience or other changes, and FCX undertakes no obligation to update any forward-looking statements.
This presentation also includes forward-looking statements regarding mineralized material and potential resources not included in proven and probable mineral reserves. Mineralized material is a mineralized body that has been delineated by appropriately spaced drilling and/or underground sampling to support the estimated tonnage and average metal grades. Such a deposit cannot qualify as recoverable proven and probable reserves until legal and economic feasibility are confirmed based upon a comprehensive evaluation of development costs, unit costs, grades, recoveries and other material factors. Our estimates of potential resources are based on geologically reasonable interpolation and extrapolation of more limited information than is used for mineralized material (measured and indicated) and requires higher copper prices. Significant additional drilling is required and no assurance can be given that the potential quantities of metal will be produced. Accordingly, no assurances can be given that estimated mineralized material and potential resources not included in reserves will become proven and probable reserves.
This presentation also contains certain financial measures such as unit net cash costs (credits) per pound of copper and molybdenum, net debt and adjusted EBITDA (earnings before interest, taxes, depreciation and amortization) that are not recognized under U.S. generally accepted accounting principles. As required by SEC Regulation G, reconciliations of unit net cash costs (credits) per pound of copper and molybdenum to amounts reported in FCX's consolidated financial statements are in the supplemental schedules of FCX’s 2Q18 press release, which are also available on FCX's website, "fcx.com.” Net debt equals gross debt less cash. A reconciliation of adjusted EBITDA to amounts reported in FCX’s consolidated financial statements is included on slide 29.
2
2Q18 Highlights
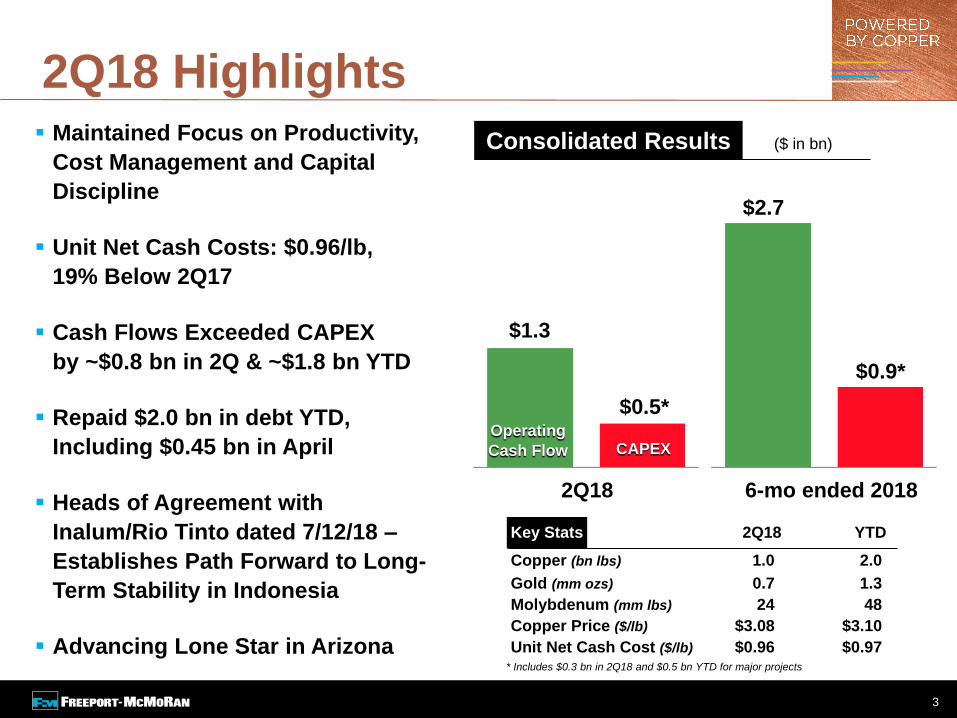
($ in bn)Consolidated Results
$0.5*Operating
Cash Flow CAPEX
$1.3
Key Stats 2Q18 YTD
Copper (bn lbs) 1.0 2.0
Gold (mm ozs) 0.7 1.3
Molybdenum (mm lbs) 24 48
Copper Price ($/lb) $3.08 $3.10
Unit Net Cash Cost ($/lb) $0.96 $0.97
Maintained Focus on Productivity,
Cost Management and Capital
Discipline
Unit Net Cash Costs: $0.96/lb,
19% Below 2Q17
Cash Flows Exceeded CAPEX
by ~$0.8 bn in 2Q & ~$1.8 bn YTD
Repaid $2.0 bn in debt YTD,
Including $0.45 bn in April
Heads of Agreement with
Inalum/Rio Tinto dated 7/12/18 –
Establishes Path Forward to Long-
Term Stability in Indonesia
Advancing Lone Star in Arizona* Includes $0.3 bn in 2Q18 and $0.5 bn YTD for major projects
$0.9*
$2.7
2Q18 6-mo ended 2018
3
Copper Market Commentary
Global Trade Issues Impacting Commodities Market Sentiment and Causing
Macro Uncertainty
• Copper Down 14% Since June 15th
Current Copper Physical Market Broadly Balanced Globally
• Exchange Stocks (LME, COMEX and Shanghai) Down ~90 kt (13%) Since June 15th
Real Demand Remains Positive
Supply Growth is Muted
• Current Price is ~15% Below Incentive Levels – Underinvestment Likely to Continue
Fundamentals Remain Positive
• Positive Long-term Demand from Global Growth and Renewable Energy/EV’s
• Declining Ore Grades from Currently Producing Mines and Lack of Actionable
Projects Expected to Constrain Future Supply
• Absent a Global Recession, Market Deficits in Copper Appear Inevitable
4

POWERED BY COPPERHeads of Agreement – 7/12/18
Transaction Benefits
Establishes New Long-term Partnership between FCX and Government of Indonesia
Long-Term Stability for Grasberg Operations
FCX Retains Current Existing Economics
• Preserves FCX Share of Future Cash Flows and Net Asset Values
• Non-Dilutive to FCX Shareholders
• Continues to Manage Operations
Strong Alignment among Indonesian Government SOE, Papuan Local Governments and FCX
Positive for All Parties
Subject to Definitive Agreements – Closing Expected in 2H18
5
See Cautionary Statement.

POWERED BY COPPER
PT-FI Operations Review
2Q18 Mill Rate: 188 t/d
• Copper Grade: 1.06%
• Gold Grade: 1.77 g/t
2Q18 Production
• 347 mm lbs (74% Above 2Q17)
• 740 k ozs (113% Above 2Q17)
2Q18 Unit Net Cash Costs: 77¢ Credit
~$1.6 Billion in Dividends YTD
See Cautionary Statement.
Extension of Open Pit Through 1H19
Deferred Start-up of Deep MLZ (DMLZ)
• Hydraulic Fracturing Operations to Pre-
Condition Cave/Manage Rock Stress
• Expect Caving to Commence Mid-2019
Grasberg Block Cave Production to
Commence in 1H19
PT-FI 5-year Metal:
• Copper: 5.3 bn lbs
• Gold: 7.6 mm ozs
• No Material Change Compared to April Plan
Actual Results Mine Plan Adjustments
6
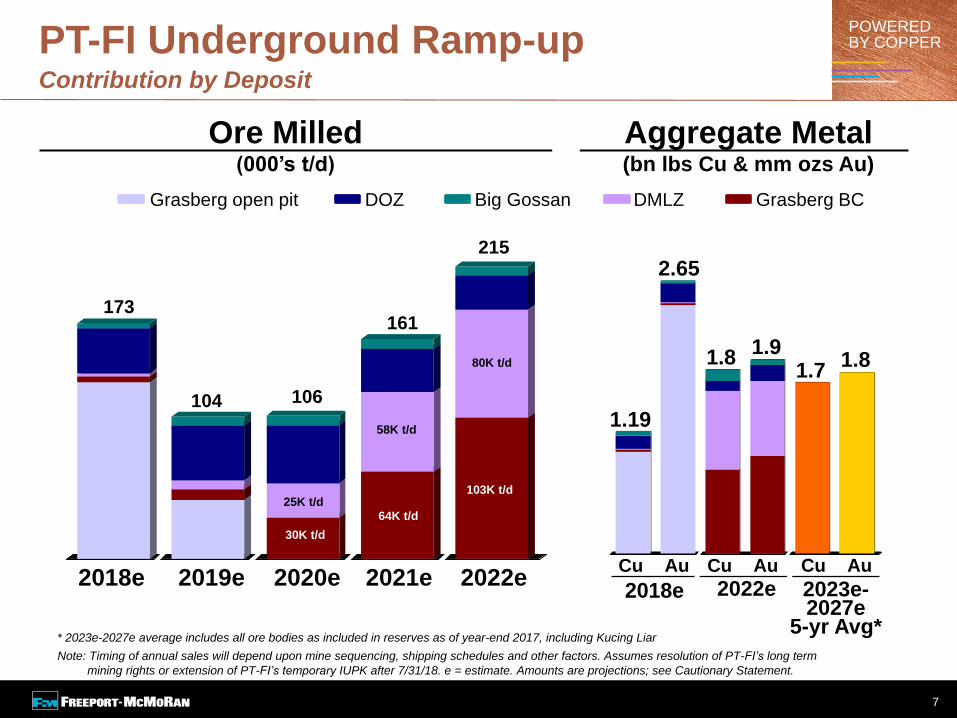
POWERED BY COPPERPT-FI Underground Ramp-up
Contribution by Deposit
Grasberg open pit DOZ DMLZBig Gossan Grasberg BC
2018e 2022e
1.19
2.65
1.81.9
Aggregate Metal(bn lbs Cu & mm ozs Au)
Ore Milled(000’s t/d)
173
104 106
161
215
30K t/d
64K t/d
103K t/d25K t/d
58K t/d
80K t/d
2018e 2019e 2020e 2021e 2022e2023e-2027e
5-yr Avg*
1.71.8
Cu Au Cu Au Cu Au
* 2023e-2027e average includes all ore bodies as included in reserves as of year-end 2017, including Kucing Liar
Note: Timing of annual sales will depend upon mine sequencing, shipping schedules and other factors. Assumes resolution of PT-FI’s long term
mining rights or extension of PT-FI’s temporary IUPK after 7/31/18. e = estimate. Amounts are projections; see Cautionary Statement.
7

POWERED BY COPPER
Lone Star in Arizona Advancing 12/31/2017 Reserve: 4.4 bn lbs of Copper
(Oxides Only)
$850 mm Project ($113 mm incurred thru 6/30/18)
• Utilizes Existing Infrastructure at Safford
Commenced Pre-stripping Activities in 1Q18
Provides Exposure to Large Sulfide Deposit (60+
bn lbs Contained Copper)
Low Execution Risk
First Copper Expected by YE 2020
Key Statistics (Excluding Sulfide)
• Estimated production: ~200 mm lbs/year
• Mine life: ~20 Years
• 50% of capital costs are for mine
equipment & pre-production stripping
• Estimated unit cash cost: $1.75/lb
• After-tax NPV @ 8%: $0 ($2.40 Copper) to
$1.2 Billion ($3.50 Copper)
See Cautionary Statement.
8
Road to Peak #1

POWERED BY COPPER
Recent Lone Star Sulfide Intercepts
9
Leach Pit
N
LS18-0283A
1,239m of 0.46% CuLS17-0264
718m of 0.60% Cu
LS18-0270
792m of 0.46% Cu
Current
Topographic Surface
LS18-0280
780m of 0.47% Cu
LS17-0265
1,202m of 0.63% CuLS18-0279A
576m of 0.51% Cu
LS17-0267
1,479m of 0.45% CuLS17-0257
1,213m of 0.47% Cu
LS17-0259
1,048m of 0.44% Cu
1 km
Extent of 0.30% Cu Sulfide
Based on Previous Drilling
Leach Pit
1 km
LS18-270
LS18-274
LS18-280
LS18-283A
Extent of
+0.30 % Cu Sulfide
Based on
Previous Drilling
NPlan View2Q18 Lone Star Intercepts
Drill Hole meters % Cu meters % Cu meters % Cu
LS18-270 792 0.46 64 0.68 219 0.64
LS18-274 369 0.39 NA NA NA NA
LS18-280 780 0.47 192 0.81 67 0.99
LS18-283A 1,239 0.46 125 0.60 140 0.64
Significant IntervalsIntercept
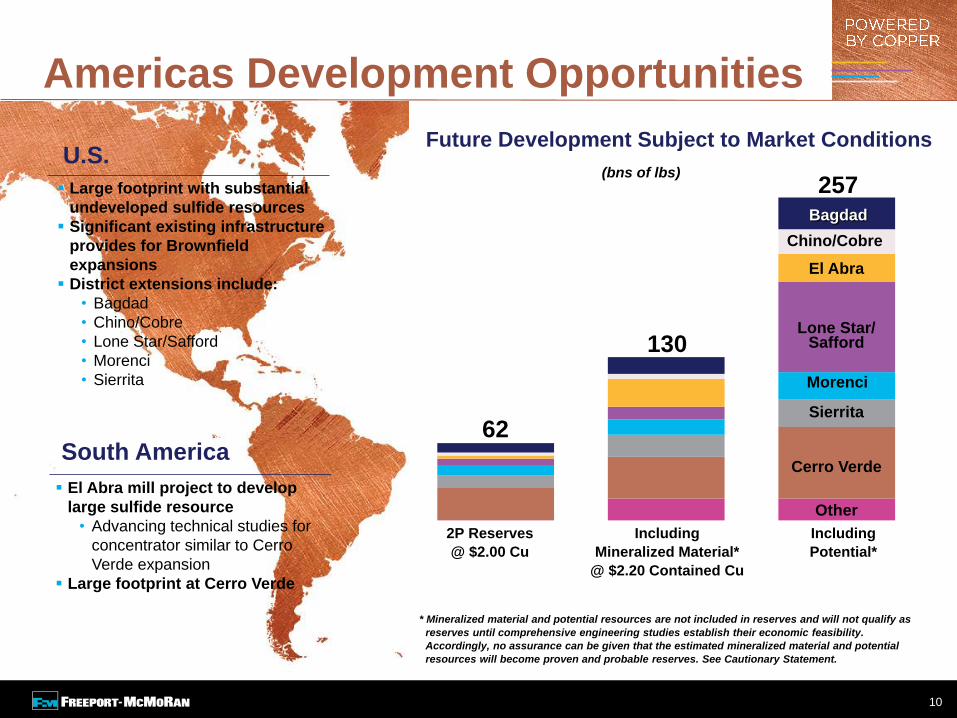
Americas Development Opportunities
• Large footprint with substantial
undeveloped sulfide resources
• Significant existing infrastructure
provides for Brownfield expansions
• District extensions include:
Bagdad
Chino/Cobre
Lone Star/Safford
Morenci
Sierrita
• El Abra mill project to develop
large sulfide resource
• Advancing technical
studies for concentrator
similar to Cerro Verde
expansion
• Large footprint at Cerro Verde
South America
* Mineralized material and potential resources are not included in reserves and will not qualify as
reserves until comprehensive engineering studies establish their economic feasibility.
Accordingly, no assurance can be given that the estimated mineralized material and potential
resources will become proven and probable reserves. See Cautionary Statement.
2P Reserves
@ $2.00 Cu
Including
Mineralized Material*
@ $2.20 Contained Cu
Including
Potential*
Other
Sierrita
Morenci
Lone Star/Safford
El Abra
Chino/Cobre
Cerro Verde
Bagdad
62
130
257(bns of lbs)
Future Development Subject to Market Conditions
Large footprint with substantial
undeveloped sulfide resources
Significant existing infrastructure
provides for Brownfield
expansions
District extensions include:
• Bagdad
• Chino/Cobre
• Lone Star/Safford
• Morenci
• Sierrita
El Abra mill project to develop
large sulfide resource
• Advancing technical studies for
concentrator similar to Cerro
Verde expansion
Large footprint at Cerro Verde
U.S.
South America
10
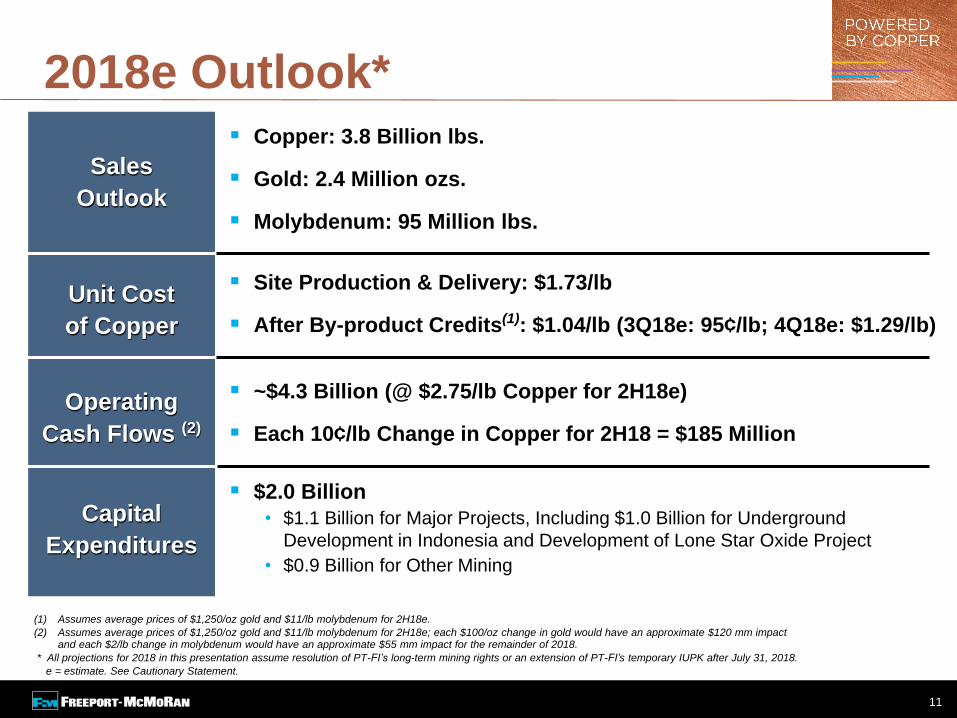
2018e Outlook* Copper: 3.8 Billion lbs.
Gold: 2.4 Million ozs.
Molybdenum: 95 Million lbs.
Sales
Outlook
Unit Cost
of Copper
Operating
Cash Flows (2)
Capital
Expenditures
Site Production & Delivery: $1.73/lb
After By-product Credits(1): $1.04/lb (3Q18e: 95¢/lb; 4Q18e: $1.29/lb)
~$4.3 Billion (@ $2.75/lb Copper for 2H18e)
Each 10¢/lb Change in Copper for 2H18 = $185 Million
$2.0 Billion
• $1.1 Billion for Major Projects, Including $1.0 Billion for Underground
Development in Indonesia and Development of Lone Star Oxide Project
• $0.9 Billion for Other Mining
(1) Assumes average prices of $1,250/oz gold and $11/lb molybdenum for 2H18e.
(2) Assumes average prices of $1,250/oz gold and $11/lb molybdenum for 2H18e; each $100/oz change in gold would have an approximate $120 mm impactand each $2/lb change in molybdenum would have an approximate $55 mm impact for the remainder of 2018.
* All projections for 2018 in this presentation assume resolution of PT-FI’s long-term mining rights or an extension of PT-FI’s temporary IUPK after July 31, 2018.
e = estimate. See Cautionary Statement.
11
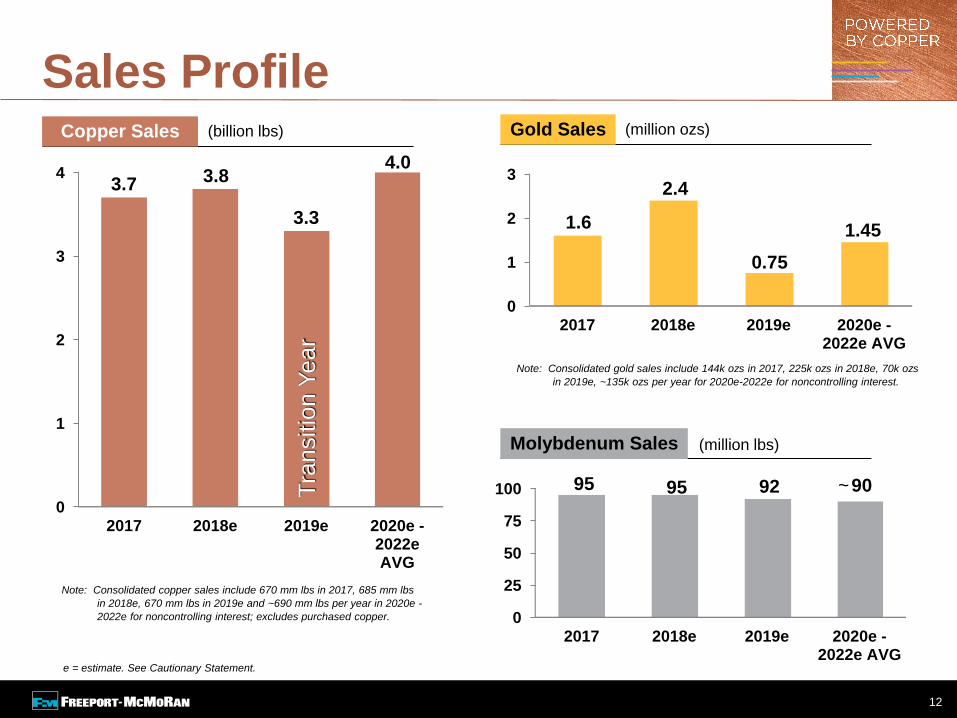
Sales Profile
Note: Consolidated copper sales include 670 mm lbs in 2017, 685 mm lbs
in 2018e, 670 mm lbs in 2019e and ~690 mm lbs per year in 2020e -
2022e for noncontrolling interest; excludes purchased copper.
e = estimate. See Cautionary Statement.
Note: Consolidated gold sales include 144k ozs in 2017, 225k ozs in 2018e, 70k ozs
in 2019e, ~135k ozs per year for 2020e-2022e for noncontrolling interest.
0
1
2
3
2017 2018e 2019e 2020e -2022e AVG
1.6
2.4
0.75
1.45
(million ozs)
(million lbs)
(billion lbs)
0
25
50
75
100
2017 2018e 2019e 2020e -2022e AVG
95 95 92 90
Molybdenum Sales
Gold SalesCopper Sales
0
1
2
3
4
2017 2018e 2019e 2020e -2022eAVG
3.7 3.8
3.3
4.0
Tra
nsitio
n Y
ear
12
~
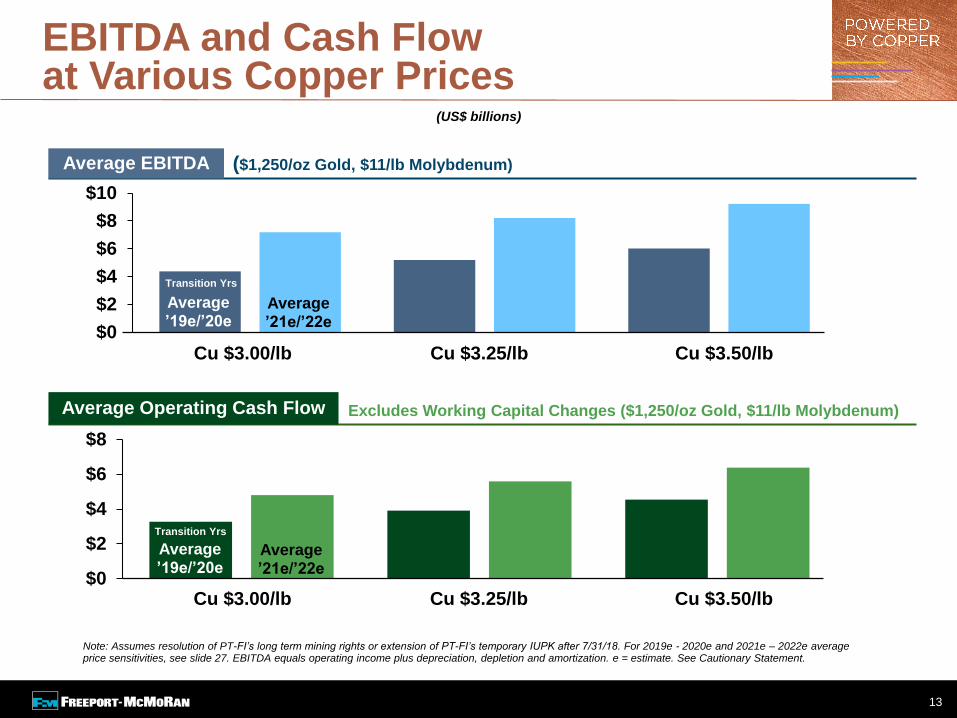
EBITDA and Cash Flow at Various Copper Prices
($1,250/oz Gold, $11/lb Molybdenum)
(US$ billions)
Note: Assumes resolution of PT-FI’s long term mining rights or extension of PT-FI’s temporary IUPK after 7/31/18. For 2019e - 2020e and 2021e – 2022e average price sensitivities, see slide 27. EBITDA equals operating income plus depreciation, depletion and amortization. e = estimate. See Cautionary Statement.
Cu $3.00/lb Cu $3.25/lb Cu $3.50/lb
Excludes Working Capital Changes ($1,250/oz Gold, $11/lb Molybdenum)Average Operating Cash Flow
Average EBITDA
13
$0
$2
$4
$6
$8
$10
Average’21e/’22e
Average’19e/’20e
Cu $3.00/lb Cu $3.25/lb Cu $3.50/lb$0
$2
$4
$6
$8
Average’21e/’22e
Average’19e/’20e
Transition Yrs
Transition Yrs
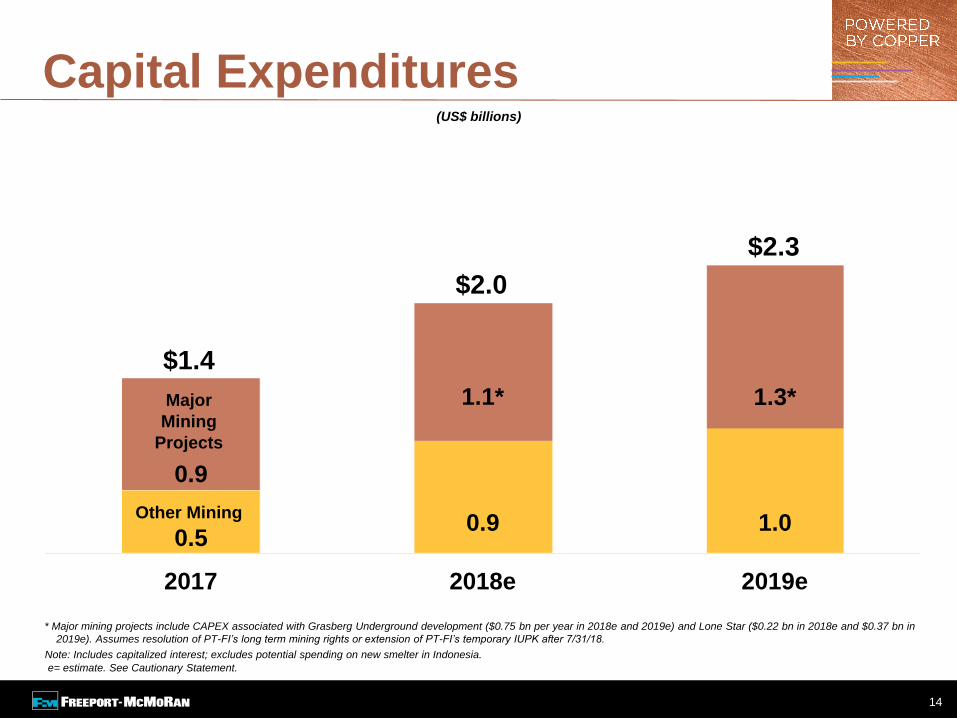
2017 2018e 2019e
Capital Expenditures
Note: Includes capitalized interest; excludes potential spending on new smelter in Indonesia.
e= estimate. See Cautionary Statement.
Major
Mining
Projects
0.9
1.1*
$2.0
$1.4
* Major mining projects include CAPEX associated with Grasberg Underground development ($0.75 bn per year in 2018e and 2019e) and Lone Star ($0.22 bn in 2018e and $0.37 bn in
2019e). Assumes resolution of PT-FI’s long term mining rights or extension of PT-FI’s temporary IUPK after 7/31/18.
1.3*
$2.3
0.50.9 1.0
Other Mining
(US$ billions)
14

Financial Policy
Net Debt at 6/30/18: $7.3 Bn*
• LTM Leverage Ratio: 0.9x
Significant Deleveraging Over Last
Two Years
Positive Market to Enable Further
Debt Reduction & Enhanced Returns
to Shareholders
Disciplined Approach to Investing in
Attractive Growth Projects
Board Reinstated Quarterly Cash
Dividend on Common Stock
• Paid Initial Quarterly Dividend
on May 1, 2018
Board Reviews Financial Policy on
Ongoing Basis
Balanced Approach
15
* Net debt equals gross debt less consolidated cash. See Cautionary Statement.

Reference
Slides
Financial Highlights
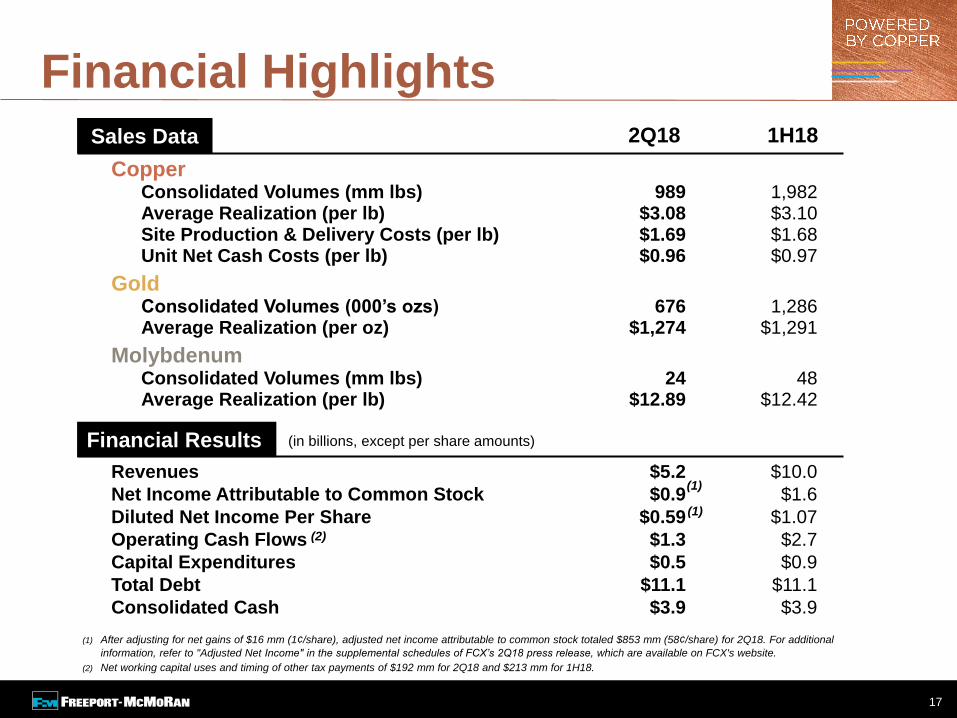
CopperConsolidated Volumes (mm lbs) 989 1,982Average Realization (per lb) $3.08 $3.10Site Production & Delivery Costs (per lb) $1.69 $1.68Unit Net Cash Costs (per lb) $0.96 $0.97
GoldConsolidated Volumes (000’s ozs) 676 1,286Average Realization (per oz) $1,274 $1,291
MolybdenumConsolidated Volumes (mm lbs) 24 48Average Realization (per lb) $12.89 $12.42
2Q18 1H18
Financial Results
(1) After adjusting for net gains of $16 mm (1¢/share), adjusted net income attributable to common stock totaled $853 mm (58¢/share) for 2Q18. For additional
information, refer to "Adjusted Net Income" in the supplemental schedules of FCX’s 2Q18 press release, which are available on FCX's website.
(2) Net working capital uses and timing of other tax payments of $192 mm for 2Q18 and $213 mm for 1H18.
Revenues $5.2 $10.0
Net Income Attributable to Common Stock $0.9 $1.6
Diluted Net Income Per Share $0.59 $1.07
Operating Cash Flows $1.3 $2.7
Capital Expenditures $0.5 $0.9
Total Debt $11.1 $11.1
Consolidated Cash $3.9 $3.9
(2)
(1)
(1)
Sales Data
(in billions, except per share amounts)
17
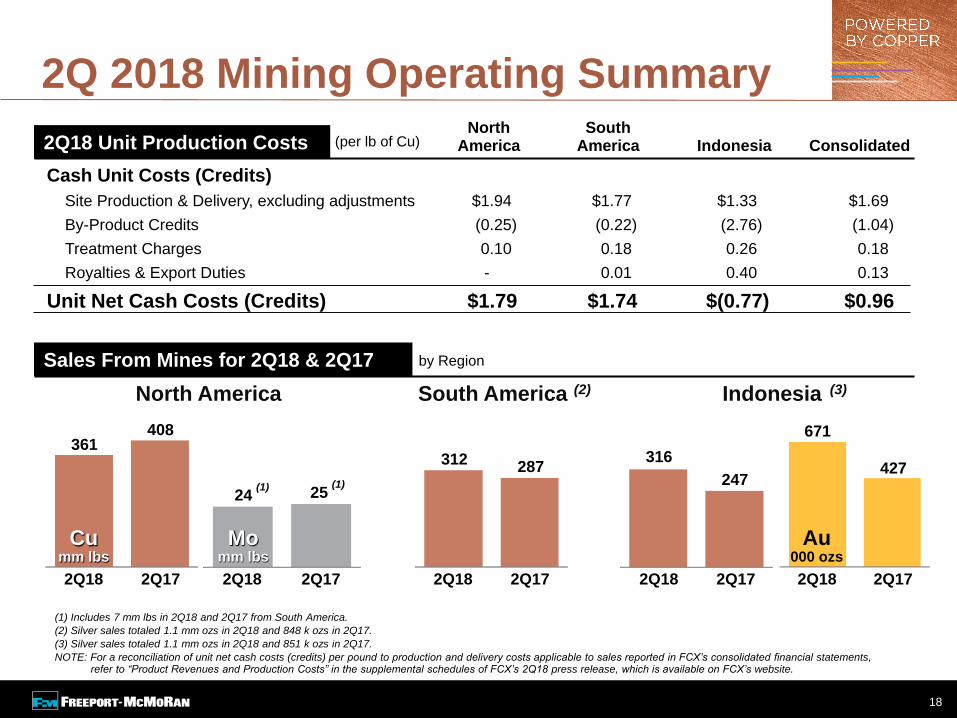
2Q 2018 Mining Operating Summary
(1) Includes 7 mm lbs in 2Q18 and 2Q17 from South America.
(2) Silver sales totaled 1.1 mm ozs in 2Q18 and 848 k ozs in 2Q17.
(3) Silver sales totaled 1.1 mm ozs in 2Q18 and 851 k ozs in 2Q17.
NOTE: For a reconciliation of unit net cash costs (credits) per pound to production and delivery costs applicable to sales reported in FCX’s consolidated financial statements, refer to “Product Revenues and Production Costs” in the supplemental schedules of FCX’s 2Q18 press release, which is available on FCX’s website.
Cash Unit Costs (Credits)
Site Production & Delivery, excluding adjustments $1.94 $1.77 $1.33 $1.69
By-Product Credits (0.25) (0.22) (2.76) (1.04)
Treatment Charges 0.10 0.18 0.26 0.18
Royalties & Export Duties - 0.01 0.40 0.13
Unit Net Cash Costs (Credits) $1.79 $1.74 $(0.77) $0.96
North America
2524(1)(1)
Momm lbs
2Q18 2Q17
408361
2Q18 2Q17
Cumm lbs
Indonesia (3)
247
316
2Q18 2Q17
427
671
2Q18 2Q17
South America (2)
2Q18 2Q17
312287
2Q18 Unit Production Costs
Sales From Mines for 2Q18 & 2Q17
North SouthAmerica America Indonesia Consolidated(per lb of Cu)
by Region
Au000 ozs
18
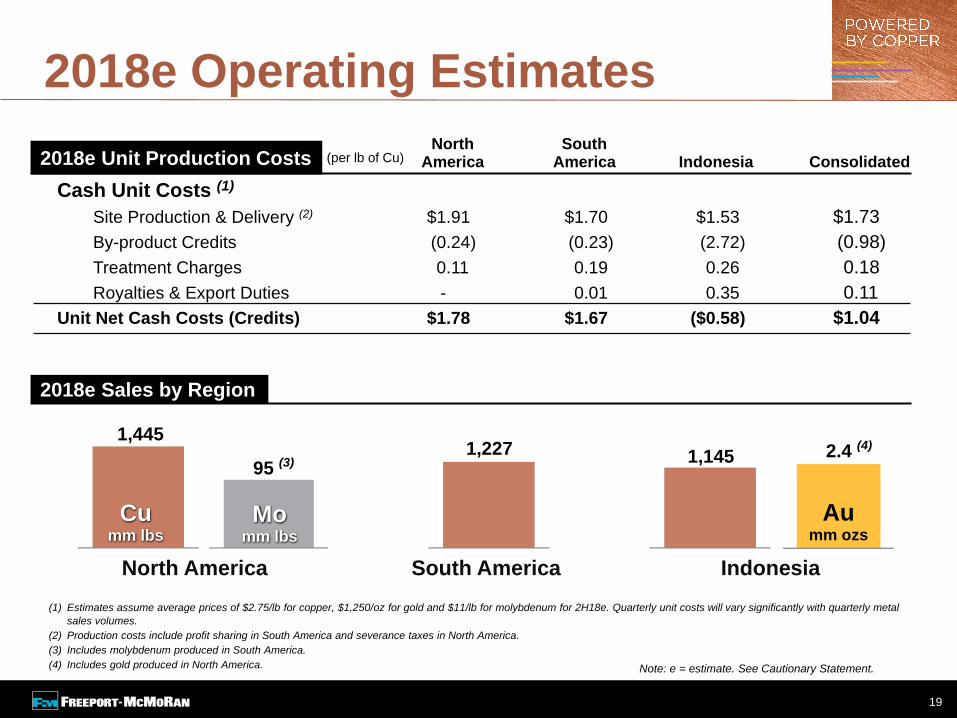
1,227
South America
2018e Operating Estimates
(1) Estimates assume average prices of $2.75/lb for copper, $1,250/oz for gold and $11/lb for molybdenum for 2H18e. Quarterly unit costs will vary significantly with quarterly metal
sales volumes.
(2) Production costs include profit sharing in South America and severance taxes in North America.
(3) Includes molybdenum produced in South America.
(4) Includes gold produced in North America.
95 (3)
Momm lbs
1,445
Cumm lbs
North America
(per lb of Cu)North South
America America Indonesia Consolidated
Cash Unit Costs (1)
Site Production & Delivery (2) $1.91 $1.70 $1.53 $1.73
By-product Credits (0.24) (0.23) (2.72) (0.98)
Treatment Charges 0.11 0.19 0.26 0.18
Royalties & Export Duties - 0.01 0.35 0.11
Unit Net Cash Costs (Credits) $1.78 $1.67 ($0.58) $1.04
2018e Unit Production Costs
Note: e = estimate. See Cautionary Statement.
2018e Sales by Region
1,145
Indonesia
2.4 (4)
Aumm ozs
19
0
300
600
900
1,200
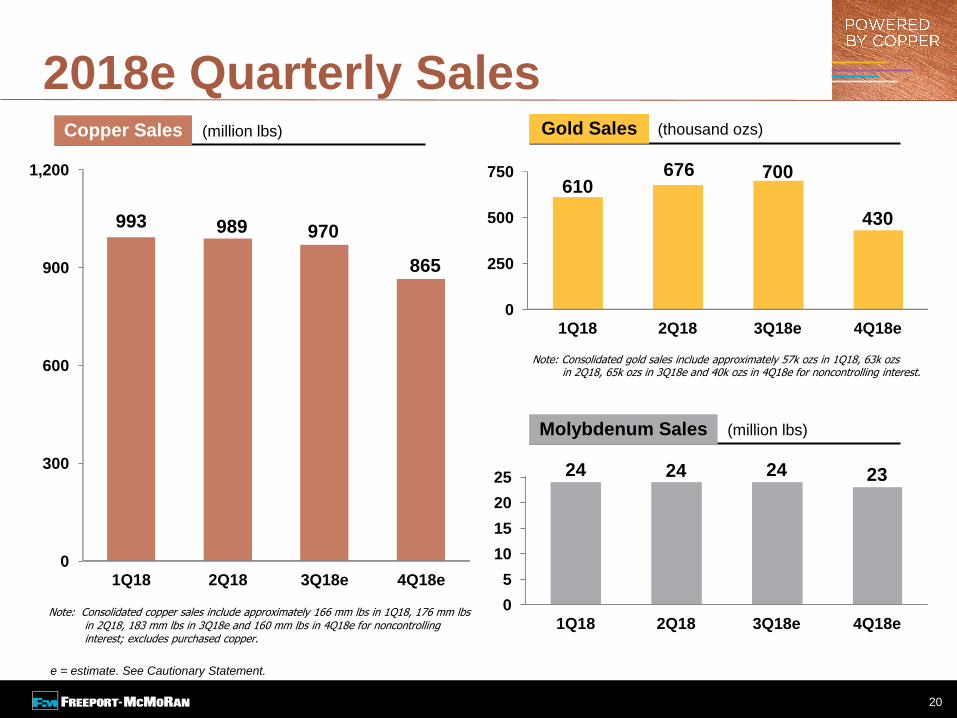
1Q18 2Q18 3Q18e 4Q18e
993 989 970
865
2018e Quarterly Sales
Note: Consolidated gold sales include approximately 57k ozs in 1Q18, 63k ozsin 2Q18, 65k ozs in 3Q18e and 40k ozs in 4Q18e for noncontrolling interest.
e = estimate. See Cautionary Statement.
Note: Consolidated copper sales include approximately 166 mm lbs in 1Q18, 176 mm lbsin 2Q18, 183 mm lbs in 3Q18e and 160 mm lbs in 4Q18e for noncontrolling interest; excludes purchased copper.
(thousand ozs)(million lbs)
(million lbs)
Gold SalesCopper Sales
Molybdenum Sales
0
5
10
15
20
25
1Q18 2Q18 3Q18e 4Q18e
24 24 24 23
0
250
500
750
1Q18 2Q18 3Q18e 4Q18e
610676 700
430
20

POWERED BY COPPER
Heads of Agreement – 7/12/18
21
Inalum (an Indonesian SOE) and Provincial/Local Government to Acquire:
• Rio Tinto JV Interests for $3.5 Billion Cash
• PT Indocopper Investama (PT-II) Shares Owned by FCX for $350 Million Cash
Inalum to Contribute JV Interests to PT-FI in Exchange for 40% of PT-FI
• Subject to Agreement Between Shareholders to Replicate Rio Tinto JV Economics Through 2022
In Favor of FCX, Rio Tinto Will Forego Cash from JV from January 2018 Through Closing
Government of Indonesia to Grant Extension of PT-FI’s Operations through 2041 with Legal
and Fiscal Certainty
PT-FI (with FCX and Inalum as Shareholders) to Construct Smelter Within 5 Years of Extension
FCX to Provide Continuity in Management of PT-FI’s Operations
Subject to Negotiation and Documentation of Definitive Agreements & FCX Board Approval
• Closing Expected 2H18
3-Way “Win/Win/Win” TransactionSee Cautionary Statement.

PT-FI Mine Plan PT-FI’s Share of Metal Sales, 2017-2022e
Copper, billion lbs Gold, million ozs
Total: 5.3 billion lbs copper
Annual Average: 1.06 billion lbs
Note: Timing of annual sales will depend upon mine sequencing, shipping schedules and other factors. Assumes resolution of PT-FI’s long term mining rights or extension of
PT-FI’s temporary IUPK after 7/31/18. e = estimate. Amounts are projections; see Cautionary Statement.
1.01.15
0.56
0.8
1.4 1.41.54
2.4
0.750.9
1.6
1.9
2017 2018e 2019e 2020e 2021e 2022e
2018e – 2022e
PT-FI Share
Total: 7.6 million ozs gold
Annual Average: 1.5 million ozs
2018e – 2022e
PT-FI Share
Transition Years
22

Plan View
DOZ
DMLZ
Grasberg &Kucing Liar
BigGossan
N
N
DOZ
DMLZ
GrasbergBlock Cave
KucingLiar
Grasbergopen pit
MLA
Common Infrastructure2,500 m elev
GrasbergBC Spur
Kucing Liar Spur
Big Gossan Spur
DMLZ Spur
Portals(at Ridge Camp)
BigGossan
Amole2,900 m elev
N
Grasberg Mining District
1980’s
1990’s
2000’s
Fu
ture
• DMLZ
• Grasberg BC
• Kucing Liar
DOZ block cave mine
IOZ block cave mine
GBT block cave mineDepleted
Depleted
Operating
Future development
DOZ(operating)
DMLZ
IOZ(depleted)
GBT(depleted)
In development
Start-up
Ertsberg East
1980’s
1990’s
2000’s
Fu
ture
• DMLZ
• Grasberg BC
• Kucing Liar
DOZ block cave mine
IOZ block cave mine
GBT block cave mineDepleted
Depleted
Operating
Future development
DOZ(operating)
DMLZ
IOZ(depleted)
GBT(depleted)
In development
Start-up
Ertsberg East
PT-FI History
of Block Caving
23

POWERED BY COPPER
Grasberg Open Pit Extension
0.25%-0.99% CuEq
1.00%-1.99% CuEq
2.00%-2.99% CuEq
>3.00% CuEq
A A’View NorthwestA’
A
N
Grasberg pit life extended 6 months by mining north ramp starting
from bench 3325L & will start after pit bottom is mined (year-end 2018)
Accelerated ore: 5.3 mm t @ 1.24% Cu & 1.88 g/t Au
Aggregate metal impact: 130mm lbs Cu & 250K ozs Au
3325
3295
3265
3235
3205
3175
3145
3115
3085
3055
3025
PB9S5
PB9NE Incremental ore
Plan View
24
See Cautionary Statement.
POWERED BY COPPER
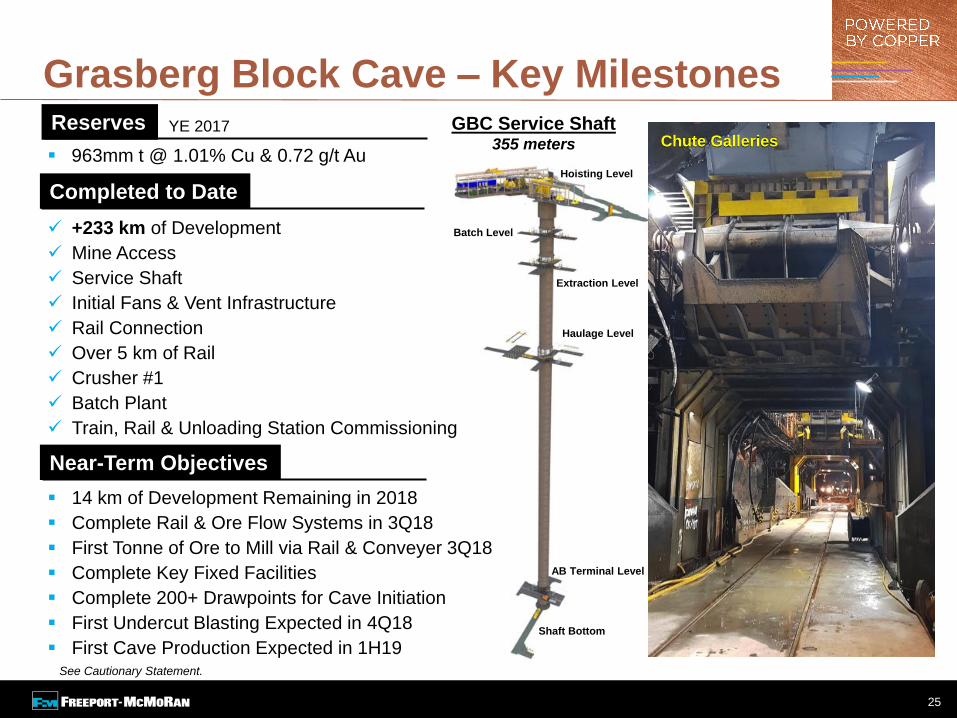
25
14 km of Development Remaining in 2018
Complete Rail & Ore Flow Systems in 3Q18
First Tonne of Ore to Mill via Rail & Conveyer 3Q18
Complete Key Fixed Facilities
Complete 200+ Drawpoints for Cave Initiation
First Undercut Blasting Expected in 4Q18
First Cave Production Expected in 1H19
+233 km of Development
Mine Access
Service Shaft
Initial Fans & Vent Infrastructure
Rail Connection
Over 5 km of Rail
Crusher #1
Batch Plant
Train, Rail & Unloading Station Commissioning
Completed to Date
Near-Term Objectives
Grasberg Block Cave – Key Milestones
See Cautionary Statement.
963mm t @ 1.01% Cu & 0.72 g/t Au
Reserves YE 2017Chute Galleries
GBC Service Shaft355 meters
Batch Level
Extraction Level
Hoisting Level
Haulage Level
AB Terminal Level
Shaft Bottom

26
Deep MLZ (DMLZ) Commissioning
437mm t @ 0.91% Cu & 0.76 g/t Au
PT-FI continues to address mining-induced
seismic activity in DMLZ that began in 2017
and continued during 2018.
During 2Q18, PT-FI initiated plans to conduct
hydraulic fracturing activities to manage
rock stresses & pre-condition DMLZ for large
scale production.
Revised mine plan currently projects block
cave mining activities in DMLZ to commence
in mid-2019.
DMLZ expected to reach full production rates
of 80,000 t/d in 2022.
Plans will continue to be reviewed.
Cave
DOZ Truck Level
DMLZ Undercut
HF
Holes
HF Holes
Cave
500m
DMLZ Undercut
Hydraulic Fracturing (from DOZ Truck Level above DMLZ Cave)
Pre-Conditioning Future Production Area (from DMLZ Undercut Level)
NE
NE
See Cautionary Statement.

Sensitivities
(1) U.S. Dollar Exchange Rates: 630 Chilean peso, 13,900 Indonesian rupiah, $0.76 Australian dollar, $1.18 Euro, 3.25 Peruvian Nuevo Sol base case assumption. Each +10%
equals a 10% strengthening of the U.S. dollar; a strengthening of the U.S. dollar against forecasted expenditures in these foreign currencies equates to a cost benefit of
noted amounts.
NOTE: EBITDA equals operating income plus depreciation, depletion and amortization costs. Operating cash flow amounts exclude working capital changes.
Assumes resolution of PT-FI’s long term mining rights or extension of PT-FI’s temporary IUPK after 7/31/18. e = estimate. See Cautionary Statement
Copper: +/- $0.10/lb $325 $250
Molybdenum: +/- $1.00/lb $80 $75
Gold: +/- $50/ounce $40 $20
Currencies: (1) +/- 10% $175 $125
OperatingCash FlowEBITDA2019e - 2020e Change
(US$ millions)
27
Copper: +/- $0.10/lb $400 $315
Molybdenum: +/- $1.00/lb $80 $75
Gold: +/- $50/ounce $80 $45
Currencies: (1) +/- 10% $175 $125
2021e - 2022e Change

$0
$2
$4
$6
$8
2018 2019 2020 2021 2022 2023 2024 Thereafter
FCX Debt Maturities as of 6/30/18
$0.0 $0.0
(US$ billions)
$1.3
$2.9
5.40% &
5.45%
Sr. Notes
and
FMC
Sr. Notes
$1.0
$2.4$2.7
3.875% &
6.875%
Sr. Notes
3.55%
Sr. Notes4% Sr. Notes3.1% Sr. Notes
$0.8
4.55%
Sr. Notes
CV Non-recourse
CV Non-recourse
Actual
FCX Revolver $ -
Senior Notes 9.9
Cerro Verde Credit Facility 1.2
Total Debt $11.1
Consolidated Cash $ 3.9
at 6/30/18Total Debt & Cash
28
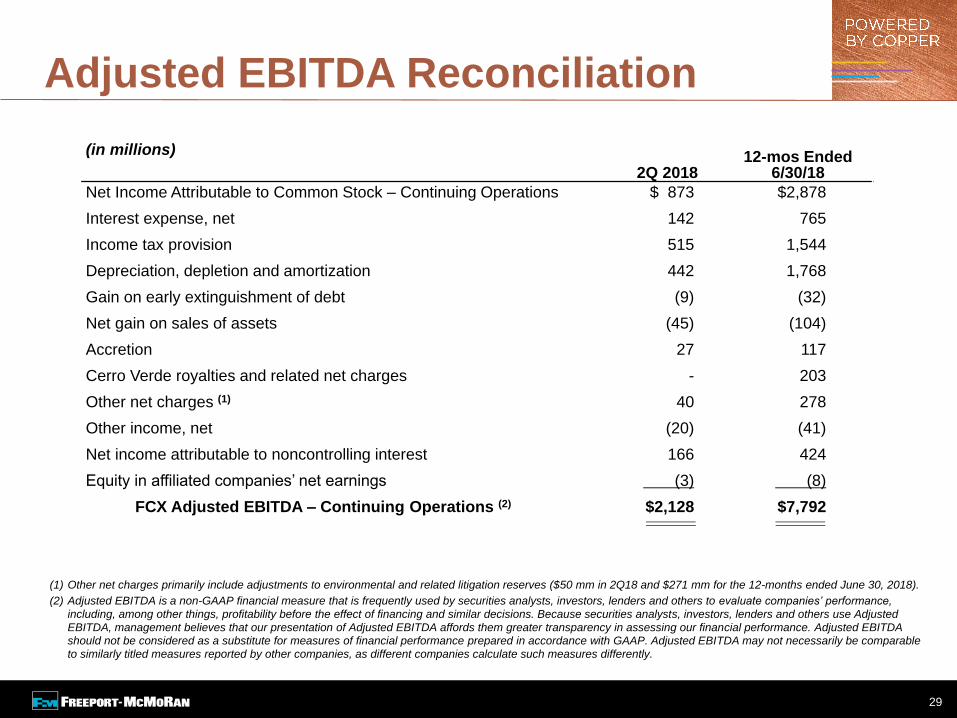
Adjusted EBITDA Reconciliation
(in millions)
2Q 201812-mos Ended
6/30/18
Net Income Attributable to Common Stock – Continuing Operations $ 873 $2,878
Interest expense, net 142 765
Income tax provision 515 1,544
Depreciation, depletion and amortization 442 1,768
Gain on early extinguishment of debt (9) (32)
Net gain on sales of assets (45) (104)
Accretion 27 117
Cerro Verde royalties and related net charges - 203
Other net charges (1) 40 278
Other income, net (20) (41)
Net income attributable to noncontrolling interest 166 424
Equity in affiliated companies’ net earnings (3) (8)
FCX Adjusted EBITDA – Continuing Operations (2) $2,128 $7,792
(1) Other net charges primarily include adjustments to environmental and related litigation reserves ($50 mm in 2Q18 and $271 mm for the 12-months ended June 30, 2018).
(2) Adjusted EBITDA is a non-GAAP financial measure that is frequently used by securities analysts, investors, lenders and others to evaluate companies’ performance,
including, among other things, profitability before the effect of financing and similar decisions. Because securities analysts, investors, lenders and others use Adjusted
EBITDA, management believes that our presentation of Adjusted EBITDA affords them greater transparency in assessing our financial performance. Adjusted EBITDA should not be considered as a substitute for measures of financial performance prepared in accordance with GAAP. Adjusted EBITDA may not necessarily be comparable
to similarly titled measures reported by other companies, as different companies calculate such measures differently.
29
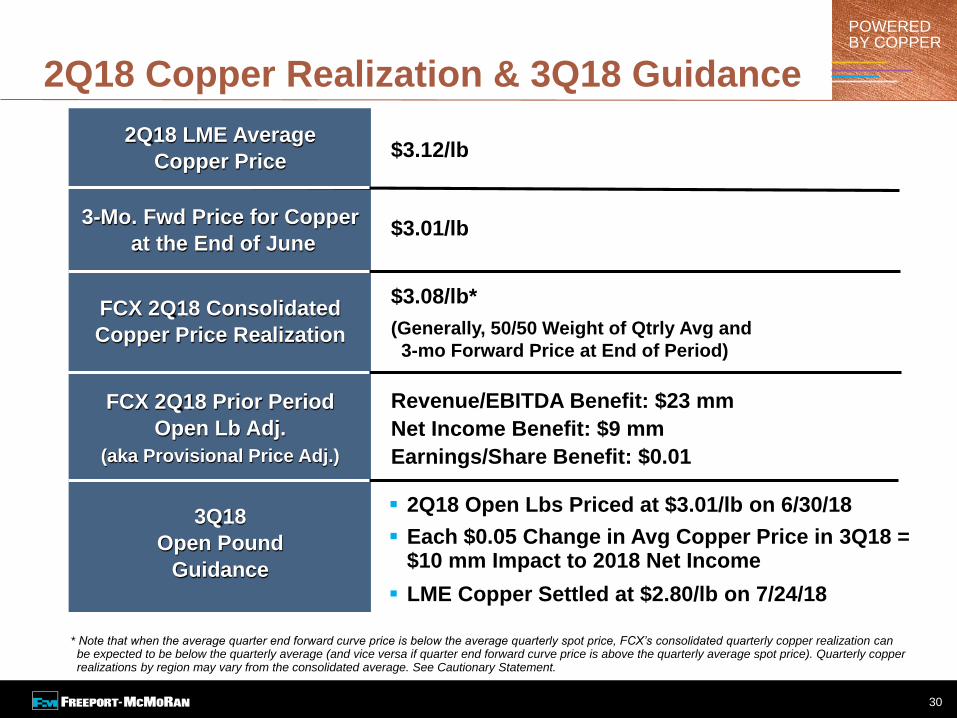
POWERED BY COPPER
$3.12/lb2Q18 LME Average
Copper Price
3-Mo. Fwd Price for Copper
at the End of June
FCX 2Q18 Consolidated
Copper Price Realization
FCX 2Q18 Prior Period
Open Lb Adj.
(aka Provisional Price Adj.)
$3.01/lb
$3.08/lb*
(Generally, 50/50 Weight of Qtrly Avg and
3-mo Forward Price at End of Period)
Revenue/EBITDA Benefit: $23 mm
Net Income Benefit: $9 mm
Earnings/Share Benefit: $0.01
* Note that when the average quarter end forward curve price is below the average quarterly spot price, FCX’s consolidated quarterly copper realization can be expected to be below the quarterly average (and vice versa if quarter end forward curve price is above the quarterly average spot price). Quarterly copper realizations by region may vary from the consolidated average. See Cautionary Statement.
2Q18 Copper Realization & 3Q18 Guidance
2Q18 Open Lbs Priced at $3.01/lb on 6/30/18
Each $0.05 Change in Avg Copper Price in 3Q18 = $10 mm Impact to 2018 Net Income
LME Copper Settled at $2.80/lb on 7/24/18
3Q18
Open Pound
Guidance
30

POWERED BY COPPER
38% 38%1Q18
2Q18
3Q18e
4Q18e
NOTE: For financial statement purposes only; does not reflect cash taxes.
*The consolidated effective income tax rate is a function of the combined effective tax rates for the jurisdictions in which FCX operates. Accordingly, variations in the relative proportions of jurisdictional income result in fluctuations to FCX's consolidated effective income tax rate. Assuming achievement of current sales volume and cost estimates and average prices of $2.75 per pound for copper, $1,250 per ounce for gold and $11.00 per pound for molybdenum for the second half of 2018, FCX estimates its consolidated effective tax rate for the year 2018 will approximate 38 percent. FCX expects that its consolidated effective tax rate for the year 2018 would decrease with higher prices. e = estimate See Cautionary Statement.
2018e Consolidated Effective Tax Rate
31
Quarterly Rate
Projected
Annual Rate*
33% 36%
~46% ~38%
~38% ~38%


