25
2Q 2019 Earnings Call July 17, 2019

2Q 2019 Earnings Call
July 17, 2019

2
Certain statements included in this presentation are forward-looking and thus reflect our current expectations and beliefs with respect to certain current and future
events and anticipated financial and operating performance. Such forward-looking statements are and will be subject to many risks and uncertainties relating to our
operations and business environment that may cause actual results to differ materially from any future results expressed or implied in such forward-looking
statements. Words such as “expects,” “will,” “plans,” “anticipates,” “indicates,” “believes,” “estimates,” “forecast,” “guidance,” “outlook,” “goals”, “targets” and
similar expressions are intended to identify forward-looking statements. Additionally, forward-looking statements include statements that do not relate solely to
historical facts, such as statements which identify uncertainties or trends, discuss the possible future effects of current known trends or uncertainties, or which
indicate that the future effects of known trends or uncertainties cannot be predicted, guaranteed or assured. All forward-looking statements in this presentation are
based upon information available to us on the date of this presentation. We undertake no obligation to publicly update or revise any forward-looking statement,
whether as a result of new information, future events, changed circumstances or otherwise, except as required by applicable law. Our actual results could differ
materially from these forward-looking statements due to numerous factors including, without limitation, the following: our ability to execute our strategic operating
plan, including our growth, revenue-generating and cost-control initiatives; general economic conditions (including interest rates, foreign currency exchange rates,
investment or credit market conditions, crude oil prices, costs of aircraft fuel and energy refining capacity in relevant markets); risks of doing business globally,
including instability and political developments that may impact our operations in certain countries; demand for travel and the impact that global economic and
political conditions have on customer travel patterns; our capacity decisions and the capacity decisions of our competitors; competitive pressures on pricing and
on demand; changes in aircraft fuel prices; disruptions in our supply of aircraft fuel; our ability to cost-effectively hedge against increases in the price of aircraft
fuel, if we decide to do so; the effects of any technology failures or cybersecurity breaches; disruptions to services provided by third-party service providers;
potential reputational or other impact from adverse events involving our aircraft or operations, the aircraft or operations of our regional carriers or our code share
partners or the aircraft or operations of another airline; our ability to attract and retain customers; the effects of any terrorist attacks, international hostilities or
other security events, or the fear of such events; the mandatory grounding of aircraft in our fleet; disruptions to our regional network; the impact of regulatory,
investigative and legal proceedings and legal compliance risks; the success of our investments in other airlines, including in other parts of the world; industry
consolidation or changes in airline alliances; the ability of other air carriers with whom we have alliances or partnerships to provide the services contemplated by
the respective arrangements with such carriers; costs associated with any modification or termination of our aircraft orders; disruptions in the availability of
aircraft, parts or support from our suppliers; our ability to maintain satisfactory labor relations and the results of any collective bargaining agreement process with
our union groups; any disruptions to operations due to any potential actions by our labor groups; labor costs; an outbreak of a disease that affects travel demand
or travel behavior; the impact of any management changes; extended interruptions or disruptions in service at major airports where we operate; U.S. or foreign
governmental legislation, regulation and other actions (including Open Skies agreements, environmental regulations and the United Kingdom's withdrawal from the
European Union); the seasonality of the airline industry; weather conditions; the costs and availability of aviation and other insurance; the costs and availability of
financing; our ability to maintain adequate liquidity; our ability to comply with the terms of our various financing arrangements; our ability to realize the full value of
our intangible assets and long-lived assets; and other risks and uncertainties set forth under Part I, Item 1A., “Risk Factors,” of our Annual Report on Form 10-K for
the fiscal year ended December 31, 2018, as well as other risks and uncertainties set forth from time to time in the reports we file with the U.S. Securities and
Exchange Commission.
Safe Harbor Statement

Opening Remarks
Oscar MunozChief Executive Officer

4
Diluted earnings per share grew 62% year-over year; 31% on an adjusted basis
▪ Reported pre-tax earnings of $1.4B with a pre-tax margin
of 11.9%, up 400bps versus 2Q18
▪ Reported adjusted pre-tax earnings1 of $1.4B with an
adjusted pre-tax margin1 of 12.4%, up 200bps versus
2Q18
▪ Highest second-quarter pre-tax earnings in company
history2
1 Excludes special charges, the mark-to-market impact of financial instruments and imputed interest on certain finance leases. For a GAAP to non-GAAP reconciliation, see
Appendix A.2 Company history defined as post-2010 merger.
$2.48
$4.02
$3.22
$4.21
2Q18 2Q19
31%
Diluted Earnings Per Share
GAAP As adjusted1

5
Raised mid-point of full-year 2019 adjusted EPS guidance, with a new range of $10.50 - $12.00
▪ Second consecutive quarter of pre-tax margin expansion and third consecutive quarter of adjusted pre-tax
margin expansion
▪ Continued to actively manage costs despite less efficient flying and on track to deliver our full-year adjusted
diluted EPS targets for 2019 and 2020
Initial Guidance
2019E
2019E 2020E
$10.00 - $12.00$10.50 - $12.00
$11.00 - $13.00
Adjusted Diluted Earnings Per Share1
1 Excludes special charges and the mark-to-market impact of financial instruments, the nature of which are not determinable at this time, and imputed interest on certain finance
leases. Accordingly, UAL is not providing earnings guidance on a GAAP basis.

Business Update
Scott KirbyPresident
7
Executing on financial targets
▪ Highest second-quarter pre-tax income in the airline’s history1
▪ Strong results despite operational challenges driven by the MAX grounding and suspension of India flights
▪ Network strategy running on all cylinders
▪ Building customer loyalty through investments such as “ConnectionSaver” and improving WiFi
▪ Increased confidence in meeting or beating our 2020 adjusted EPS target
1 Airline history defined as post-2010 merger.

Employee Update
Kate GeboExecutive Vice President, Human Resources and Labor Relations

9
Investing in our team
▪ Event for our 25,000 flight attendants
▪ 34 events, ~800 employees – about 50% complete
▪ Sharing the “why” behind the decisions we make
▪ ~10% higher employee engagement rate among flight
attendants who have attended the event

Commercial Update
Andrew NocellaExecutive Vice President and Chief Commercial Officer

11
Geographic region overview – consolidated 2Q PRASM up 2.5% year-over-year
Domestic
Latin
Pacific
Atlantic
1 Based on full-year 3Q18-2Q19 capacity.
We expect third-quarter 2019 year-over-year consolidated PRASM to be up 0.5% to 2.5%
% ASMs1 2Q19 YOY PRASM H/(L) Notes
57% 1.9% Strong close-in bookings
18% 0.6%Impacted by timing of
Easter holiday
15% 2.8%Volatility in China offset by
strong demand in Japan
10% 9.1%Solid demand across most
of the region

12
Commercial initiatives expected to drive long-term impact
Premium seating▪ Started roll-out of our specialized Boeing 767-300s with high premium seat counts
from EWR and ORD to LHR
Customer engagement ▪ Meaningful growth in new fliers in 2019 driven by corporate sales team and loyalty
promotions
Segmentation▪ Early results of Premium Plus show PRASM gains between 4% and 6% in 2Q
▪ Expect CRJ-550s to be in service later this year, focused in ORD and EWR

Financial Update
Gerry LadermanExecutive Vice President and Chief Financial Officer

14
Second-quarter 2019 diluted earnings per share up 62% year-over-year
1 Includes non-fuel operating expense and non-operating expense.
$M 2Q19 2Q18 H/(L)
Total revenue $11,402 $10,777 5.8%
Fuel expense $2,385 $2,390 (0.2%)
Non-fuel expense1 $7,663 $7,532 1.7%
Pre-tax earnings $1,354 $855 58.4%
Net income $1,052 $683 54.0%
Diluted earnings per share $4.02 $2.48 62.1%
Weighted average shares, diluted 261.6 275.6 (5.1%)
Pre-tax margin 11.9% 7.9% 4.0 pts.

15
Second-quarter 2019 adjusted diluted earnings per share up 31% year-over-year
$M 2Q19 2Q18 H/(L)
Total revenue $11,402 $10,777 5.8%
Fuel expense $2,385 $2,390 (0.2%)
Adjusted non-fuel expense1,2 $7,601 $7,268 4.6%
Adjusted pre-tax earnings2 $1,416 $1,119 26.5%
Adjusted net income2 $1,100 $888 23.9%
Adjusted diluted earnings per share2 $4.21 $3.22 30.7%
Weighted average shares, diluted 261.6 275.6 (5.1%)
Adjusted pre-tax margin2 12.4% 10.4% 2.0 pts.
Note: For a GAAP to non-GAAP reconciliation, see Appendix A.1 Includes non-fuel operating expense and non-operating expense.2 Excludes special charges, the mark-to-market impact of financial instruments and imputed interest on certain finance leases.

16
Total CASM decreased 0.4% in second-quarter 2019
Total CASM YOY H/(L)
1 Excludes special charges. While the company anticipates that it will record special charges throughout the year, at this time the Company is unable to provide an estimate of
these charges with reasonable certainty.
(0.4%)
FY19E12Q19 3Q19E1
~0.0%
~0.3%

17
Non-fuel CASM increased 0.6% in second-quarter 2019
0.6%
2Q19 3Q19E2
1.0% - 2.0%
1 Non-fuel CASM (operating expense per available seat mile) excludes fuel, profit sharing, third-party business expenses and special charges. For a GAAP to non-GAAP
reconciliation, see Appendix A.2 While the company anticipates that it will record special charges throughout the year, at this time the Company is unable to provide an estimate of these charges with
reasonable certainty.
▪ Grounding of Boeing 737 MAX aircraft
▪ Suspension of India flights
2019 Expected Cost Headwinds
Expect full-year 2019 non-fuel CASM1 to be up 0.5% to 1.0%
Non-fuel CASM1
YOY H/(L)
▪ Optimizing maintenance inventory
▪ Asset efficiency
2019 Expected Cost Tailwinds

18
Capital allocation and fleet update
▪ Repurchased $536M worth of shares in the
second quarter of 2019
▪ Board approved new $3B share repurchase
program; $687M remaining under current
repurchase program
▪ Now expect full-year 2019 adjusted capital
expenditures1 to be ~$4.9B
▪ During the quarter, took deliveries of new
aircraft: two Boeing 787-10 and seven E-175
aircraft
▪ Purchased five mainline and 19 regional
aircraft off-lease
Capital Allocation Fleet Update
1 Non-cash capital expenditures are not determinable at this time. Accordingly, the Company is not providing capital expenditure guidance on a GAAP basis.
19
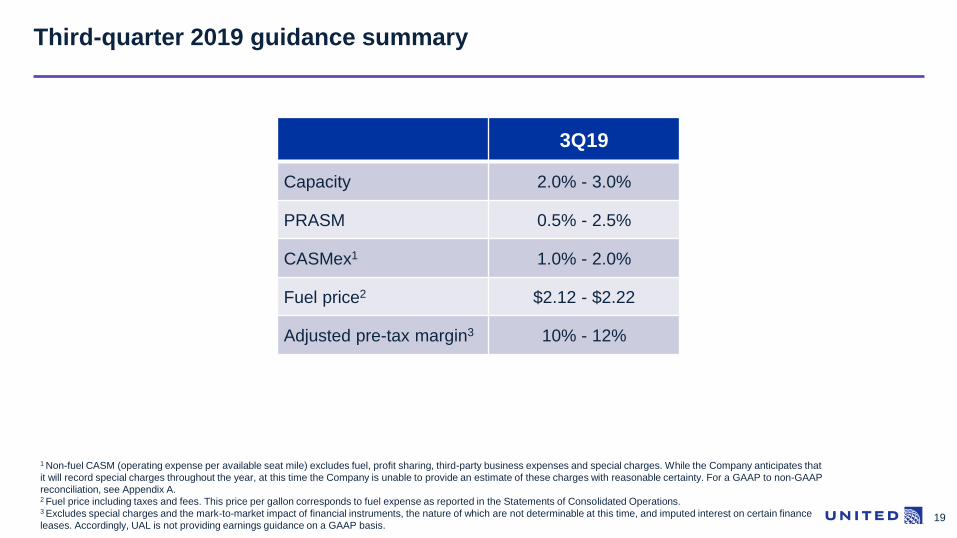
Third-quarter 2019 guidance summary
3Q19
Capacity 2.0% - 3.0%
PRASM 0.5% - 2.5%
CASMex1 1.0% - 2.0%
Fuel price2 $2.12 - $2.22
Adjusted pre-tax margin3 10% - 12%
1 Non-fuel CASM (operating expense per available seat mile) excludes fuel, profit sharing, third-party business expenses and special charges. While the Company anticipates that
it will record special charges throughout the year, at this time the Company is unable to provide an estimate of these charges with reasonable certainty. For a GAAP to non-GAAP
reconciliation, see Appendix A.2 Fuel price including taxes and fees. This price per gallon corresponds to fuel expense as reported in the Statements of Consolidated Operations.3 Excludes special charges and the mark-to-market impact of financial instruments, the nature of which are not determinable at this time, and imputed interest on certain finance
leases. Accordingly, UAL is not providing earnings guidance on a GAAP basis.

20
Full-year 2019 guidance summary
FY19 January
Guidance
FY19 April
GuidanceFY19 Update
Capacity 4.0% - 6.0% 4.0% - 5.0% 3.0% - 4.0%
CASMex1 Flat to better ~Flat 0.5% - 1.0%
Adjusted diluted EPS2 $10.00 - $12.00 $10.00 - $12.00 $10.50 - $12.00
Adjusted capex3 ($B) ~$4.7 ~$4.7 ~$4.9
1 Non-fuel CASM (operating expense per available seat mile) excludes fuel, profit sharing, third-party business expenses and special charges. While the Company anticipates that
it will record special charges throughout the year, at this time the Company is unable to provide an estimate of these charges with reasonable certainty. For a GAAP to non-GAAP
reconciliation, see Appendix A.2 Excludes special charges and the mark-to-market impact of financial instruments, the nature of which are not determinable at this time, and imputed interest on certain finance
leases. Accordingly, UAL is not providing earnings guidance on a GAAP basis.3 Non-cash capital expenditures are not determinable at this time. Accordingly, the Company is not providing capital expenditure guidance on a GAAP basis.

Question & Answer Session


23
Appendix A: reconciliation of GAAP to Non-GAAP financial measures
UAL evaluates its financial performance utilizing various accounting principles generally accepted in the United States of America (GAAP) and Non-GAAP financial measures, including adjusted pre-tax income (loss),
adjusted pre-tax margin, adjusted diluted earnings (loss) per share, adjusted non-fuel expense, adjusted net income (loss) and CASM, excluding special charges, third-party business expenses, fuel, and profit sharing,
among others. UAL believes that adjusting for special charges is useful to investors because special charges are not indicative of UAL’s ongoing performance. UAL believes that adjusting for MTM gains and losses on
financial instruments is useful to investors because those unrealized gains or losses may not ultimately be realized on a cash basis. UAL believes that adjusting for interest expense related to finance leases of Embraer
ERJ 145 aircraft is useful to investors because of the accelerated recognition of interest expense. For additional information related to special charges, see the press release issued by UAL, dated July 16, 2019, and filed
on that date with the U.S. Securities and Exchange Commission as an exhibit to UAL’s Form 8-K. Reconciliations of reported non-GAAP financial measures to the most directly comparable GAAP financial measures are
included below.
(in millions, except pre-tax margin and diluted earnings per share)
Three Months Ended
June 30,
Adjusted Pre-tax Income 2019 2018
Pre-tax income (GAAP) $1,354 $855
Adjusted to exclude:
Special charges 71 129
MTM (gains) losses on financial instruments (34) 135
Interest expense on ERJ 145 finance leases 25 −
Adjusted pre-tax income (Non-GAAP) $1,416 $1,119
Adjusted Pre-tax Margin
Total operating revenue $11,402 $10,777
Pre-tax margin (GAAP) 11.9% 7.9%
Adjusted pre-tax margin (Non-GAAP) 12.4% 10.4%
Adjusted Diluted Earnings Per Share
Diluted earnings per share (GAAP) $4.02 $2.48
Adjusted to exclude:
Special charges 0.27 0.47
MTM (gains) losses on financial instruments (0.13) 0.49
Interest expense on ERJ 145 finance leases 0.10 −
Income tax benefit related to adjustments (0.05) (0.22)
Adjusted diluted earnings per share (Non-GAAP) $4.21 $3.22
Weighted average shares, diluted 261.6 275.6

24
Appendix A: reconciliation of GAAP to Non-GAAP financial measures (continued)
(in millions)
Three Months Ended
June 30,
Adjusted Non-Fuel Expense 2019 2018
Operating expenses (GAAP) $9,930 $9,632
Less: Aircraft fuel (2,385) (2,390)
Add: Total nonoperating expense 118 290
Non-fuel expense 7,663 7,532
Adjusted to exclude:
Special charges 71 129
MTM (gains) losses on financial
instruments (34) 135
Interest expense on ERJ 145 finance
leases 25 −
Adjusted non-fuel expense (Non-GAAP) $7,601 $7,268
Adjusted Net Income
Net Income (GAAP) $1,052 $683
Adjusted to exclude:
Special charges 71 129
MTM (gains) losses on financial
instruments (34) 135
Interest expense on ERJ 145 finance
leases 25 −
Income tax benefit related to adjustments (14) (59)
Adjusted Net Income (Non-GAAP) $1,100 $888

25
Appendix A: reconciliation of GAAP to Non-GAAP financial measures (continued)
CASM is a common metric used in the airline industry to measure an airline’s cost structure and efficiency. UAL reports CASM excluding special charges, third-party business expenses, fuel and profit sharing. UAL
believes that adjusting for special charges is useful to investors because special charges are not indicative of UAL’s ongoing performance. UAL also believes that excluding third-party business expenses, such as
maintenance, ground handling and catering services for third parties and fuel sales, provides more meaningful disclosure because these expenses are not directly related to UAL’s core business. UAL also believes that
excluding fuel costs from certain measures is useful to investors because it provides an additional measure of management’s performance excluding the effects of a significant cost item over which management has
limited influence. UAL excludes profit sharing because this exclusion allows investors to better understand and analyze our recurring cost performance and provides a more meaningful comparison of our core operating
costs to the airline industry.
(¢/ASM, except percentage change)
Three Months Ended
June 30, %
Increase/
(Decrease)
Consolidated CASM excluding special charges, third-party business expenses, fuel and profit
sharing 2019 2018
Cost per available seat mile (CASM) (GAAP) 13.56 13.62 (0.4)
Special charges (a) 0.10 0.18 NM
Third-party business expenses 0.05 0.04 25.0
Fuel expense 3.26 3.38 (3.6)
Profit sharing, including payroll taxes 0.22 0.15 46.7
CASM, excluding special charges, third-party business expenses, fuel, and profit sharing (Non-GAAP) 9.93 9.87 0.6
Consolidated CASM excluding special charges, third-party business expenses, fuel and profit sharing Estimated 3Q 2019 3Q 2018
Consolidated CASM excluding special charges (b) (Non-GAAP) 13.14 - 13.47 13.30
Third-party business expenses 0.05 - 0.06 0.04
Fuel expense (c) 3.22 - 3.39 3.49
Profit sharing 0.17 - 0.22 0.17
Consolidated CASM excluding special charges, third-party business expenses, fuel, and profit sharing (Non-GAAP) 9.70 - 9.80 9.60
Estimated FY 2019 FY 2018
Consolidated CASM excluding special charges and profit sharing (b) (d) (Non-GAAP) 13.41 - 13.68 13.53
Third-party business expenses 0.05 - 0.07 0.04
Fuel expense (c) 3.20 - 3.40 3.38
Consolidated CASM excluding special charges, third-party business expenses, fuel, and profit sharing (Non-GAAP) 10.16 - 10.21 10.11
(a) Special charges include the impact of certain primarily non-cash impairment, severance and other similar accounting charges.
(b) Excludes special charges. While the Company anticipates that it will record such special charges throughout the year in 2019, at this time the Company is unable to provide an estimate of these charges
with reasonable certainty.
(c) Both the cost and availability of fuel are subject to many economic and political factors and are therefore beyond the Company’s control.
(d) At this time the Company is unable to provide an estimate of full-year profit sharing with reasonable certainty.


