ABSTRACT Two dimensional seismic interpretations have been carried out in the Central Indus Basin, Qadirpur area to confirm the reservoir characteristics of the producing Sui Main Limestone and Ranikot Formation and to delineate promising locations for test drilling into the Sui Main Limestone and Ranikot Formation. Interpretive results of time contour map indicate that most of the prospect zones of 5 to 10 milliseconds are in the southwest direction at Sui Main Limestone level and 10 to 20 milliseconds in the north and southwest direction at Ranikot level. Results also revealed that prospect zones tend to become thin in the northeast, while it becomes thick in the southwest. The above findings of this study narrate that subsequent changes in thicknesses may be attributed due to the presence of Mari-Kandkot High in the north of study area. Lithology, water saturation and hydrocarbon saturation indicate two productive zones within Sui Main Limestone. Average value of porosity for each productive zone ranges from 20 to 23%, water saturation from 18 to 20%, and hydrocarbon saturation from 78 to 82%. The total reservoir rock volume is calculated to be 8896 acres. The total volumetric recoverable gas reserves are 6.6 Trillion Cubic Feet (TCF). INTRODUCTION Qadirpur Block (Sind Province) is the concession area operated by OGDCL. The location of the study area that falls within this block in Central Indus Basin is bounded by Sargodha high in the north, Indian Shield in the east, marginal zone of Indian Plate in the west, and Sukkar Rift in the south (Figure 1). The basin is separated from Upper Indus Basin by Sargodha High and Pezu Uplift in the north (Kazmi and Jan, 1997). Area fa lls withi n the latitu de of 27° 55’ to 28° 09’ N and longitude 69° 11’ to 69° 31’ E and it is approximately 820 sq. kilometers. Qadirpur area administratively lies in Ghotki and Jacobabad districts of Sindh Province. Geologically Qadirpur is situated with the Mari Kandkot High and Middle Indus Basin of Pakistan. The intended 3D seismic data acquisition and processing programme of Qadirpur joint venture encompasses an area of 364 sq km. Previously about 420 lines of 2D seismic survey were carried out by OGDCL in the years of 1990, 1992 and 1998. _______________________________________________1 Department of Earth Sciences, Quaid-i-Azam University, Islamabad. In 1990, gas was discovered in Eocene Limestones in Qadirpur area. Until today about 25 wells have been drilled for extensive development of the field. Sui Main Limestone is the main producer of gas in Qadirpur Gas-field area; hence most of the wells were bottomed up to this Formation. On the other hand, Qadirpur-1 and QadirpurX-2 were drilled to Pab/Ranikot (Cretaceous /Paleocene) formations. SEISMIC AND WELL DATA The location of 2D seismic lines of Qadirpur area is shown in base map in figure 2 that has been used in this study. This data was acquired and processed by OGDCL in the years of 1990, 1992 and 1998.Composite suite of logs comprising gamma ray, spontaneous potential (SP), resistivity log (i.e., induction electric log, dual induction focused log, dual laterolog, micro spherically focused log, microlatrolog, Laterolog etc.), porosity logs (i.e., sonic log, density log, neutron log, combination of neutron-density log)) were run in wells (Qadirpur 01 and Qadirpur 05) are also acquired for log interpretation to estimate the reservoir characteristics. PETROLEUM PROSPECT Potential source rocks include shale of Sembar Formation, but shales of Mughalkot, Ranikot and Sirkif formations are also considered for their source potential. Sui Main Limestone and Sui Upper Limestone is the main producer whereas limestone of Habib Rahi is considered as secondary reservoir. The Ghazij Shales act as cap for Sui Main Limestone and Sui Upper Limestone while Sirki Shales over Habib Rahi Limestone act as a cap rock (Kadri, 1995). The generalized stratigraphy of the area is given in figure 3. METHODOLOGY For log interpretation, different types of standard cross plots and mathematical charts have been used. The important reservoir parameters, which were calculated, are; volume of shale, porosity of the formation, resistivity of the formation water, water and hydrocarbon saturation and lithology of the formation. The calculated values are plotted against depth for each particular formation encountered in Qadirpur-01 and Qadirpur-05. Finally, the productive reservoir area is delineated using a depth contour map. For seismic data interpretation, identification of reflection packages has been done using seismic section (Figure 4A, 4B & 4C); depths of formation tops from well 01 and well 05; average thicknesses from the above mentioned wells; Pakistan Journal of Hydrocarbon Research Vol.15, (June 2005), p.25-34, 15 Figs. Structural Interpretation of Seismic Profiles integrated with Reservoir Characteristics of Qadirpur Area Aamir Ali 1 , Zulfiqar Ahmad 1 and Gulraiz Akhtar 1
Transcript
8/7/2019 3. Aamir-PJHR
http://slidepdf.com/reader/full/3-aamir-pjhr 1/10
ABSTRACT
Two dimensional seismic interpretations have been
carried out in the Central Indus Basin, Qadirpur area toconfirm the reservoir characteristics of the producing
Sui Main Limestone and Ranikot Formation and to
delineate promising locations for test drilling into theSui Main Limestone and Ranikot Formation. Interpretive
results of time contour map indicate that most of theprospect zones of 5 to 10 milliseconds are in the
southwest direction at Sui Main Limestone level and 10
to 20 milliseconds in the north and southwest directionat Ranikot level. Results also revealed that prospect
zones tend to become thin in the northeast, while itbecomes thick in the southwest. The above findings of
this study narrate that subsequent changes in
thicknesses may be attributed due to the presence ofMari-Kandkot High in the north of study area. Lithology,
water saturation and hydrocarbon saturation indicatetwo productive zones within Sui Main Limestone.
Average value of porosity for each productive zoneranges from 20 to 23%, water saturation from 18 to 20%,
and hydrocarbon saturation from 78 to 82%. The total
reservoir rock volume is calculated to be 8896 acres.The total volumetric recoverable gas reserves are 6.6
Trillion Cubic Feet (TCF).
INTRODUCTION
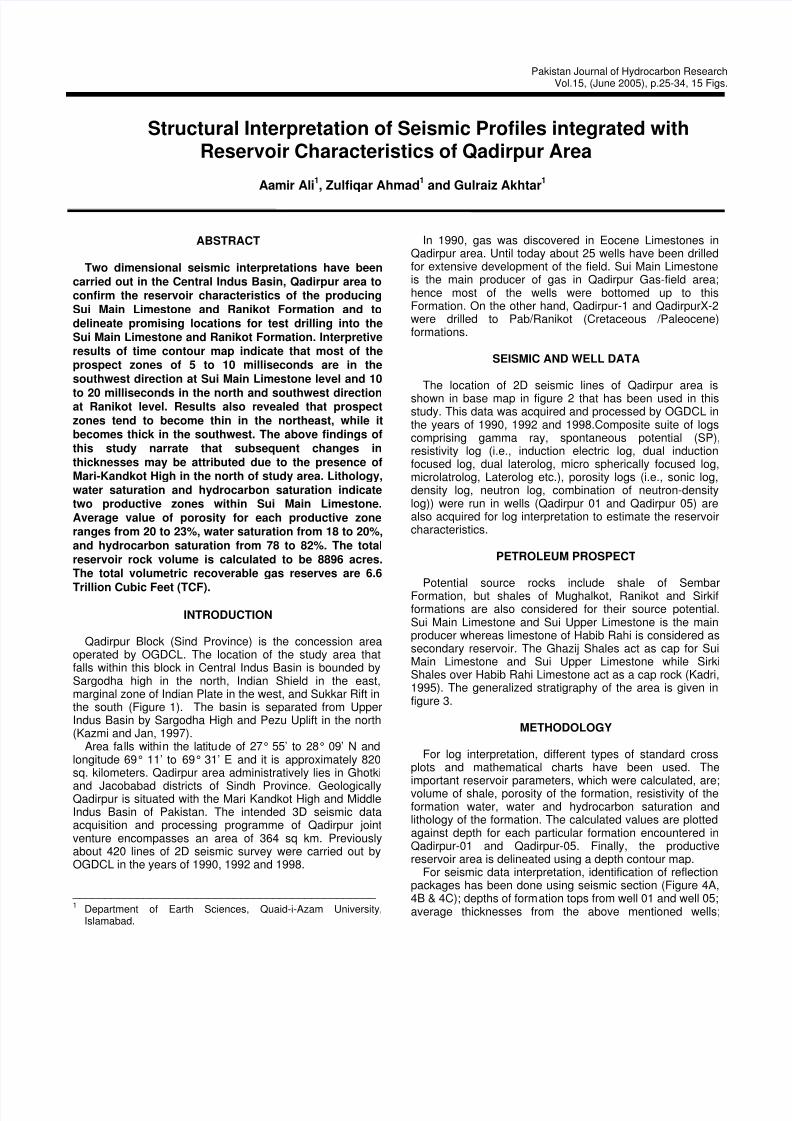
Qadirpur Block (Sind Province) is the concession areaoperated by OGDCL. The location of the study area thatfalls within this block in Central Indus Basin is bounded bySargodha high in the north, Indian Shield in the east,marginal zone of Indian Plate in the west, and Sukkar Rift inthe south (Figure 1). The basin is separated from UpperIndus Basin by Sargodha High and Pezu Uplift in the north(Kazmi and Jan, 1997).
Area falls within the latitude of 27° 55’ to 28° 09’ N andlongitude 69° 11’ to 69° 31’ E and it is approximately 820sq. kilometers. Qadirpur area administratively lies in Ghotki
and Jacobabad districts of Sindh Province. GeologicallyQadirpur is situated with the Mari Kandkot High and MiddleIndus Basin of Pakistan. The intended 3D seismic dataacquisition and processing programme of Qadirpur jointventure encompasses an area of 364 sq km. Previouslyabout 420 lines of 2D seismic survey were carried out byOGDCL in the years of 1990, 1992 and 1998.
_______________________________________________ 1 Department of Earth Sciences, Quaid-i-Azam University,
Islamabad.
In 1990, gas was discovered in Eocene Limestones inQadirpur area. Until today about 25 wells have been drilledfor extensive development of the field. Sui Main Limestoneis the main producer of gas in Qadirpur Gas-field area;hence most of the wells were bottomed up to thisFormation. On the other hand, Qadirpur-1 and QadirpurX-2were drilled to Pab/Ranikot (Cretaceous /Paleocene)formations.
SEISMIC AND WELL DATA
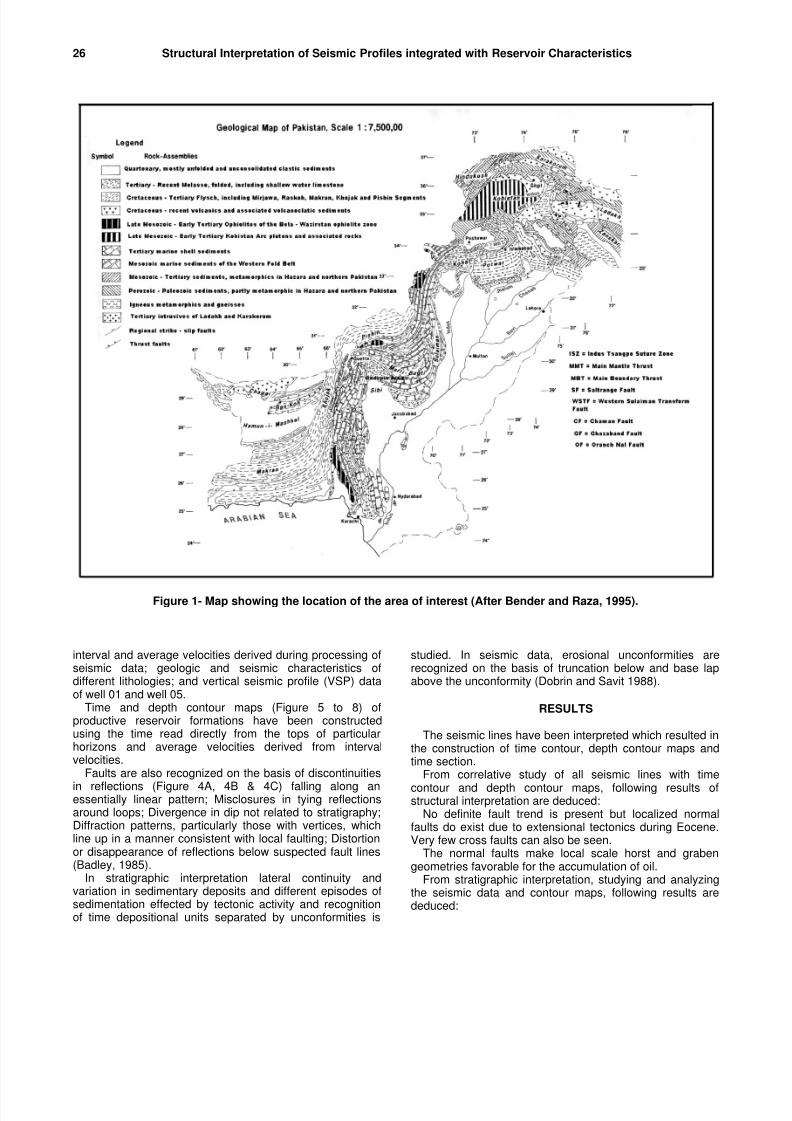
The location of 2D seismic lines of Qadirpur area isshown in base map in figure 2 that has been used in thisstudy. This data was acquired and processed by OGDCL inthe years of 1990, 1992 and 1998.Composite suite of logscomprising gamma ray, spontaneous potential (SP),resistivity log (i.e., induction electric log, dual inductionfocused log, dual laterolog, micro spherically focused log,microlatrolog, Laterolog etc.), porosity logs (i.e., sonic log,density log, neutron log, combination of neutron-densitylog)) were run in wells (Qadirpur 01 and Qadirpur 05) arealso acquired for log interpretation to estimate the reservoircharacteristics.
PETROLEUM PROSPECT
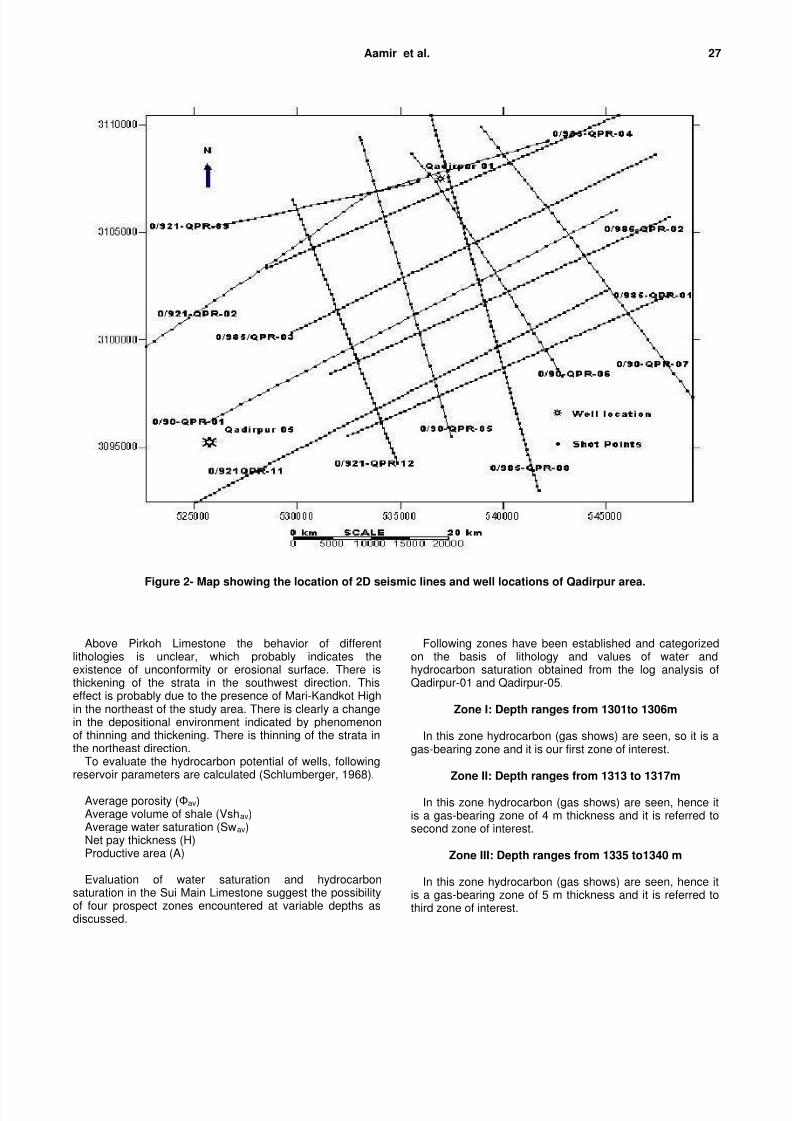
Potential source rocks include shale of SembarFormation, but shales of Mughalkot, Ranikot and Sirkifformations are also considered for their source potential.Sui Main Limestone and Sui Upper Limestone is the mainproducer whereas limestone of Habib Rahi is considered assecondary reservoir. The Ghazij Shales act as cap for SuiMain Limestone and Sui Upper Limestone while SirkiShales over Habib Rahi Limestone act as a cap rock (Kadri,1995). The generalized stratigraphy of the area is given infigure 3.
METHODOLOGY
For log interpretation, different types of standard crossplots and mathematical charts have been used. Theimportant reservoir parameters, which were calculated, are;volume of shale, porosity of the formation, resistivity of theformation water, water and hydrocarbon saturation andlithology of the formation. The calculated values are plottedagainst depth for each particular formation encountered inQadirpur-01 and Qadirpur-05. Finally, the productivereservoir area is delineated using a depth contour map.
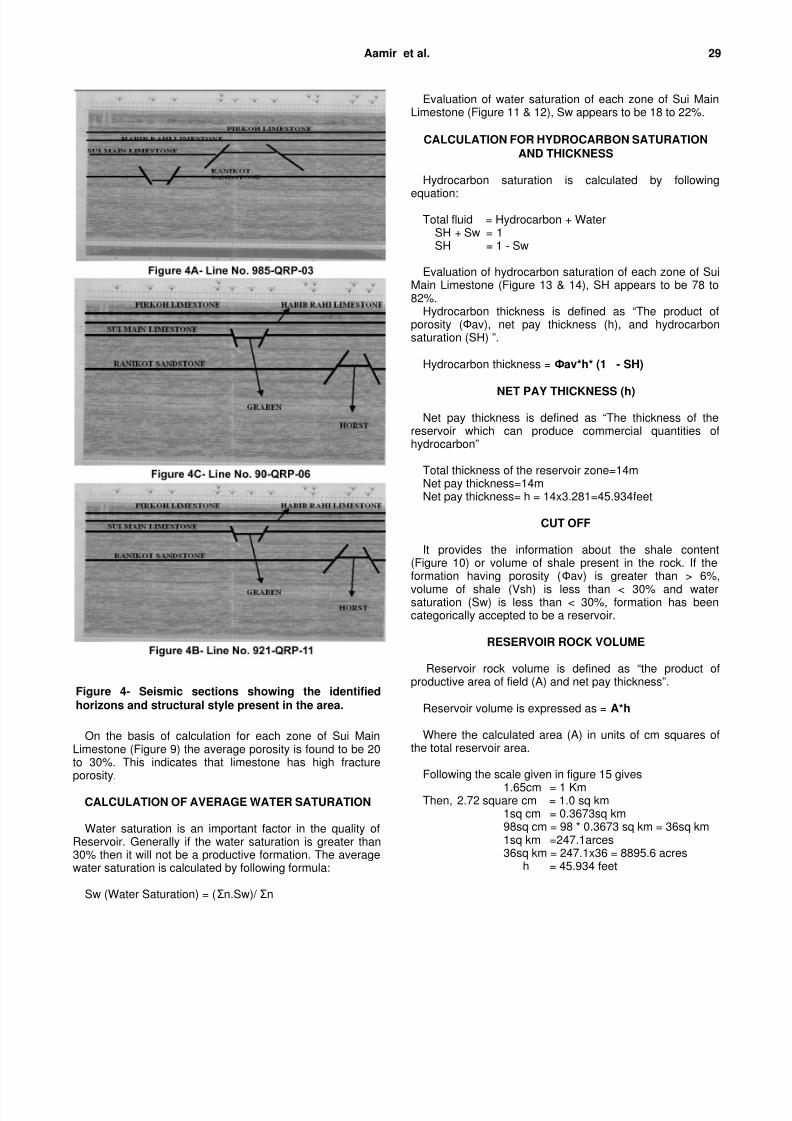
For seismic data interpretation, identification of reflectionpackages has been done using seismic section (Figure 4A,4B & 4C); depths of formation tops from well 01 and well 05;average thicknesses from the above mentioned wells;
Pakistan Journal of Hydrocarbon ResearchVol.15, (June 2005), p.25-34, 15 Figs.
Structural Interpretation of Seismic Profiles integrated withReservoir Characteristics of Qadirpur Area
Aamir Ali1, Zulfiqar Ahmad
1and Gulraiz Akhtar
1
8/7/2019 3. Aamir-PJHR
http://slidepdf.com/reader/full/3-aamir-pjhr 2/10
26 Structural Interpretation of Seismic Profiles integrated with Reservoir Characteristics
interval and average velocities derived during processing ofseismic data; geologic and seismic characteristics ofdifferent lithologies; and vertical seismic profile (VSP) dataof well 01 and well 05.
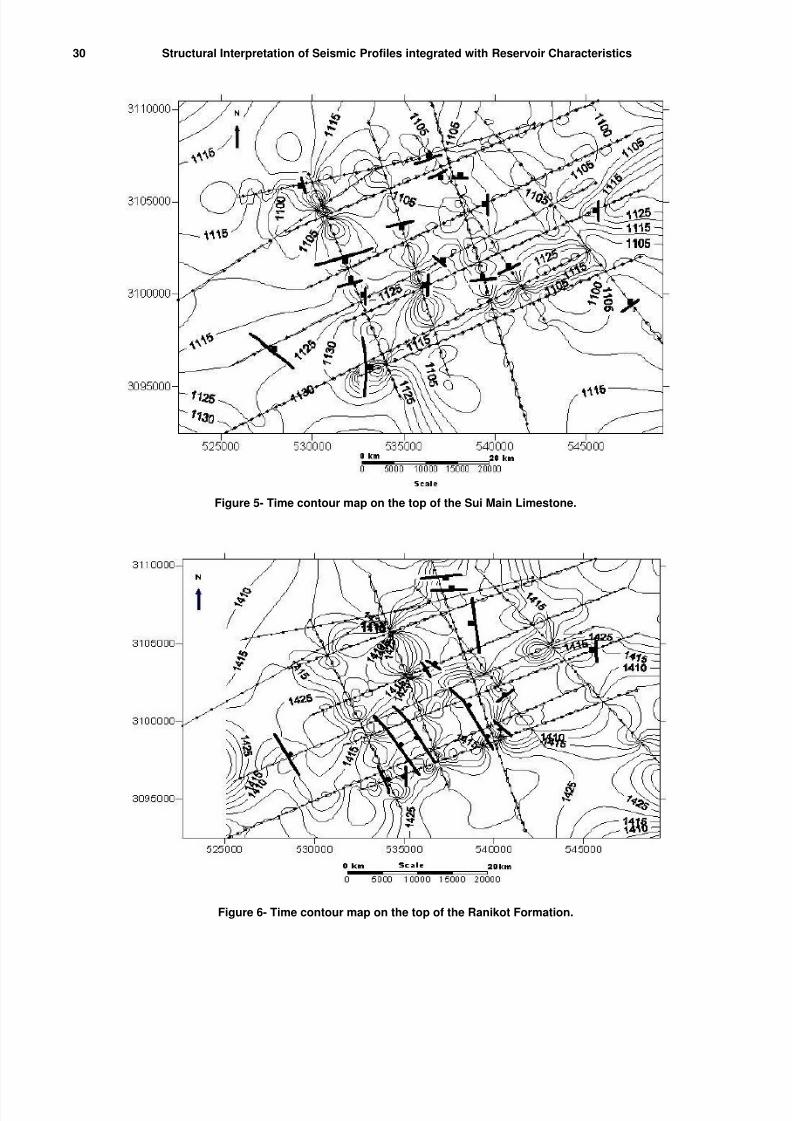
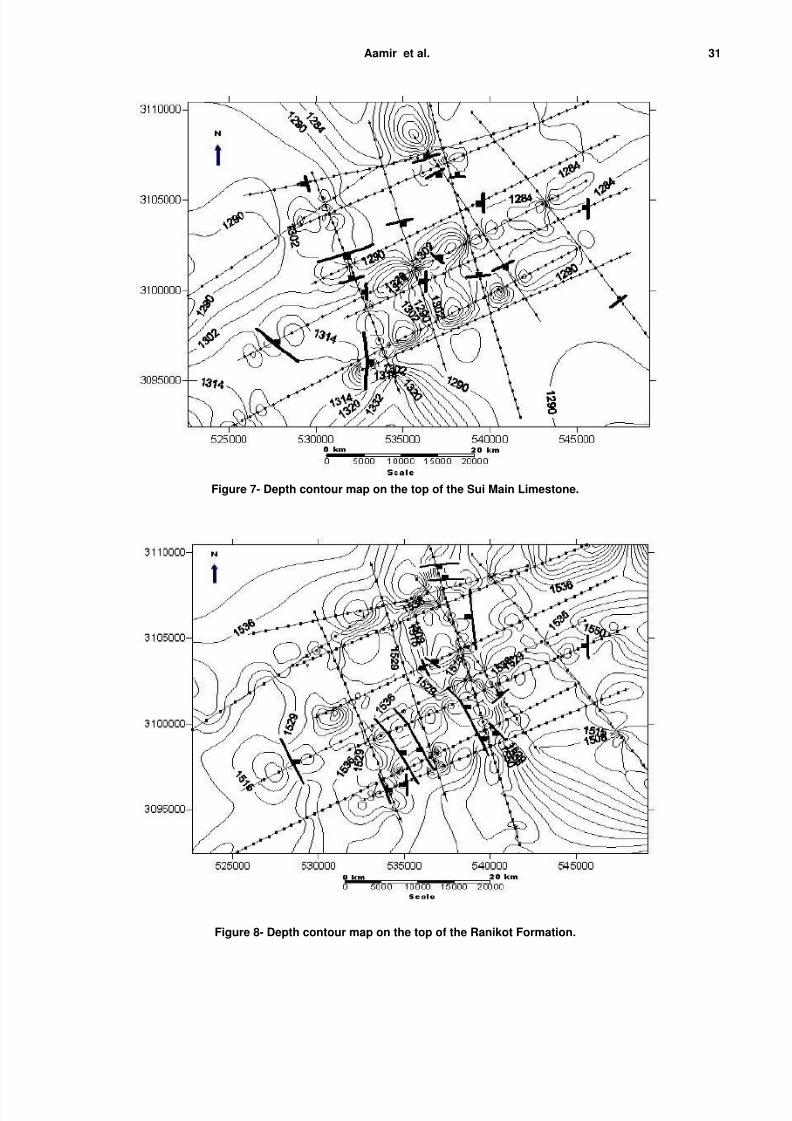
Time and depth contour maps (Figure 5 to 8) ofproductive reservoir formations have been constructedusing the time read directly from the tops of particularhorizons and average velocities derived from intervalvelocities.
Faults are also recognized on the basis of discontinuities
in reflections (Figure 4A, 4B & 4C) falling along anessentially linear pattern; Misclosures in tying reflectionsaround loops; Divergence in dip not related to stratigraphy;Diffraction patterns, particularly those with vertices, whichline up in a manner consistent with local faulting; Distortionor disappearance of reflections below suspected fault lines(Badley, 1985).
In stratigraphic interpretation lateral continuity andvariation in sedimentary deposits and different episodes ofsedimentation effected by tectonic activity and recognitionof time depositional units separated by unconformities is
studied. In seismic data, erosional unconformities arerecognized on the basis of truncation below and base lapabove the unconformity (Dobrin and Savit 1988).
RESULTS
The seismic lines have been interpreted which resulted inthe construction of time contour, depth contour maps andtime section.
From correlative study of all seismic lines with time
contour and depth contour maps, following results ofstructural interpretation are deduced:
No definite fault trend is present but localized normalfaults do exist due to extensional tectonics during Eocene.Very few cross faults can also be seen.
The normal faults make local scale horst and grabengeometries favorable for the accumulation of oil.
From stratigraphic interpretation, studying and analyzingthe seismic data and contour maps, following results arededuced:
Figure 1- Map showing the location of the area of interest (After Bender and Raza, 1995).
8/7/2019 3. Aamir-PJHR
http://slidepdf.com/reader/full/3-aamir-pjhr 3/10
Aamir et al. 27
Above Pirkoh Limestone the behavior of differentlithologies is unclear, which probably indicates theexistence of unconformity or erosional surface. There isthickening of the strata in the southwest direction. Thiseffect is probably due to the presence of Mari-Kandkot Highin the northeast of the study area. There is clearly a changein the depositional environment indicated by phenomenonof thinning and thickening. There is thinning of the strata inthe northeast direction.
To evaluate the hydrocarbon potential of wells, followingreservoir parameters are calculated (Schlumberger, 1968).
Average porosity (Фav)Average volume of shale (Vshav)Average water saturation (Swav)Net pay thickness (H)Productive area (A)
Evaluation of water saturation and hydrocarbonsaturation in the Sui Main Limestone suggest the possibilityof four prospect zones encountered at variable depths asdiscussed.
Following zones have been established and categorizedon the basis of lithology and values of water andhydrocarbon saturation obtained from the log analysis ofQadirpur-01 and Qadirpur-05.
Zone I: Depth ranges from 1301to 1306m
In this zone hydrocarbon (gas shows) are seen, so it is agas-bearing zone and it is our first zone of interest.
Zone II: Depth ranges from 1313 to 1317m
In this zone hydrocarbon (gas shows) are seen, hence itis a gas-bearing zone of 4 m thickness and it is referred tosecond zone of interest.
Zone III: Depth ranges from 1335 to1340 m
In this zone hydrocarbon (gas shows) are seen, hence itis a gas-bearing zone of 5 m thickness and it is referred tothird zone of interest.
Figure 2- Map showing the location of 2D seismic lines and well locations of Qadirpur area.
8/7/2019 3. Aamir-PJHR
http://slidepdf.com/reader/full/3-aamir-pjhr 4/10
28 Structural Interpretation of Seismic Profiles integrated with Reservoir Characteristics
Zone IV: Depth ranges from 1350 to 1359 m
This is also a gas-bearing zone 9 m thick and it isreferred to fourth zone of interest.
In production tests, the zones II and I don’t show goodresults when they are tested for hydrocarbon production;therefore these zones have been ignored for perforation.
Zone III and IV are perforated on the basis of productiontest as they show good results when tested.
CALCULATION OF AVERAGE POROSITY
Porosity plays an important role in production of the well.If the porosity (Ф) is greater than 6%, formation is regardedas productive formation. Porosity of each meter is averagedout to calculate total reservoir pore volume.
Formula for average porosity is
Фav = n1.Ф1+n2.Ф2+n3.Ф3…n1+n2+n3……….
The equation will be: Фav =Σ (n.Ф)/ Σn
Figure 3- Generalized Stratigraphy of Punjab Platform, Central Indus Basin ( After Raza and Ahmad, 1990).
8/7/2019 3. Aamir-PJHR
http://slidepdf.com/reader/full/3-aamir-pjhr 5/10
Aamir et al. 29
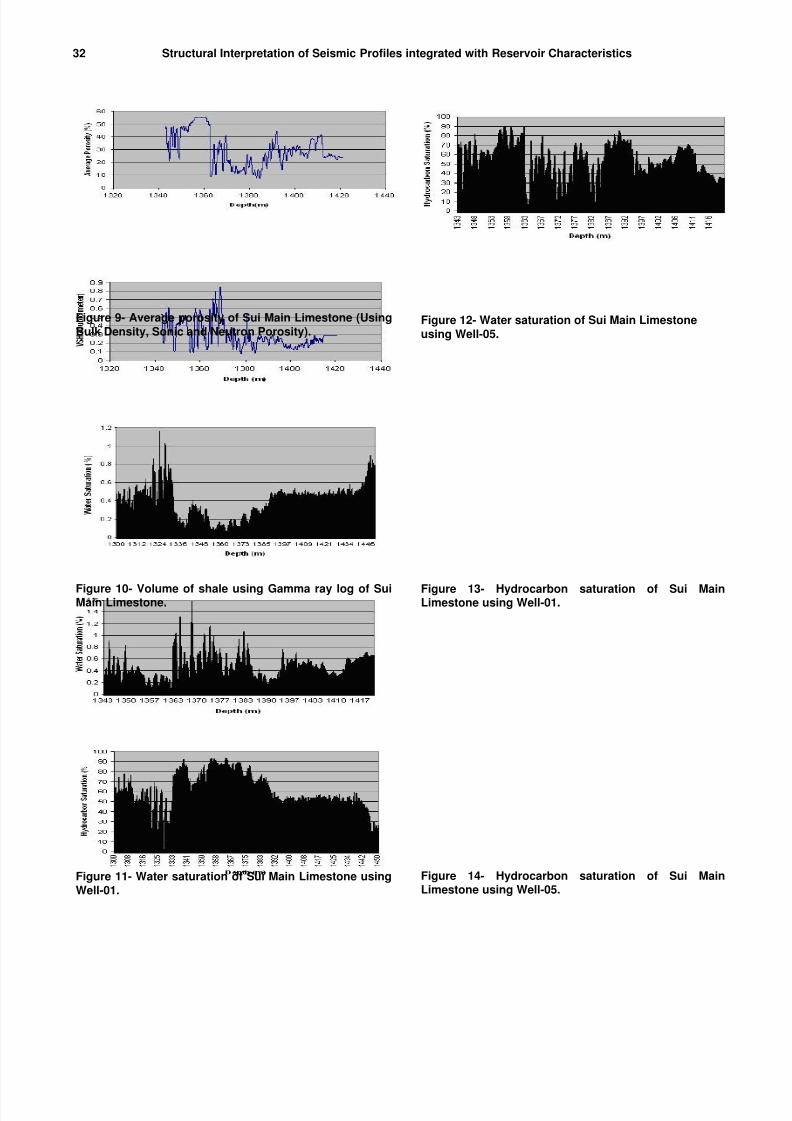
On the basis of calculation for each zone of Sui MainLimestone (Figure 9) the average porosity is found to be 20to 30%. This indicates that limestone has high fractureporosity.
CALCULATION OF AVERAGE WATER SATURATION
Water saturation is an important factor in the quality ofReservoir. Generally if the water saturation is greater than30% then it will not be a productive formation. The averagewater saturation is calculated by following formula:
Sw (Water Saturation) = (Σn.Sw)/ Σn
Evaluation of water saturation of each zone of Sui MainLimestone (Figure 11 & 12), Sw appears to be 18 to 22%.
Evaluation of hydrocarbon saturation of each zone of SuiMain Limestone (Figure 13 & 14), SH appears to be 78 to82%.
Hydrocarbon thickness is defined as “The product ofporosity (Фav), net pay thickness (h), and hydrocarbonsaturation (SH) ”.
Hydrocarbon thickness = Фav*h* (1 - SH)
NET PAY THICKNESS (h)
Net pay thickness is defined as “The thickness of thereservoir which can produce commercial quantities ofhydrocarbon”
Total thickness of the reservoir zone=14mNet pay thickness=14mNet pay thickness= h = 14x3.281=45.934feet
CUT OFF
It provides the information about the shale content(Figure 10) or volume of shale present in the rock. If theformation having porosity (Фav) is greater than > 6%,
volume of shale (Vsh) is less than < 30% and watersaturation (Sw) is less than < 30%, formation has beencategorically accepted to be a reservoir.
RESERVOIR ROCK VOLUME
Reservoir rock volume is defined as “the product ofproductive area of field (A) and net pay thickness”.
Reservoir volume is expressed as = A*h
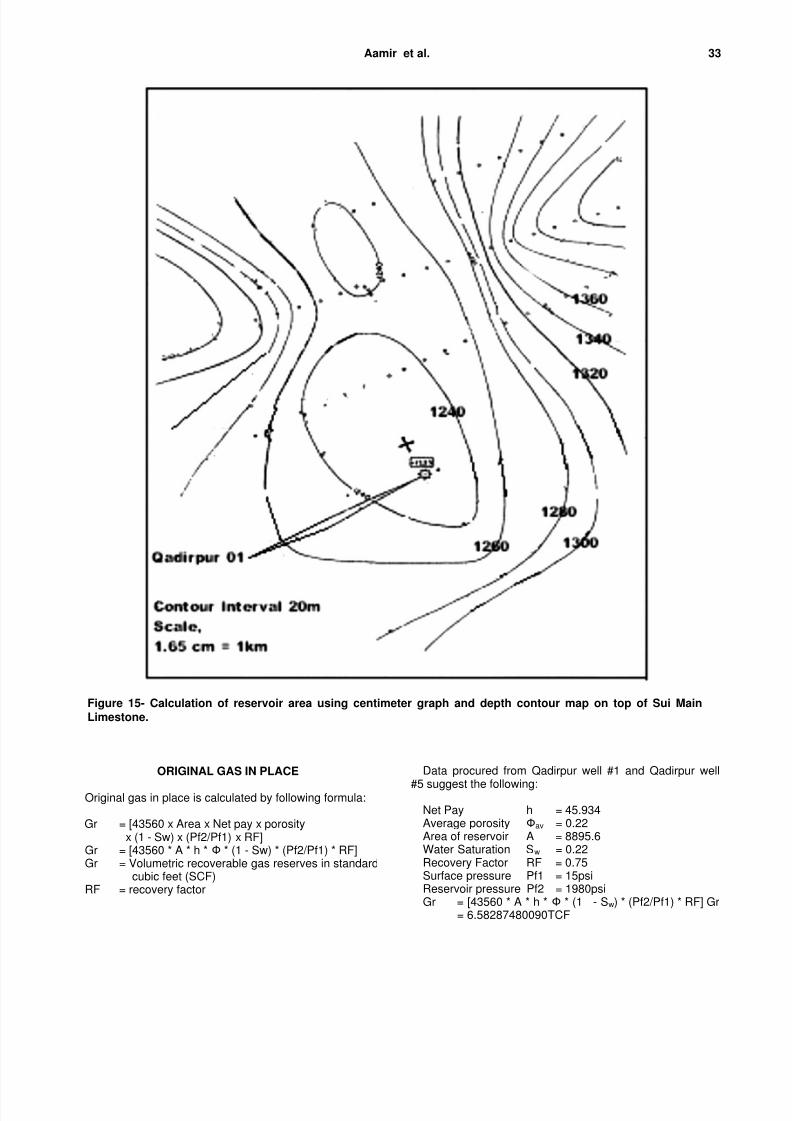
Where the calculated area (A) in units of cm squares ofthe total reservoir area.
Following the scale given in figure 15 gives
1.65cm = 1 KmThen, 2.72 square cm = 1.0 sq km
1sq cm = 0.3673sq km98sq cm = 98 * 0.3673 sq km = 36sq km1sq km =247.1arces36sq km = 247.1x36 = 8895.6 acres
h = 45.934 feet
Figure 4- Seismic sections showing the identifiedhorizons and structural style present in the area.
8/7/2019 3. Aamir-PJHR
http://slidepdf.com/reader/full/3-aamir-pjhr 6/10
30 Structural Interpretation of Seismic Profiles integrated with Reservoir Characteristics
Figure 5- Time contour map on the top of the Sui Main Limestone.
Figure 6- Time contour map on the top of the Ranikot Formation.
8/7/2019 3. Aamir-PJHR
http://slidepdf.com/reader/full/3-aamir-pjhr 7/10
Aamir et al. 31
Figure 7- Depth contour map on the top of the Sui Main Limestone.
Figure 8- Depth contour map on the top of the Ranikot Formation.
8/7/2019 3. Aamir-PJHR
http://slidepdf.com/reader/full/3-aamir-pjhr 8/10
32 Structural Interpretation of Seismic Profiles integrated with Reservoir Characteristics
Figure 9- Average porosity of Sui Main Limestone (Using
Bulk Density, Sonic and Neutron Porosity).
Figure 10- Volume of shale using Gamma ray log of SuiMain Limestone.
Figure 11- Water saturation of Sui Main Limestone using
Well-01.
Figure 12- Water saturation of Sui Main Limestone
using Well-05.
Figure 13- Hydrocarbon saturation of Sui MainLimestone using Well-01.
Figure 14- Hydrocarbon saturation of Sui MainLimestone using Well-05.
8/7/2019 3. Aamir-PJHR
http://slidepdf.com/reader/full/3-aamir-pjhr 9/10
Aamir et al. 33
ORIGINAL GAS IN PLACE
Original gas in place is calculated by following formula:
Gr = [43560 x Area x Net pay x porosityx (1 - Sw) x (Pf2/Pf1) x RF]
Gr = [43560 * A * h * Ф * (1 - Sw) * (Pf2/Pf1) * RF]Gr = Volumetric recoverable gas reserves in standard
cubic feet (SCF)RF = recovery factor
Data procured from Qadirpur well #1 and Qadirpur well
#5 suggest the following:
Net Pay h = 45.934Average porosity Фav = 0.22Area of reservoir A = 8895.6Water Saturation Sw = 0.22Recovery Factor RF = 0.75Surface pressure Pf1 = 15psiReservoir pressure Pf2 = 1980psiGr = [43560 * A * h * Ф * (1 - Sw) * (Pf2/Pf1) * RF] Gr
= 6.58287480090TCF
Figure 15- Calculation of reservoir area using centimeter graph and depth contour map on top of Sui Main
34 Structural Interpretation of Seismic Profiles integrated with Reservoir Characteristics
CONCLUSIONS
Following conclusions are made from this study:
1. All the sedimentary strata are generally dipping towardssouthwest.
2. No definite fault trend can be observed or in other
words, there are localized leads or prospects present atthe level of Sui Main Limestone.3. The closures have values ranging from 5-10
milliseconds, generally in the southwest at the level ofSui Main Limestone.
4. At Ranikot level, there is a gentle trend of faults in thenorthwest to southeast direction. Very few localizedcross faults can also be seen.
5. The closures have values of 20-25 milliseconds towardnorth and 15-20 milliseconds towards the south atRanikot level.
6. The localized normal faults with gentle trend exist dueto extensional tectonic activity in early Paleocene.
7. The prospective zones lie in the southwest of the studyarea at Sui Main Limestone level, and in the north and
southwest at Ranikot level.8. Lithology, water saturation and hydrocarbon saturationindicate two productive zones within reservoir formation(Sui Main Limestone).
9. Average values of porosity for each productive zoneranges from 20 to 23%; average values of watersaturation ranges from 18 to 20%, and average valuesof hydrocarbon saturation ranges from 78 to 82%.
10. The total reservoir rock volume is calculated to be 8896acres.
11. The total volumetric recoverable gas reserves are 6.6Trillion Cubic Feet (TCF).
ACKNOWLEDGEMENTS
Oil & Gas Development Company Ltd. (OGDCL) andDirectorate General of Petroleum Concession areacknowledged for providing the seismic lines, sections andother relevant data. Higher Education Commission (HEC) isalso acknowledged for promoting advancement in research
and establishing a possible future linkage between theindustry and University.Dr. Sajjad Ahmad (Associate Professor), Department of
Geology, University of Peshawar, is acknowledged forcritical review and suggestions for improvement of themanuscript.


![Brochure Final [aamir] 2 foldeducationportal.mp.gov.in/International_Conference.pdf · 2020. 12. 2. · Title: Brochure Final [aamir] 2 fold.cdr Author: Ganesh Graphiecs Created Date:](https://static.documents.pub/doc/80x56/60ac9dc4a8fc4922876f87e3/brochure-final-aamir-2-2020-12-2-title-brochure-final-aamir-2-foldcdr.jpg)


