22
| Date post: | 02-Aug-2015 |
| Category: |
Business |
| Upload: | aidanbocci |
| View: | 57 times |
| Download: | 2 times |
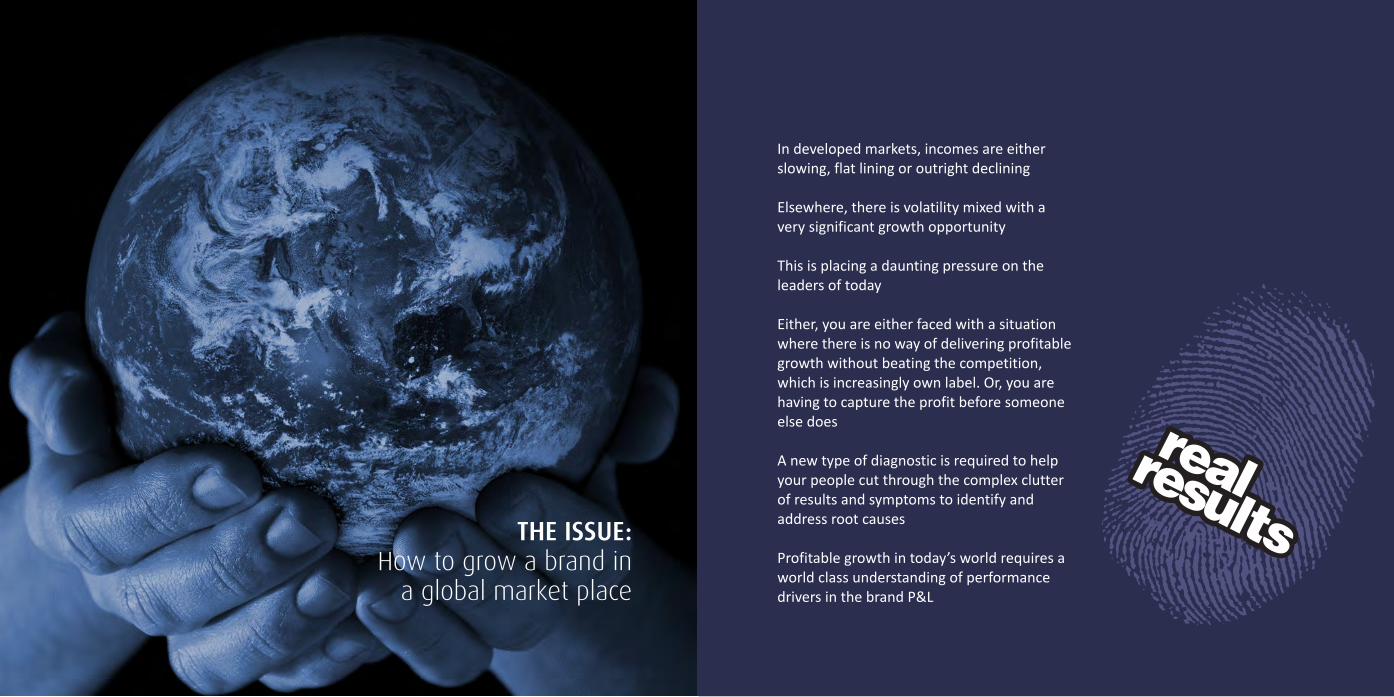
THE ISSUE: How to grow a brand in
a global market place
In developed markets, incomes are either slowing, flat lining or outright declining
Elsewhere, there is volatility mixed with a very significant growth opportunity
This is placing a daunting pressure on the leaders of today
Either, you are either faced with a situation where there is no way of delivering profitable growth without beating the competition, which is increasingly own label. Or, you are having to capture the profit before someone else does
A new type of diagnostic is required to help your people cut through the complex clutter of results and symptoms to identify and address root causes
Profitable growth in today’s world requires a world class understanding of performance drivers in the brand P&L
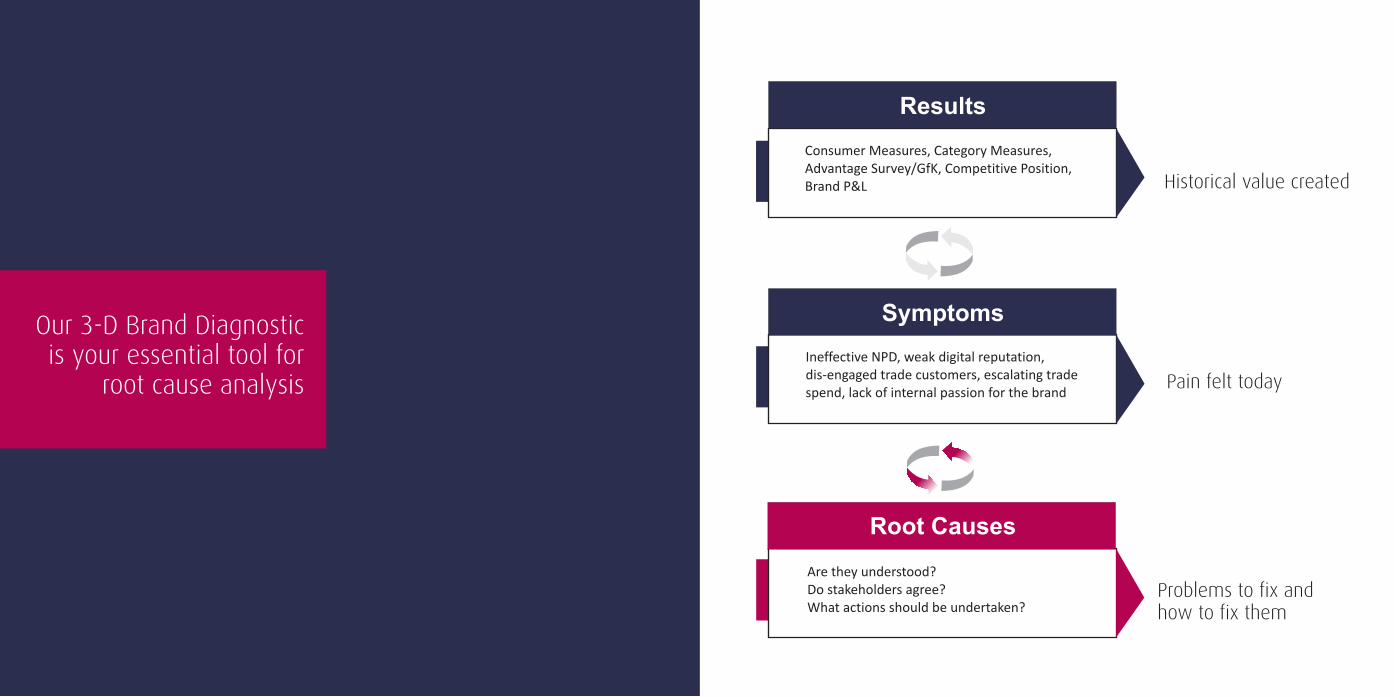
Historical value created
Problems to fix and how to fix them
Consumer Measures, Category Measures, Advantage Survey/GfK, Competitive Position, Brand P&L
Ineffective NPD, weak digital reputation, dis-engaged trade customers, escalating trade spend, lack of internal passion for the brand
Are they understood?Do stakeholders agree?What actions should be undertaken?
Our 3-D Brand Diagnostic is your essential tool for
root cause analysis
Results
Pain felt today
Symptoms
Root Causes
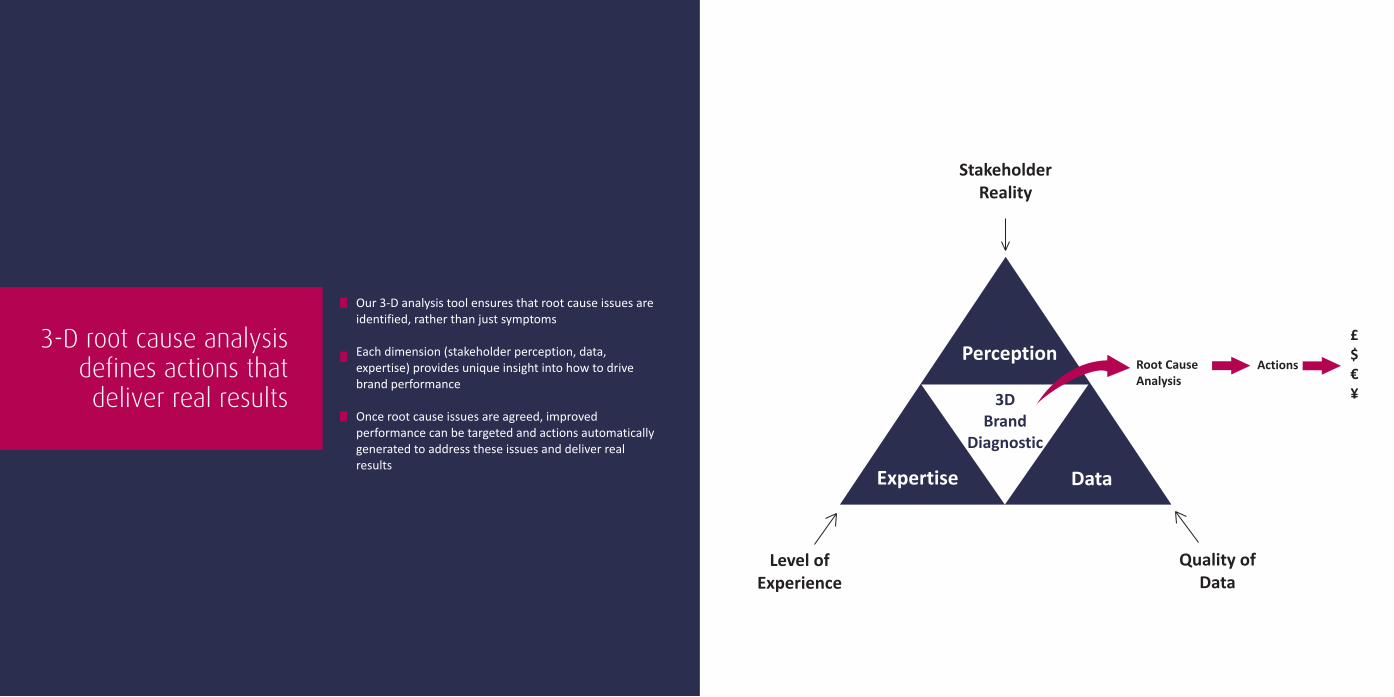
Our 3-D analysis tool ensures that root cause issues are identified, rather than just symptoms
Each dimension (stakeholder perception, data, expertise) provides unique insight into how to drive brand performance
Once root cause issues are agreed, improved performance can be targeted and actions automatically generated to address these issues and deliver real results
3-D root cause analysis defines actions that deliver real results
Root Cause Analysis
Perception
3DBrand
Diagnostic
StakeholderReality
Level ofExperience
Quality of Data
DataExpertise
Actions
£ $€¥
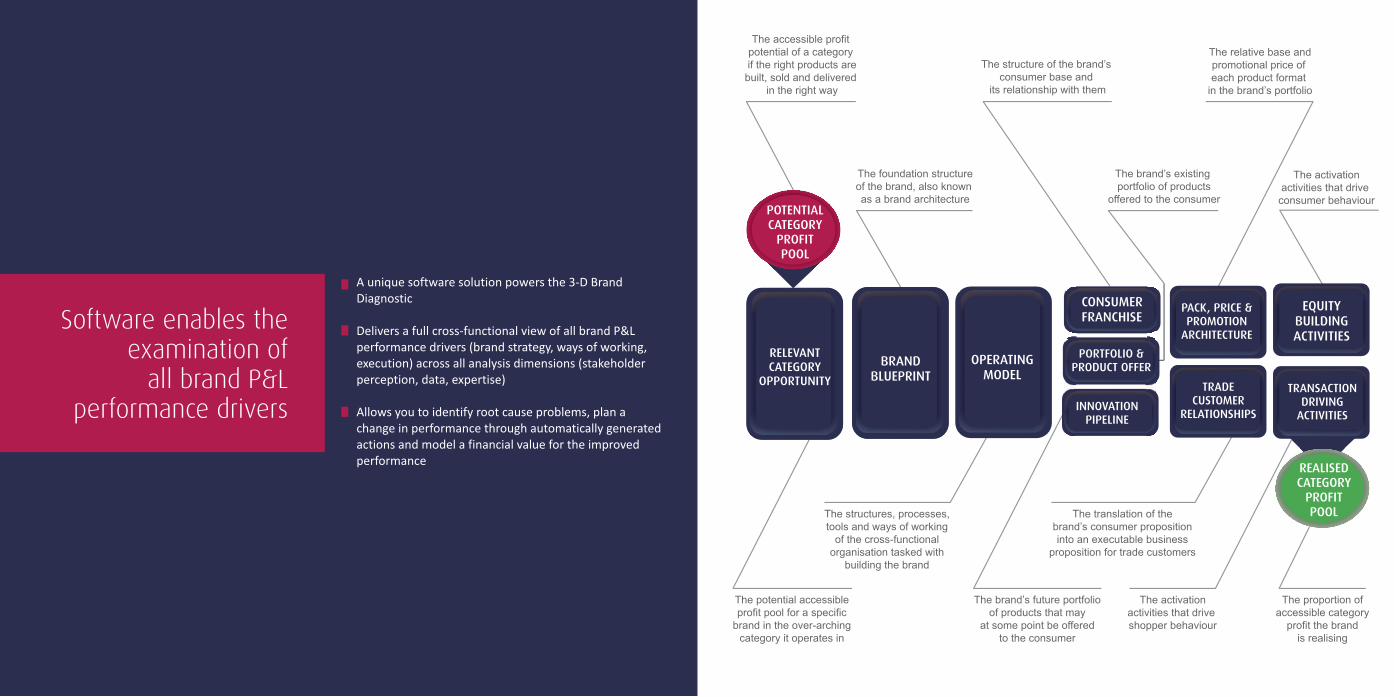
The product architecture directly supports
the client’s business planning process
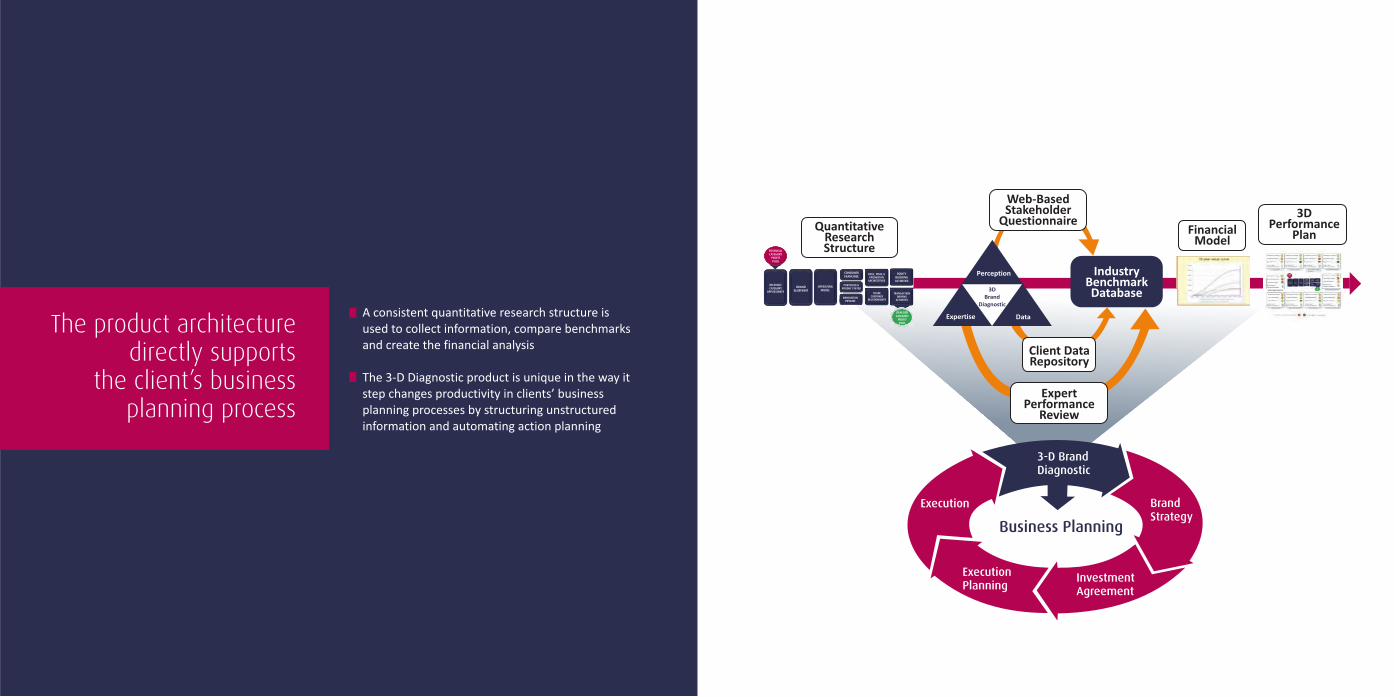
A consistent quantitative research structure is used to collect information, compare benchmarks and create the financial analysis
The 3-D Diagnostic product is unique in the way it step changes productivity in clients’ business planning processes by structuring unstructured information and automating action planning
Financial Model
3DPerformance
PlanQuantitative
ResearchStructure
ExpertPerformance
Review
Client DataRepository
IndustryBenchmarkDatabase
Web-BasedStakeholder
Questionnaire
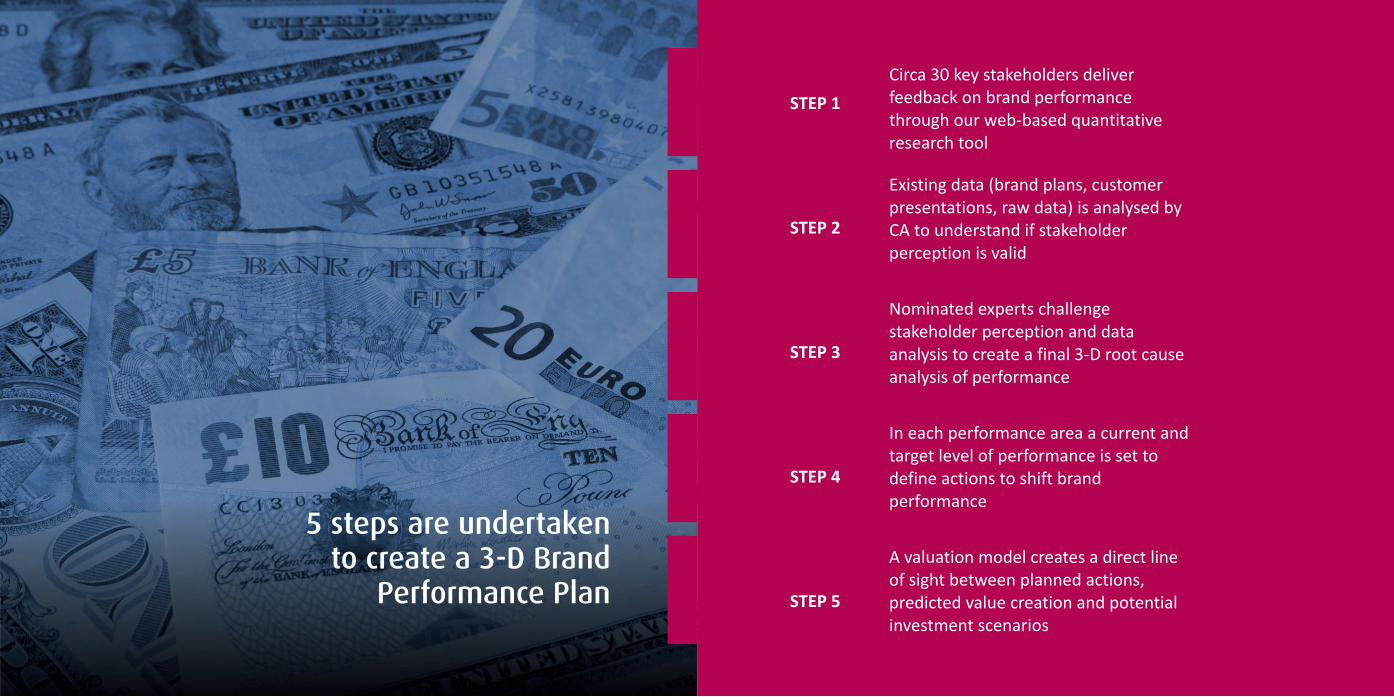
Circa 30 key stakeholders deliver feedback on brand performance through our web-based quantitative research tool
Existing data (brand plans, customer presentations, raw data) is analysed by CA to understand if stakeholder perception is valid
Nominated experts challenge stakeholder perception and data analysis to create a final 3-D root cause analysis of performance
In each performance area a current and target level of performance is set to define actions to shift brand performance
A valuation model creates a direct line of sight between planned actions, predicted value creation and potential investment scenarios
STEP 1
STEP 2
STEP 3
STEP 4
STEP 5
5 steps are undertaken to create a 3-D Brand
Performance Plan
Stakeholder does not see the question
Order of statements is randomised to
increase objectivity
Stakeholder sees statements to agree
or disagree with
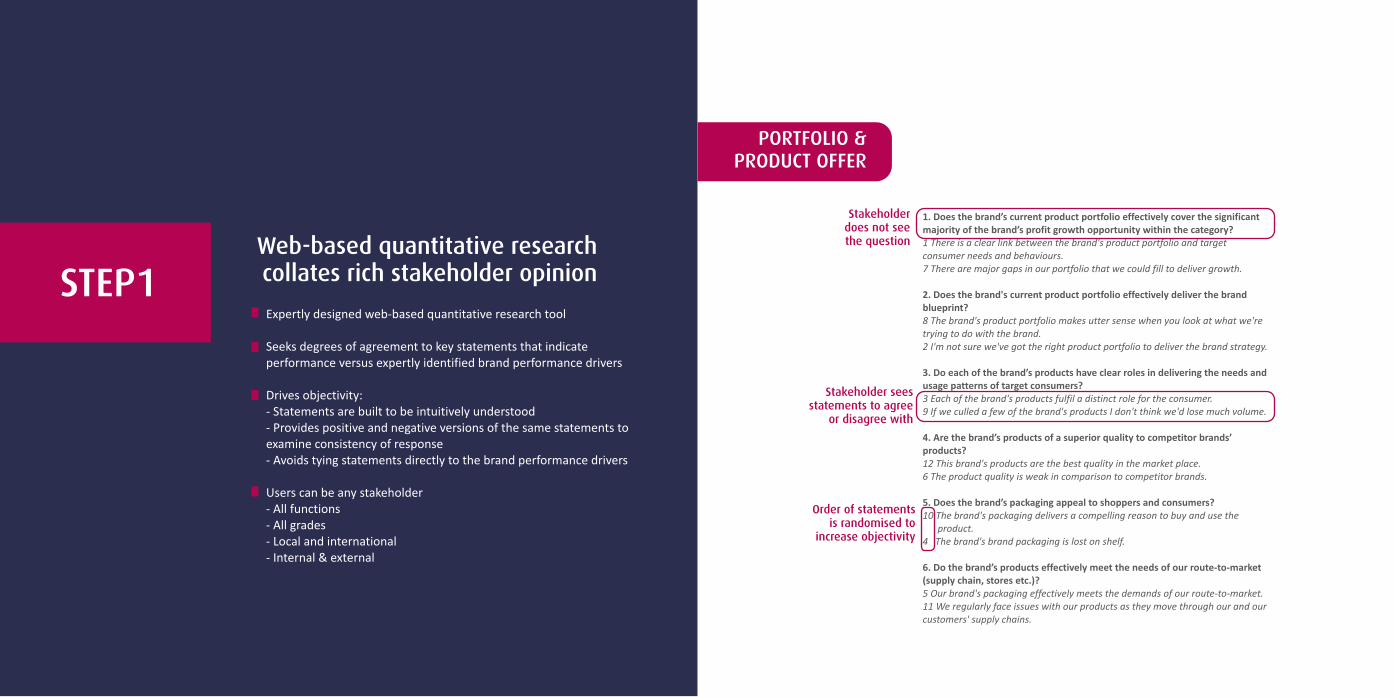
1. Does the brand’s current product portfolio effectively cover the significant majority of the brand’s profit growth opportunity within the category?1 There is a clear link between the brand's product portfolio and target consumer needs and behaviours.7 There are major gaps in our portfolio that we could fill to deliver growth.
2. Does the brand's current product portfolio effectively deliver the brand blueprint?8 The brand's product portfolio makes utter sense when you look at what we're trying to do with the brand.2 I'm not sure we've got the right product portfolio to deliver the brand strategy.
3. Do each of the brand’s products have clear roles in delivering the needs and usage patterns of target consumers?3 Each of the brand's products fulfil a distinct role for the consumer.9 If we culled a few of the brand's products I don't think we'd lose much volume.
4. Are the brand’s products of a superior quality to competitor brands’ products?12 This brand's products are the best quality in the market place.6 The product quality is weak in comparison to competitor brands.
5. Does the brand’s packaging appeal to shoppers and consumers?10 The brand's packaging delivers a compelling reason to buy and use the
product.4 The brand's brand packaging is lost on shelf.
6. Do the brand’s products effectively meet the needs of our route-to-market (supply chain, stores etc.)?5 Our brand's packaging effectively meets the demands of our route-to-market.11 We regularly face issues with our products as they move through our and our customers' supply chains.
Web-based quantitative researchcollates rich stakeholder opinionSTEP1Expertly designed web-based quantitative research tool
Seeks degrees of agreement to key statements that indicate performance versus expertly identified brand performance drivers
Drives objectivity:- Statements are built to be intuitively understood- Provides positive and negative versions of the same statements to examine consistency of response- Avoids tying statements directly to the brand performance drivers
Users can be any stakeholder- All functions- All grades- Local and international- Internal & external
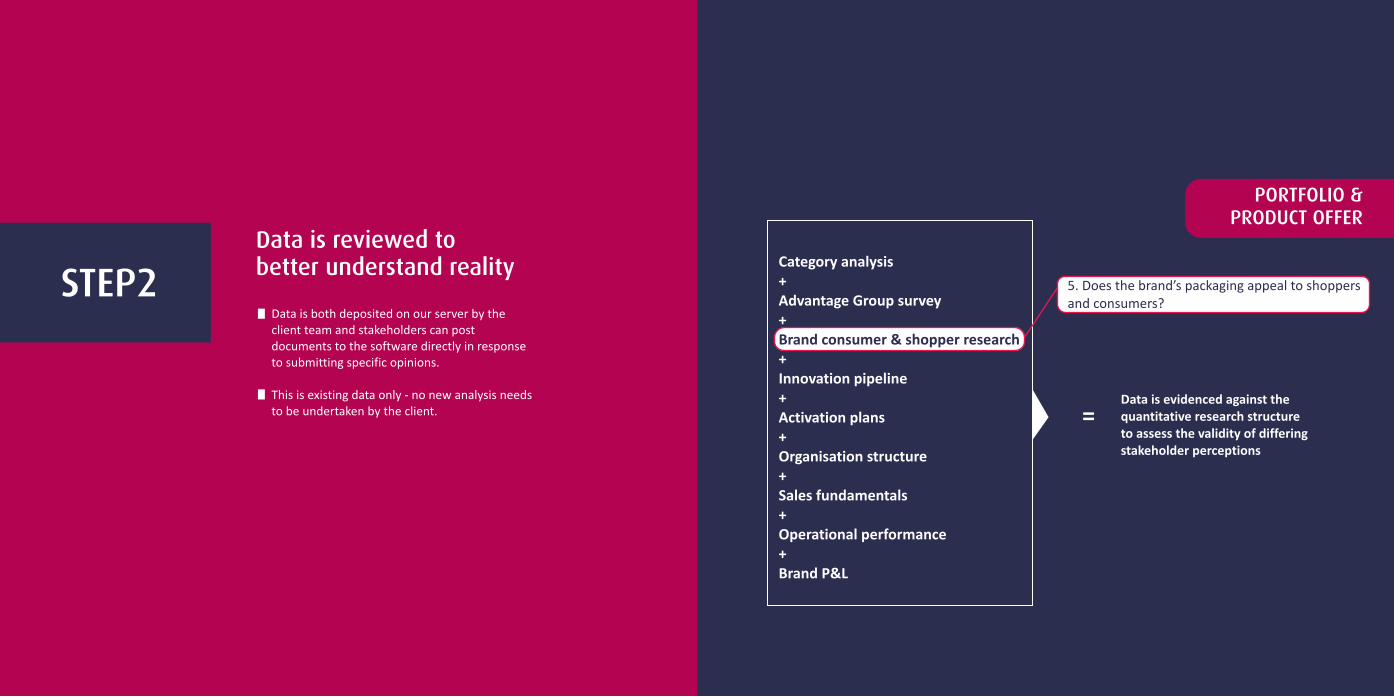
STEP2Data is reviewed to better understand reality
Data is both deposited on our server by the client team and stakeholders can post documents to the software directly in response to submitting specific opinions.
This is existing data only - no new analysis needs to be undertaken by the client. =
Data is evidenced against the quantitative research structure to assess the validity of differing stakeholder perceptions
5. Does the brand’s packaging appeal to shoppers and consumers?
Category analysis+Advantage Group survey+
+Innovation pipeline+Activation plans+Organisation structure+Sales fundamentals+Operational performance+Brand P&L
Brand consumer & shopper research
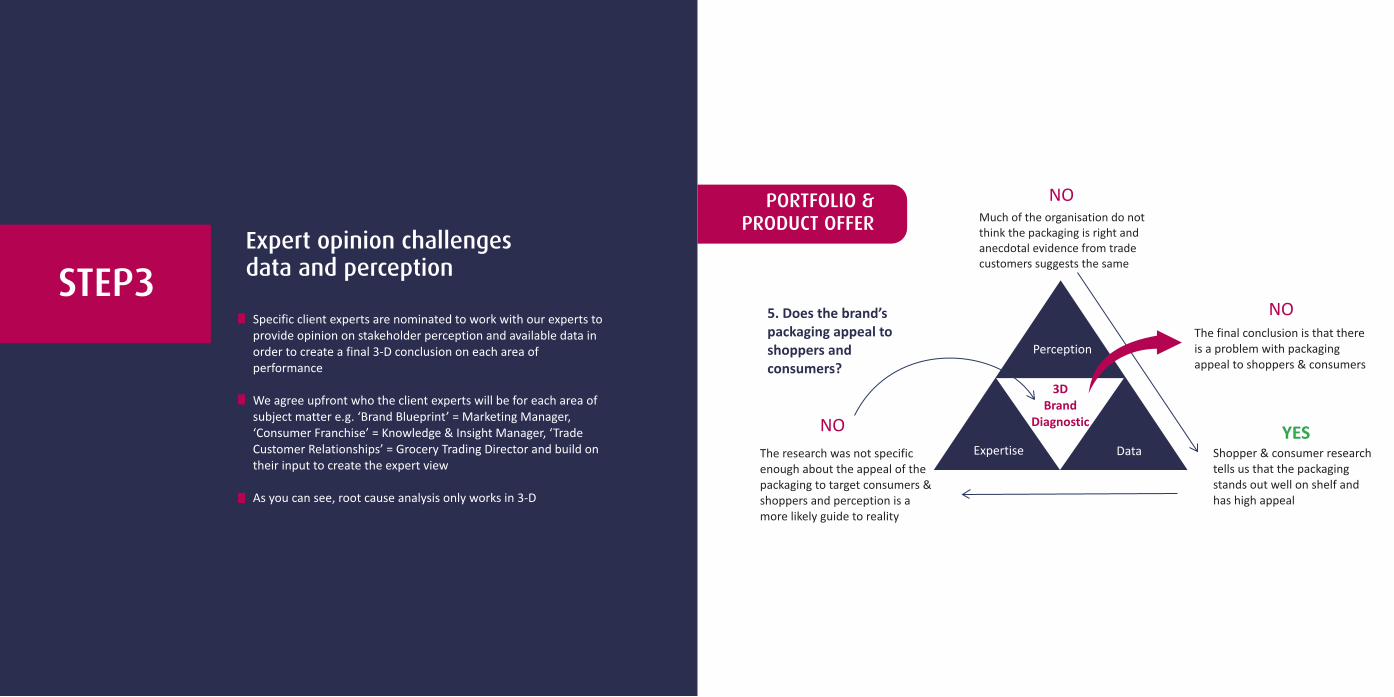
STEP3Expert opinion challenges data and perception
Specific client experts are nominated to work with our experts to provide opinion on stakeholder perception and available data in order to create a final 3-D conclusion on each area of performance
We agree upfront who the client experts will be for each area of subject matter e.g. ‘Brand Blueprint’ = Marketing Manager, ‘Consumer Franchise’ = Knowledge & Insight Manager, ‘Trade Customer Relationships’ = Grocery Trading Director and build on their input to create the expert view
As you can see, root cause analysis only works in 3-D
Much of the organisation do not think the packaging is right and anecdotal evidence from trade customers suggests the same
The research was not specific enough about the appeal of the packaging to target consumers & shoppers and perception is a more likely guide to reality
The final conclusion is that there is a problem with packaging appeal to shoppers & consumers
Shopper & consumer research tells us that the packaging stands out well on shelf and has high appeal
5. Does the brand’s packaging appeal to shoppers and consumers?
Perception
3DBrand
Diagnostic
DataExpertise
NO
NO
NO YES
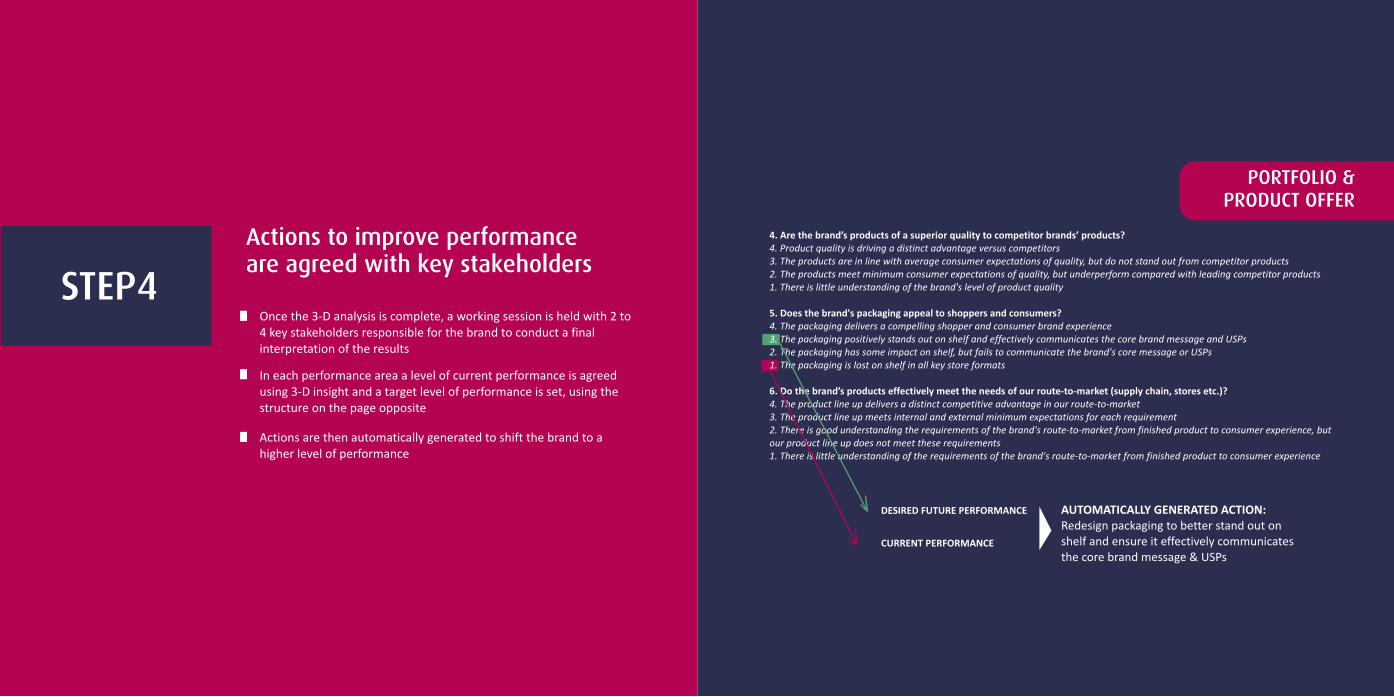
STEP4Actions to improve performance are agreed with key stakeholders
Once the 3-D analysis is complete, a working session is held with 2 to 4 key stakeholders responsible for the brand to conduct a final interpretation of the results
In each performance area a level of current performance is agreed using 3-D insight and a target level of performance is set, using the structure on the page opposite
Actions are then automatically generated to shift the brand to a higher level of performance
AUTOMATICALLY GENERATED ACTION:Redesign packaging to better stand out on shelf and ensure it effectively communicates the core brand message & USPs
DESIRED FUTURE PERFORMANCE
CURRENT PERFORMANCE
4. Are the brand’s products of a superior quality to competitor brands’ products?4. Product quality is driving a distinct advantage versus competitors3. The products are in line with average consumer expectations of quality, but do not stand out from competitor products2. The products meet minimum consumer expectations of quality, but underperform compared with leading competitor products1. There is little understanding of the brand's level of product quality
5. Does the brand's packaging appeal to shoppers and consumers?4. The packaging delivers a compelling shopper and consumer brand experience3. The packaging positively stands out on shelf and effectively communicates the core brand message and USPs2. The packaging has some impact on shelf, but fails to communicate the brand's core message or USPs1. The packaging is lost on shelf in all key store formats
6. Do the brand’s products effectively meet the needs of our route-to-market (supply chain, stores etc.)?4. The product line up delivers a distinct competitive advantage in our route-to-market3. The product line up meets internal and external minimum expectations for each requirement2. There is good understanding the requirements of the brand's route-to-market from finished product to consumer experience, but our product line up does not meet these requirements1. There is little understanding of the requirements of the brand's route-to-market from finished product to consumer experience
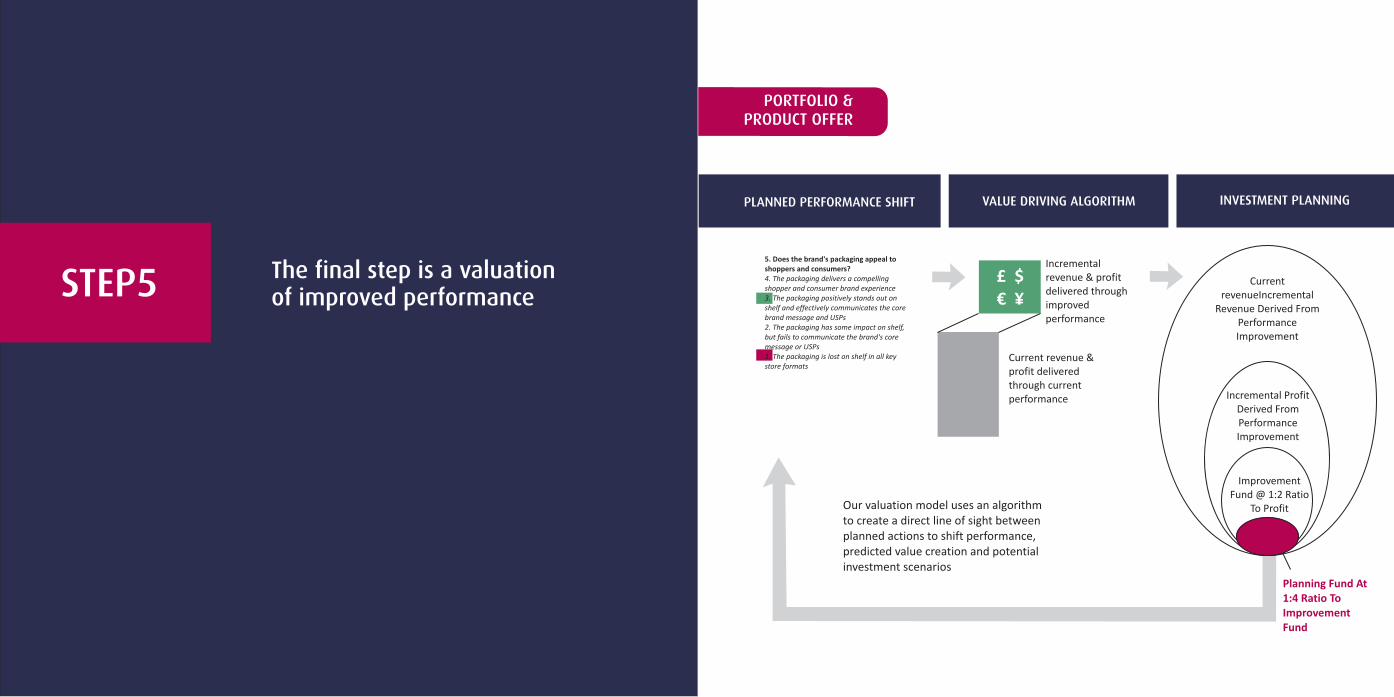
STEP5 The final step is a valuation of improved performance
Our valuation model uses an algorithm to create a direct line of sight between planned actions to shift performance, predicted value creation and potential investment scenarios
Current revenue & profit delivered through current performance
Current revenueIncremental
Revenue Derived From Performance Improvement
Incremental Profit Derived From Performance Improvement
Improvement Fund @ 1:2 Ratio
To Profit
Planning Fund At 1:4 Ratio To Improvement Fund
Incremental revenue & profit delivered through improved performance
5. Does the brand's packaging appeal to shoppers and consumers?4. The packaging delivers a compelling shopper and consumer brand experience3. The packaging positively stands out on shelf and effectively communicates the core brand message and USPs2. The packaging has some impact on shelf, but fails to communicate the brand's core message or USPs1. The packaging is lost on shelf in all key store formats
PLANNED PERFORMANCE SHIFT VALUE DRIVING ALGORITHM INVESTMENT PLANNING
£ $€ ¥
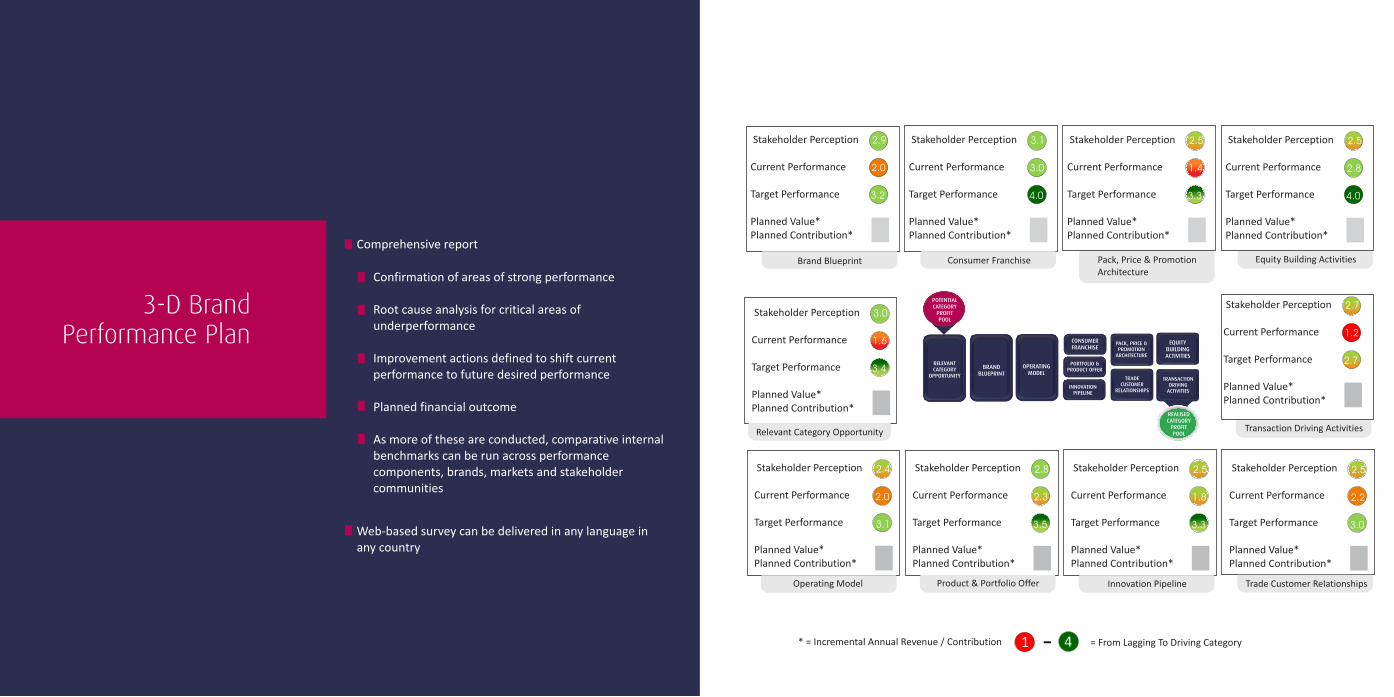
* = Incremental Annual Revenue / Contribution = From Lagging To Driving Category
Confirmation of areas of strong performance
Root cause analysis for critical areas of underperformance
Improvement actions defined to shift current performance to future desired performance
Planned financial outcome
As more of these are conducted, comparative internal benchmarks can be run across performance components, brands, markets and stakeholder communities
1 4
2.9
2.4
3.0
3.1
2.8
2.5
2.5
2.5
2.5
2.0
2.0
1.6
3.0
2.3
1.4
1.8
2.8
2.2
3.2
3.1
3.4
4.0
3.5
3.3
3.3
4.0
3.0
Brand Blueprint
Operating Model
Relevant Category Opportunity
Equity Building Activities
Trade Customer Relationships
Consumer Franchise
Product & Portfolio Offer
Pack, Price & PromotionArchitecture
Innovation Pipeline
2.7
1.2
2.7
Transaction Driving Activities
3-D Brand Performance Plan
Comprehensive report
Web-based survey can be delivered in any language in any country
-
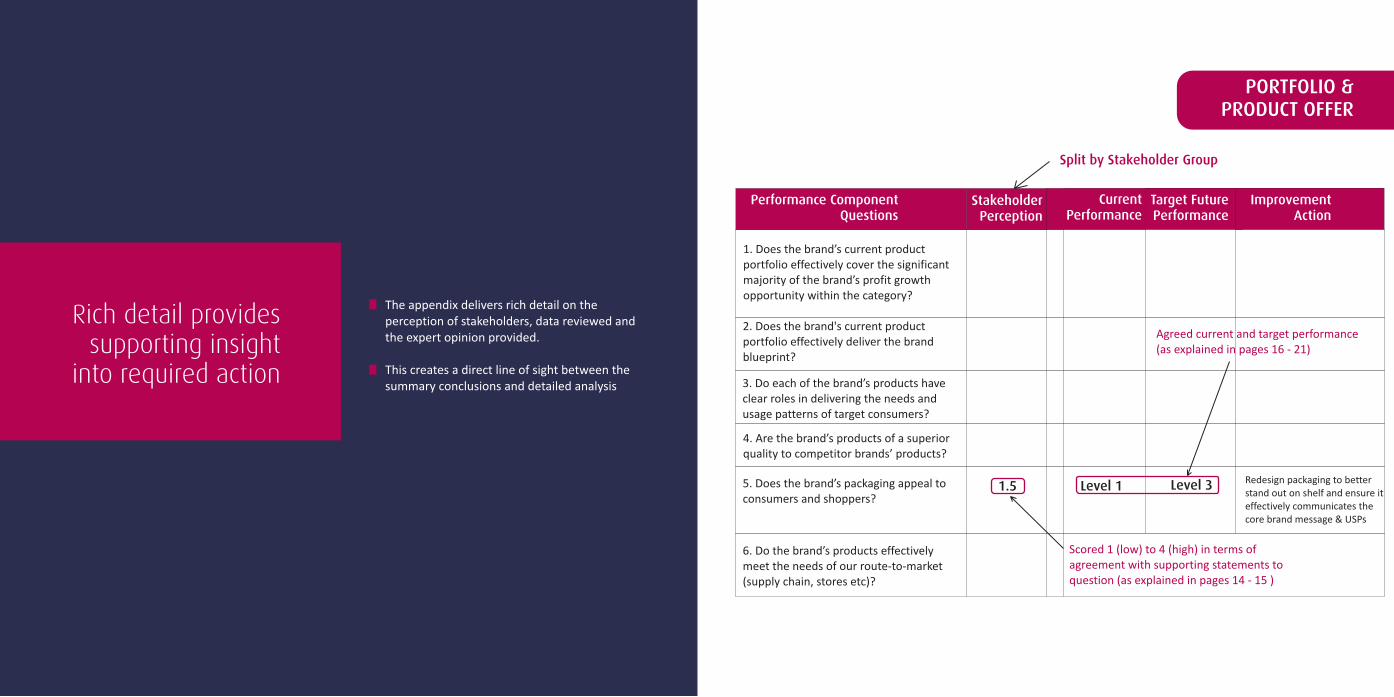
Performance Component Questions
1.5 Level 1 Level 3
Stakeholder Perception
Split by Stakeholder Group
Current Performance
Target Future Performance
Improvement Action
1. Does the brand’s current product portfolio effectively cover the significant majority of the brand’s profit growth opportunity within the category?
2. Does the brand's current product portfolio effectively deliver the brand blueprint?
3. Do each of the brand’s products have clear roles in delivering the needs and usage patterns of target consumers?
4. Are the brand’s products of a superior quality to competitor brands’ products?
5. Does the brand’s packaging appeal to consumers and shoppers?
6. Do the brand’s products effectively meet the needs of our route-to-market (supply chain, stores etc)?
Scored 1 (low) to 4 (high) in terms of agreement with supporting statements to question (as explained in pages 14 - 15 )
Agreed current and target performance (as explained in pages 16 - 21)
The appendix delivers rich detail on the perception of stakeholders, data reviewed and the expert opinion provided.
This creates a direct line of sight between the summary conclusions and detailed analysis
Redesign packaging to better stand out on shelf and ensure it effectively communicates the core brand message & USPs
Rich detail provides supporting insight
into required action
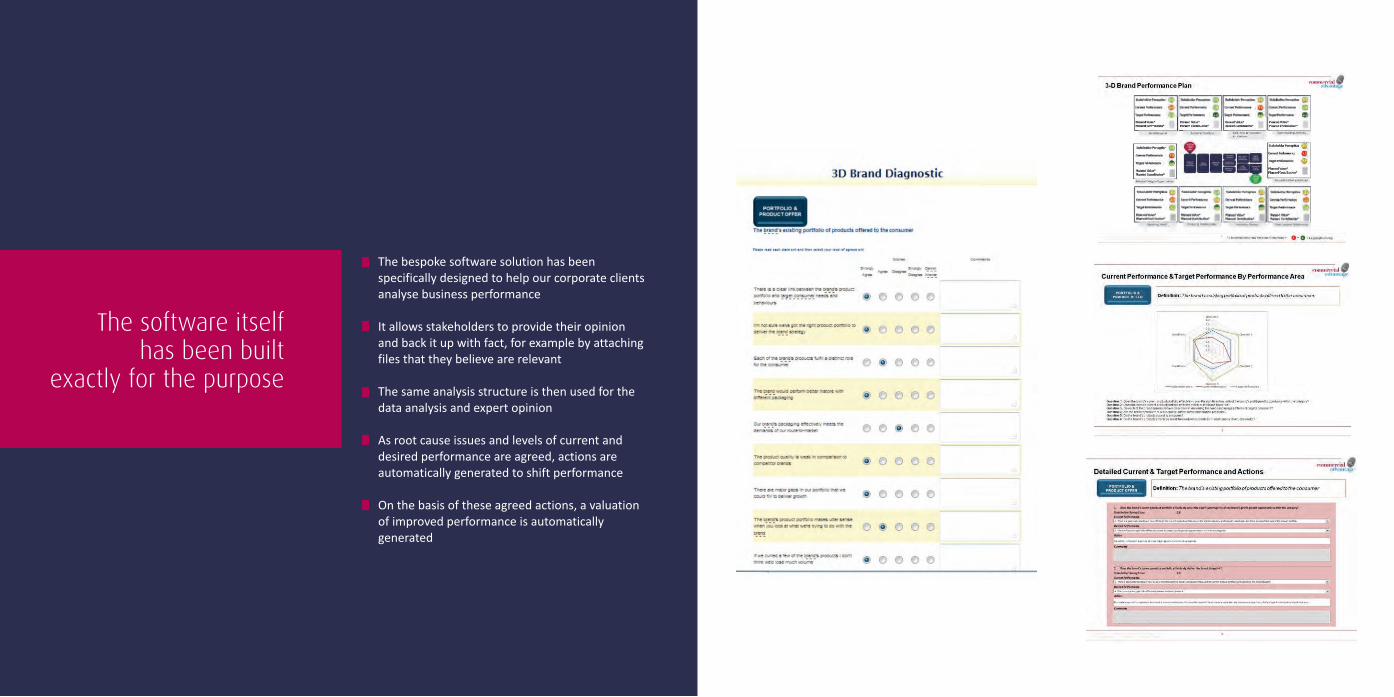
The bespoke software solution has been specifically designed to help our corporate clients analyse business performance
It allows stakeholders to provide their opinion and back it up with fact, for example by attaching files that they believe are relevant
The same analysis structure is then used for the data analysis and expert opinion
As root cause issues and levels of current and desired performance are agreed, actions are automatically generated to shift performance
On the basis of these agreed actions, a valuation of improved performance is automatically generated
The software itself has been built
exactly for the purpose
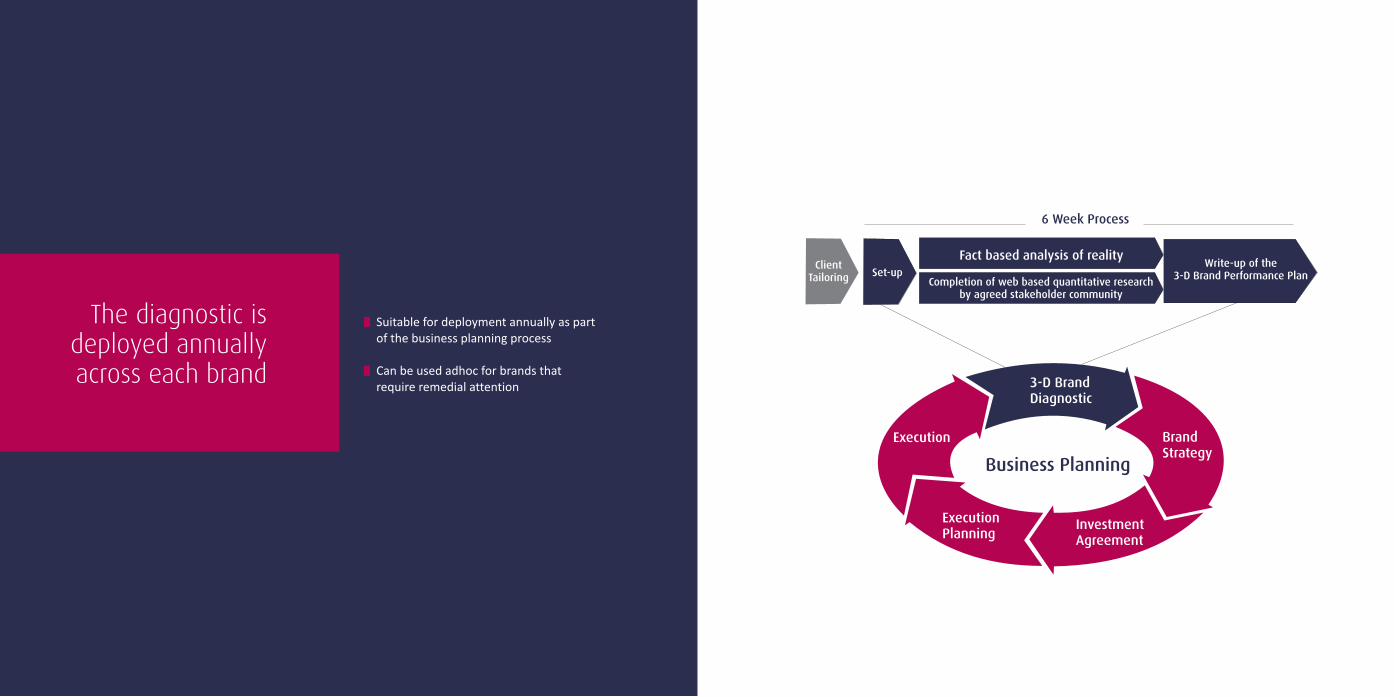
The diagnostic is deployed annually across each brand
Suitable for deployment annually as part of the business planning process
Can be used adhoc for brands that require remedial attention
Fact based analysis of reality
6 Week Process
Completion of web based quantitative research by agreed stakeholder community
Write-up of the 3-D Brand Performance PlanSet-up
ClientTailoring
3-D Brand Diagnostic
Business Planning
Brand Strategy
Investment Agreement
ExecutionPlanning
Execution
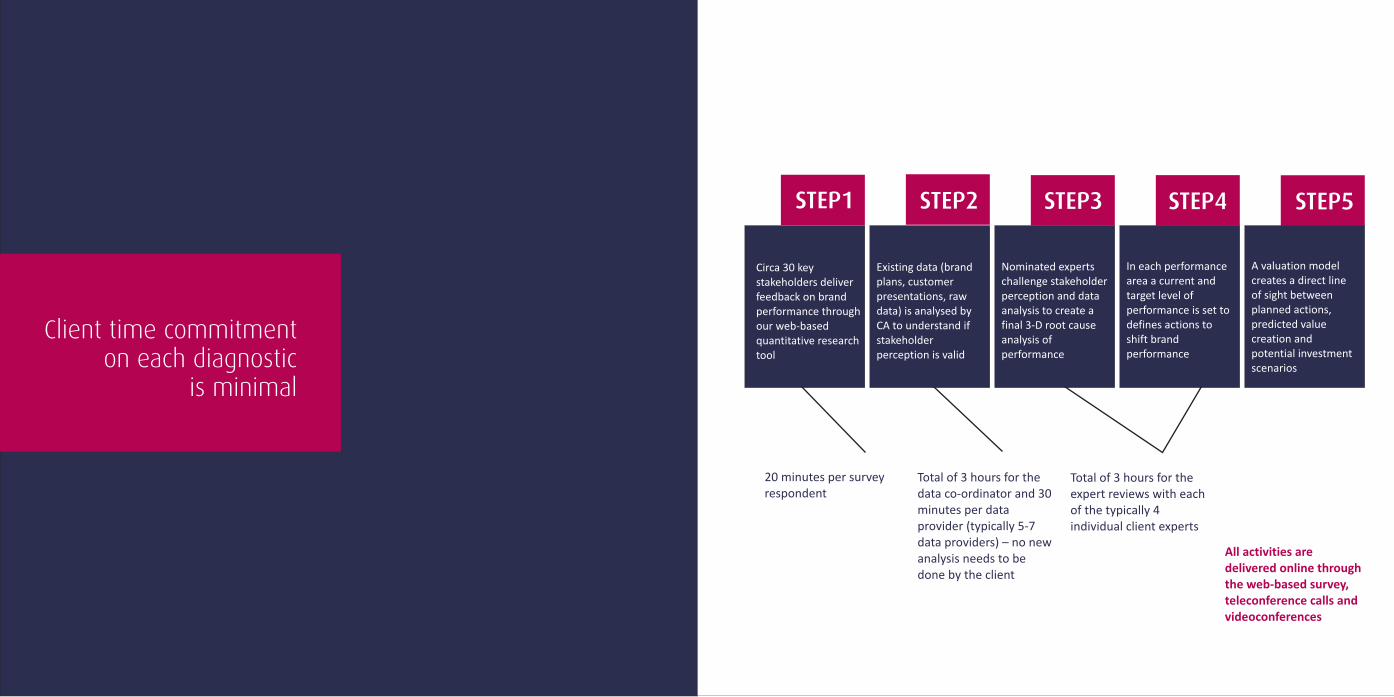
Client time commitment on each diagnostic
is minimal
Circa 30 key stakeholders deliverfeedback on brandperformance through our web-basedquantitative research tool
Existing data (brand plans, customer presentations, raw data) is analysed by CA to understand if stakeholder perception is valid
Nominated experts challenge stakeholder perception and data analysis to create a final 3-D root cause analysis of performance
In each performance area a current and target level of performance is set to defines actions to shift brand performance
A valuation model creates a direct line of sight between planned actions, predicted value creation and potential investment scenarios
STEP1 STEP2 STEP3 STEP4 STEP5
20 minutes per survey respondent
Total of 3 hours for the data co-ordinator and 30 minutes per data provider (typically 5-7 data providers) – no new analysis needs to be done by the client
Total of 3 hours for the expert reviews with each of the typically 4 individual client experts
All activities are delivered online through the web-based survey, teleconference calls and videoconferences
There are 3 levels at which the diagnostic
can operate
Stakeholders typically include 5 Global respondents and 5 respondents in each Region
Fact based analysis is conducted from global data
Typically 30 respondents per diagnostic
£35,000 fee* as a one-off or less for a 3 year contract or multiple diagnostics
* = excludes out of pocket charged at cost and VAT charged at the applicable rate
Stakeholders typically include 5 Regional respondents and 5 Local respondents in each country or market cluster
Fact based analysis is conducted from Regional data (e.g. Europe)
Stakeholders typically include 5 local Leadership Team members and 25 cross-functional local representatives
Fact based analysis is conducted from local data
GLOBAL
1
2
3
REGIONAL
LOCAL
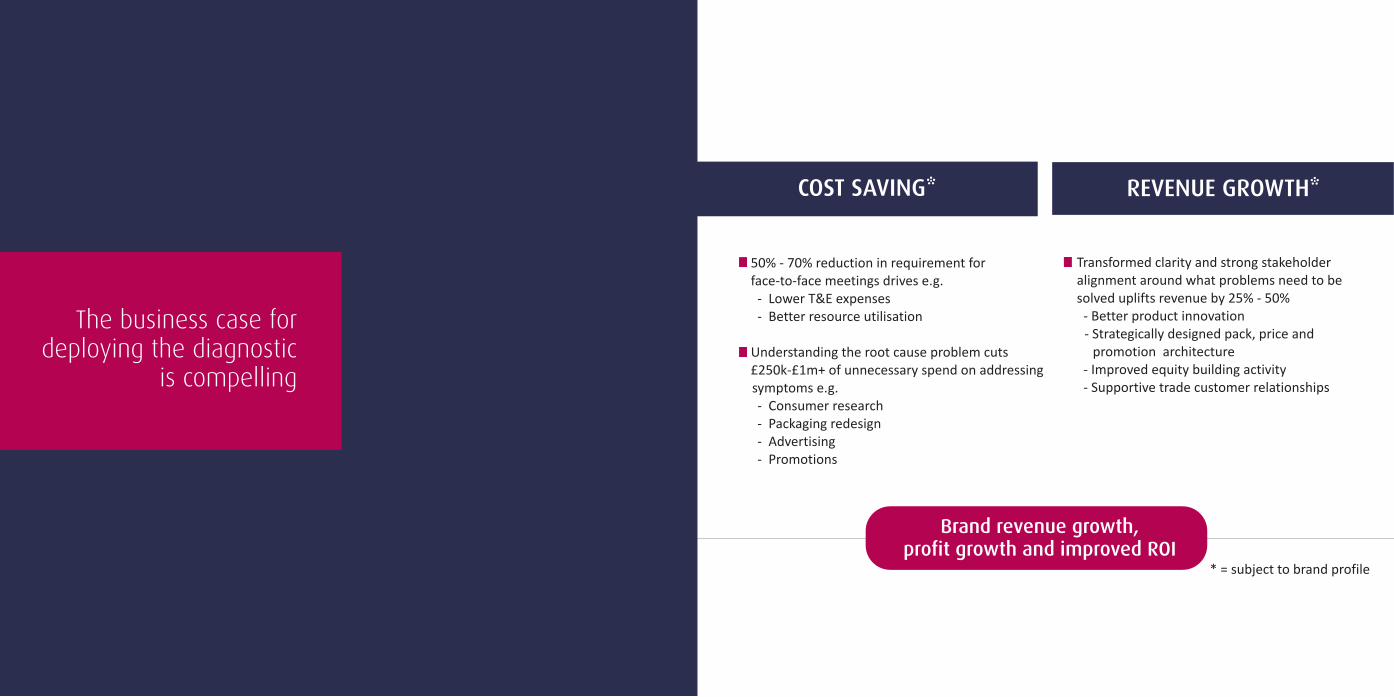
50% - 70% reduction in requirement for face-to-face meetings drives e.g. - Lower T&E expenses - Better resource utilisation
Understanding the root cause problem cuts £250k-£1m+ of unnecessary spend on addressing symptoms e.g. - Consumer research - Packaging redesign - Advertising - Promotions
Transformed clarity and strong stakeholder alignment around what problems need to be solved uplifts revenue by 25% - 50% - Better product innovation - Strategically designed pack, price and
promotion architecture - Improved equity building activity - Supportive trade customer relationships
* = subject to brand profile
Brand revenue growth, profit growth and improved ROI
COST SAVING* REVENUE GROWTH*
The business case for deploying the diagnostic
is compelling
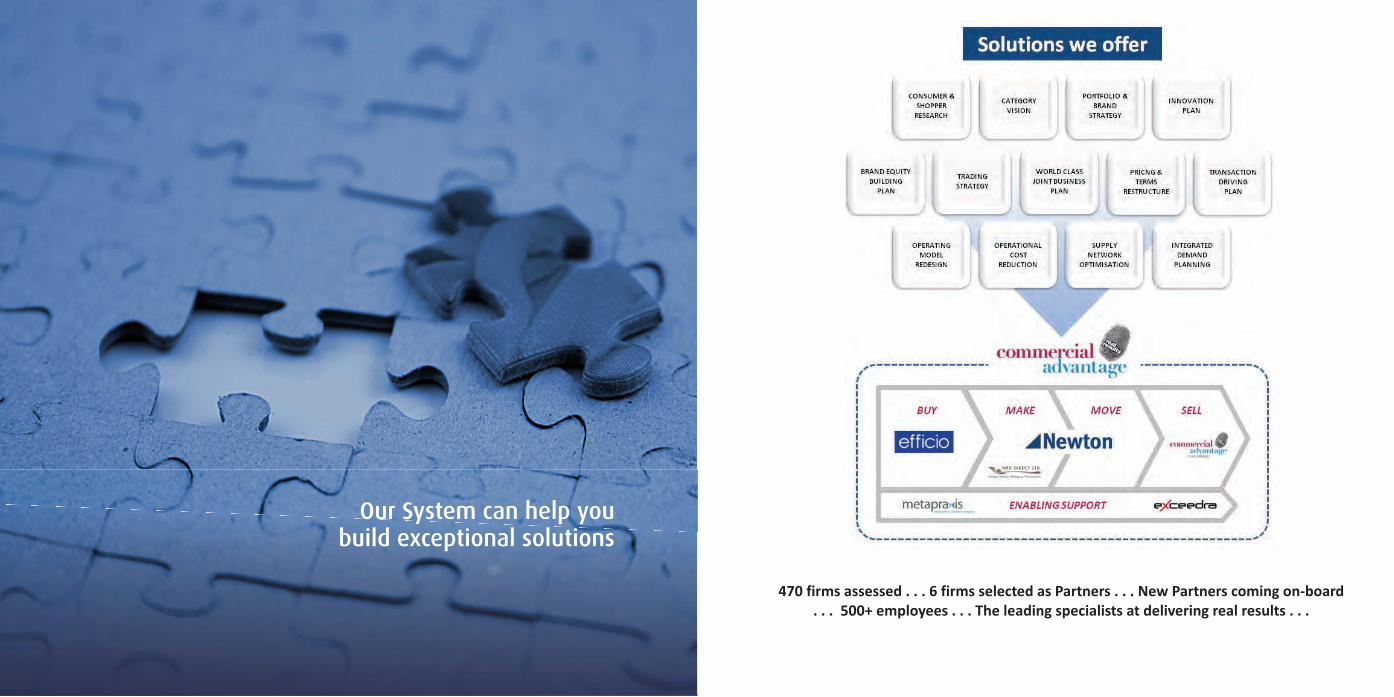
470 firms assessed . . . 6 firms selected as Partners . . . New Partners coming on-board . . . 500+ employees . . . The leading specialists at delivering real results . . .
Our System can help you build exceptional solutions
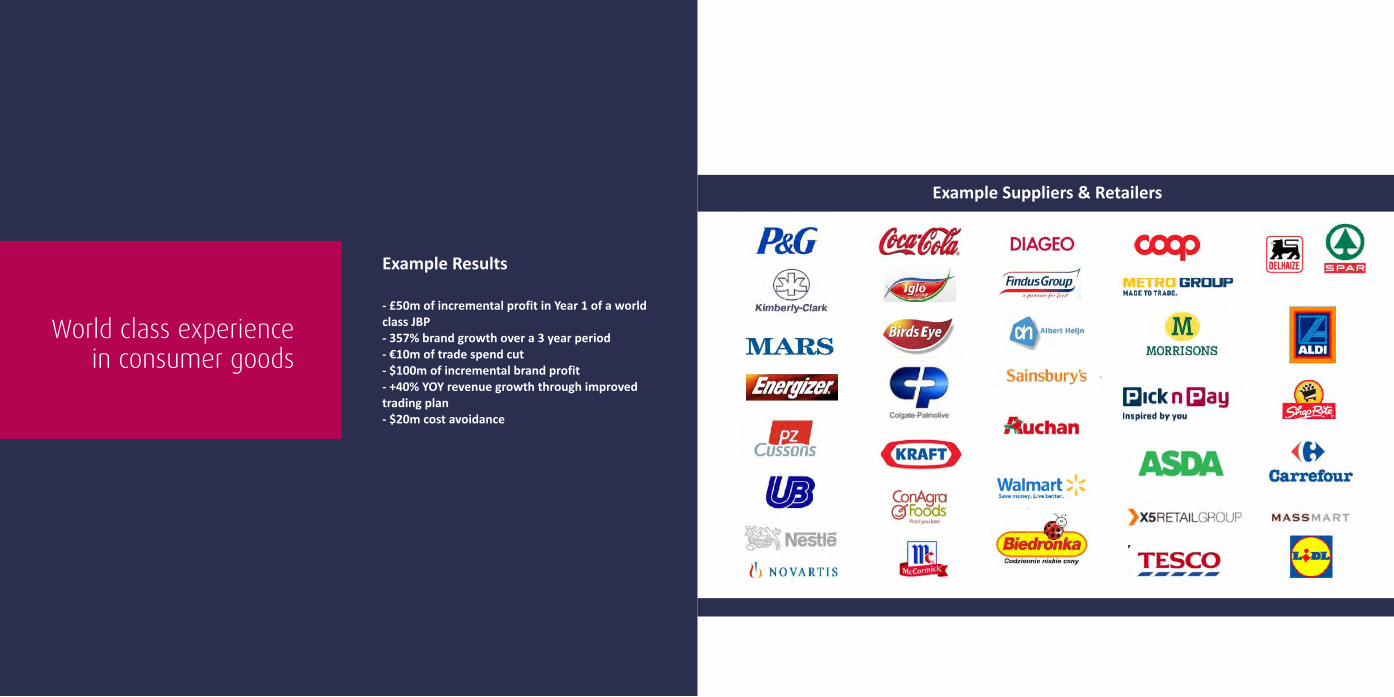
Example Results
- £50m of incremental profit in Year 1 of a world class JBP- 357% brand growth over a 3 year period- €10m of trade spend cut- $100m of incremental brand profit- +40% YOY revenue growth through improved trading plan- $20m cost avoidance
Example Suppliers & Retailers
World class experience in consumer goods