3. Isolation, purification and characterization of inclusion bodies 3.1 Introduction 3.2 Materials and methods 3.2.1 Chemicals and reagents 61 63 63 3.2.2 Strains and plasmids 63 3.2.3 Cloning of L-asparaginase II, enolase, hGH and Cu-Zn SOD 63 3.2.4 Preparation of glycerol stocks of recombinant clones 64 3.2.5 Growth and expression kinetics of recombinant clones 64 3.2.6 Inclusion body isolation and purification 65 3.2. 7 Purification of inclusion bodies by sucrose density gradient 70 ultracentrifugation. 3.2.8 Gel electrophoresis 71 3.2.9 Estimation of protein concentration 71 3.2.1 0 Preparation of in vitro aggregates 71 3.2.11 Transmission electron microscopy of inclusion bodies and in 72 vitro aggregates 3.2.12 Determination of surface charge of inclusion bodies 72 3.3 Results and discussion 72 3.3.1 Growth kinetics and expression of recombinant proteins 72 3.3.2 Isolation and purification of inclusion bodies from E. coli 79 3.3.3 Effect of induction time on cell growth and recombinant 82 protein expression 59
Transcript
3. Isolation, purification and characterization of
inclusion bodies
3.1 Introduction
3.2 Materials and methods
3.2.1 Chemicals and reagents
61
63
63
3.2.2 Strains and plasmids 63
3.2.3 Cloning of L-asparaginase II, enolase, hGH and Cu-Zn SOD 63
3.2.4 Preparation of glycerol stocks of recombinant clones 64
3.2.5 Growth and expression kinetics of recombinant clones 64
3.2.6 Inclusion body isolation and purification 65
3.2. 7 Purification of inclusion bodies by sucrose density gradient 70
ultracentrifugation.
3.2.8 Gel electrophoresis 71
3.2.9 Estimation of protein concentration 71
3.2.1 0 Preparation of in vitro aggregates 71
3.2.11 Transmission electron microscopy of inclusion bodies and in 72
vitro aggregates
3.2.12 Determination of surface charge of inclusion bodies 72
3.3 Results and discussion 72
3.3.1 Growth kinetics and expression of recombinant proteins 72
3.3.2 Isolation and purification of inclusion bodies from E. coli 79
3.3.3 Effect of induction time on cell growth and recombinant 82
protein expression
59
3.3.4 Purification of inclusion bodies by sucrose density gradient 88
ultracentrifugation
3.3.5 Electron· microscopy and surface charge analysis of 90
inclusion bodies
3.3.6 Specificity of in vitro aggregation of recombinant proteins 94
3.4 Conclusions 96
3.5 References 97
60
3. Isolation, purification and characterization of inclusion bodies
3.1 Introduction
Recombinant protein expression in Escherichia coli often results in
formation of insoluble aggregates of expressed proteins defined as inclusion
bodies (ISs) (1-4). The inclusion body formation inside host cells depends on
various parameters; intrinsic as well as extrinsic factors associated with the host
cells besides nature of protein itself. Most effective intrinsic factors which affect
inclusion body formation are- genetic constitution of host cell, vector, promoter
strength and plasmid copy number while extrinsic factors include growth media
compositions, pH, temperature and inducer concentration (5-12). Most of the time,
final outcome of high level expression in E. coli is the formation of protein
aggregates. Inclusion body aggregates chiefly consist of expressed protein in
denatured or misfolded states. The major possible reason for aggregation has
been the association of partially denatured or misfolded proteins molecules
through strong hydrophobic interactions (13). Beside higher percentage of
expressed protein; inclusion bodies also consist of other proteins, nucleic acids,
lipids and carbohydrates in significant proportion as impurities. Protein
aggregates in inclusion bodies have been reported to be specific in nature (14).
Thus, it would be appropriate if they are separated and purified to homogeneity
before solubilization and refolding (15-16). As contaminating proteins affect the
refolding yield (17), it is preferable to purify the inclusion body aggregates to
homogeneity before solubilization and refolding.
Optimization of expression conditions, inclusion body isolation and
purification protocols are thus essential for achieving high throughput protein
recovery. Four inclusion body forming recombinant proteins (E. coli L
asparaginase II, Mycobacterium tuberculosis enolase, human growth hormone
and human Cu-Zn superoxide dismutase) were used in this study to analyze the
characteristics of protein aggregates. These proteins were chosen on the basis of
their physical properties like molecular nature, molecular weight, isoelectric point
and hydrophobicity to develop better insight about underlying forces responsible
for aggregation during recombinant protein production. Description about the
61
physical properties, expression vector and host for all the four proteins is given in
table 3.1.
In this chapter, expression studies of these four proteins were carried out
in detail. These four proteins were expressed as inclusion body in E. coli. Effect
of induction time on quality and quantity of protein expressed as inclusion body
was evaluated. Sucrose density gradient ultra-centrifugation and detergent
washing methods were used to isolate pure inclusion bodies from E. coli cells.
Inclusion bodies of all the four proteins were purified to homogeneity. In vitro
aggregates of proteins were compared with in vivo aggregates (inclusion
bodies).They were characterized in terms of size, surface charge and
Table 3.1 Details about recombinant E. coli clones and properties of proteins (Lasparaginase, enolase, hGH and Cu-Zn SOD).
62
3.2 Materials and methods
3.2.1 Chemicals and reagents
Culture media ingredients, tryptone and yeast extract were from Difco
Laboratories, India. Tris buffer, Glycine, IPTG, sodium dodecyl sulphate, PMSF,
and deoxy cholic acid were from Amresco, USA. Ammonium persulphate,
acrylamide and bis-acrylamide from Sigma chemicals, USA. TEMED, EDTA,
Bromophenol blue from BIO-RAD, USA. Coomassie brilliant blue R-250 and
ampicillin and kanamycin were from USB Corporation, Cleveland, Ohio. SDS
PAGE low molecular weight marker was purchased from GE Healthcare, USA.
Micro BCA assay kit from Pierce, USA. Glucose, NaCI, reagents and other·
chemicals were from Qualigen, India.
3.2.2 Strains and plasmids
Escherichia coli BL21 (DE3) and M 15 strain were from Novagen, USA.
Strain DH5a was obtained from Invitrogen, USA. Vectors were obtained from
Novagen, USA.
3.2.3 Cloning of L-asparaginase II, enolase, hGH and Cu-Zn SOD
The detail of vectors used for cloning these genes has been given in table
3.1. Briefly, these genes were amplified using specific primers and then inserted
into their respective vectors by ligation methods. After successful ligation, these
recombinant vectors were transferred into expression hosts and expression level
of genes were analyzed at protein level by SDS-PAGE. L-asparaginase II gene
was amplified from the genomic DNA of E. coli K-12 strain (JM109) using primers
(forward) 5 'GTGCAGCACATATGTT ACCCAA TATCACCA 3' and (reverse )_2
GGCGGGATCCTTAGTACTGATTGAAGA 3'. Ndel and BamHI restriction sites
were incorporated in the primers to facilitate cloning of the structural
asparaginase gene (without its native signal ~equence) in the E. coli expression
vector pET14b in fusion with a six histidine tag at the N-terminus. The resultant
recombinant plasmid pET14b-Asp was sequenced to confirm the asparaginase
gene insert. E. coli BL21 (DE3) cells were transformed with recombinant pET14b
plasmid vector to get the expression strain. Mycobacterium enolase gene was
amplified from genomic DNA of Mycobacterium tuberculosis, H37Rv strain using
63
forward primer 5'GGAACAT ATGCCGATATCGGCAGG3' and reverse primer
5'CCAAGCTTTTTCGTCTCGCACGCGAACC3'. Cloning was carried out in
expression vector pET22b at Nde I and Hind Ill restriction sites and transferred to
E. coli BL21 (DE3). Similarly, hGH and Cu-Zn SOD were cloned in pQE 60
vector and transferred in expression host E. coli M15 strain for protein expression
(17). Recombinant clones of enolase, hGH and Cu-Zn SOD were obtained from
Dr. L. C. Garg, Nil, New Delhi and of L-asparaginase was from Prof. K. J.
Mukherjee, School of Biotechnology, Jawaharlal Nehru University, New Delhi.
3.2.4 Preparation of glycerol stocks of recombinant clones
E. coli cells expressing above mentioned genes were grown overnight in
Luria-Bertani (LB) media (containing ampicillin or/and kanamycin depending on
the nature of vector and host cells as described in table 3.1) at 3rC and 200 rpm.
Overnight grown primary inoculums (1 ml) were transferred to fresh LB medium
(1 00 ml) and grown up to 0.8 optical density (OD) at 600 nm. Cells were
harvested and re-suspended in 50 ml LB medium consisting of 20 % glycerol.
Aliquots (1 ml) were prepared and transferred to -20°C for 24 hrs. Finally glycerol
stocks of various clones were stored at -70°C. These glycerol stocks were used
for preparing culture for protein expression and purification.
3.2.5 Growth and expression kinetics of recombinant clones
E. coli strains expressing asparaginase, enolase, h,GH and SOD were
inoculated from glycerol stock to 20 ml sterilized LB medium containing 1 00 1-Lg/ml
ampicillin or/and 25 1-Lg/ml kanamycin depending on the nature of clones. E. coli
cells were grown overnight at 3rC and at 200 rpm in an orbital shaker. Overnight
grown E. coli cells (20 ml) were inoculated into 2 litre LB medium containing 100
1-Lg/ml ampicillin or/and 25 1-Lg/ml kanamycin. Cells were allowed to grow until the
optical density (OD) of the culture at 600 nm reaches 0.6-0.8. At this time point, E.
coli cells were induced with 1 mM isopropyl J3-D-thio-galactopyranoside (IPTG)
and were grown for another 3.5 hrs. E.coli cells were harvested by centrifugation
at 6000 rpm for 10 min at 4°C. Cell pellets were re-suspended in Tris-HCI buffer
and centrifuged again at 12,000 rpm for 20 min at 4°C. The cell pellet obtained
was used for inclusion body extraction or stored at -20°C for further processing.
The harvested cells were checked for expression of induced and un-induced
64
recombinant clones by SDS-PAGE. For growth kinetic analyses, OD of culture at
600 nm was recorded at fixed time intervals (-30 minutes). Uninduced culture
was used as control. Expression of protein was checked by SDS-PAGE (12 %).
To evaluate the effect of induction time, E. coli cells were induced at early
log phase, log phase, late log phase and stationary phase of the growth. The
cells were grown for 3 hours after induction. Equal biomasses of cells were
processed and loaded on SDS-PAGE to check the yield of expressed protein.
Inclusion body yield per unit biomass of cells were estimated by micro BCA
method.
3.2.6 Inclusion body isolation and purification
All four proteins resulted in the formation of inclusion body aggregates
during expression. Cells expressing recombinant proteins as inclusion bodies
were re-suspended in appropriate buffer solution and lysed by sonication (10
cycle of 1 minute each with one minute gap, 60 % duty cycle, power output 25
watts) method. The lysed cells were centrifuged at 12,000 rpm and at 4°C to
obtain the inclusion body aggregates. Further purification of inclusion bodies was
achieved through detergent washing method (19). Most common detergents used
during inclusion bodies washing steps are basically anionic in nature. These
detergents behave as mild denaturants and good surfactants. They are Triton X-
100, Deoxycholic acid (DOC). Generally, 1 to 2 % solution of Triton X-100 or
DOC is used during sonication and washing steps for inclusion body isolation and
purification. They form micelle around amphipathic membranous debris and other
cellular bodies and solubilize them. Thus these detergents help in removing the
attached membranous impurities from inclusion bodies surface. However, their
use also depends on the nature of inclusion body aggregates. Sodium salt of
Deoxycholic acid (DOC) is most widely used during cell lysis to purify inclusion
bodies. The detail protocol used during isolation and purification of inclusion
bodies of asparaginase, enolase, hGH and Cu-Zn SOD are given below in flow
charts 3.1 to 3.4.
65
3.2.6.1 Isolation and purification of L-asparaginase II inclusion bodies
Induce E. coli cells (2 L culture volume) expressing asparaginase with 1 mM
IPTG at an 00 of 0.7 at 600 nm and grow for 3.5 hrs. Harvest cells by
centrifugation (6000 rpm for 10 minutes at 4°C).
! Re-suspend and homogenize the cells pellet in 20 ml of 50 mM Tris-HCI, 5 mM
EDTA and 1 mM PMSF at pH 8.5 and sonicate (10 cycles, 60% duty, power 25
watt of 1 minute each with 1 minute gap on ice). Centrifuge the lysed cells at
12,000 rpm for 20 min at 4°C and discard the supernatant.
! Re-suspend and homogenize the pellet in 20 ml of 50 mM Tris-HCI, 5 mM EDTA,
1 mM PMSF and 0.1 % deoxycholate (DOC) at pH 8.5 and sonicate (1 0 cycles,
60% duty, power 25 watts of 1 minute each with 1 minute gap on ice). Centrifuge
at 12,000 rpm for 20 min at 4°C and discard the supernatant.
! Re-suspend inclusion body pellet in 50 ml of 50 mM Tris-HCI, 5 mM EDTA, 1 mM
PMSF at pH 8.5. Leave it for one hour and then centrifuge it at 12,000 rpm for 20
min at 4°C and discard the supernatant.
! Re-suspend inclusion body pellet in 50 ml of 50 mM Tris-HCI and 5 mM EDTA at
pH 8.5. Leave it for one hour and then centrifuge it at 12,000 rpm for 20 min at
4°C and discard the supernatant.
! Re-suspend inclusion body pellet in 50 ml of MQ water. Homogenize (5000 rpm,
2 minutes) it and centrifuge at 12,000 rpm for 20 min at 4°C and discard the
supernatant.
! Re-suspend the pure inclusion body pellet in two ml MQ water.
Flow chart 3.1: Isolation and purification of L-asparaginase inclusion
bodies.
66
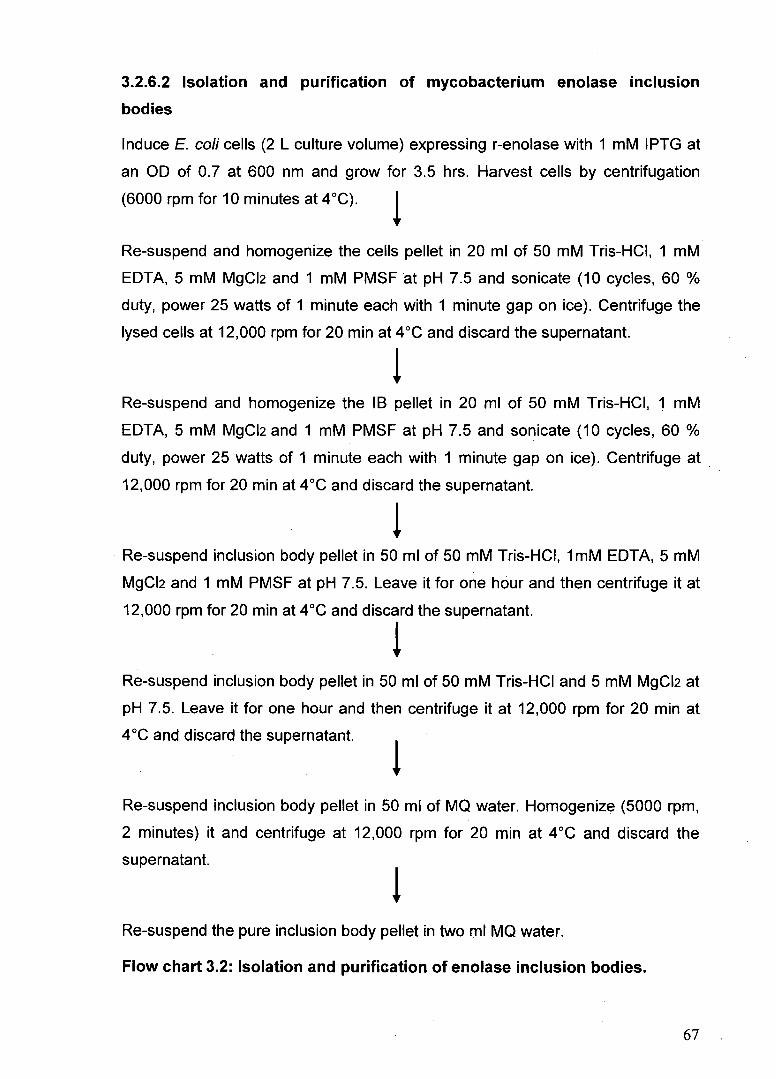
3.2.6.2 Isolation and purification of mycobacterium enolase inclusion
bodies
Induce E. coli cells (2 L culture volume) expressing r-enolase with 1 mM IPTG at
an OD of 0. 7 at 600 nm and grow for 3.5 hrs. Harvest cells by centrifugation
(6000 rpm for 10 minutes at 4 °C). ! Re-suspend and homogenize the cells pellet in 20 ml of 50 mM Tris-HCI, 1 mM
EDTA, 5 mM MgCI2 and 1 mM PMSF at pH 7.5 and sonicate (10 cycles, 60 %
duty, power 25 watts of 1 minute each with 1 minute gap on ice). Centrifuge the
lysed cells at 12,000 rpm for 20 min at 4°C and discard the supernatant.
! Re-suspend and homogenize the IB pellet in 20 ml of 50 mM Tris-HCI, 1 mM
EDTA, 5 mM MgCI2 and 1 mM PMSF at pH 7.5 and sonicate (10 cycles, 60 %
duty, power 25 watts of 1 minute each with 1 minute gap on ice). Centrifuge at .
12,000 rpm for 20 min at 4°C and discard the supernatant.
! Re-suspend inclusion body pellet in 50 ml of 50 mM Tris-HCI, 1 mM EDTA, 5 mM
MgCI2 and 1 mM PMSF at pH 7.5. Leave it for one hour and then centrifuge it at
12,000 rpm for 20 min at 4°C and discard the supernatant.
! Re-suspend inclusion body pellet in 50 ml of 50 mM Tris-HCI and 5 mM MgCI2 at
pH 7.5. Leave it for one hour and then centrifuge it at 12,000 rpm for 20 min at
4 oc and discard the supernatant.
! Re-suspend inclusion body pellet in 50 ml of MQ water. Homogenize (5000 rpm,
2 minutes) it and centrifuge at 12,000 rpm for 20 min at 4°C and discard the
supernatant.
! Re-suspend the pure inclusion body pellet in two ml MQ water.
Flow chart 3.2: Isolation and purification of enolase inclusion bodies.
67
3.2.6.3 Isolation of and purification of hGH inclusion bodies
Induce E. coli cells (2 L culture volume) expressing hGH with 1 mM IPTG at an
OD of 0.7 at 600 nm and grow for 3.5 hrs. Harvest cells by centrifugation (6000
rpm for 10 minutes at 4°C). ! Re-suspend and homogenize the cells pellet in 20 ml of 50 mM Tris-HCI, 5 mM
EDTA, 1 mg/ml lysozyme and 1 mM PMSF at pH 8.5 and leave for 2 hours and
then sonicate (1 0 cycles, 60 % duty, power 25 watts of 1 minute each with 1
minute gap on ice). Centrifuge the lysed cells at 12,000 rpm for 20 min at 4°C
and discard supernatant. ! Re-suspend and homogenize the inclusion body pellet in 20 ml of 50 mM Tris
HCI, 5 mM EDTA, 1 mM PMSF and 2 % deoxycholate (DOC) at pH 8.5 and
sonicate (1 0 cycles, 60 % duty, power 25 watts of 1 minute each with 1 minute
gap on ice). Centrifuge at 12,000 rpm for 20 min at 4°C and discard the
supernatant. ! Re-suspend inclusion body pellet in 50 ml of 50 mM Tris-HCI, 5 mM EDTA, 2%
DOC and 1 mM PMSF at pH 8.5. Leave it for one hour and then centrifuge it at
12,000 rpm for 20 min at 4°C and discard the supernatant.
! Re-suspend inclusion body pellet in 50 ml of 50 mM Tris-HCI and 5 mM EDTA at
pH 8.5. Leave it for one hour and then centrifuge it at 12,000 rpm for 20 min at
4°C and discard the supernatant.
! Re-suspend inclusion body pellet in 50 ml of MQ water. Homogenize (5000 rpm,
2 minutes) it and centrifuge at 12,000 rpm for 20 min at 4oC and discard the
supernatant. ! Re-suspend the pure inclusion body pellet in two ml MQ water.
Flow chart 3.3: Isolation and purification of hGH inclusion bodies.
68
3.2.6.4 Isolation and purification of human Cu-Zn SOD inclusion bodies
Induce E. coli cells (2 L culture volume) expressing SOD with 1 mM IPTG at an
OD of 0.7 at 600 nm and grow for 3.5 hrs. Harvest cells by centrifugation (6000
rpm for 10 minutes at 4°C).
Re-suspend and homogenize the cells pellet in 20 ml of 50 mM Tris-HCI, 1 mM
EDTA, 1 mM CuS04, 1 mM ZnS04 and 1 mM PMSF at pH 7.5 and sonicate (10
cycles, 60 % duty, power 25 watts of 1 minute each with 1 minute gap on ice).
Centrifuge the lysed cells at 12,000 rpm for 20 min at 4°C and discard the
supernatant. ! Re-suspend and homogenize the inclusion body pellet in 20 ml of 50 mM Tris
HCI, 1 mM EDTA, 1 mM CuS04, 1 mM ZnS04 and 1 mM PMSF at pH 7.5 and
sonicate (1 0 cycles, 60 % duty, power 25 watts of 1 minute each with 1 minute
gap on ice). Centrifuge at 12,000 rpm for 20 min at 4°C and discard the
supernatant. ! Re-suspend inclusion body pellet in 50 ml of 50 mM Tris-HCI, 1 mM CuS04, 1 ,
mM ZnS04 and 1 mM PMSF at pH 7.5. Leave it for one hour and then centrifuge
it at 12,000 rpm for 20 min at 4°C and discard the supernatant.
! Re-suspend inclusion body pellet in 50 ml of 50 mM Tris-HCI at pH 7.5. Leave it
for one hour and then centrifuge it at 12,000 rpm for 20 min at 4°C and discard
the supernatant.
! Re-suspend IBs pellet in 50 ml of MQ water. Homogenize (5000 rpm, 2 minutes)
it and centrifuge at 12,000 rpm for 20 min at 4 oc and discard the supernatant.
! Re-suspend the pure inclusion body pellet in two ml MQ water.
Flow chart 3.4: Isolation and purification of Cu-Zn SOD inclusion bodies.
69
3.2. 7 Purification of inclusion bodies by sucrose density gradient
ultracentrifugation
In spite of detergent washing, inclusion body aggregates always consist of
detectable amount of impurities in form of membranes debris and other proteins
in aggregated form. As inclusion bodies are denser than aggregated impurities,
their separation can be carried out by density gradient ultra centrifugation
methods (20). This method is very useful and results in good yields of pure
inclusion bodies which can be further used for their characterization,
solubilization and refolding to obtain bioactive proteins. This method does not
require any detergent treatment. Basic steps involve in sucrose gradient method
are as follow:
1. E. coli cells expressing recombinant proteins (1 litre LB culture) were re
suspended in 10 ml lysis buffer as described in 18 isolation flow chart.
2. Cells were sonicated (1 0 cycles, 1 min each and 1 min gap, 50 % duty cycle,
and output control 4, on ice) for cell lysis. The cell lysate was centrifuged at
12,000 rpm for 20 min at 4°C to obtain 18 pellets.
3. Inclusion body pellet was re-suspended in 2 ml Tris-EDTA buffer.
4. Sucrose step gradient was prepared in ultracentrifuge rotor tubes by drop
wise addition of sucrose solution. 1 ml of each of 80 %, followed by 72 %, 70
%, 68 %, 66 %, 64 %, 62 %, and 60% (w/v) of sucrose solution was added
from bottom to top of the tube to prepare the sucrose gradient.
5. 1 ml inclusion body suspension was added on top of the 60 % sucrose layer
in the tube, and centrifuged at 1 ,20,000g for 6 hrs in a swinging rotor at 4°C.
6. Inclusion bodies were seen in the sucrose gradient as a dense layer below
impurities. The dense layer was carefully removed by pipetting without
disturbing the other layers and washed with M.Q. Purity of the inclusion
bodies was checked by SDS-PAGE analysis.
70
3.2.8 Gel electrophoresis
SDS polyacrylamide gel electrophoresis was performed according to
method of Laemmli on a slab gel containing 12 % running gel and 5 % stacking
gel (21 ). Vertical mini-gel apparatus (GE Healthcare, USA) was used for
electrophoretic separation of proteins. Inclusion body samples were prepared by
dissolving them in 10 % SDS solution and then adding appropriate amount of
sample buffer. Protein bands were stained with 0.1% Coomassie Brilliant Blue R-
250 in 1 0 % acetic acid and 40 % methanol solution for 20 minutes. Gels were
de-stained with 1 0 % acetic acid and 40 % methanol solution.
3.2.9 Estimation of protein concentration
Protein concentration was determined by micro BCA assay kit (Pierce,
USA) using Bovine serum albumin (BSA) as standard. Inclusion bodies were
dissolved in 2 % SDS solution for 2 hours. It was then centrifuged at 13,000 rpm
for 20 minutes to remove particulate matter and supernatants were used for
protein estimation. BSA standards (5 to 70 1-Jg/ml) were prepared in 2 % SDS
solution.
3.2.1 0 Preparation of in vitro aggregates
In vitro aggregates of recombinant hGH and asparaginase were prepared
by high pH denaturation and rapid lowering of pH of the solubilized proteins.
Human growth hormone and asparaginase IBs were solubilized in 2 M urea, 50
mM Tris-HCI, 100 mM 13-mercaptoethanol, pH 12.5 buffer for two hours at room
temperature. After this, denatured inclusion bodies were centrifuged at 13,000
rpm for 30 minutes to remove un-dissolved aggregates .. The pH of denatured IB
proteins was brought to pH 4 by adding 5 N HCI solution. Lowering of pH
resulted in formation of large aggregates. Similarly, mixed aggregates of hGH
and asparaginase inclusion bodies were prepared by denaturation of proteins in
same solubilization buffer. Densities of these aggregates were determined by
sucrose density gradient method as descried earlier. Morphologies of in vitro
aggregates were analyzed by transmission electron microscopy (TEM). Samples i
for TEM were prepared as described in 3.2.11.
71
3.2.11 Transmission electron microscopy of inclusion bodies and m
vitro aggregates
Ultra pure inclusion bodies obtained by sucrose density gradient ultra
centrifugation methods were homogenized and diluted to 1 mg/ml. 10 IJI of the
diluted samples of IBs were placed on carbon-coated copper grids and dried in a
desiccator for 30 minutes. Then grids were washed with distilled water and
stained with 2 % (w/v) uranyl acetate for 5 minutes. Similar procedures were
used for preparing the carbon grids for in vitro aggregate samples. Morphology
and refractive properties of inclusion bodies and in vitro aggregates were
analyzed under transmission electron microscope (Jeol JSM 35CF, Japan).
3.2.12 Determination of surface charge of inclusion bodies
Surface charge distribution has important role in solubility and stability of
purified inclusion body aggregates. It also reflects the ionization state of surface
molecule decorating it. The most commonly used method for determination of
charge of aggregate molecule is conductivity method. Zeta potential of inclusion
body surface was determined using Malvern Nano-Zeta sizer (Malvern Inc., USA).
Before measurement, IBs were homogenized and passed through narrow gauze
syringe to make homogeneous solution. This homogeneous solution was diluted
in 50 mM Tris-HCI buffer at pH 7.5 to the turbidity of one optical density at 350
nm and used for the measurements.
3.3 Results and discussion
3.3.1 Growth kinetics and expression of recombinant proteins
Bacterial growth in LB medium showed the typical sigmoid type of growth
pattern. E. coli growth curve consists of three distinct phases characterized by
different growth rates. These were lag phase, log or exponential phase and
stationary phase. During lag phase,. cells spent most of the time in adapting
themselves to the medium and external conditions. Generally it was of one to one
and half hour duration for the most of recombinant clones, when they were grown
in LB medium in shaker flask culture. Reasons for this long duration of lag phase
are differences in media composition of primary inoculum and fresh media
(importantly pH, nutrients composition and toxic substances) and significant
72
difference in cell density in inoculum and secondary culture. These differences
create stress responses in primary inoculum cells. After adapting to these
stresses, cells enter into active growth phase characterized by rapid cell division
and short doubling time (-25 to 30 minutes). This phase is defined as exponential
growth phase owing to logarithmic increase in cell numbers on linear time scale.
This active growth phase persists for 3.5 to 4 hours in shaker flask culture. When
all the media gets completely utilized by growing cells they enter to the stationary
phase. It also results due to accumulation of toxic materials and alteration of pH
of media.
Growth curves of E. coli cells expressing asparaginase, enolase, hGH and
Cu-Zn SOD are shown in figures 3.1 a, 3.2a, 3.3a and 3.4a respectively. It was
evident from the growth curves that induction of E. coli cells during log phase of
growth resulted in cell growth reduction. It also yielded low biomass in
comparison to un-induced culture. This could happen due to diversion of host
anabolic processes toward synthesis of recombinant proteins. Thus engagement
of cell synthetic machinery in recombinant protein expression creates scarcity of
proteins and other cellular molecules inside host cells which are required of
growth. Beside this, it also generates heat shock responses in host cells that
ultimately lowered the cell growth rate.
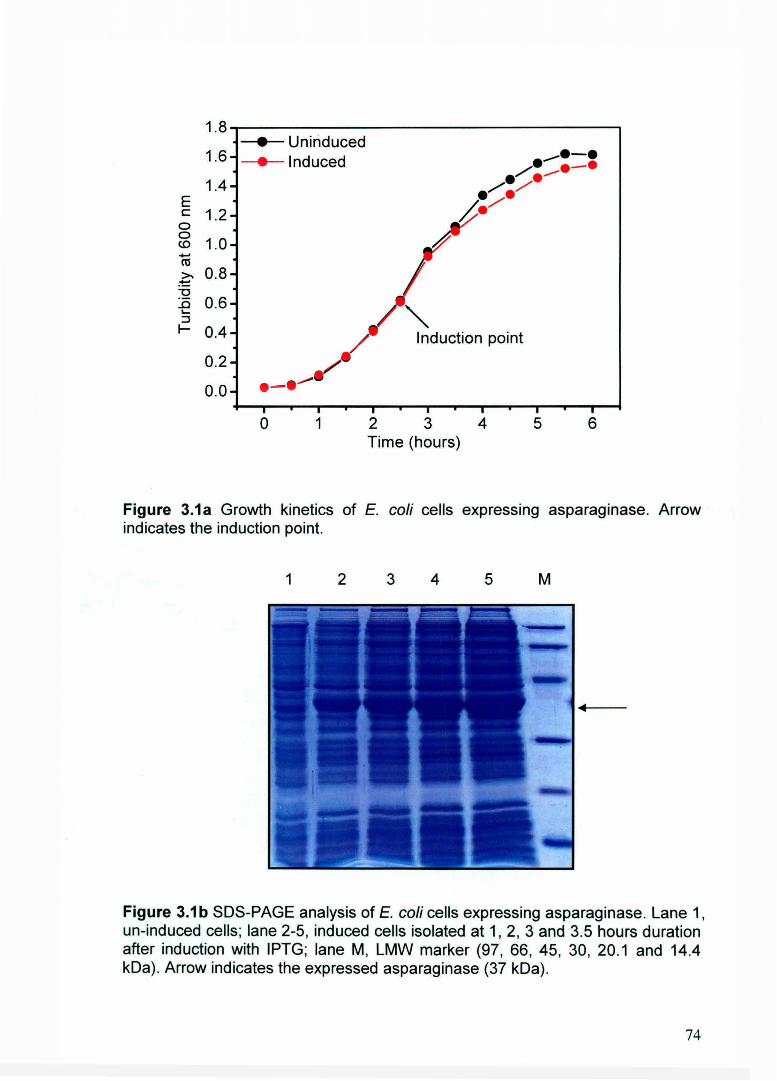
Expression of asparaginase in E. coli led to formation of inclusion bodies
(Figure 3.1 a and 3.1 b). The lag phase for asparaginase expressing E. coli was ·of
1 hour duration and log phase of approximately 5 hours duration. The optimal
concentration of inducer (IPTG) for maximum expression of asparaginase was 1
mM. There was a small but significant decrease in cell growth after induction of
culture with 1 mM IPTG (Figure 3.1 a). Expression level of asparaginase at
different time points after induction was analyzed by SDS-PAGE (Figure 3.1 b).
Equal amount biomasses were used to check the expression level on SDS-PAGE.
Recombinant asparaginase was expressed as 37 kDa protein. Expression level
of asparaginase was approximately 15 % of total cellular proteins. The maximum
turbidities of cells (at 600 nm) at the end of 6 hours culture for un-induced and
induced E. coli cells were 1.616 and 1.544 respectively. It was observed that
expression level of asparaginase got saturated between 3 to 4 hours of post
induction period (Figure 3.1 b).
73
1.8
• Uniriduced 1.6 • Induced ...........•-•
/. ·-· 1.4 /./ ............ E ./. c 1.2 / . 0
0 1.0 <D
...... ro >. 0.8
:-!:: "0 :.0 0.6 ..... :::J 1- 0.4 Induction point
0.2
0.0
0 1 2 3 4 5 6 Time (hours)
Figure 3.1a Growth kinetics of E. coli cells expressing asparaginase. Arrow indicates the induction point.
1 2 3 4 5 M
Figure 3.1 b SDS-PAGE analysis of E. coli cells expressing asparaginase. Lane 1, un-induced cells; lane 2-5, induced cells isolated at 1, 2, 3 and 3.5 hours duration after induction with IPTG; lane M, LMW marker (97, 66, 45, 30, 20.1 and 14.4 kDa) . Arrow indicates the expressed asparaginase (37 kDa) .
74
Growth and expression profiles of E. coli cells expressing enolase, hGH
and Cu-Zn SOD were analyzed (Figure 3.2 to 3.4) . They were expressed as
inclusion body aggregates. Optimal inducer (IPTG) concentration for gene
expression was 1 mM. Induction of E. coli expressing enolase led to sharp
decrease in growth rate (Figure 3.2a). The lag phase was approximately 1.5
hours and log phase of 3.5 hours. SDS-PAGE of enolase showed protein band at
of 45 kDa (Figure 3.2b). Maximum expression level of enolase was 25% of total
cellular proteins and there was substantial difference between turbidity (at 600
nm) of un-induced (1 .5) and induced (1.16) cell cultures. Human growth hormone
was expressed as 22 kDa protein band on SDS-PAGE (Figure 3.3b). Expression
level was 12-15 % of total cellular proteins. Induction of E. coli cells led to
decrease in cell growth (Figure 3.3a). Expression of hGH saturated after 3 hours
of induction. Maximum turbidities of cultures (at 600 nm) at the end of 6.75 hours
growth for un-induced and induced recombinant hGH were found 1.474 and
Figure 3.2a Growth kinetics of E. coli cells expressing r-enolase. Arrow indicates the induction point.
M 1 2 3 4 5 6 7 8 9
Figure 3.2b SDS-PAGE analysis of E. coli cells expressing r-enolase. Lane 1, un-induced cell ; lane 2-9, induced cells isolated at 30, 60, 90, 120, 150, 165, 180 and 210 minutes duration after induction with IPTG; lane M, LMW marker (97, 66, 45, 30, 20.1 and 14.4 kDa) . Arrow indicates the expressed r-enolase (45 kDa).
Figure 3.3a Growth kinetics of E. coli cells expressing r-hGH.
M 1 2 3 4 5 6 7 8 9
Figure 3.3b SDS-PAGE analysis of E. coli cells expressing r-h<;;H. Lane 1, uninduced cell ; lane 2-9, induced cells isolated at 15, 45, 75, 105, 135, 165, 195 and 225 minutes duration after induction with IPTG; lane M, LMW marker (97 , 66, 45, 30, 20.1 and 14.4 kDa). Arrow indicates the expressed r-hGH (22 kDa) .
77
1.4 • Uninduced
• Induced 1.2
E 1.0 c 0 0 0.8 <0 ...... ro
-~ 0.6 ""0 :0 0.4 Induction point ..... :::J I-
0.2
0.0
-1 0 1 2 3 4 5 6 7
Time (hours)
Figure 3.4a Growth kinetics of E. coli cells expressing r-SOD.
1 2 3 4 5 6 7 8 9 M
Figure 3.4b SDS-PAGE analysis of E. coli cells expressing r-SOD. Lane 1, uninduced cell; lane 2-9, induced cells isolated at 30, 60, 90, 120, 150, 165, 180 and 210 minutes duration after induction with IPTG; lane M, LMW marker (97, 66, 45, 30, 20.1 and 14.4 kDa). Arrow indicates the expressed r- SOD (16 kDa).
78
3.3.2 Isolation and purification of inclusion bodies from E. coli
Inclusion bodies of recombinant proteins from E. coli were harvested by
sonication and centrifugation protocols as described in methods (Flow Chart 3.1
to 3.4). Inclusion body isolation and purification protocol for all recombinant
protein were optimized with respect to pH, ionic strength and detergent
concentration. Inclusion bodies of asparaginase, enolase, hGH and Cu-Zn SOD
were isolated to maximum purity (Figure 3.5 to 3.8) . During sonication steps
significant amount of proteinaceous and non-proteinaceous impurities get
attached to the inclusion bodies. Removal of these impurities was necessary for
obtaining pure and homogeneous inclusion bodies. This was achieved using
sodium deoxycholate (DOC) detergent during sonication and washing steps.
Finally the purity level of inclusion bodies was checked by SDS-PAGE analysis.
Asparaginase inclusion bodies were isolated by sonicating the cells in pH
8.5, 50 mM Tris buffer. To remove impurities, 0.1 % DOC was used during
sonication and washing steps. Use of higher concentration (1-2 %) of DOC
resulted in solubilization of proteins from inclusion body pellet. Purified
asparaginase inClusion bodies consisted of 80 % of recombinant protein (Figure
3.5).
1 2 M 6 7 8
r-Asn
Figure 3.5 SDS-PAGE analyses of samples during asparaginase 18 purification. (a) lane 1, un-induced cell lysate; lane 2, induced cell lysate. (b) lane 1-5, pellets obtained after each step of 18 isolation; lane 6-8, supernatants obtained at 1st and 2"d sonication steps and 1st washing step; lane M, LMW marker (97, 66, 45, 30, 20.1, 14.4 kDa). Arrows indicate asparaginase inclusion bodies (37 kDa) .
79
Enolase was expressed as 45 kDa protein upon induction of E. coli cells
with IPTG (Figure 3.6a) . Isolation and purification of enolase inclusion bodies
were carried out at 50 mM Tris-HCI buffer of pH 7.5 (Flow chart 3.2) . Use of Tris
HCI buffer at pH 8.5 resulted in loss of enolase during sonication and washing
steps (Figure 3.6b). Detergents were not used in isolation process as they led to
solubilization of enolase from inclusion bodies (Figure 3.6c) .
M 1 2 M 1 2 3 4 5 ----------------~
r- Enolase
1 2 3 4 M (a) (b)
(c)
Figure 3.6 SDS-PAGE analyses of samples during enolase IB purification. (a) lane 1, un-induced cell lysate; lane 2, induced cell lysate. (b) Isolation of IBs at pH 8.5. Lane 1-4, supernatants obtained during isolation steps; lane 5, purified IBs. (c) Isolation of IBs at pH 7.5. Lane 1-3, supernatants obtained during isolation steps; lane 4, purified IBs; lane M, LMW marker (97, 66, 45, 30, 20.1 , 14.4 kDa). Arrows indicate the enolase inclusion bodies (45 kDa) .
80
E. coli cells expressing hGH were induced with 1 mM IPTG and
expression level was analyzed on SDS-PAGE (Figure 3.7a). Inclusion body of
hGH was isolated using Tris-HCI buffer of pH 8.5 consisting of 1 mg/mllysozyme
solution as described in flow chart 3.3. Use of lysozyme helped in improving the
cell lysis as well as purity of hGH inclusion bodies. Lysozyme was not used in
isolation of other inclusion bodies as it was very difficult to remove it from
inclusion bodies during washing steps. The possible reason could be its
aggregation or association with inclusion body pellets . In case of hGH, it was
removed during sonication and washing steps using 2 % deoxycholate (Figure
3.7b) . Maximum purity of hGH inclusion bodies isolated using this method was
around 90% (Figure 3.7b).
1 M 2 1 2 3 4 5 6 M
r-hGH
(a) (b)
Figure 3.7 SDS-PAGE analyses of samples during hGH IBs purification. (a) lane 1, un-induced cell lysate; lane 2, induced cell lysate. (b) Isolation of IBs at pH 8.5. Lane 1 and 3, supernatants obtained during isolation steps; lane 2, 4 and 5, IB pellets obtained at sonication steps; lane 6, purified IBs; lane M, LMW marker (97, 66, 45, 30, 20.1, 14.4 kDa). Arrows indicate hGH Inclusion bodies (22 kDa).
Tris-HCI buffer of pH 8.5 with 1 % DOC solubi lized the SOD inclusion
bodies during sonication and washing steps. Thus, Cu-Zn SOD inclusion bodies
isolation was carried out at pH 7.5 Tris-HCI buffer without detergents. There was
81
higher amount of impurities in SOD inclusion bodies in comparison to others
(Figure 3.8). The expression level and final yield of SOD was also less in
comparison to other proteins. It indicated higher expression of heat shock
proteins and toxic nature of SOD aggregates in bacterial cells.
M 1 2 3 4 5 6
r-SOD
Figure 3.8 SDS-PAGE analyses of samples during SOD 18 purification. Lane 1, un-induced cell lysate; lane 2, induced cell lysate; lane 3-5, supernatants obtained during isolation steps; lane 6, purified IBs; lane M, LMW marker (97, 66, 45, 30, 20.1, 14.4 kDa). Arrow indicates r-SOD inclusion bodies (16 kDa) .
3.3.3 Effect of induction time on cell growth and recombinant protein expression
This study was performed to find out the effect of induction at different
phases of E.coli growth on expression of recombinant proteins. E.coli culture
expressing asparaginase, enolase, hGH and SOD were induced at early, mid and
late exponential phase of growth. The turbidity of culture was recorded at 600 nm
and plotted against time to study the growth kinetics. Cells were grown for 3
hours duration after induction. Inclusion bodies were isolated from these cultures
and protein concentration was estimated to determine the yield of recombinant
proteins.
Induction of cells during early log phase resulted in sharp reduction in cell
growth in comparison to the late log phase induction. This type of pattern was
82
observed for all the recombinant clones (asparaginase, enolase, hGH and SOD).
Figures 3.9a to 3.12a show the growth kinetics of these cells. Biomass yield was
lower in case of the cells induced during early log phase (0.2-0.3 OD 600nm).
This was very prominent for E. coli culture expressing SOD. Comparative
analyses of slopes of growth curves indicated that early induction hampers the
growth of E. coli more drastically than late log phase induced culture. It could
happen due to differences in metabolic status of cells during different phases of
growth. Early log phase induction can also lead to production of heat shock
proteins in large quantity, intolerable to cells. SDS-PAGE analysis of ISs isolated
after induction of cells at different phase of growth is shown in figure 3.9b to
3.12b. ISs isolated from equal biomass of these induced cells were loaded on
SDS-PAGE. Protein concentration was estimated by micro BCA method (Table
3.2) . Results showed that yield of recombinant proteins per unit biomass was
lower for early log phase induced cell culture comparison to mid or late log phase
induced cell culture. Beside this, ISs from early log phase induced culture were
associated with more impurities in comparison to mid or log phase induced cells .
S.No. Proteins Induction points IBs per unit biomass (mglg) 1 Asparaginase 0.211 22.46
0.407 28.37 0.593 31.51 0.876 30.94
2 Enolase 0.220 36.33
0.402 41.86
0.593 42.35
0.940 41.76
3 hGH 0.230 17.23
0.365 28.68
0.651 34.51
0.815 34.39
4 Cu-Zn SOD 0.303 11.63
0.453 14.49
0.645 17.82
0.952 18.16
Table 3.2 Inclusion body protein yields from culture induced during different growth phases.
Figure 3.9a Growth kinetics of E. coli cells expressing asparaginase, induced at different phases of growth. Arrows indicate the time of induction.
M 1 2 3 4
Figure 3.9b SDS-PAGE of asparaginase IBs isolated after 3 hours of induction at different cell 00 at 600 nm. Lane 1, 0.211; lane 2, 0.407; lane 3, 0.593; lane 4, 0.876; lane M, LMW marker (97, 66, 45, 30, 20.1, 14.4 kDa) . Arrow indicates rasparaginase (37 kDa).
Figure 3.10a Growth kinetics of E. coli cells expressing enolase, induced at different phases of growth. Arrows indicate time of induction.
M 1 2 3 4
Figure 3.10b SOS-PAGE of enolase ISs isolated after 3 hours of induction at different cell 00 at 600 nm. Lane 1, 0.220; lane 2, 0.402; lane 3, 0.593; lane 4, 0.940; lane M, LMW marker (97, 66, 45, 30, 20.1, 14.4 kOa). Arrow indicates the r-enolase (45 kDa).
Figure 3.11 a Growth kinetics of E. coli cells expressing enolase, induced at different phases of growth. Arrows indicate the time of induction.
M 1 2 3 4
Figure 3.11 b SDS-PAGE of hGH ISs isolated after 3 hours of induction at different cell OD at 600 nm. Lane 1, 0.23; lane 2, 0.365; lane 3, 0.651 ; lane 4, 0.815; lane M, LMW marker (97, 66, 45, 30, 20.1 , 14.4 kOa) . Arrow indicates the r-hGH (22 kDa) .
86
1.6 Cell density at Induction
1.4 points( arrows)
• Uninduced 1.2 .. O.D (0.303)
E c 1.0 ~O. D (0.453)
0 -o- O.D (0.645) 0 0.8 CD • O.D (0.952) ....
ro >-~
0.6 ""0 :.0 ..... 0.4 :::J I- 0.2
0.0
-0 .2+---~~~~~-T~~~~~~~~~~~
-1 0 1 2 3 4 5 6 7 Time (hours)
Figure 3.12a Growth kinetics of E. coli cells expressing r-SOD, induced at different phases of growth. Arrows indicate time of induction.
1 2 3 4 M
Figure 3.12b SDS-PAGE of r-SOD IBs isolated after 3 hours duration of induction at different cell OD at 600 nm. Lane 1, 0.303; lane 2, 0.453; lane 3, 0.645; lane 4, 0.952; lane M, LMW marker (97, 66, 45, 30, 20.1 , 14.4 kDa). Arrow indicates the r-SOD. Arrow indicates r-SOD (16 kDa).
87
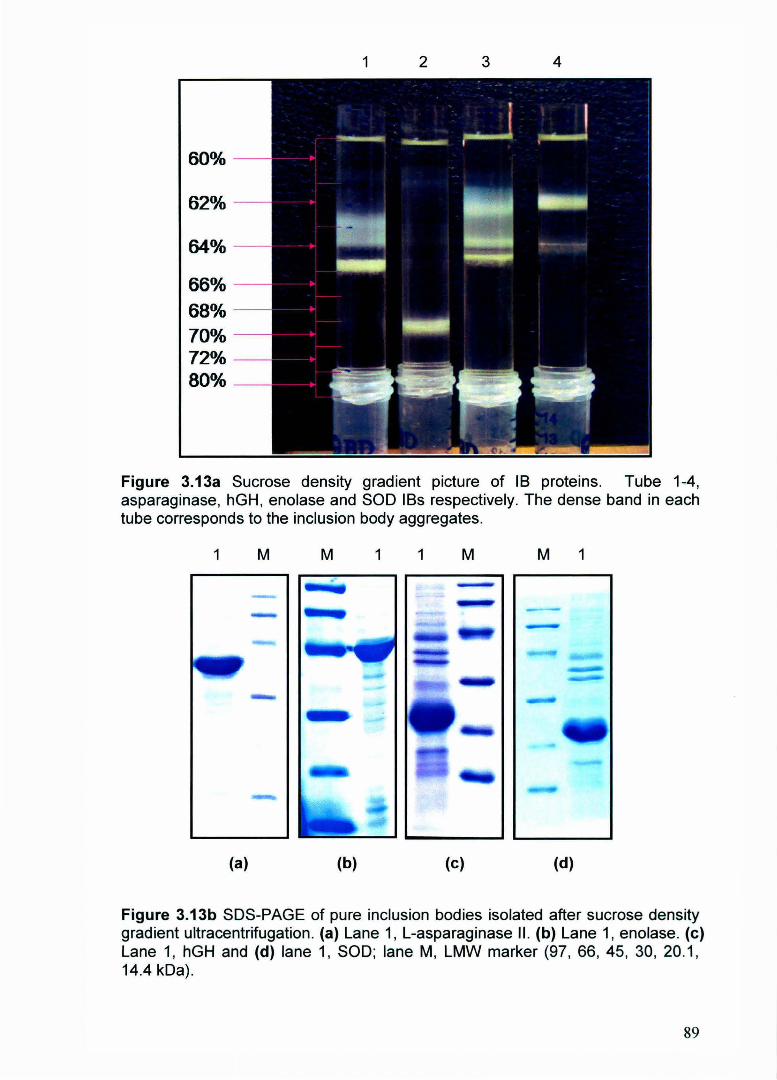
3.3.4 Purification of inclusion bodies by sucrose density gradient ultracentrifugation
Though sonication and detergent based washing methods yielded
enriched IBs mostly consisting of recombinant proteins, in certain cases it retains
some membranous and cellular proteins released during sonication. These
loosely attached impurities on IB surface can be separated using density gradient
method; as they have lower density than inclusion body aggregates. All the
recombinant protein IBs (asparaginase, enolase, hGH and SOD) were purified
using sucrose density gradient ultracentrifugation methods (Figure 3.13). Density
gradient pattern for asparaginase, enolase, hGH and SOD IBs were different.
Densities of these IBs were calculated by determining the density of sucrose
solutions in the regions where IBs bands were present. The asparaginase IBs
showed one distinct band of density 1.315 g/ml and another dispersed band with
density between 1.31 to 1.29 g/ml. The density of hGH IBs was maximum (1.347
g/ml). Enolase IBs showed dispersed band of density range 1.305 to 1.286 g/ml.
While SOD IBs showed homogeneous nature with sharp distinct band in sucrose
density tube and had density of 1.29 g/ml. Thus, asparaginase and enolase IBs
consist of heterogeneous mixture of different sized and density aggregates while
nature of hGH and SOD inclusion body aggregates were quite homogeneous.
Membranous impurities were present on the top of gradient tube owing to lower
density. The order of densities of different inclusion body aggregates were hGH >
Asparaginase> Enolase> SOD (Figure 3.13a). SDS-PAGE of purified IBs was
carried out to check the purity (Figure 3.13b).
From SDS-PAGE analysis, it was evident that sucrose density gradient
ultracentrifugation helped in removing the impurities attached to IBs surfaces and
other protein aggregates. Removal of impurities was better for asparaginase,
enolase and SOD inclusion body samples. As the IB samples loaded on the
gradient tubes were isolated by single steps sonication without detergent and
washing steps, there were large amount of impurities present on them. However,
if the inclusion bodies were isolated by methods described in flow charts, then
sucrose density gradient method can further improve the purity of inclusion
bodies.
88
60%
62%
64%
66% 68% 70% 72% 80%
1 2 3 4
Figure 3.13a Sucrose density gradient picture of 18 proteins. Tube 1-4, asparaginase, hGH, enolase and SOD IBs respectively. The dense band in each tube corresponds to the inclusion body aggregates.
1 M M 1 1 M M 1
(a) (b) (c) (d)
Figure 3.13b SDS-PAGE of pure inclusion bodies isolated after sucrose density gradient ultracentrifugation. (a) Lane 1, L-asparaginase II. (b) Lane 1, enolase. (c) Lane 1, hGH and (d) lane 1, SOD; lane M, LMW marker (97, 66, 45, 30, 20.1, 14.4 kDa).
89
3.3.5 Electron microscopy and surface charge analysis of inclusion bodies
The size and refractive properties of pure inclusion bodies of asparaginase,
enolase, hGH and SOD, purified by sucrose density gradient ultracentrifugation
methods were studied by transmission electron microscopy (Figure 3.14 to 3.15).
Asparaginase inclusion bodies were less refractive and of smaller size (100-200
nm). They were ovoid and circular in shapes with extended appearance (Figure
3.14a). TEM of enolase inclusion bodies showed their dense refractivity and size
in range of 0.6 to 0.8 IJm. (Figure 3.14b). The size of hGH inclusion bodies were
approximately 0.6-0.9 1-1m (Figure 3.14 c and d).
(a)
Dr P•nd•-Ar<ln U.lJO.tlf ......
(b)
Figure 3.14 Transmission electron micrograph of recombinant protein inclusion bodies. (a) Asparaginase. (b) r- Enolase. (c) and (d) hGH inclusion bodies.
90
The SOD inclusion bodies were strongly refractive under electron beam
and had size in 0.6 to 0.9 1Jm range (Figure 3.15a and 3.15b). TEM of fixed E.
coli cells producing recombinant proteins showed the presence of two IBs at the
poles of bacterial cells (Figure 3.15 c and d)). Generally, they showed
heterogeneity in sizes and shapes, but most of them were circular and ovoid.
(a) (b)
(c) (d)
Figure 3.15 Transmission electron micrograph of recombinant SOD IBs and E. coli cells expressing hGH as IBs. (a) and (b) Cu-Zn SOD inclusion bodies. (c) and (d) E. coli cells showing dense black regions at poles of cells. IBs can be seen at poles in dividing cells (arrow).
91
Surface potential of asparaginase, enolase, hGH and SOD IBs were determined
by zeta nano-sizer Malvern, UK. It was observed that all IBs proteins had net
negative potential. There were slight differences in their surface potential.
Thus from electron microscopy and surface potential studies of IBs, it was
evident that IBs are dense refractive aggregates with negative surface potential.
They were mostly ovoid or circular in shapes. Generally, the IBs occupied the
bacterial cytoplasm, mostly at the poles.
93
3.3.6 Specificity of in vitro aggregation of recombinant proteins
It was observed from sucrose density gradient study that density of hGH
IBs was higher than asparaginase IBs (Figure 3.13a). To study whether their in
vitro aggregates were also of similar nature, aggregates of hGH and
asparaginase were made by solubilizing their IBs at high pH condition and
aggregating them by rapid change of pH. Mixed aggregates of hGH and
asparaginase were also made to understand the specificity of aggregation. All the
in vitro aggregates were analyzes by density gradient ultracentrifugation. It was
observed that densities of in vitro aggregates (Figure 3.17) were higher than their
IBs aggregates (Figure 3.13a). Also, the density of mixed aggregate was in
between of their individual densities. Thus, it indicated that in vitro aggregation is
non-specific in nature. Further studies are required to validate it. However, recent
study by Maji et a/. suggests similar behavior for in vivo aggregation (22) .
Transmission electron micrograph revealed their irregular morphology and
refractivity (Figure 3.18a to 3.18c). It could be due to differences in unfolded
intermediates formed during in vitro denaturation and in vivo misfolding.
60%
62% - ----+
64%--- --+
66%--- --+ 68% - ---70% -----72%--- -80%--- -
2 3
~ ~ I . . -~ I
. . ~.--.... Figure 3.18 Sucrose density gradient ultracentrifugation of in vitro aggregates. Tube 1, hGH; tube 2, hGH + asparaginase mixed aggregates; tube 3, asparaginase.
94
(a) (b)
(c)
Figure 3.19 Transmission electron micrograph of in vitro aggregates of solubilized inclusion body proteins. (a) hGH in vitro aggregates (b) asparaginase in vitro aggregate and (c) mixed in vitro aggregates of hGH and asparaginase proteins.
95
3.4 Conclusions
From this study, the following conclusions were drawn about inclusion
body proteins:
1. Expression of recombinant proteins in E. coli as inclusion bodies resulted in
reduction in cell growth.
2. Induction of culture in early log phase brought sharp reduction in cell
growth in comparison to late mid or late log phase induced culture.
Specific protein yield (protein/unit cell biomass) was low when cells were
induced at early log phase.
3. Induction time plays major role in regulating the expression level and yield
of recombinant protein. Duration of lag phase was different for various
recombinant clones.
4. Use of optimal pH buffers and detergent concentration during isolation
process improved the yield and purity of ISs.
5. Buffers of pH higher than 7.5 led to the loss of recombinant asparaginase,
enolase and SOD from inclusion bodies.
6. Lysozyme treatment of E. coli cells during sonication helped in enhancing
the purity of hGH ISs.
7. Use of 1 % deoxycholate (DOC) during sonication and washing steps
resulted in loss of recombinant asparaginase, enolase and SOD proteins
from inclusion bodies.
8. Purification of inclusion bodies by sucrose density gradient
ultracentrifugation improved its purity and quality.
9. Inclusion bodies of different proteins were ovoid or circular in shape with
varying sizes (0.2 to 1.0 1-1m) and densities (1.28 to 1.35 g/ml).
10. Surface potential analysis revealed that inclusion body aggregates are
negatively charged.
11. Different proteins co-aggregated during in vitro aggregation. The
morphologies of in vitro aggregates were different than those of IBs (in
vivo aggregates).
96
3.5 References
1. Williams DC, Van Frank RM, Muth WL, Burnett JP. 1982. Cytoplasmic
inclusion bodies in Escher,ichia coli producing biosynthetic human insulin
proteins. Science 215:687-9
2. Chrunyk BA, Evans J, Lillquist J, Young P, Wetzel R. 1993. Inclusion body
formation and protein stability in sequence variants of interleukin-1 beta. J.
Bioi. Chern. 268:18053-61
3. Taylor G, Hoare M, Gray DR, Marston FAO. 1986. Size and density of
protein inclusion bodies. Bioffechnology 4:553-7
4. Georgiou G, Valax P. 1999. Isolating inclusion bodies from bacteria.
Methods Enzymol. 309:48-58
5. Studier FW, Rosenberg AH, Dunn JJ, Dubendorff JW. 1990. Use of T7
RNA polymerase to direct expression of cloned genes. Methods Enzymol.
185:60-89
6. Lost I, Guillerez J, Dreyfus M. 1992. Bacteriophage T7 RNA polymerase
travels far ahead of ribosomes in vivo. J. Bacterial. 174:619-22
7. Schmid D, Baici A, Gehring H, Christen P. 1994. Kinetics of molecular
chaperone action. Science 263:971-3
8. van den BB, Ellis RJ, Dobson CM. 1999. Effects of macromolecular
crowding on protein folding and aggregation. EMBO J. 18:6927-33
9. Schein CH. 1993. Solubility and secretability. Curr. Opin. Biotechnol.
4:456-61
10. Choi JH, Jeong KJ, Kim SC, Lee SY. 2000. Efficient secretory production
of alkaline phosphatase by high cell density culture of recombinant
Escherichia coli using the Bacillus sp. endoxylanase signal sequence.
Appl. Microbial. Biotechnol. 53:640-5
11. Kopetzki E, Schumacher G, Buckel P. 1989. Control of formation of active
soluble or inactive insoluble baker's yeast alpha-glucosidase PI in
Escherichia coli by induction and growth conditions. Mol. Gen. Genet.
216:149-55
97
12. Fahnert 8, Lilie H, Neubauer P. 2004. Inclusion bodies: formation and


![Isolation, Partial Purification and Characterization of ... · Isolation and purification of lectins may be done through a variety of protein purification methods [24]-[33]. Methods](https://static.documents.pub/doc/80x56/5f54b2510bf11f58165072ba/isolation-partial-purification-and-characterization-of-isolation-and-purification.jpg)
