Page 1
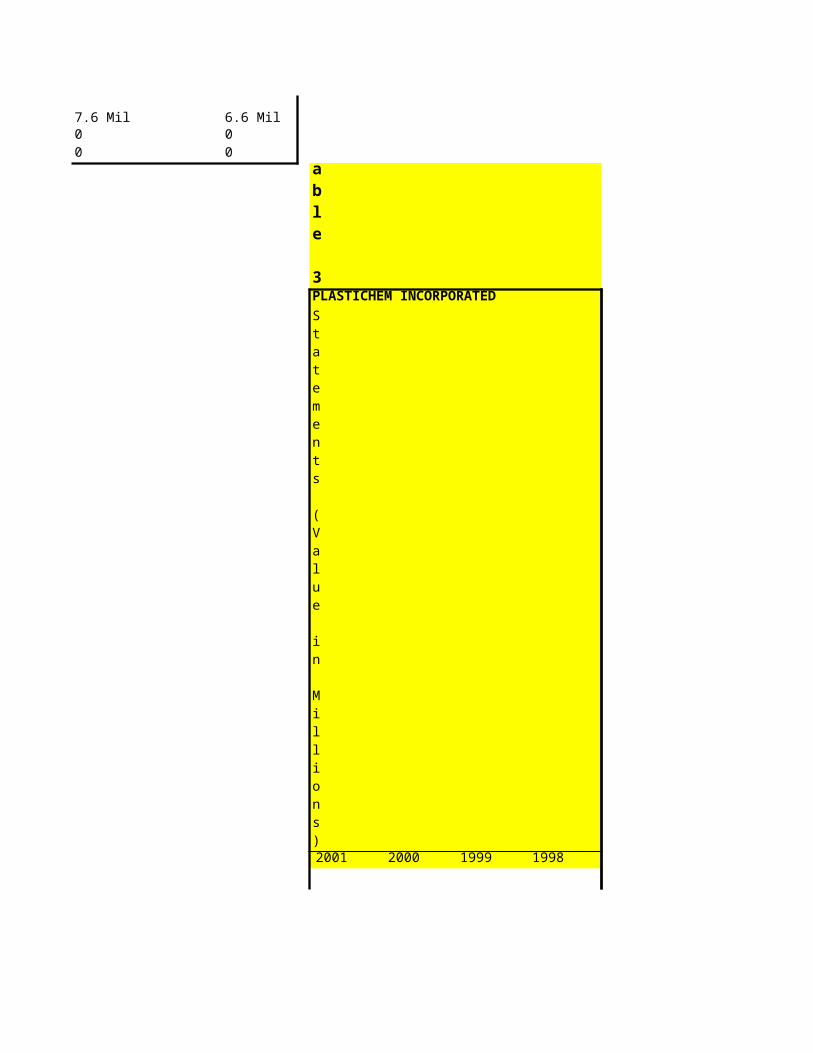
Table 1PLASTICHEM INCORPORATED
2001% 2001 2000% 2000 1999% 1999
ASSETS
Current Assets
Cash and marketable securities 1.2% 3.2 1.4% 4.8 1.5% 5
Accounts receivable 17.3% 46.1 17.3% 59.6 14.7% 50.1
Inventory 10.3% 27.4 7.0% 24.1 7.4% 25.3
Other Current assets 1.5% 4.1 2.2% 7.6 2.0% 6.9
Total Current Assets 30.4% 80.8 27.9% 96.1 25.7% 87.3
Non-Current Assets
Property, Plant & Equipment, Gross 35.4% 94.2 28.7% 98.7 25.9% 87.9
14.4% 38.3 9.1% 31.4 8.1% 27.7
Property, Plant & Equipment, Net 21.0% 55.9 19.6% 67.3 17.7% 60.2
Intangibles 45.7% 121.4 50.1% 172.2 53.5% 182
Other Non-Current Assets 2.9% 7.7 2.4% 8.3 3.1% 10.5
Total Non-Current Assets 69.6% 185 72.1% 247.8 74.3% 252.7
Total Assets 100.0% 265.8 100.0% 343.9 100.0% 340
LIABILITIES AND EQUITIES
Current Liabilities 0.0% 0.0%
Accounts payable 7.7% 20.5 6.9% 23.8 6.0% 20.5
Short Term Debt 6.6 1.6% 5.6 1.0% 3.5
Other current Liabilities 35 9.8% 33.7 10.5% 35.7
Total Current liabilities 23.4% 62.1 18.3% 63.1 17.6% 59.7
Non-Current liabilities
Long-term debt 81.0% 215.2 64.4% 221.3 65.4% 222.3
Deferred Income Taxes 0.0% 0 0.0% 0 0.0% 0
Other Non-Current Liabilities 1.1% 3 0.8% 2.9 0.0% 0
Minority Interest 0.0% 0 0.0% 0 0.0% 0
Total Non-Current Liabilities 82.1% 218.2 65.2% 224.2 65.4% 222.3
Total Liabilities 105.5% 280.3 83.5% 287.3 82.9% 282
0.0% 0.0% 0.0%
Shareholder's Equity 0.0% 0.0% 0.0%
Preferred Stock Equity 0.0% 0 0.0% 0 0.0% 0
Common Stock Equity -5.5% -14.5 16.5% 56.6 17.1% 58
Total equity -5.5% -14.5 16.5% 56.6 17.1% 58
100.0% 265.8 343.9 3400.0%
Annual Balance Sheets (Values in millions)
Accumulated depreciation & Depletion
Total liabilities and Stock Equity
Page 2
7.7 Mil 7.6 MilPreferred Shares 0 0 0Treasury Shares 0 0 0
Total Common Shares outstanding
7.2 Mil
Page 3
Plastichem - Ratio Analysis2001 2000 1999
Current Ratio 1.30 1.52 1.46Quick Ratio 0.86 1.14 1.04Cash Ratio 0.05 0.08 0.08Total Debt Ratio 1.05 0.84 0.83Debt-Equity Ratio -19.12 5.02 4.86Equity Multiplier -18.33 6.08 5.86Times Interest Ratio 0.76 1.91 1.96Cash Coverage Ratio 1.58 2.71 2.90Inventory Turnover ratio 8.11 7.66 6.32Day's sales in Inventory 45.01 47.68 57.72Receivables Turnover 6.44 4.93 5.04ACP or Days' Sales in Receivables 56.65 73.99 72.45Total Asset Turnover 1.12 0.85 0.74Capital Intensity 0.89 1.17 1.35Profit Margin -24.07% 0.68% 1.47%ROA -26.90% 0.58% 1.09%ROE NMF 3.53% 6.38%
Plastichem DCM2001 2001
Current Ratio 1.30 1.63Quick Ratio 0.86 0.99Cash Ratio 0.05 0.01Total Debt Ratio 1.05 0.54Debt-Equity Ratio -19.12 1.12Equity Multiplier -18.33 2.19Times Interest Ratio 0.76 4.67Cash Coverage Ratio 1.58 6.57Inventory Turnover ratio 8.11 6.40Day's sales in Inventory 45.01 57.00Receivables Turnover 6.44 6.91
Page 4
Days' Sales in Receivables 56.65 52.86Total Asset Turnover 1.12 1.37Capital Intensity 0.89 0.73Profit Margin -24% 5.91%ROA -27% 8.10%ROE NMF 17.76%
Page 5
PLASTICHEM INCORPORATED
1998% 1998
0.6% 0.6
21.0% 20.9
12.9% 12.8
0.4% 0.4
34.9% 34.7
48.0% 47.7
19.4% 19.3
28.6% 28.4
33.0% 32.8
3.5% 3.5 65.1% 64.7
100.0% 99.4
0.0%
9.8% 9.7
3.9% 3.9
13.0% 12.9
26.7% 26.5
30.9% 30.7
0.0% 0
0.0% 0
0.0% 0
30.9% 30.7
57.5% 57.2
0.0%
0.0%
0.0% 0
42.5% 42.2
42.5% 42.2
99.4
Page 6
6.6 Mil00
PLASTICHEM INCORPORATED
2001 2000 1999 1998
Table 3
Annual Income Statements (Value i
Page 7
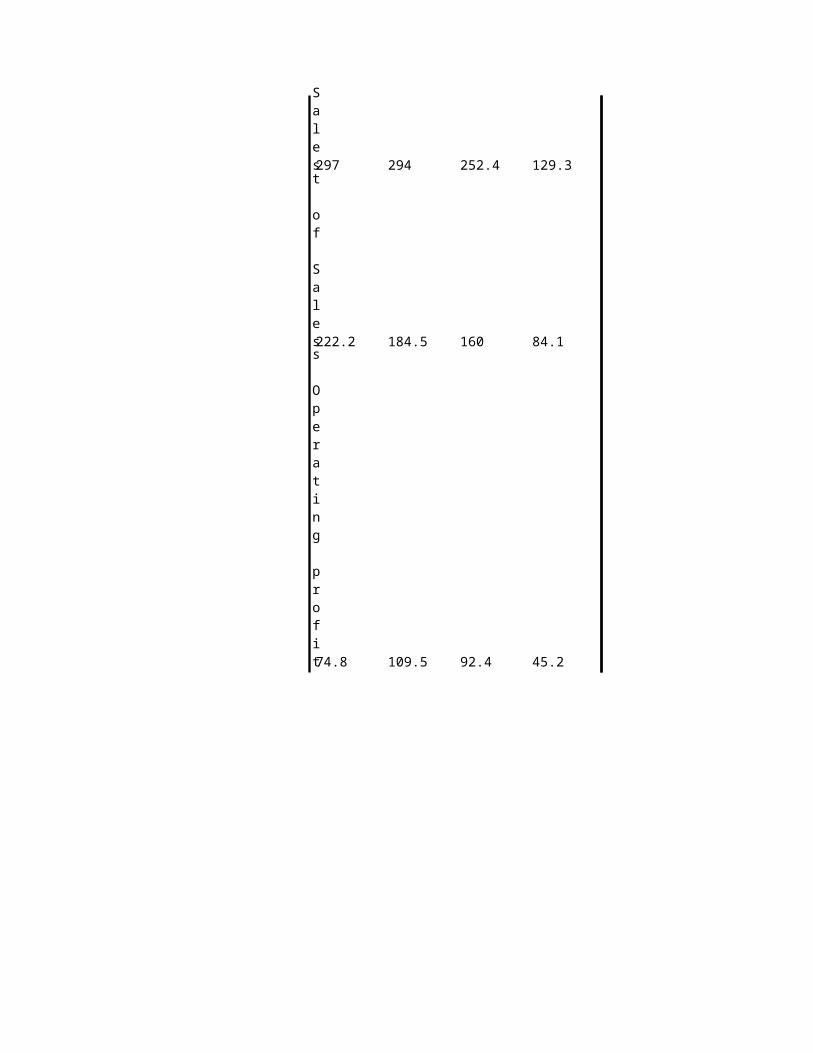
297 294 252.4 129.3
222.2 184.5 160 84.1
74.8 109.5 92.4 45.2
SalesCost of SaleGross Operating profi
Page 8
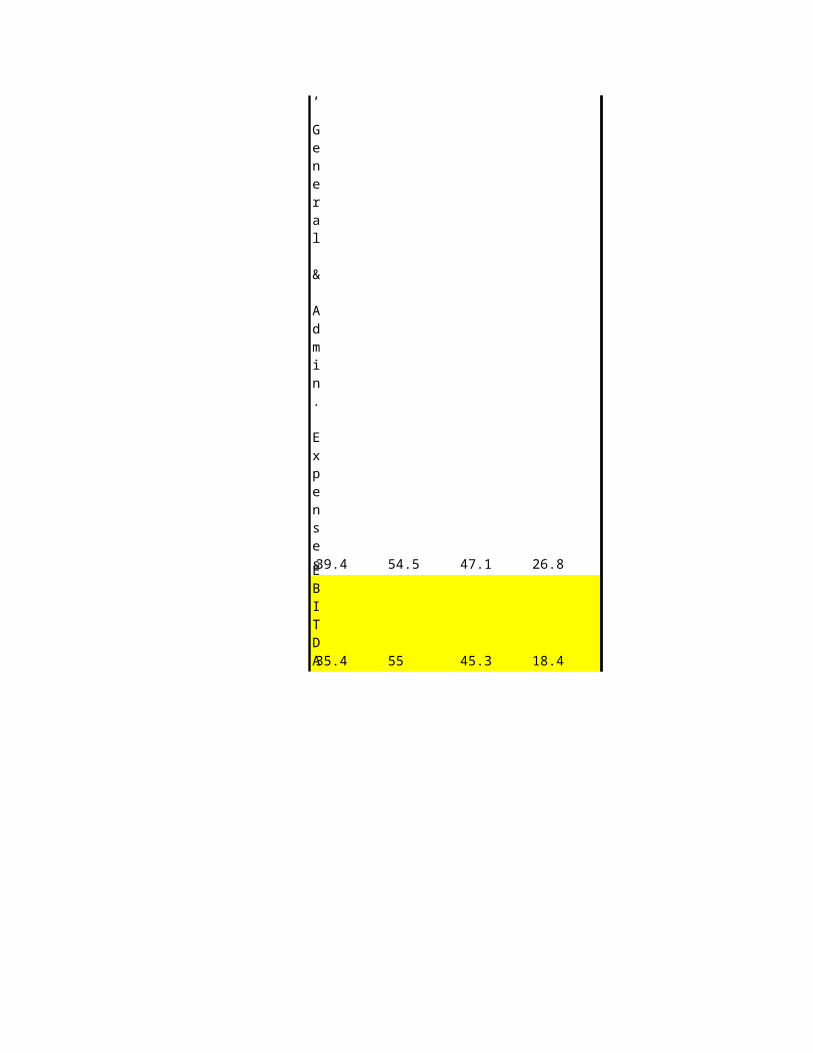
39.4 54.5 47.1 26.8
35.4 55 45.3 18.4
Selling, General & Admin. ExpenEBITDA
Page 9
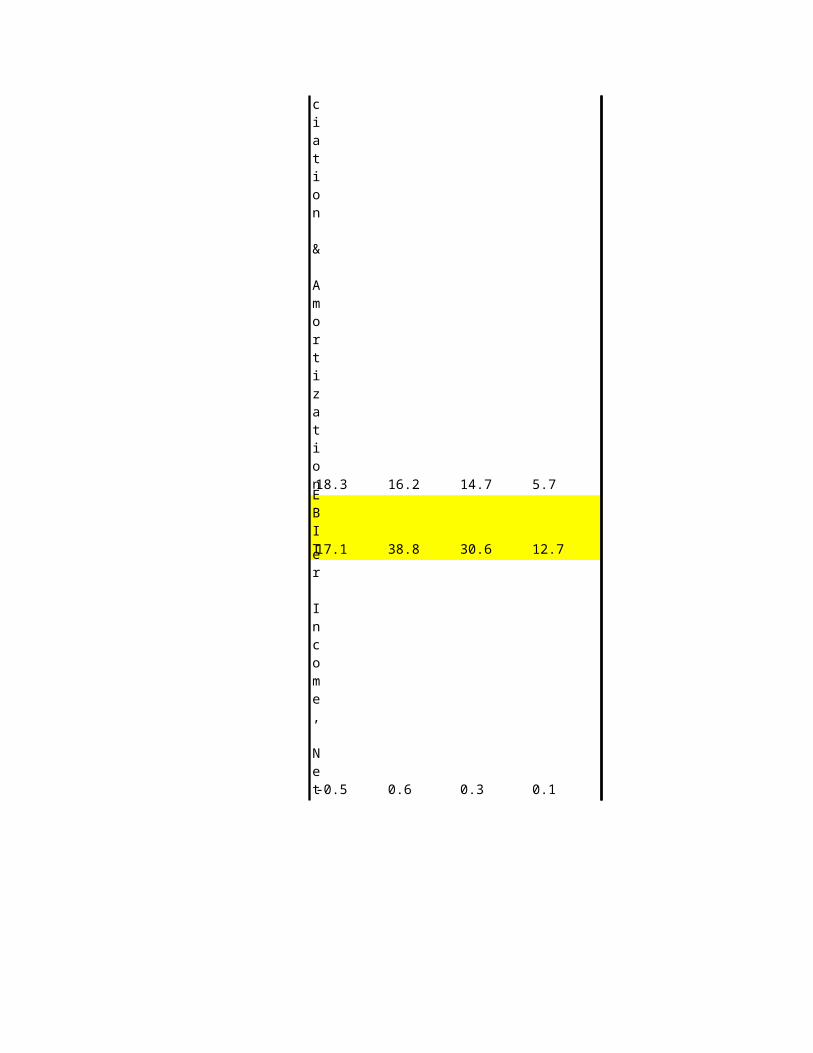
18.3 16.2 14.7 5.7
17.1 38.8 30.6 12.7
-0.5 0.6 0.3 0.1
Depreciation & AmortizatioEBITOther Income, Ne
Page 10
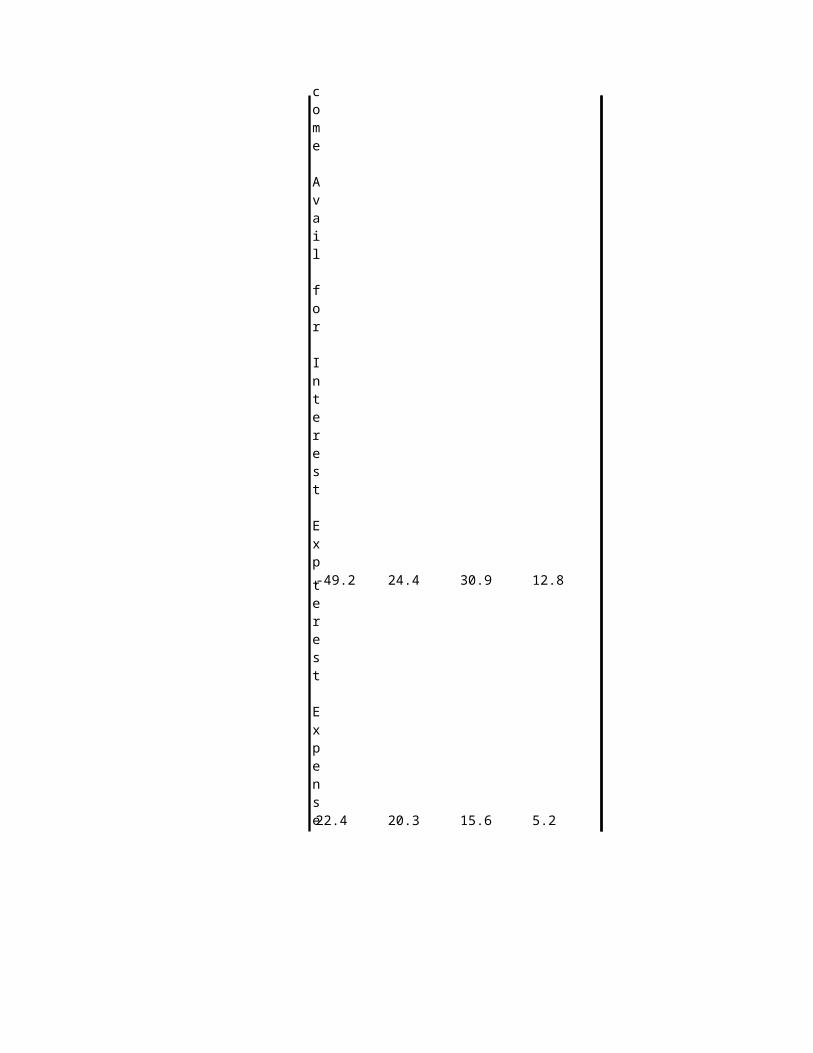
-49.2 24.4 30.9 12.8
22.4 20.3 15.6 5.2
Total Income Avail for Interest Interest Expense
Page 11
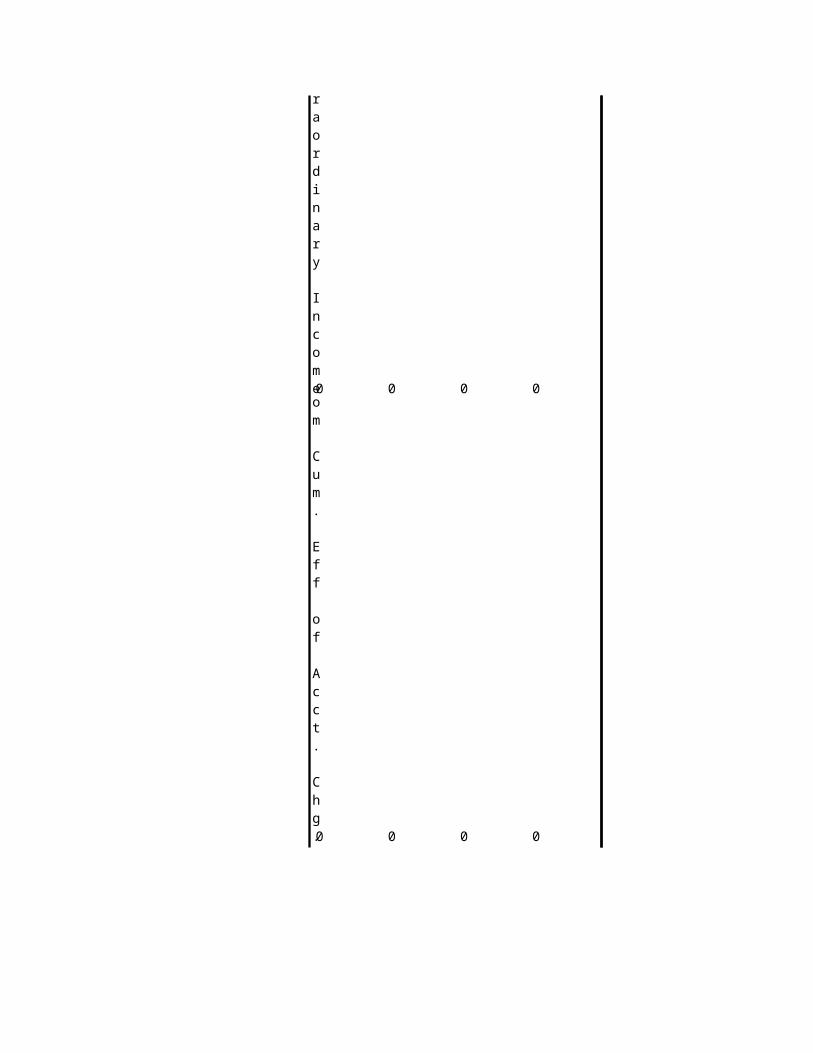
0 0 0 0
-71.6 4.1 15.3 7.6
0.1 2.1 6.6 0.3
Minority InterestPre-Tax IncomeIncome Taxes
Page 12
-65.8 -15 0 0
Net Income from Cont.Operations-71.5 2 8.8 7.3
0 0 0 0
Special Income/Charges
Net Income from Discont. Ope
Page 13
-71.5 2 8.8 7.3
-5.7 17 8.8 7.3
Net Income from Total Operati
Normalized Income
Page 14
0 0 0 0
0 0 0 0
Extraordinary IncomeIncome from Cum. Eff of Acct.
Page 15
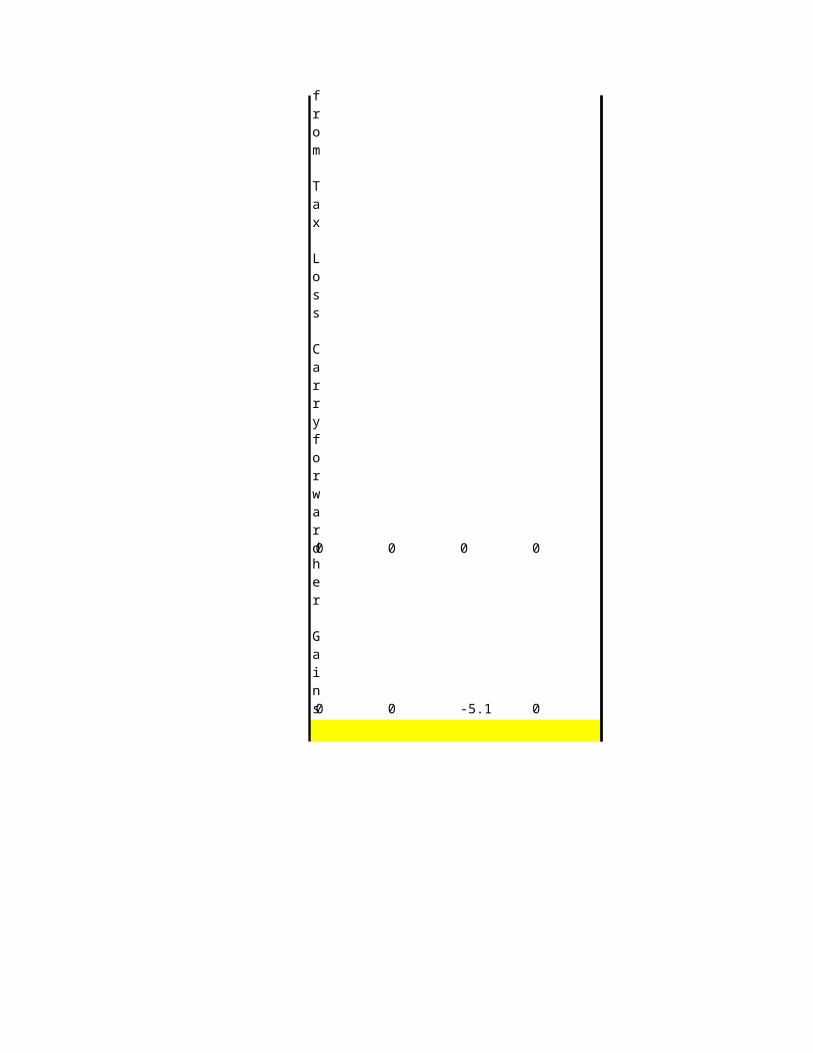
0 0 0 0
0 0 -5.1 0
Income from Tax Loss Carryforw
Other Gain
Page 16
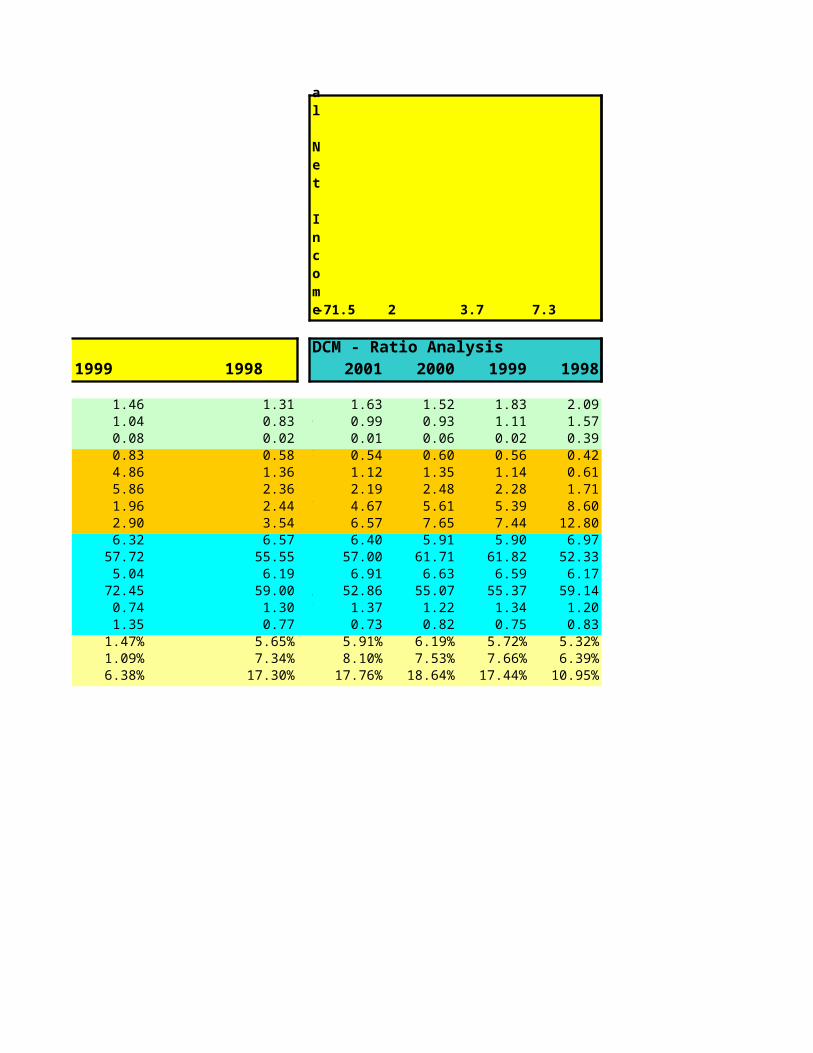
-71.5 2 3.7 7.3
DCM - Ratio Analysis1998 2001 2000 1999 1998
1.31 Current Ratio1.63 1.52 1.83 2.090.83 Quick Ratio0.99 0.93 1.11 1.570.02 Cash Ratio0.01 0.06 0.02 0.390.58 Total Debt Ratio0.54 0.60 0.56 0.421.36 Debt-Equity Ratio1.12 1.35 1.14 0.612.36 Equity Multiplier2.19 2.48 2.28 1.712.44 Times Interest Ratio4.67 5.61 5.39 8.603.54 Cash Coverage Ratio6.57 7.65 7.44 12.806.57 Inventory Turnover ratio6.40 5.91 5.90 6.97
55.55 Day's sales in Inventory57.00 61.71 61.82 52.336.19 Receivables Turnover6.91 6.63 6.59 6.17
59.00 ACP or Days' Sales in Receivables52.86 55.07 55.37 59.141.30 Total Asset Turnover1.37 1.22 1.34 1.200.77 Capital Intensity 0.73 0.82 0.75 0.83
5.65% Profit Margin5.91% 6.19% 5.72% 5.32%7.34% ROA8.10% 7.53% 7.66% 6.39%
17.30% ROE17.76% 18.64% 17.44% 10.95%
Total Net Incom
Page 17
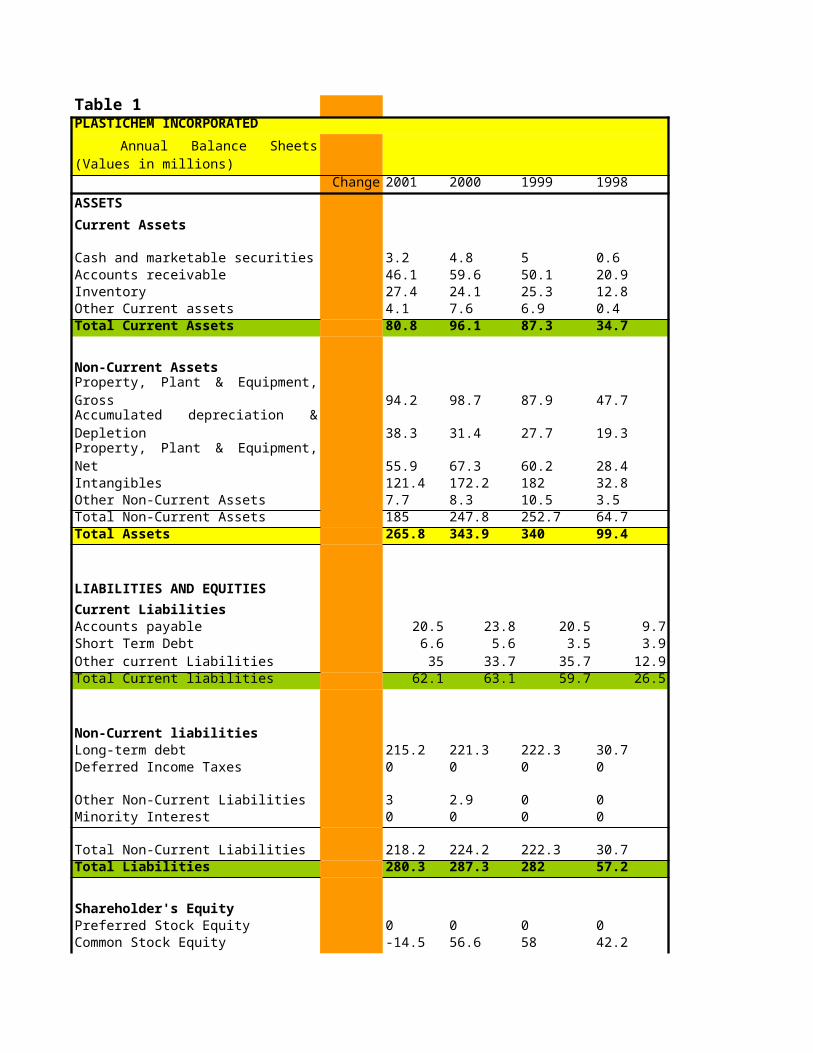
Table 1PLASTICHEM INCORPORATED
Change 2001 2000 1999 1998
ASSETS
Current Assets
3.2 4.8 5 0.6Accounts receivable 46.1 59.6 50.1 20.9Inventory 27.4 24.1 25.3 12.8Other Current assets 4.1 7.6 6.9 0.4Total Current Assets 80.8 96.1 87.3 34.7
Non-Current Assets
94.2 98.7 87.9 47.7
38.3 31.4 27.7 19.3
55.9 67.3 60.2 28.4Intangibles 121.4 172.2 182 32.8Other Non-Current Assets 7.7 8.3 10.5 3.5Total Non-Current Assets 185 247.8 252.7 64.7Total Assets 265.8 343.9 340 99.4
LIABILITIES AND EQUITIES
Current LiabilitiesAccounts payable 20.5 23.8 20.5 9.7Short Term Debt 6.6 5.6 3.5 3.9Other current Liabilities 35 33.7 35.7 12.9Total Current liabilities 62.1 63.1 59.7 26.5
Non-Current liabilitiesLong-term debt 215.2 221.3 222.3 30.7Deferred Income Taxes 0 0 0 0
3 2.9 0 0Minority Interest 0 0 0 0
218.2 224.2 222.3 30.7Total Liabilities 280.3 287.3 282 57.2
Shareholder's EquityPreferred Stock Equity 0 0 0 0Common Stock Equity -14.5 56.6 58 42.2
Annual Balance Sheets (Values in millions)
Cash and marketable securities
Property, Plant & Equipment, GrossAccumulated depreciation & DepletionProperty, Plant & Equipment, Net
Other Non-Current Liabilities
Total Non-Current Liabilities
Page 18
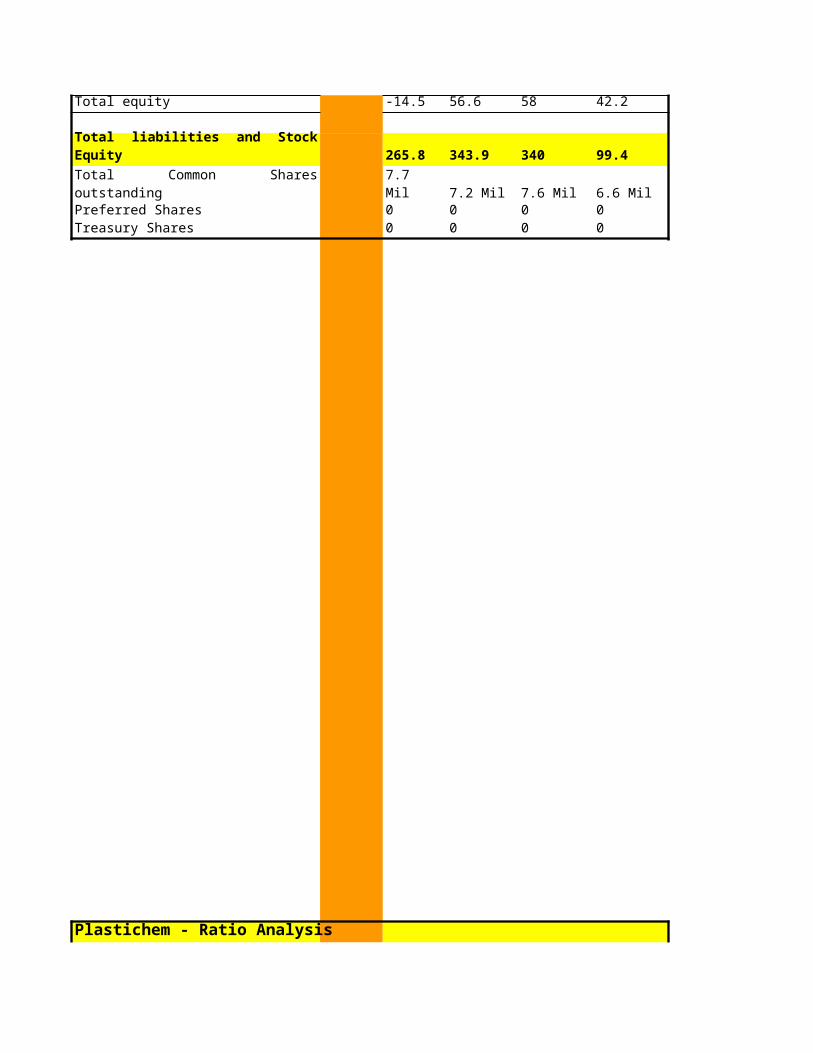
Total equity -14.5 56.6 58 42.2
265.8 343.9 340 99.4
7.2 Mil 7.6 Mil 6.6 MilPreferred Shares 0 0 0 0Treasury Shares 0 0 0 0
Plastichem - Ratio Analysis
Total liabilities and Stock Equity
Total Common Shares outstanding
7.7 Mil
Page 19
2001 2000 1999 1998
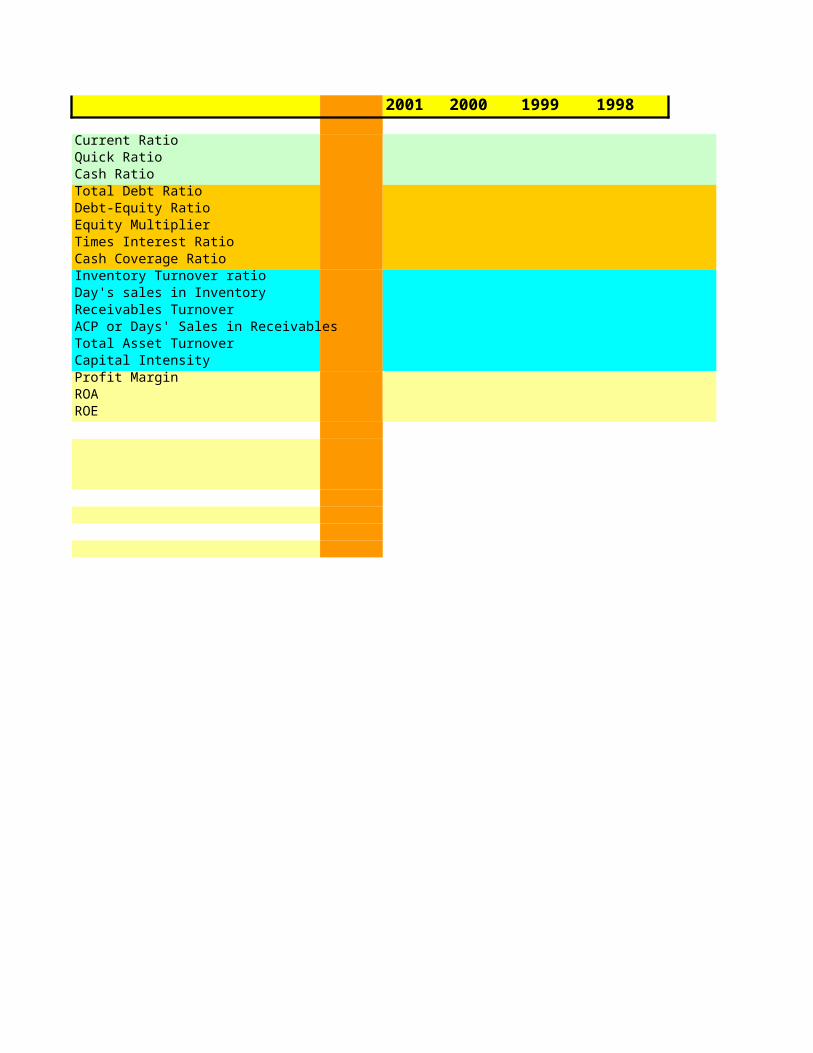
Current Ratio Quick RatioCash RatioTotal Debt RatioDebt-Equity RatioEquity MultiplierTimes Interest RatioCash Coverage RatioInventory Turnover ratioDay's sales in InventoryReceivables TurnoverACP or Days' Sales in ReceivablesTotal Asset TurnoverCapital Intensity Profit MarginROAROE
Page 20
EBIT 17.1Dep 18.3Taxes 0.1OCF 35.3End NFA 55.9
Begin NFA 67.3
Dep 18.3
NCS 6.9
Ending NWC 18.7
Begin NWC 33Change in NWC -14.3CFA 42.7 Int Paid 22.4New Debt -6
CFB 28.4
Dividends Paid 0
New Equity -71.1CFS 71.1
CFB+CFS -42.7
Net New Equity #REF!
Page 21
Table 3PLASTICHEM INCORPORATED
2001 2000 1999 1998
Sales 297 294 252.4 129.3Cost of Sales 222.2 184.5 160 84.1Gross Operating profit 74.8 109.5 92.4 45.2
39.4 54.5 47.1 26.8EBITDA 35.4 55 45.3 18.4Depreciation & Amortization 18.3 16.2 14.7 5.7EBIT 17.1 38.8 30.6 12.7Other Income, Net -0.5 0.6 0.3 0.1
-49.2 24.4 30.9 12.8Interest Expense 22.4 20.3 15.6 5.2Minority Interest 0 0 0 0Pre-Tax Income -71.6 4.1 15.3 7.6Income Taxes 0.1 2.1 6.6 0.3
Special Income/Charges -65.8 -15 0 0
Net Income from Cont.Operations -71.5 2 8.8 7.3Net Income from Discont. Opers. 0 0 0 0
Net Income from Total Operations -71.5 2 8.8 7.3
Normalized Income -5.7 17 8.8 7.3Extraordinary Income 0 0 0 0
0 0 0 0
Income from Tax Loss Carryforward 0 0 0 0Other Gains 0 0 -5.1 0
Total Net Income -71.5 2 3.7 7.3
DCM - Ratio Analysis
Annual Income Statements (Value in Millions)
Selling, General & Admin. Expenses
Total Income Avail for Interest Exp.
Income from Cum. Eff of Acct. Chg.
Page 22
2001 2000 1999 1998
Current RatioQuick RatioCash RatioTotal Debt RatioDebt-Equity RatioEquity MultiplierTimes Interest RatioCash Coverage RatioInventory Turnover ratioDay's sales in InventoryReceivables TurnoverACP or Days' Sales in ReceivablesTotal Asset TurnoverCapital Intensity Profit MarginROAROE
-0.200000000000003
Page 23
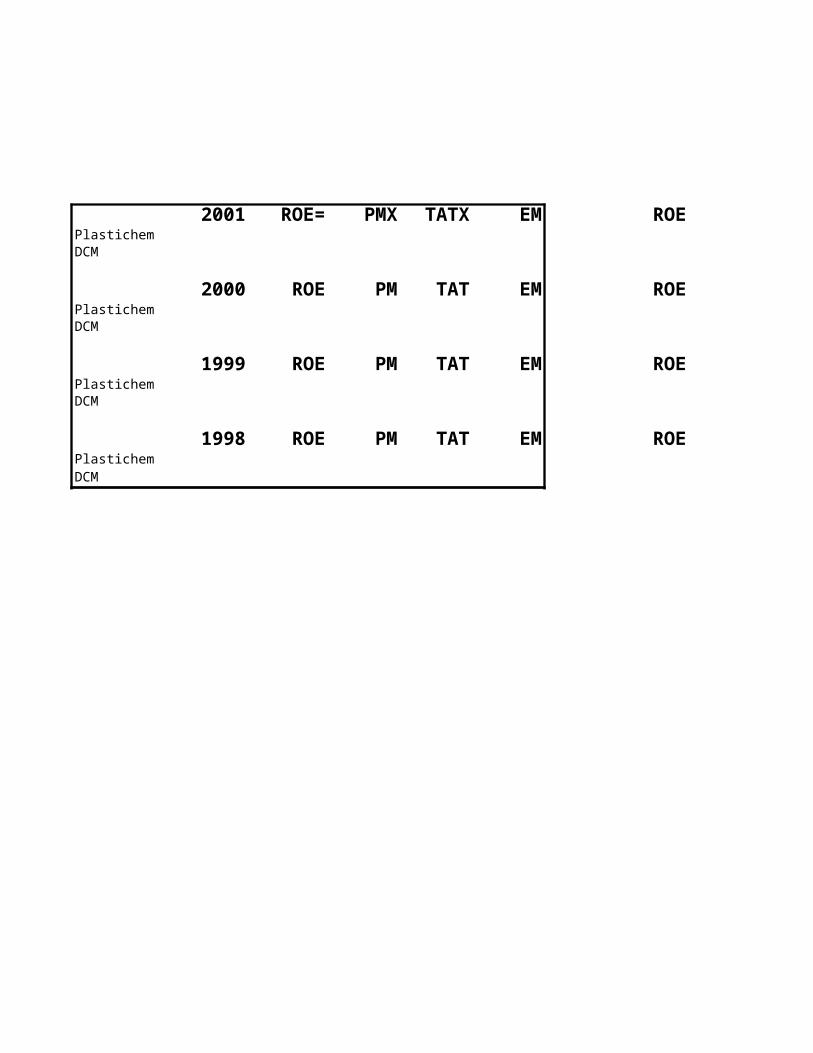
2001 ROE= PMX TATX EM ROEPlastichemDCM
2000 ROE PM TAT EM ROEPlastichemDCM
1999 ROE PM TAT EM ROEPlastichemDCM
1998 ROE PM TAT EM ROEPlastichemDCM
Page 24
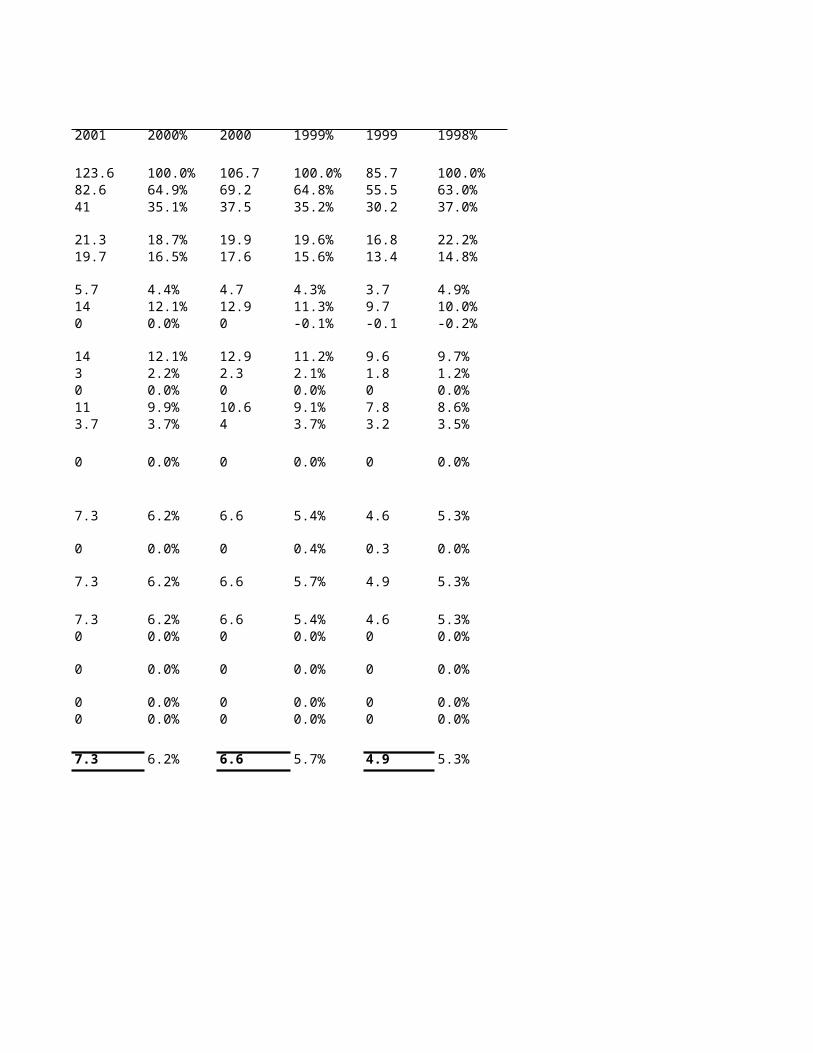
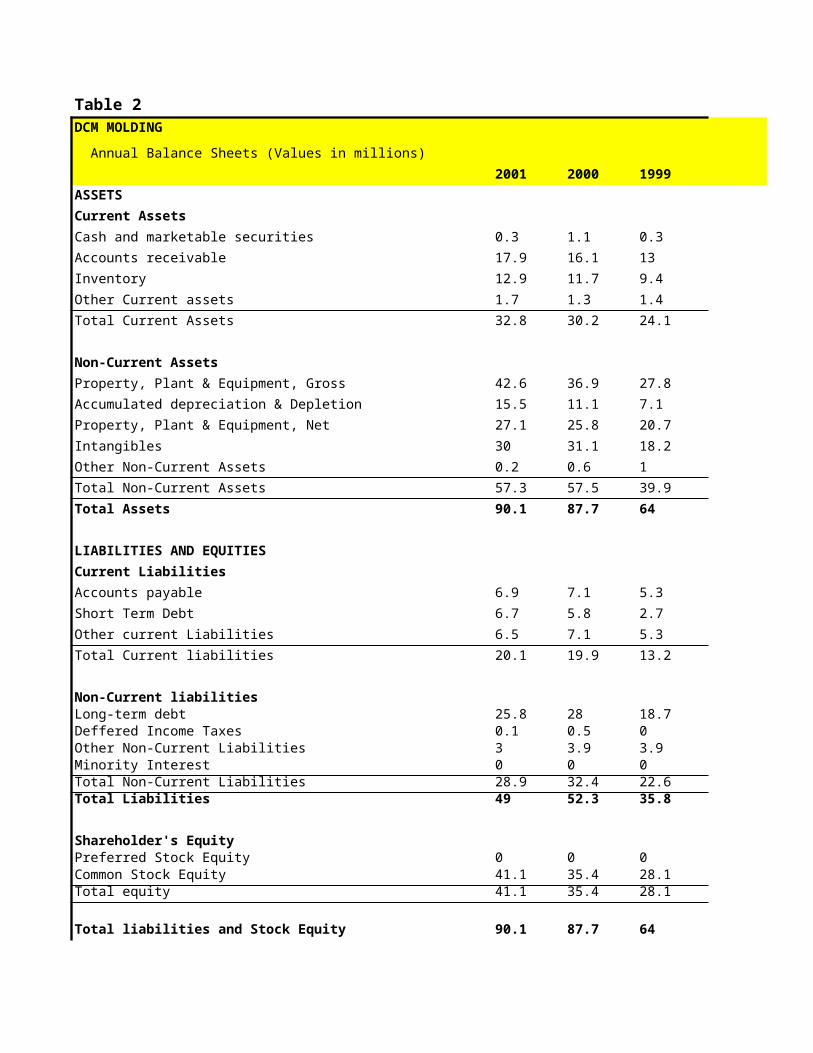
Table 2DCM MOLDING
Annual Balance Sheets (Values in millions)
2001% 2001 2000% 2000
ASSETS
Current Assets
Cash and marketable securities 0.33% 0.3 1.1
Accounts receivable 19.87% 17.9 16.1
Inventory 14.32% 12.9 11.7
Other Current assets 1.89% 1.7 1.3
Total Current Assets 36.40% 32.8 30.2
Non-Current Assets
Property, Plant & Equipment, Gross 47.28% 42.6 36.9
Accumulated depreciation & Depletion 17.20% 15.5 11.1
Property, Plant & Equipment, Net 30.08% 27.1 25.8
Intangibles 33.30% 30 31.1
Other Non-Current Assets 0.22% 0.2 0.6
Total Non-Current Assets 63.60% 57.3 57.5
Total Assets 100.00% 90.1 87.7
LIABILITIES AND EQUITIES
Current Liabilities
Accounts payable 7.66% 6.9 7.1
Short Term Debt 7.44% 6.7 5.8
Other current Liabilities 7.21% 6.5 7.1
Total Current liabilities 22.31% 20.1 19.9
Non-Current liabilities
Long-term debt 28.63% 25.8 31.93% 28
Deferred Income Taxes 0.11% 0.1 0.57% 0.5
Other Non-Current Liabilities 3.33% 3 4.45% 3.9
Minority Interest 0.00% 0 0.00% 0
Total Non-Current Liabilities 32.08% 28.9 36.94% 32.4
Total Liabilities 54.38% 49 59.64% 52.3
Shareholder's Equity
Preferred Stock Equity 0 0
Common Stock Equity 45.62% 41.1 40.36% 35.4
Total equity 45.62% 41.1 40.36% 35.4
Total liabilities and Stock Equity 100.00% 90.1 100.00% 87.7
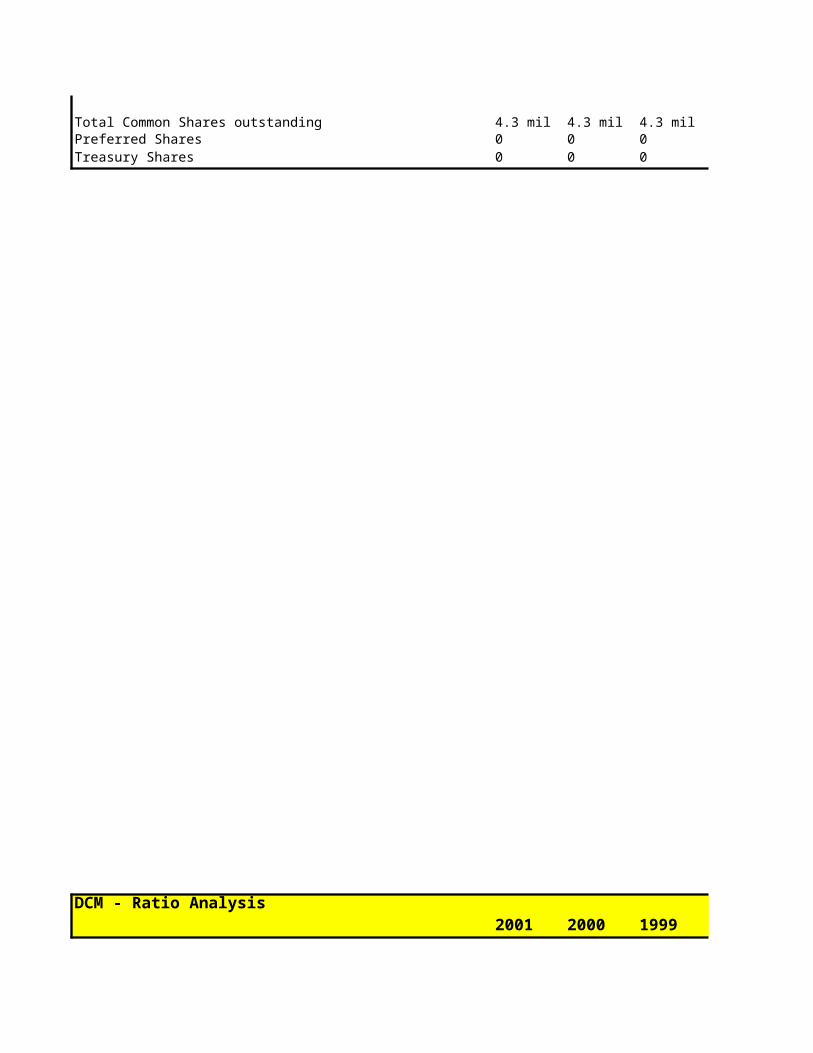
Total Common Shares outstandingPreferred Shares 0 0Treasury Shares 0 0
4.3 mil
4.3 mil
Page 25
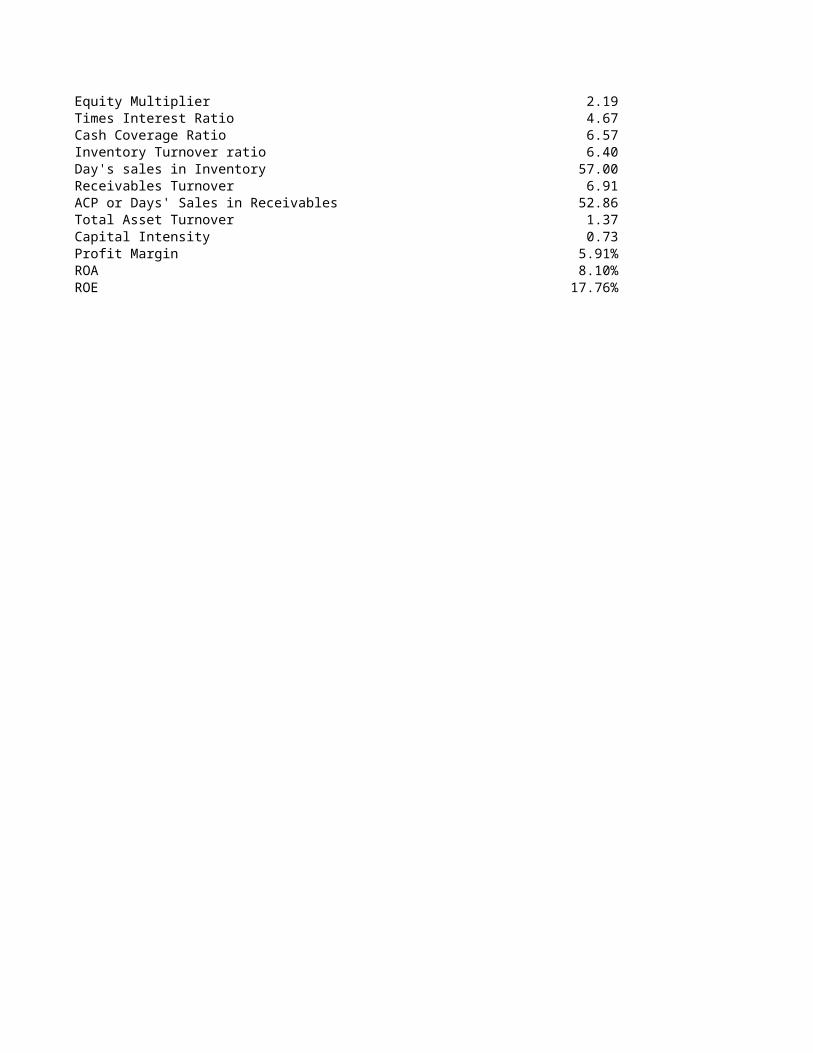
DCM - Ratio Analysis2001 2000
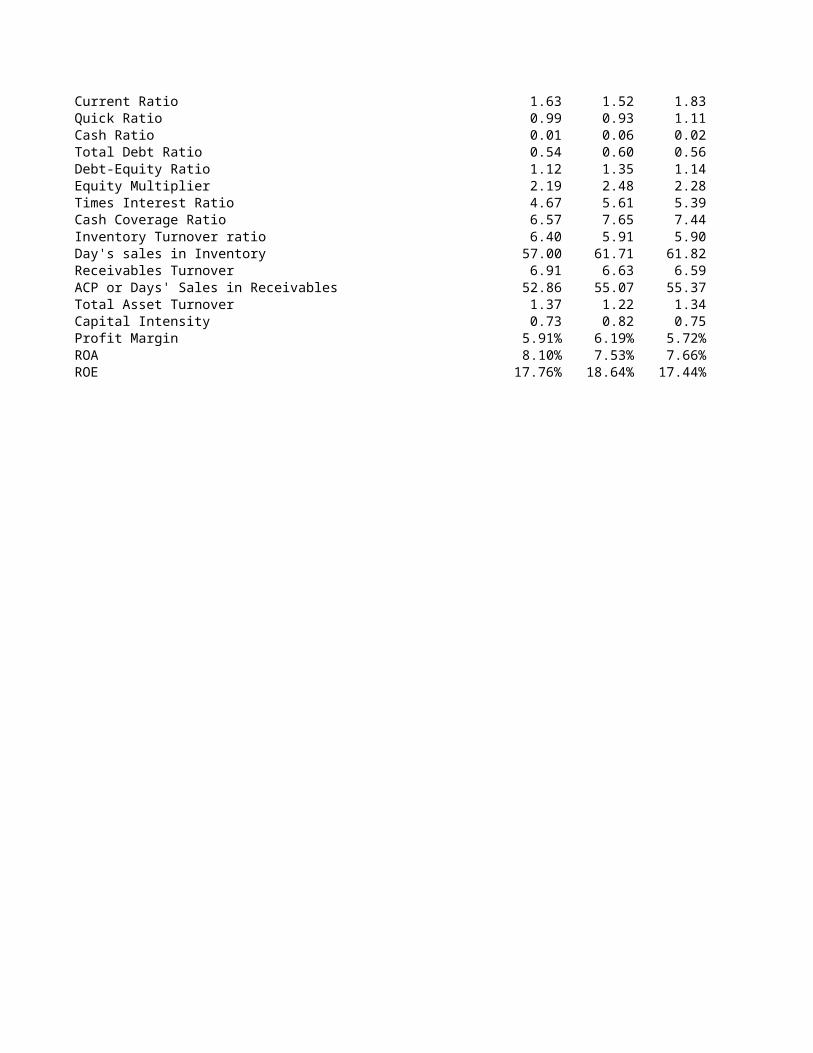
Current Ratio 1.63 1.52Quick Ratio 0.99 0.93Cash Ratio 0.01 0.06Total Debt Ratio 0.54 0.60Debt-Equity Ratio 1.12 1.35Equity Multiplier 2.19 2.48Times Interest Ratio 4.67 5.61Cash Coverage Ratio 6.57 7.65Inventory Turnover ratio 6.40 5.91Day's sales in Inventory 57.00 61.71Receivables Turnover 6.91 6.63ACP or Days' Sales in Receivables 52.86 55.07Total Asset Turnover 1.37 1.22Capital Intensity 0.73 0.82
Page 26
Profit Margin 5.91% 6.19%ROA 8.10% 7.53%ROE 17.76% 18.64%
Page 27
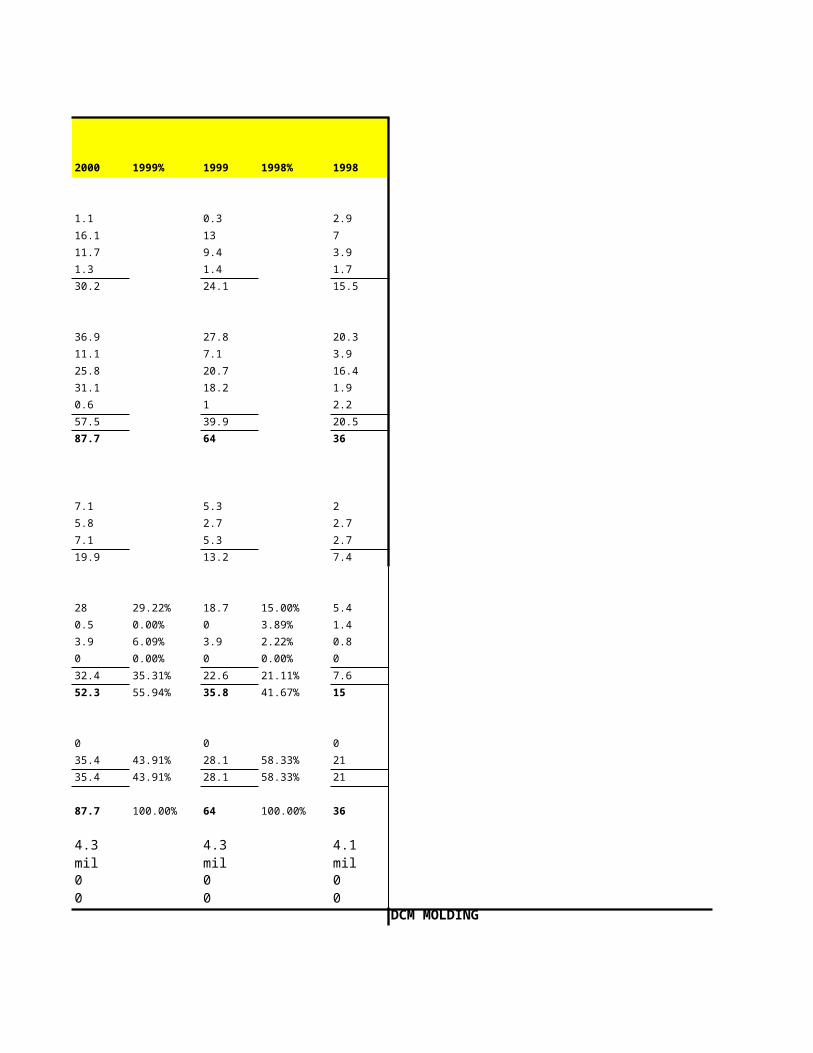
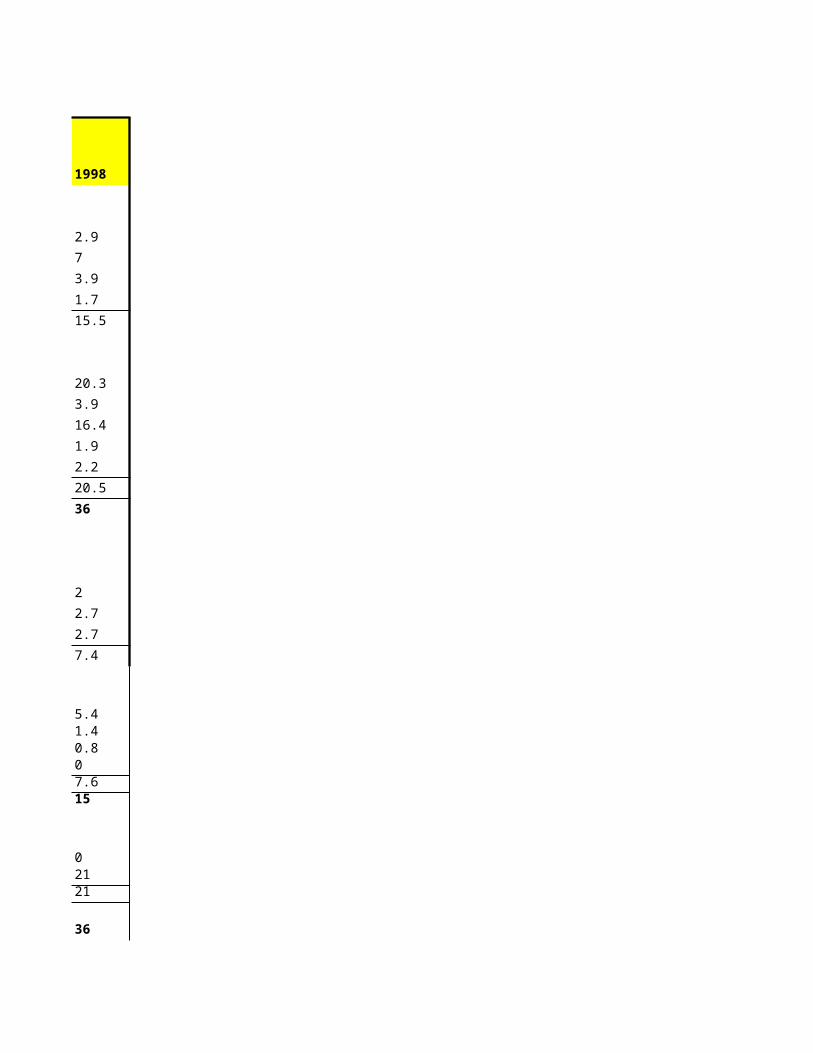
DCM MOLDING
1999% 1999 1998% 1998
0.3 2.9
13 7
9.4 3.9
1.4 1.7
24.1 15.5
27.8 20.3
7.1 3.9
20.7 16.4
18.2 1.9
1 2.2
39.9 20.5
64 36
5.3 2
2.7 2.7
5.3 2.7
13.2 7.4
29.22% 18.7 15.00% 5.4
0.00% 0 3.89% 1.4
6.09% 3.9 2.22% 0.8
0.00% 0 0.00% 0
35.31% 22.6 21.11% 7.6
55.94% 35.8 41.67% 15
0 0
43.91% 28.1 58.33% 21
43.91% 28.1 58.33% 21
100.00% 64 100.00% 36
0 00 0
DCM MOLDING
2001% 2001
Sales 100.0% 123.6
4.3 mil
4.1 mil
Annual Income Statements (Value in Millions)
Page 28
Cost of Sales 66.8% 82.6Gross Operating profit 33.2% 41
17.2% 21.3EBITDA 15.9% 19.7
Depreciation & Amortization 4.6% 5.7EBIT 11.3% 14Other Income, Net 0.0% 0
11.3% 14Interest Expense 2.4% 3Minority Interest 0.0% 0Pre-Tax Income 8.9% 11Income Taxes 3.0% 3.7
Special Income/Charges 0.0% 0
5.9% 7.3
0.0% 0
5.9% 7.3
Normalized Income 5.9% 7.3Extraordinary Income 0.0% 0
0.0% 0
0.0% 0Other Gains 0.0% 0
Total Net Income 5.9% 7.3
1999 1998
1.83 2.091.11 1.570.02 0.390.56 0.421.14 0.612.28 1.715.39 8.607.44 12.805.90 6.97
61.82 52.336.59 6.17
55.37 59.141.34 1.200.75 0.83
Selling, General & Admin. Expenses
Total Income Avail for Interest Exp.
Net Income from Cont.OperationsNet Income from Discont. Opers.Net Income from Total Operations
Income from Cum. Eff of Acct. Chg.Income from Tax Loss Carryforward
Page 29
5.72% 5.32%7.66% 6.39%
17.44% 10.95%
Page 30
DCM MOLDING
2000% 2000 1999% 1999 1998%
100.0% 106.7 100.0% 85.7 100.0%
Page 31
64.9% 69.2 64.8% 55.5 63.0%35.1% 37.5 35.2% 30.2 37.0%
18.7% 19.9 19.6% 16.8 22.2%16.5% 17.6 15.6% 13.4 14.8%
4.4% 4.7 4.3% 3.7 4.9%12.1% 12.9 11.3% 9.7 10.0%0.0% 0 -0.1% -0.1 -0.2%
12.1% 12.9 11.2% 9.6 9.7%2.2% 2.3 2.1% 1.8 1.2%0.0% 0 0.0% 0 0.0%9.9% 10.6 9.1% 7.8 8.6%3.7% 4 3.7% 3.2 3.5%
0.0% 0 0.0% 0 0.0%
6.2% 6.6 5.4% 4.6 5.3%
0.0% 0 0.4% 0.3 0.0%
6.2% 6.6 5.7% 4.9 5.3%
6.2% 6.6 5.4% 4.6 5.3%0.0% 0 0.0% 0 0.0%
0.0% 0 0.0% 0 0.0%
0.0% 0 0.0% 0 0.0%0.0% 0 0.0% 0 0.0%
6.2% 6.6 5.7% 4.9 5.3%
Page 32
Table 2DCM MOLDING
Annual Balance Sheets (Values in millions)
2001 2000 1999 1998
ASSETS
Current Assets
Cash and marketable securities 0.3 1.1 0.3 2.9
Accounts receivable 17.9 16.1 13 7
Inventory 12.9 11.7 9.4 3.9
Other Current assets 1.7 1.3 1.4 1.7
Total Current Assets 32.8 30.2 24.1 15.5
Non-Current Assets
Property, Plant & Equipment, Gross 42.6 36.9 27.8 20.3
Accumulated depreciation & Depletion 15.5 11.1 7.1 3.9
Property, Plant & Equipment, Net 27.1 25.8 20.7 16.4
Intangibles 30 31.1 18.2 1.9
Other Non-Current Assets 0.2 0.6 1 2.2
Total Non-Current Assets 57.3 57.5 39.9 20.5
Total Assets 90.1 87.7 64 36
LIABILITIES AND EQUITIES
Current Liabilities
Accounts payable 6.9 7.1 5.3 2
Short Term Debt 6.7 5.8 2.7 2.7
Other current Liabilities 6.5 7.1 5.3 2.7
Total Current liabilities 20.1 19.9 13.2 7.4
Non-Current liabilitiesLong-term debt 25.8 28 18.7 5.4Deffered Income Taxes 0.1 0.5 0 1.4Other Non-Current Liabilities 3 3.9 3.9 0.8Minority Interest 0 0 0 0Total Non-Current Liabilities 28.9 32.4 22.6 7.6Total Liabilities 49 52.3 35.8 15
Shareholder's EquityPreferred Stock Equity 0 0 0 0Common Stock Equity 41.1 35.4 28.1 21Total equity 41.1 35.4 28.1 21
Total liabilities and Stock Equity 90.1 87.7 64 36
Total Common Shares outstanding 4.3 mil 4.3 mil 4.3 milPreferred Shares 0 0 0 0Treasury Shares 0 0 0 0
mil
Page 33
DCM - Ratio Analysis2001 2000 1999 1998
Current Ratio 1.63 1.52 1.83 2.09Quick Ratio 0.99 0.93 1.11 1.57Cash Ratio 0.01 0.06 0.02 0.39Total Debt Ratio 0.54 0.60 0.56 0.42Debt-Equity Ratio 1.12 1.35 1.14 0.61Equity Multiplier 2.19 2.48 2.28 1.71Times Interest Ratio 4.67 5.61 5.39 8.60Cash Coverage Ratio 6.57 7.65 7.44 12.80
Page 34
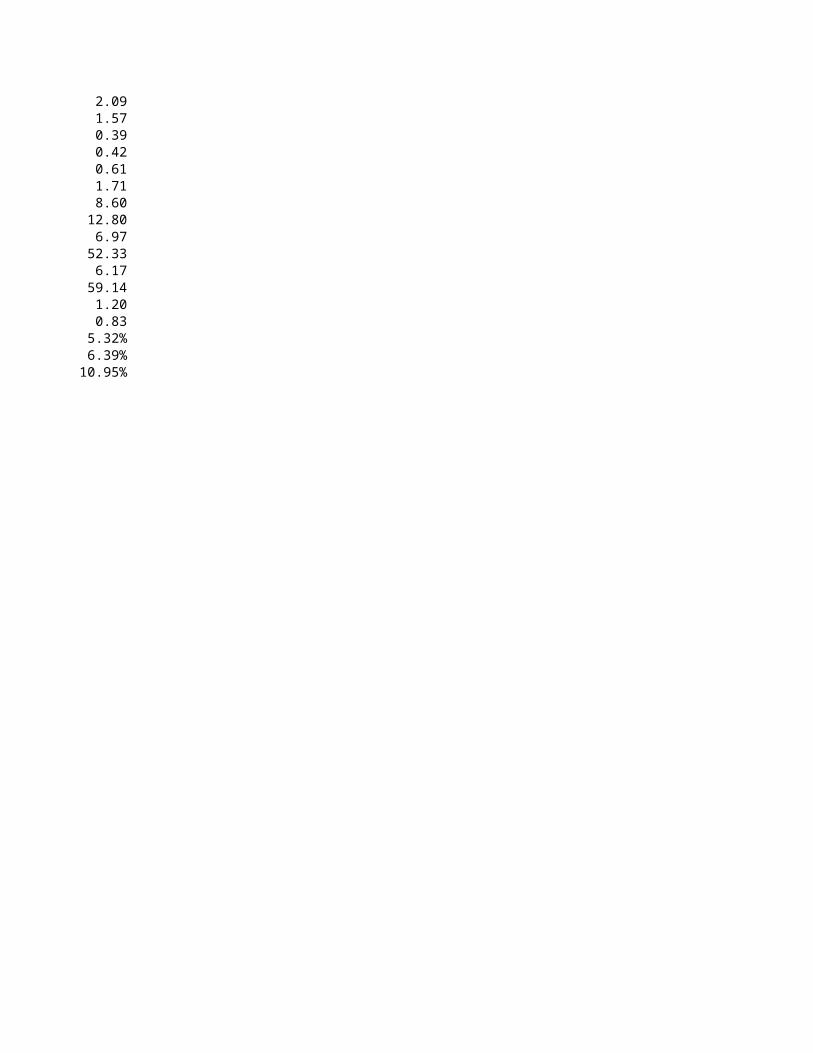
Inventory Turnover ratio 6.40 5.91 5.90 6.97Day's sales in Inventory 57.00 61.71 61.82 52.33Receivables Turnover 6.91 6.63 6.59 6.17ACP or Days' Sales in Receivables 52.86 55.07 55.37 59.14Total Asset Turnover 1.37 1.22 1.34 1.20Capital Intensity 0.73 0.82 0.75 0.83Profit Margin 5.91% 6.19% 5.72% 5.32%ROA 8.10% 7.53% 7.66% 6.39%ROE 17.76% 18.64% 17.44% 10.95%
Page 36
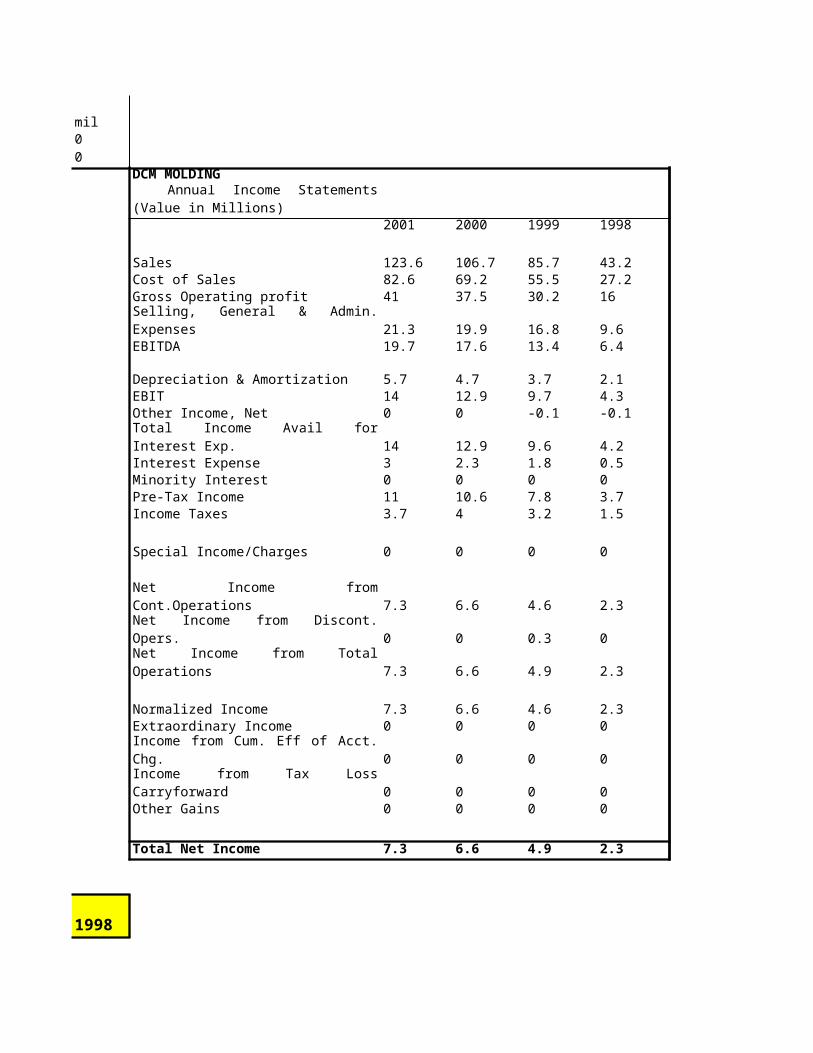
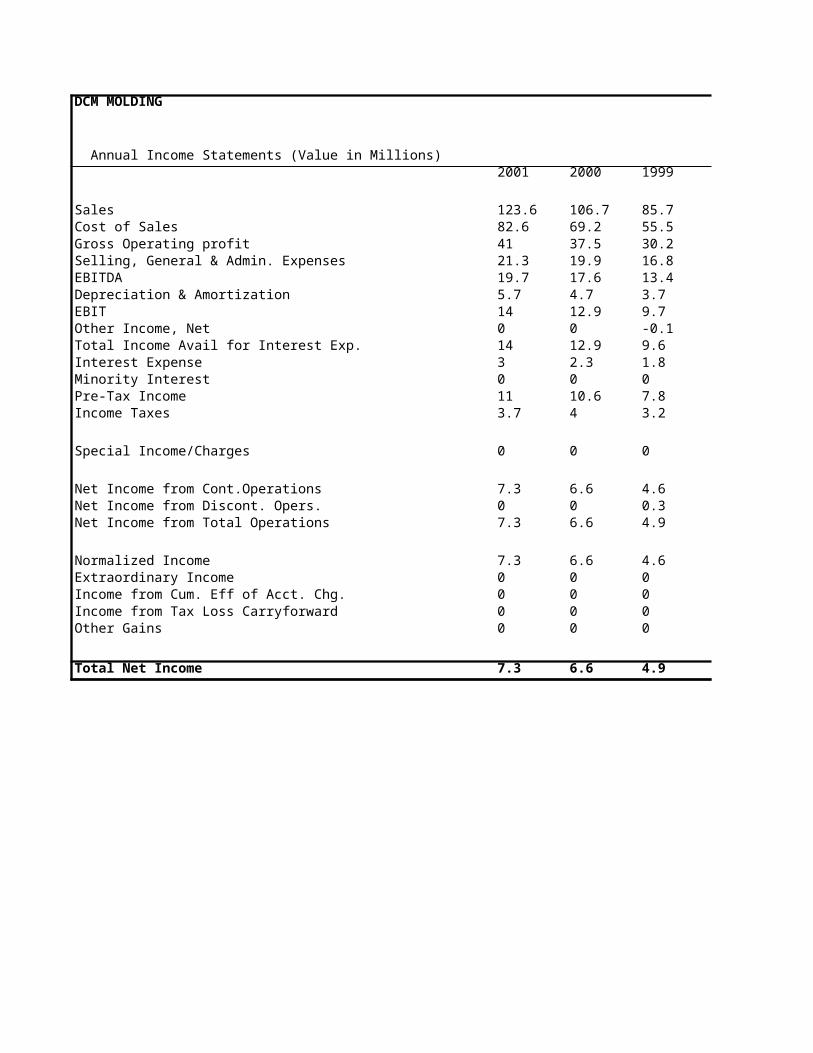
DCM MOLDING
2001 2000 1999 1998
Sales 123.6 106.7 85.7 43.2Cost of Sales 82.6 69.2 55.5 27.2Gross Operating profit 41 37.5 30.2 16
21.3 19.9 16.8 9.6EBITDA 19.7 17.6 13.4 6.4
Depreciation & Amortization 5.7 4.7 3.7 2.1EBIT 14 12.9 9.7 4.3Other Income, Net 0 0 -0.1 -0.1
14 12.9 9.6 4.2Interest Expense 3 2.3 1.8 0.5Minority Interest 0 0 0 0Pre-Tax Income 11 10.6 7.8 3.7Income Taxes 3.7 4 3.2 1.5
Special Income/Charges 0 0 0 0
7.3 6.6 4.6 2.3
0 0 0.3 0
7.3 6.6 4.9 2.3
Normalized Income 7.3 6.6 4.6 2.3Extraordinary Income 0 0 0 0
0 0 0 0
0 0 0 0Other Gains 0 0 0 0
Total Net Income 7.3 6.6 4.9 2.3
Annual Income Statements (Value in Millions)
Selling, General & Admin. Expenses
Total Income Avail for Interest Exp.
Net Income from Cont.OperationsNet Income from Discont. Opers.Net Income from Total Operations
Income from Cum. Eff of Acct. Chg.Income from Tax Loss Carryforward
Page 37
DCM MOLDING
Annual Income Statements (Value in Millions)2001 2000 1999
Sales 123.6 106.7 85.7Cost of Sales 82.6 69.2 55.5Gross Operating profit 41 37.5 30.2Selling, General & Admin. Expenses 21.3 19.9 16.8EBITDA 19.7 17.6 13.4Depreciation & Amortization 5.7 4.7 3.7EBIT 14 12.9 9.7Other Income, Net 0 0 -0.1Total Income Avail for Interest Exp. 14 12.9 9.6Interest Expense 3 2.3 1.8Minority Interest 0 0 0Pre-Tax Income 11 10.6 7.8Income Taxes 3.7 4 3.2
Special Income/Charges 0 0 0
Net Income from Cont.Operations 7.3 6.6 4.6Net Income from Discont. Opers. 0 0 0.3Net Income from Total Operations 7.3 6.6 4.9
Normalized Income 7.3 6.6 4.6Extraordinary Income 0 0 0Income from Cum. Eff of Acct. Chg. 0 0 0Income from Tax Loss Carryforward 0 0 0Other Gains 0 0 0
Total Net Income 7.3 6.6 4.9
Page 38
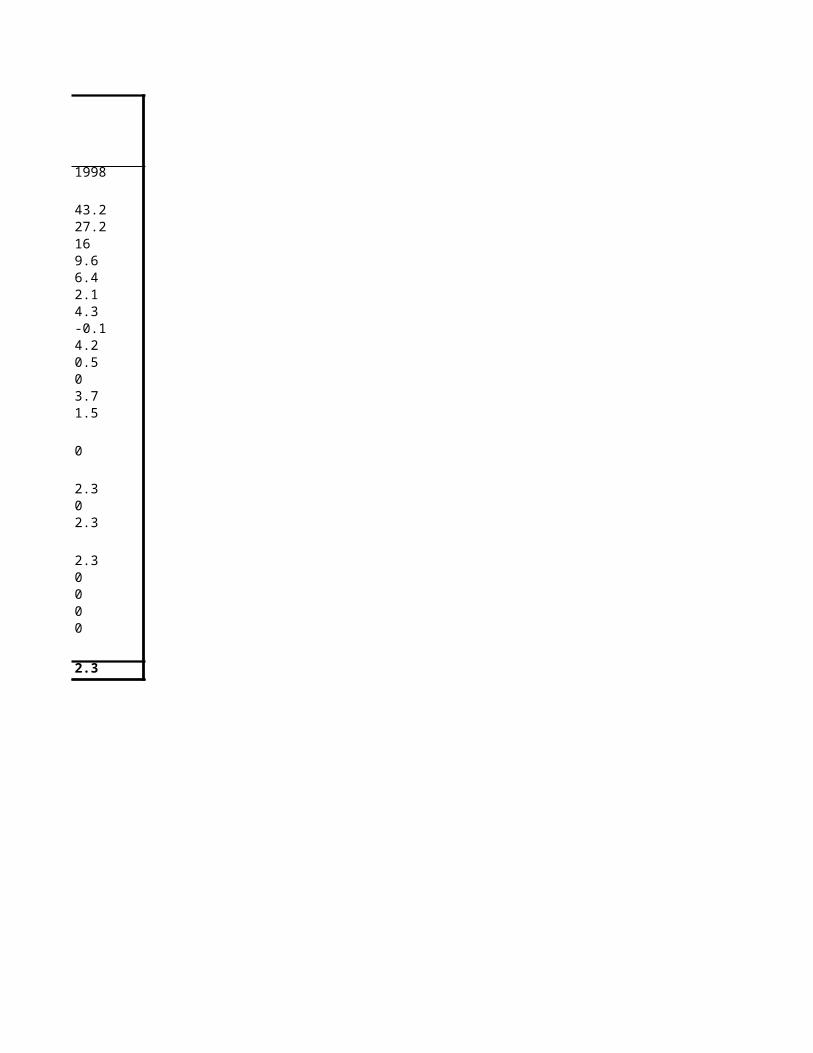
DCM MOLDING
1998
43.227.2169.66.42.14.3-0.14.20.503.71.5
0
2.302.3
2.30000
2.3
Page 39
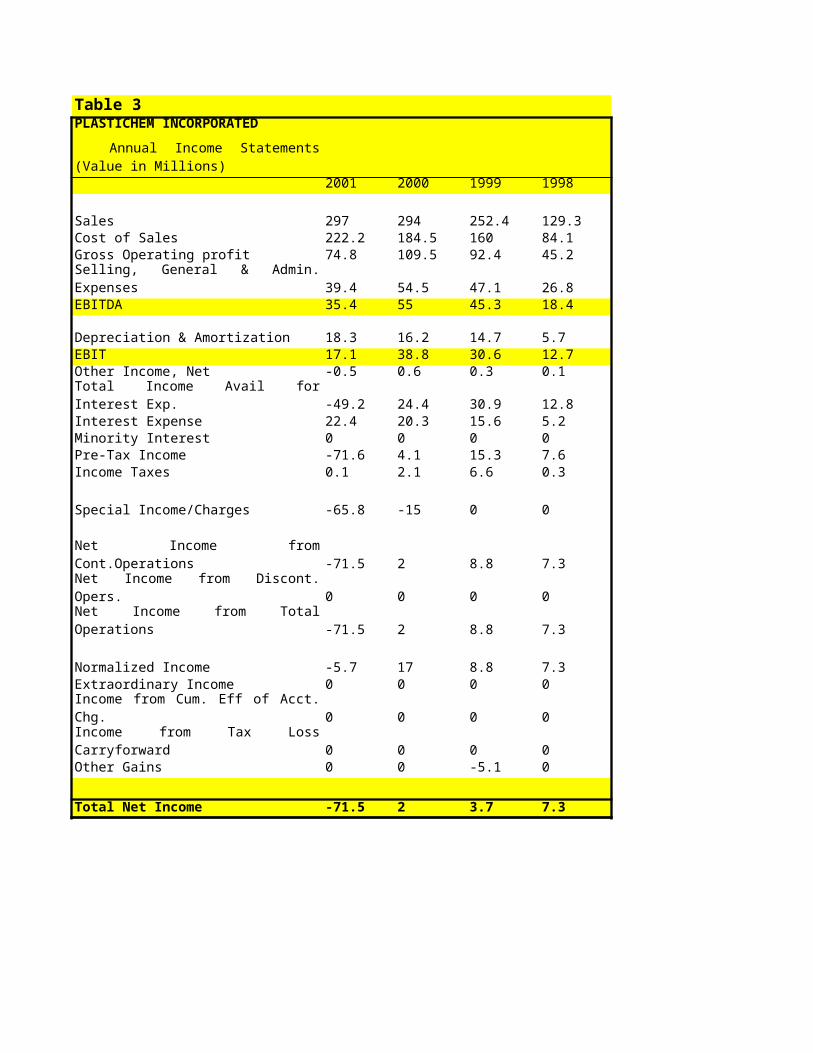
Table 3PLASTICHEM INCORPORATED
2001 2000 1999 1998
Sales 297 294 252.4 129.3Cost of Sales 222.2 184.5 160 84.1Gross Operating profit 74.8 109.5 92.4 45.2
39.4 54.5 47.1 26.8EBITDA 35.4 55 45.3 18.4
Depreciation & Amortization 18.3 16.2 14.7 5.7EBIT 17.1 38.8 30.6 12.7Other Income, Net -0.5 0.6 0.3 0.1
-49.2 24.4 30.9 12.8Interest Expense 22.4 20.3 15.6 5.2Minority Interest 0 0 0 0Pre-Tax Income -71.6 4.1 15.3 7.6Income Taxes 0.1 2.1 6.6 0.3
Special Income/Charges -65.8 -15 0 0
-71.5 2 8.8 7.3
0 0 0 0
-71.5 2 8.8 7.3
Normalized Income -5.7 17 8.8 7.3Extraordinary Income 0 0 0 0
0 0 0 0
0 0 0 0Other Gains 0 0 -5.1 0
Total Net Income -71.5 2 3.7 7.3
Annual Income Statements (Value in Millions)
Selling, General & Admin. Expenses
Total Income Avail for Interest Exp.
Net Income from Cont.OperationsNet Income from Discont. Opers.Net Income from Total Operations
Income from Cum. Eff of Acct. Chg.Income from Tax Loss Carryforward
Page 41
Table 3PLASTICHEM INCORPORATED
2001% 2000% 1999% 1998%
Sales 100% 100% 100% 100%Cost of Sales 75% 63% 63% 65%Gross Operating profit 25% 37% 37% 35%
13% 19% 19% 21%EBITDA 12% 19% 18% 14%
Depreciation & Amortization 6% 6% 6% 4%EBIT 6% 13% 12% 10%Other Income, Net 0% 0% 0% 0%
-17% 8% 12% 10%Interest Expense 8% 7% 6% 4%Minority Interest 0% 0% 0% 0%Pre-Tax Income -24% 1% 6% 6%Income Taxes 0% 1% 3% 0%
0% 0% 0% 0%Special Income/Charges -22% -5% 0% 0%
0% 0% 0% 0%
-24% 1% 3% 6%
0% 0% 0% 0%
-24% 1% 3% 6%
0% 0% 0% 0%Normalized Income -2% 6% 3% 6%Extraordinary Income 0% 0% 0% 0%
0% 0% 0% 0%
0% 0% 0% 0%Other Gains 0% 0% -2% 0%
0% 0% 0% 0%Total Net Income -24% 1% 1% 6%
Annual Income Statements (Value in Millions)
Selling, General & Admin. Expenses
Total Income Avail for Interest Exp.
Net Income from Cont.OperationsNet Income from Discont. Opers.Net Income from Total Operations
Income from Cum. Eff of Acct. Chg.Income from Tax Loss Carryforward


![Introduction - interoperability.blob.core.windows.netMS-XLS]-171212.d… · Web viewcontent, which can include unstructured or semi-structured tables of numbers, text, or both numbers](https://static.documents.pub/doc/80x56/5e14d78ef637f1221e282831/introduction-ms-xls-171212d-web-viewcontent-which-can-include-unstructured.jpg)


