3 The port industry 3.1 Challenges and emerging issues in port development A port is essentially a point where goods are transferred from one mode of transport to another. In an era of economic globalization ports are evolving rapidly from being traditional land/sea interfaces to providers of complete logistics networks. This means that ports have had to face many challenges due to unpredictable environmental changes and trends in the shipping, port and logistics industries. Most ports in the world have paid (or should pay) attention to these challenges and emerging issues, such as: ■ globalization of manufacturing and outsourcing ■ global trends of logistics network restructuring and reposition of regional and/or local distribution centre ■ rapid growth in volume of world seaborne freight, especially container ■ emerging hub and spoke system in global shipping service ■ increase of transhipment cargo and competition among ports and terminal operators ■ introduction of the super mega size containership ■ increasing competition towards hub ports ■ emerging global terminal operators and their growing market share ■ one stop shopping concept and intermodal transport linking strategically between ocean, railway, road and inland waterway ■ increasing role of ports in global supply chain management and logistics network structures ■ increase of productivity and efficiency in ports ■ high cost and constraints for developing port facilities. To cope with these challenges and emerging issues ports across the world have been trying to develop their physical infrastructures, especially container terminals and related facilities, and to expand their port hinterland through introducing free trade zones with a hope of developing hub ports and international logistics centres. In addition, many ports have been carrying out port reforms such as port governance restructuring and deregulations, private and public partnership. 3.2 Development of container ports There are close to 600 container ports across the world with an estimated combined handling capacity of 380 million TEU. The largest ports, those that can handle in excess of 1 million TEU per annum, account for nearly two thirds of global capacity (Drewry, 2001). By 2010 Shanghai container throughput is expected to have surpassed Hong Kong, currently the world’s largest port, but by 2020 Shanghai is expected to be overtaken by Shenzhen to become the world’s largest container port. Shanghai and Shenzhen are expected by 2020 to be moving 56.2 million and 57.9 million TEU respectively. In 2004 Shanghai moved 14.6 million TEU and Shenzhen 13.7 million TEU (Fairplay, 2005). From 2003 Shanghai container throughput increased by 53.5 per cent yet wharf length increased by only 14.3 per cent (Ports and Harbours, 2005).
Transcript
Chapter 3: The port industry 27
3 The port industry
3.1 Challenges and emerging issues in port development
A port is essentially a point where goods are transferred from one mode of transport to another. In an era
of economic globalization ports are evolving rapidly from being traditional land/sea interfaces to providers
of complete logistics networks. This means that ports have had to face many challenges due to
unpredictable environmental changes and trends in the shipping, port and logistics industries.
Most ports in the world have paid (or should pay) attention to these challenges and emerging issues,
such as:
� globalization of manufacturing and outsourcing
� global trends of logistics network restructuring and reposition of regional and/or local
distribution centre
� rapid growth in volume of world seaborne freight, especially container
� emerging hub and spoke system in global shipping service
� increase of transhipment cargo and competition among ports and terminal operators
� introduction of the super mega size containership
� increasing competition towards hub ports
� emerging global terminal operators and their growing market share
� one stop shopping concept and intermodal transport linking strategically between ocean,
railway, road and inland waterway
� increasing role of ports in global supply chain management and logistics network
structures
� increase of productivity and efficiency in ports
� high cost and constraints for developing port facilities.
To cope with these challenges and emerging issues ports across the world have been trying to develop
their physical infrastructures, especially container terminals and related facilities, and to expand their port
hinterland through introducing free trade zones with a hope of developing hub ports and international
logistics centres. In addition, many ports have been carrying out port reforms such as port governance
restructuring and deregulations, private and public partnership.
3.2 Development of container ports
There are close to 600 container ports across the world with an estimated combined handling capacity of
380 million TEU. The largest ports, those that can handle in excess of 1 million TEU per annum, account
for nearly two thirds of global capacity (Drewry, 2001).
By 2010 Shanghai container throughput is expected to have surpassed Hong Kong, currently the world’s
largest port, but by 2020 Shanghai is expected to be overtaken by Shenzhen to become the world’s
largest container port. Shanghai and Shenzhen are expected by 2020 to be moving 56.2 million and
57.9 million TEU respectively. In 2004 Shanghai moved 14.6 million TEU and Shenzhen 13.7 million TEU
(Fairplay, 2005). From 2003 Shanghai container throughput increased by 53.5 per cent yet wharf length
increased by only 14.3 per cent (Ports and Harbours, 2005).
28 Free Trade Zone and Port Hinterland Development
Ports can be broadly classified into three types of ownership. In 2002 the global container terminal
operators controlled close to 55 per cent of total capacity, the other private sector operators 22 per cent
and the public sector operators 24 per cent.
With the introduction of 8,000+ TEU vessels there will be a need for dredging, investment in handling
equipment, extra feedering costs and landside congestion and distribution. In terms of ports and
terminals, most of the leading container ports currently accommodating the largest ships in service are
designed to berth ships of up to 300-400 metres in overall length and have approach channels and berths
dredged to 15-15.5 metres, sufficient to accept ships up to 14.5 metres draught (Matthews, 2003).
Vertical integration is a viable alternative for key clients. Several large shipping lines such as Maersk
Sealand and China Ocean Shipping Company (COSCO) have integrated vertically and developed into
formidable container terminal operators. Shipping lines accounted for 25 per cent of the container
terminal market in 2002. This option is only economic for shipping lines with sufficient volumes (in a
region) and strong balance sheets. As a result, carriers focus on certain areas and rarely operate a
global network of either dedicated (for their own business) or public terminals. However, the ability for
shipping lines to operate their own terminals acts as a regulator on container terminal operators and
keeps a check on pricing.
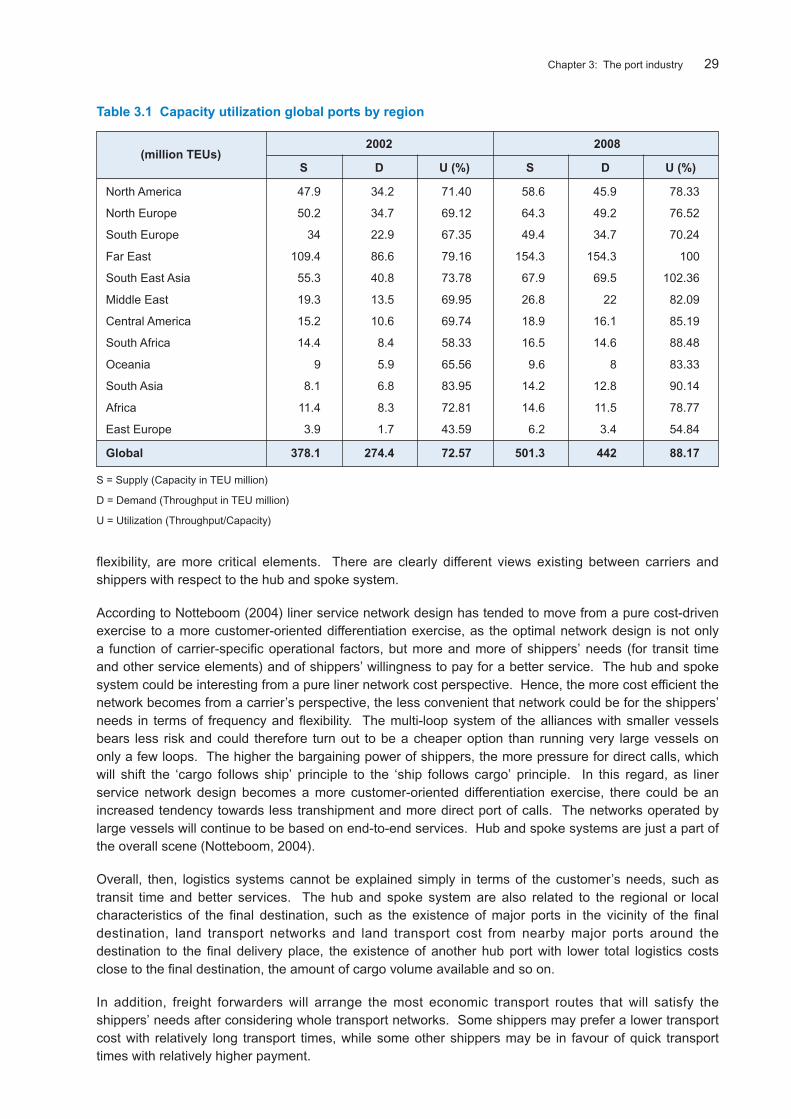
Drewry (2001) has forecast that investments in new berths and quays will increase throughput capacity to
442 million TEUs by 2008 or growth of around 4 per cent per year. At that pace of expansion, capacity
utilization should increase from around 72 per cent in 2002 to around 88 per cent by 2008. Drewry (2001)
expects that if current port utilization levels of 73 per cent in 2002 were to be maintained then an
additional US$ 14 billion would be needed to be invested in quays, cranes and container yards.
8,000 TEU vessels is not the limit. There are predictions of building new containerships as big as
18,000 TEU (Malacca-max), which will be calling at fewer and fewer hub ports (informare, online).
However, it may take a long time before this type of vessel is built. There are plans to design an ultra
large containership (ULCS) of 12,500 TEU capacity, which maintains the 14.5 metres loaded draught, but
assumes a 361 metres length and much wider beam of 57 metres, allowing for 22 rows of boxes on deck
(Matthews 2003). Economic forces appear to be favouring the emergence of super-hubs and a changing
pattern of port calls (Trace, 1997). By limiting port calls to regional hub ports, shipping companies can
reduce costs. It has been suggested that ports must have throughput of 5 million TEU and logistics
facilities to support the efficient flow of cargo (Lloyd’s List, 2002).
Drewry (2001) forecasts container throughput to grow at 8.3 per cent per year from 2002 to 2008 to
a total of 442 million handlings. This includes growth in transhipments estimated at 9.3 per cent per year
(see Table 3.1).
3.3 Hub and spoke network in liner service
In last two decades, the hub and spoke system in liner service has been introduced as larger
containerships have been adopted in major sea transport routes such as Europe-Far East-American West
coast. The emergence of this new system has allowed load centres along the East-West shipping lanes.
This hub-feeder system allows shipping lines to provide a global grid of east/west, north/south and
regional services. The large ships on the east/west routes will call mainly at transhipment hubs where
containers will be shifted to multi-layered feeder subsystem serving north/south, diagonal and regional
routes (Notteboom, 2004).
Liner service network design depends on the balance of power between carriers and shippers
(Notteboom, 2004). From the carrier’s perspective economies of scale are a critical element in order to
reduce costs, which can be achieved by operating larger ships and having fewer ports of call. However,
from the shipper’s perspective total freight rates, time and service quality, including frequency and
Chapter 3: The port industry 29
flexibility, are more critical elements. There are clearly different views existing between carriers and
shippers with respect to the hub and spoke system.
According to Notteboom (2004) liner service network design has tended to move from a pure cost-driven
exercise to a more customer-oriented differentiation exercise, as the optimal network design is not only
a function of carrier-specific operational factors, but more and more of shippers’ needs (for transit time
and other service elements) and of shippers’ willingness to pay for a better service. The hub and spoke
system could be interesting from a pure liner network cost perspective. Hence, the more cost efficient the
network becomes from a carrier’s perspective, the less convenient that network could be for the shippers’
needs in terms of frequency and flexibility. The multi-loop system of the alliances with smaller vessels
bears less risk and could therefore turn out to be a cheaper option than running very large vessels on
only a few loops. The higher the bargaining power of shippers, the more pressure for direct calls, which
will shift the ‘cargo follows ship’ principle to the ‘ship follows cargo’ principle. In this regard, as liner
service network design becomes a more customer-oriented differentiation exercise, there could be an
increased tendency towards less transhipment and more direct port of calls. The networks operated by
large vessels will continue to be based on end-to-end services. Hub and spoke systems are just a part of
the overall scene (Notteboom, 2004).
Overall, then, logistics systems cannot be explained simply in terms of the customer’s needs, such as
transit time and better services. The hub and spoke system are also related to the regional or local
characteristics of the final destination, such as the existence of major ports in the vicinity of the final
destination, land transport networks and land transport cost from nearby major ports around the
destination to the final delivery place, the existence of another hub port with lower total logistics costs
close to the final destination, the amount of cargo volume available and so on.
In addition, freight forwarders will arrange the most economic transport routes that will satisfy the
shippers’ needs after considering whole transport networks. Some shippers may prefer a lower transport
cost with relatively long transport times, while some other shippers may be in favour of quick transport
times with relatively higher payment.
Table 3.1 Capacity utilization global ports by region
2002 2008(million TEUs)
S D U (%) S D U (%)
North America 47.9 34.2 71.40 58.6 45.9 78.33
North Europe 50.2 34.7 69.12 64.3 49.2 76.52
South Europe 34 22.9 67.35 49.4 34.7 70.24
Far East 109.4 86.6 79.16 154.3 154.3 100
South East Asia 55.3 40.8 73.78 67.9 69.5 102.36
Middle East 19.3 13.5 69.95 26.8 22 82.09
Central America 15.2 10.6 69.74 18.9 16.1 85.19
South Africa 14.4 8.4 58.33 16.5 14.6 88.48
Oceania 9 5.9 65.56 9.6 8 83.33
South Asia 8.1 6.8 83.95 14.2 12.8 90.14
Africa 11.4 8.3 72.81 14.6 11.5 78.77
East Europe 3.9 1.7 43.59 6.2 3.4 54.84
Global 378.1 274.4 72.57 501.3 442 88.17
S = Supply (Capacity in TEU million)
D = Demand (Throughput in TEU million)
U = Utilization (Throughput/Capacity)
30 Free Trade Zone and Port Hinterland Development
Logistics costs are, therefore, one of the major elements influencing competitiveness and productivity in
the globalization of manufacturing and material outsourcing. The ability to source finished or partially
manufactured goods and intermediate goods in areas of low cost has been at the centre of the
globalization of industries. The total logistics costs are estimated to reach up 20 per cent of total
production costs in OECD countries. Transport usually accounts for a quarter of total logistics costs in
OECD countries, storage for a fifth and inventories for a sixth.
In other words, low transport costs along with information technology development have made it possible
for companies to globalize their manufacturing, outsourcing and logistics systems, and logistics costs
already occupy a major portion of total product cost. Taking into account this current situation in terms of
the globalization of world industry and increasing pressure on current logistics costs, shippers and
shipping lines cannot disregard cost aspects.
Shipping lines, which are a capital intensive and risk high industry, have suffered low profitability over past
decades even though they are making good profits due to the increases of recent freight rates and
significant world container volume increase during the period of 2003-2004. This means that shipping
lines must try to reduce the fixed cost incurred because the recent boom will not continue, and the efforts
for better profitability may not be negotiable due to strong resistance to freight rate increases among
shippers. Shippers have already shown strong resistance to freight rate increases on the part of some
liner conferences in recent years.
Recently most ports have introduced incentives to transhipment such as longer free storage periods,
lower terminal handling charges and the reduction of port tariffs for shipping lines handling more than
certain freight volume, which could contribute significantly to reducing the cost of shipping companies
and/or shippers. Moreover, most shipping lines have been introducing vertical integration by transforming
their role from shipping carriers to global logistics providers covering logistics supply management,
logistics distribution and global logistics and value-added services. Hence, the role of shipping lines will
not be just as carriers but as total logistics service providers with additional service activities increasing
customer’s value. These total services may need more sophisticated services around ports with well
developed and related logistics clusters.
In addition, there has been a strong trend towards mega size containerships. The service pattern of
these mega size containerships may depend on the cargo volume available. If there is enough volume to
fill the space, well developed ports and good land transport facilities with reasonable cost, and a direct
call system may be a better service pattern. On the other hand, there is a strong possibility of ports
adopting a hub and spoke service pattern with an appropriate number of ports of call.
Case Study 3.1 CMA CGM case
The ideal service is a weekly shuttle service between two ports (easy schedule to maintain, clear for the shipper,
no logistics headache), for example CMA CGM has succeeded in launching just two: Marseille – Algiers,
Marseille – Oran.
The 65 others services CMA CGM operate incorporate complicated rotations with several ports of calls of which
many are hub ports. Many of CMA CGM lines intersect each other and its fleet includes a large numbers of
feeders.
Starting from a base in the Mediterranean by 1986, CMA CGM went as far as the Middle East with vessels
entering the Persian Gulf up to Kuwait and then returning to Europe. The markets started to be depressed and
a Europe/Middle East line, being very much one way traffic, was no longer viable. CMA CGM had no other
solution than to continue its Eastbound progression towards the Far East. This is when transhipment,
a relatively new idea at that time, came into the equation at CMA CGM.
Chapter 3: The port industry 31
To go all the way to Japan from Europe, CMA CGM has to cut its voyage time. One way to do that was to stop
entering the Gulf area and to call at a port outside the area. Mina Qaboos in Oman was chosen. CMA CGM then
developed its own dedicated feeder to deliver the cargo to all ports in the Gulf up to Kuwait. At the time this was
rather innovative and customers did not like the idea. CMA CGM has been working with this same pattern for last
16 years and is still amongst the three leading carriers in this trade.
Today taking Asia-Europe, as an example, CMA CGM, currently offers about 80 different places of origin and
about 100 different destinations in Middle East, Mediterranean and Northern Europe. This means about 8,000
port pairs in each direction. It is difficult to imagine if there were no hub ports and no transhipment.
Based upon current port coverage on a Far East – Europe vice versa Voyage, the voyage duration would be
180 days and thus each vessel would be able to perform only two round trips a year. Furthermore, the
approximate slot cost of such a voyage would be about 2,250 USD per TEU on a round trip basis. Transit time to
Hamburg would then be about 90 days.
If CMA CGM received a tender from a global company comprising of 992 entries, corresponding to as many port
pairs, volumes would vary from the odd container to hundreds. To satisfy such global customers, it is necessary
to have a global network which can only be provided if major trunk lines cross regional lines in well selected hubs.
The clever use of networking allows a multiplication of opportunities for shippers.
For the main ports in Asia, Europe and the United States of America, there are competitive direct services
available, and these will stay. However, customers in smaller ports – normally in less developed countries – will
rely on hubs and transhipment services to reach the markets.
Particularly on certain North-South routes, the transhipment line can be in a position to offer a faster and more
frequent service trade than the direct end to end specialists who cannot afford to be weekly. Aggregated volumes
from multiple origins may sustain a weekly service operated from the regional hub to a specific destination
whereas on a single trade basis the end to end operator cannot get enough volumes to justify weekly calls or
even weekly frequency. For example, in the case of a North-South destination such as Port Sudan, the options to
choose between a fortnightly direct service and twice weekly departures for Northern Europe using Jeddah as
a hub with a weekly fixed day relay. In addition, the Sudanese consignee will receive on the same weekly basis
his imports from Asia.
Transhipment is now a full part of the carrier’s strategy. The global customers are expecting their global service
providers to deliver their containers from anywhere in the world to any destination. The small third world customer
also wants – and is entitled to – good access to the world’s markets.
(Whitelaw, 2002)
3.4 Port reforms, privatization, new roles
In most economies in this 21st century, public/private partnerships to finance port investments and
manage port facilities have been commonplace for many years. The first port privatization occurred in the
United Kingdom in 1983 when the government sold a 49 per cent stake in Associated British Ports. In the
following year the remaining 51 per cent was also sold. Between 1990 and 1998 some 112 port projects
with private participation reached financial closure in 28 developing countries with investment totalling
more than US$ 9 billion (Sommer, 1999). Many governments have accelerated deregulation of economic
activities and decentralization of decision making, with the objective of reducing demands on the public
sector budget, increasing financial viability and improving productivity and efficiency in the port industry.
The United Kingdom alone has raised some US$ 121 billion through its privatization programme whilst
globally the figure stands at well over US$ 1 trillion (Baird & Valentine, 2006).
According to the World Bank (2001), there are four types of port management models which are:
� service port
� tool port
32 Free Trade Zone and Port Hinterland Development
� landlord port
� private service port.
Except for small ports with small portion of commercial activities, most port management or port
authorities6 in the world are categorized into landlord port with a few exceptions as a result of recent
privatization process or participation of private sector in the port sector (Table 3.2).
6 Ports usually have a governing body referred to as the Port Authority, Port Management or Port Administration. ‘Port Authority’is used widely to indicate any of these three terms. The term ‘Port Authority’ has been defined in various ways. In 1977a Commission of the European Union defined a Port Authority as a ‘State, Municipal, public or private body, which is largelyresponsible for the tasks of construction, administration and sometimes the operation of port facilities and, in certain circumstances,for security’ (World Bank, 2001).
Table 3.2 Basic port management models (World Bank)
Type Infrastructure Superstructure Port labour Other functions
Public service port Public Public Public Majority public
Tool port Public Public Private Public/Private
Landlord port Public Private Private Public/Private
Private service port Private Private Private Majority private
For privatization basically there are three distinct and essential elements of a port which should be
carefully considered:
� port regulator
� port landowner
� port operator.
Firstly, regulatory activities within a port will generally be related to duties and responsibilities such as
enforcing regulations and providing pilotage services and vessel traffic management, most of which will
have been established by statute. This function traditionally is conducted by a government body. A port
authority may also be expected to monitor the performance of the port, coordinate policy making with
local and national government bodies, plan for future expansion, and market and promote the entire port
and its facilities to users.
The second element is port land. The key tasks a port landowner will need to undertake include:
� managing and developing the port estate
� conceiving and implementing port policies and development strategies
� supervising major civil engineering works
� providing and maintaining channels, breakwaters, locks, turning basins, berths, piers and
wharves
� providing or arranging road access to the port complex. (Baird, 1999)
The third element is operations, which may include a range of value-added activities and free trade zone
related activities within the port estate. Most private participation takes place in this element.
Chapter 3: The port industry 33
Table 3.3 shows all three of key port elements of privatization options. In this framework most world
ports are considered as PRIVATE/I in which only port operations are carried out by the private sector.
This PRIVATE/I type is a similar concept to the landlord port of the World Bank model. In the top 100
containers port as of 1999, 88 ports were PRIVATE/I and seven ports were PUBLIC. The reason that
most ports have adopted the PRIVATE/I model may be that this model allow the state to leverage private
sector investment in its ports without losing either control of its port industry or ultimate property rights
with respect to port land. This model in practice has shown a reasonably positive outcome for private port
operators, for the state and for port users (Baird, 1999). However, some countries, such as Hong Kong,
China and South Africa, have adopted ‘corporatization’ models which are essentially private style
companies but under the control of government [sic]. Other countries such as Poland have adopted
a mixture of public, at both a state and municipal level, together with private interest (Valentine and Gray,
2000).
Table 3.3 Key port elements: Privatization options (Baird, 1999)
Port ModelsPort
OperatorRegulator Landowner
PUBLIC Public Public Public
PRIVATE/I Public Public Private
PRIVATE/II Public Private Private
PRIVATE/III Private Private Private
According to another study, when considering port reform there are three institutional issues which must
be examined:
� the role of the national port authority
� the role of the local port authority
� the role of the private sector. (Lethbridge and Ra’anan, 1991)
The role of a national port authority should be reduced to a few major tasks and the staff kept to
a minimum. Appropriate tasks are:
� to coordinate port investments so as to avoid wasting scarce resources to ensure that
sufficient capacity exists to meet the country’s trade needs
� to guarantee an adequate quality of service
� to exert some control over pricing of port services (to ensure government receives a return
on its investments and port profit levels are not excessive)
� to act as the body representing the ports industry in discussions with government, port
users and the public.
At the local port authority level, the first major step in reform is to establish the port as if it were
a commercial enterprise. Essential elements are the freedom to recruit staff at competitive salaries and
the existence of responsible financial management and accounting practices. The second step is to
divide port functions into a number of areas – safety, security and environment, investment and
maintenance of major infrastructure, superstructure investment and maintenance, port operations and
pricing – and to retain in the public sector only those areas necessary to ensure the safe functioning of
the port.
34 Free Trade Zone and Port Hinterland Development
Since most ports are monopolies, simply transferring their activities to private enterprise without carefully
designed and appropriate regulations could easily be against public interest. The role of the private
sector may be for stevedoring, the provision of floating craft (tugs, mooring boats, work boats, pilot boats),
certain aspects of port maintenance and electronic data processing systems, and for container and bulk
terminal management and operation. Eventually, with growing participation by private sector companies,
the port will retain only certain key activities – a good example is the role of the harbour master and his
office (responsible for the safety of navigation, hazardous vessels, traffic control, and other important
tasks); another example is the responsibility for maintaining dredged depths and channels (not doing the
actual dredging, but managing the task and its implementation).
China began reform of their port management system in 2001. The management of ports by the central
government was transferred to the responsibility of municipal government. They separated government
function (or regulation) and enterprise management (or operation). The government function was
assigned to municipal governments while the enterprise function was granted to state-owned enterprise
from early 2003. For example, at Dalian Port, port operation related matters are under the authority of the
Dalian Port Corporation Limited, which is a stated-owned enterprise with the function of the former port
authority. Free trade zone related matters are controlled by the Administration of Dalian FTZ, and
government related regulation matters are controlled by the Port Bureau of Dalian Municipal Government.
In the case of the Republic of Korea, Busan Port Authority as a state-owned enterprise was established in
January 2004, and Incheon Port Authority will be established in 2005. These reforms in the Republic of
Korea and China are aimed mainly at improvement of efficiency and productivity through overcoming the
limits of the former port authority which was the government or state.
In port reform, especially the introduction of a container terminal privatization system, one thing must be
carefully considered, which is to introduce a competition system within a port in order to maintain the
competitive position and national strategic role of the port. During the economic boom of 2003 and 2004
many ports suffered from terminal congestion due to the rapid increase in the number of containers, and
some monopolistic terminal operators introduced terminal congestion charges. This may mean the loss
of competitiveness of national export and import production.
To increase terminal productivity modern quayside handling equipment has to be introduced. However,
the existing labour union system, which is usually monopolistic in terms of the supply of labour, often
refuses to accept reductions in the labour force and ignores the need to upgrade skills. Many countries
have faced or continue to face such unions which act as barriers to productivity improvement.
Governments must pay careful attention to the need for port management organizations to change in
order to meet national objectives and economic strategies, customer’s needs and to cope with rapidly the
changing maritime environment. Ports must look outside their immediate jurisdiction as a focus of their
future development. Such strategies fall within a perspective of port regionalization where a port seeks
a closer integration with the supply chains of its hinterland. Major factors to be considered in port
management roles are as follows:
� increase of private sector participation in the port development and operation
� often conflicts between port sector and city sector
� port sector role moving beyond the physical port boundary, expanding to the outside of its
boundary as the importance of intermodalism grows
� growing competition toward hub port and logistics centre and user’s demand for
competitive services
� needs of coordination and cooperation among a variety of government organizations
(such as customs, labour and security related public offices), private operators and users
interrelated in port activities
Chapter 3: The port industry 35
� strong leadership and initiatives to meet its long and short term strategies by persuading
and negotiating national and local level of stakeholders
� needs of industry cluster approach to ports as a whole including shipping industry and
logistics industry
� needs of promotion of port competitiveness and marketing strategy as a whole.
On the first of January 2004, the Port of Rotterdam (Havendrijf Rotterdam N.V.) became a government
corporation. The part of Articles of Association of the Port of Rotterdam in Case Study 3.2 will be useful
to understand its roles.
Case Study 3.2 Articles of Association of the Port of Rotterdam (Havenbedrijf Rotterdam N.V.)
Article 2
2.1 The objects of the company are: to operate the port installations and in such context to strengthen the
position of the Rotterdam port and industrial zone within a European perspective, on the short and long
term.
2.2 Part of the objects of the company are:
a. to monitor effective, safe and efficient management of shipping traffic and to provide conditions of
nautical and maritime order and safety, as well to operate as the competent port authority for the
Rotterdam port area;
b. to develop, install, manage and utilize the port and industrial zone in Rotterdam, in the broadest
sense; and
c. to contribute to the urban development, to develop the city ports, and to improve the housing
conditions and the working and living climate of the city and area of Rotterdam, even in the
situation wherein such activities might (initially) incur losses.
2.3 The company seeks to accomplice its objects inter alia by performing the following:
a. to enter into a (port) agreement with the municipality of Rotterdam and agreements pursuant
thereto, including a long lease agreement;
b. to acquire, dispose, encumber, found or make found, develop, operate, manage and administer
real estate;
c. to enter into joint ventures and to otherwise participate in and to conduct the management of other
business enterprises and companies;
d. to render services in the management, technology, financial economic or administrative field;
e. to make loans, to finance and to provide security for debts for its account as well as that of others;
f. to perform port activities outside the region of Rotterdam, and furthermore all activities which are
incidental to or which may be conducive to any of the foregoing, all in the broadest sense.
(Port of Rotterdam, online)
3.5 Emergences of global container terminal operators
Increase of world trade volume and introduction of larger container ships require quality services and
productivity in the stevedoring industry, and have increased the importance of the role of the industry.
The privatization of port activities throughout the world has also increased the participation of global
terminal operators, especially in container port operations.
36 Free Trade Zone and Port Hinterland Development
Recently, global terminal operators have penetrated the global container stevedoring market more
aggressively in order to increase their competitiveness through the establishment of global networks.
Active horizontal integration of terminal operators has appeared in forms of mergers and acquisitions7,
investments for container terminal development in other countries through joint vestures with local
companies, other global terminal operators or shipping lines. Examples are Hutchison Port’s acquisitions
of concessions at ports in China, Indonesia, the Republic of Korea, Thailand and Myanmar, and PSA’s
acquisitions in China and Brunei.
The leading terminal operators have developed diverging strategies towards the control of larger parts of
the supply chain with clear understandings that the transport chain is viewed as a totally integrated
system. The door-to-door concept has transformed a number of terminal operators into logistics
organizations. The services offered include warehousing, distribution and value-added logistical services
such as customizing products for the local markets. Many terminal operators have been involved in
intermodal transport to create a landbridge between ports and inlands, for example, by operating rail
terminas, setting up road haulage companies or operating their own feeder services (Notteboom, 2004).
Such vertical expansion includes the downstream diversification of shipping lines into terminal
management, for example by AP Moller (Maersk Sealand) at the Port of Tanjung Pelepas.
Owing to these horizontal and vertical expansions, the top ten global terminal operators handled around
150 million TEU in 2003. For example, Hutchison Port Holdings (HPH) operates 219 berths in 39 ports in
17 countries along with a number of transportation related service companies. In 2003, the HPH Group
handled 41.5 million TEU (HPH online). In 2003, the top five terminal operators in the world handled
118.4 million TEU, representing 52 per cent of world total throughput. Table 3.4 shows the container
throughput of the top ten global terminal operators and their capacity expansion.
7 For example, Eurogate in 1999 (Eurokai, BLG), Hutchison Port Holdings in 2001 (increase of share in ECT terminal from 35 to75.5 per cent, ICTSI’s overseas division), PSA Corp. in 2001 (purchase of 80 per cent shares of Hesse Noord Natie, Belgiumterminal operator), Dubai Port International in 2004 (purchase of CSX World Terminals).
Table 3.4 Container throughput by global terminal operators, 2004 (Various sources)
Custom clearance procedure Surveying carriers and LLPs
Cargo tracing serve
Distribution Centre Total operation area of DC Referencing statistics data
(DC) The equipment and information system of DC Requirements of the advanced
Service scope supply chain management
(Surveying LLPs)
Info-structure Port community system Requirements of the advanced
Information interchange with customs supply chain management
Information exchange between the intermodal (Surveying LLPs)
organizations
* LLPs: Lead Logistics Providers who are responsible for managing the primary interface between the customer and other logistics
providers.
Chapter 3: The port industry 39
Case Study 3.3 shows an example of shipping line’s perspective in selecting hub ports.
Case Study 3.3 A shipping line’s perspective of how to select a hub port
No or little deviation from the main routes
Central location in the area to allow feeder network to serve in a respectable time
Modern and large port infrastructure allowing competitive productivity and immediate availability of berths/cranes
Limited paperwork requirements from local authorities
Competitive costs
Hub port with local markets is of course a plus
Regional hinterland via intermodalism is an extra plus.
(Whitelaw, 2002)
Most major ports in the world have tried to meet these above mentioned requirements for hub ports
through exploring many new policies on the port organization, port facilities, regulation etc. Policy
guidelines for ports and governments can be outlined as follows:
� redefine port governance and organizations to tackle emerging issues
� privatization and promotion of partnership between public and private sectors in order to
enhance efficiencies and productivity
� launching port development projects such as expanding container terminals, deepening
approach channel and depth alongside quay, purchasing advanced quayside equipment,
assigning more number of quayside cranes to a vessel.
� deregulation for shipping, logistics, private sector involvement
� establishing port cluster by:
• exploring free port system
• introducing free trade zones for international logistics industry,
• developing industry complexes around ports
• and concentrating logistics related industry including shipbuilding, ship-equipment,
ship-spare parts, maritime training centre, exhibition and conference centre,
research institutes etc.
� developing intermodal infrastructures such as railway, roads, inland waterways, inland
container depots
� strengthening marketing strategy
� introduction of information technology such as edi and e-commerce
� increase of partnership with local community and other government organizations such as
customs organization.
However, many ports are faced with impediments to implementing their ambitious policies. For example,
port development projects generally require a huge budget. In 1998, more than 20 billion dollars were
earmarked around the world for port development projects. Forty per cent of this, that is, 8 billion dollars,
40 Free Trade Zone and Port Hinterland Development
was in Asia alone, and this is a rather conservative estimate (Drewry, 1999; Haralambides, 2000). To
secure a port development budget, many ports have tried to attract private sector participants such as
stevedoring companies or ocean carriers through deregulation and preferential incentives. This policy to
attract private sector in port development is also aimed at improving efficiencies and productivity by
utilizing the expertise of the private sector. Even if ports are successful in attracting private sector
participation in their development projects, they are still under pressure when attempting to secure their
development budget because in many cases involvement of private companies is through a joint venture
with the port authority (or other private sector organizations), or investment for part of whole structures.
The space for port expansion is usually scarce because port location is traditionally near the commercial
centre of a city. Many ports have suffered from this problem when they try to establish an ambitious port
development project. In this regard ports should reserve enough land space for future development.
Some ports have also been threatened by the local community’s demand for commercializing the port
area, introducing housing, waterfront parks and other commercial developments. All this mean that the
land price in the port area may be too expensive to maintain logistics activities.
In case of developing intermodal facilities, there are many government bodies involved, which means
there are likely to be difficulties in coordination among government organizations involved. This may act
as a barrier to the promotion of multimodal logistics because of the lack of consensus and the different
priorities among the organizations.
Ports also face a plethora of environmental legislation, which makes the procedure for obtaining consents
more complex and more time consuming. It is, of course, important that there is legislation in place to
provide adequate safeguards to protect the environment. Ports, by definition, have to be at the sea-land
interface and the coastal zone tends to be an area where environmental sensitivities are high.
Decision makers should consider all these potential impediments together with policy guidelines already
outlined when they are planning port development projects in order to minimize the cost and time of
implementing relevant projects. Otherwise there is the strong possibility that their vision for a hub port
cannot be achieved
Case Study 3.4 Algeciras, Spain
Algeciras, located near Gibraltar at the entrance to the Mediterranean, was established as a pure transhipment
facility by both Maersk and Sealand in the 1970s. In 1999, it ranked 22nd in the world, having handled two
million TEUs, an increase of 9.1 per cent from 1998 and almost 25 per cent from 1997. Maersk Sealand will
consolidate the two companies’ facilities into one that has a capacity of close to three million TEUs. During the
period 1998-2002, the terminal is being expanded by the Algeciras Port Authority at a cost of US$ 200 million,
while Maersk has ordered three post-panamax cranes and six rubber-tired yard gantries, a total investment
valued at over US$ 30 million. Algeciras has no hinterland; it exists merely as a pivot point for the convergence of
Maersk-Sealand’s east-west and North-South services. ‘Algeciras fits the role of a North-South and east-west
transhipment port to perfection, and the potential of calling at Algeciras is unmet’ (Richardson 1998). Algeciras
has benefited from the full commitment of both Maersk and its former rival and now fully merged partner,
Sea-Land, which developed the port into a major transhipment hub.
(Source: Cirtwill et al., 2001)
Case Study 3.5 Freeport, Bahamas
Located 65 nautical miles from the coast of Florida, Freeport, Bahamas, was built by the largest container-
terminal operator in the world, Hutchison Port Holdings, to exploit Freeport’s location astride several north-south
and east-west trade lanes. Three years ago, Freeport handled less than 11,000 TEU; in 1999, it was expected to
handle over 750,000.
Chapter 3: The port industry 41
The terminal was designed to handle the largest vessels afloat, transiting the major east-west trade lanes, and
transhipping cargo for the Caribbean and South America. In the words of one of HPH’s executives, ‘The first thing
that struck me was Freeport’s position – a lot of trade lanes merge here’ (Adams, 1998). As a Maersk executive
has observed, ‘Any combination is possible from here because you can reach any point in the world’.
Freeport Container Port is a joint venture between HPH and Grand Bahama Development Company, of which
HPH owns 50 per cent. Phase I of this development cost US$ 78.3 million. The facility’s initial capacity was
560,000 TEU, and it boasted four post-panamax gantry cranes. Expected additional improvements will include
366 metres of new quay, three additional post-panamax cranes, and 12 straddle carriers. The whole complex will
comprise three berths of 915 metres, seven super post-panamax cranes, and 22 straddle carriers, with total
capacity of 950,000 TEU. The port’s owners also plan to explore the feasibility of linking the transhipment
terminal’s operations to the nearby Freeport International Airport.
Florida’s ports fear Freeport’s impact, and many of them are gearing up with feeder services. Freeport’s
47- foot-deep channel ‘beckons large vessels to transload containers to and from large ships that might ignore the
largest American ports entirely and tie up where non-union port gangs and shortline railroads congregate’ (Wilner
1999). Freeport is meant to be a deeper, cheaper rival to Miami, Jacksonville, and perhaps even Savannah. Its
costs are significantly lower with lift rates reportedly one-half what they are in Miami. There are no unions and
few government restrictions, and HPH pays no taxes on its Freeport earnings. Present customers include
Mediterranean Shipping Co. and Maersk-Sealand, which, combined, account for 85 per cent of the port’s
throughput. Only four per cent is destined for the local market.
(Source: Cirtwill et al., 2001)
Case Study 3.6 Gioia Tauro, Italy
Medicenter Container Terminal (MCT) in Gioia Tauro, located in southern Italy, started its operation in 1995. In
1997 its container throughput reached 1.45 million TEU and 3.15 million TEU in 2003. Occupying 185 acres, it
has eight berths, 14 post-panamax cranes, 2,450 metres of quay length, with up to 15 metres of water alongside,
and 3,000 metres of on-dock rail.
MCT is owned by Contship Italia, formerly an Italian container line (now owned by CP Ships), in partnership with
Ecklemann-Eurokai of Hamburg. It is a classic transhipment hub, located virtually in the centre of the
Mediterranean. Recently Maersk Sealand was granted a dedicated terminal area within the port, in return for
taking a 10 per cent stake in the terminal operating company.
The port is facing increased competition from several other Italian ports – both older ones, such as Naples and
Genoa, and newer ones, like Taranto and Caligari. The port is now beginning to look beyond transhipment,
which represents an estimated 65 per cent of its traffic base, to expanding its role as a gateway for Italy and
southern Europe.
(Source: Cirtwill et al., 2001)
Case Study 3.7 The Port of Los Angeles
A recent deal signed between the Port of Los Angeles and Maersk Line raises the bar for North American ports
and is probably a portent of future developments. In November 1999, Maersk Sealand reached an agreement
with the Port of Los Angeles to build an US$ 800 million, 484-acre container terminal, the largest in the United
States and one of the largest in the world. The port’s revenue from the lease will reportedly total more than
US$ 2 billion over the 25-year life of the contract. The contract commits the carrier to a minimum annual
throughput that will generate sufficient revenue to amortize the port’s investment. Revenue in excess of the
minimum will be shared with Maersk Sealand. The greater the volume of containers the carrier puts through its
facility once the guarantee is met, the greater its share of revenue.
(Source: Cirtwill et al., 2001)
42 Free Trade Zone and Port Hinterland Development
3.6.2 Logistics centres
Globalization has been the most influential phenomenon among the major trends in the world economyover the last two decades. It has been recognized as an inevitable technologically driven process that hasdramatically increasing commercial and political relations between people in different countries. Unlikemost of the 20th century, during which production remained national, industrial production has becomeincreasingly international over the last 20 years increasing competition among businesses the world over.
This globalization has created a real-time global marketplace and a business focus and concentration onmaximizing comparative advantage when sourcing and supplying product. In terms of the global supplychain, global companies have been forced to work simultaneously within two different systems whileenhancing efficiency and effectiveness — centralized and decentralized maritime activities — even asinternational supply chains have become complex and logistics models continuously evolve. Businessstructures must be made after considering both intercontinental and regional or local aspects.
Many factors such as standardization in production components, low transportation cost and therevolution of information and communication technology make it possible for companies to source rawmaterials and product components all over the world. Raw materials, parts, and semi-finished productscan be brought together at a single or, a few locations, to significantly reduce overall costs without anylocal interference to product quality. Thus, centralization of business structure for economies of scale is auseful strategy in enhancing global competitiveness.
At the same time, cultural differences in the marketplace or the importance of response time demandglobal companies to customize or localize their products in accordance with local consumers tastes.Decentralization of business structure or postponement of final assembly must, therefore, be considered,too.
Many companies have experienced significant cost savings through integrating existing logistics placesinto a few integrated logistics centres, and some other companies have achieved success in penetrationof specific markets by thorough localization strategies such as quick response times or different designand functions. In this way, ports have a great chance to play an important role as the centre of globallogistics activities. However, because business structures of supply chain networks are decided wholly bya company s specific strategy, ports dreaming to become a hub have been struggling to meet andprovide the global standard in terms of hardware and software by investing for world class infrastructuresand by experimenting with several policies.
One of the major trends in port industry is to develop logistics related zones such as free trade zones orinternational logistics zones to accommodate value-added logistics activities and to attract global logisticscompanies. The advantage of special logistics-oriented zones (whether or not they are designated asfree trade zones providing tax related incentives) is that they attract foreign investment and create newemployment. In addition, successful logistics zones are able to secure freight volume which may begenerated by established logistics companies, and to develop their ports as hub ports. Many ports havebeen trying to develop their ports towards hub ports to take advantage of these benefits throughdeveloping the necessary infrastructures and marketing a variety of advantages and incentives. Thus,competition among ports towards global logistics centres or global load centres is getting severer.
Considering this growing competition among global logistics centres, most ports have been actively tryingto attract regional distribution centres of multinational logistics and manufacturing companies. In thisregard, ports and governments are placing great emphasis on establishing strong support fromgovernments, which may guarantee a reliable business environment and quality administrative support.Case Study 3.8 below shows why Reebok selected the Port of Rotterdam as its logistics centre, and thiscase is useful in understanding what policies are prerequisites for ports to develop as global load centresand attract global companies. Case Study 3.9 higlights the Distripark in the Port of Rotterdam.
Chapter 3: The port industry 43
Case Study 3.8 Reebok Logistics centre in the Maasvlakte Distripark
Value adding activities have been created in many ports to enhance trade and generate employment for the local
area. The key ingredients are efficient port operation, availability of good transport services and attractive prices
for land, labour and energy. The newly opened Reebok state-of-the-art logistics centre in Rotterdam illustrates
how one port helped create a value-adding service that generates employment for 300 personnel and contributes
$6 million in direct income to the local community.
Reebok product line and logistics
Reebok has two product lines, footwear and apparel. In 1998, footwear accounted for 57 per cent of international
sales, apparel 43 per cent. Reebok products are actively marketed in 170 countries or territories. The U.K. is the
largest market for Reebok products in Europe, representing 30 per cent of total European sales. Spain is another
big market for Reebok products. Almost all footwear is supplied from plants in the Far East. Most apparel is
supplied from plants in Southern Europe. Footwear moves in containers from the Far East. Apparel moves by
truck and container from plants in Portugal, Greece, Turkey, etc.
Restructuring of logistics activities
As part of a global restructuring of logistics activities, Reebok in 1995 decided that warehousing and distribution
activities in Europe should be consolidated. In place of having warehousing facilities in each market, a bulk
logistics facility would be established in mainland Europe to supply pick-and-pack warehouses in the U.K. and
Spain, as well as directly supply other markets in Europe. Except for some very large accounts (which are
serviced direct) and apparel for Southern Europe (which is warehoused in Spain), all product flow to the European
market would pass through this logistics centre. France, Belgium and the Netherlands were considered as
potential locations. Following assessment of each of these locations, Reebok decided to locate the logistics
centre in the Netherlands. The site chosen is in the newly created Distripark 3 in Maasvlakte at the ocean edge of
the port property. In November 1998 the facility began receiving product.
Why the Port of Rotterdam was selected
Reebok had a variety of reasons for choosing this site. It is close to the new deepwater terminal in the port of
Rotterdam, a container handling facility that is generally regarded as one of the most advanced and capable
terminals in Europe. The location is on the coast, which provides easy access to short sea transport to the
U.K. market. There is a good supply of warehousing labour in the Rotterdam area, despite the fact that the
general labour market is tight. Most people in the Netherlands understand English, which was considered by
Reebok to be important. Customs in the Netherlands is considered to be efficient and business friendly. While
not an advantage, labour costs and regulations concerning labour practices were considered to be similar to
those of other countries in Europe. But most importantly, space was available and the port wanted to have
a launching customer in the new Distripark. So the port, in combination with the municipal government,
proactively pursued Reebok and provided strong incentives to locate the facility in Maasvlakte. Based on a six-
year operating lease with a five-year renewal option and substantial residual value guarantees by Reebok, the
port funded construction of the state-of-the-art 700,000 sq. ft. logistics facility. The port also created the
necessary infrastructure to connect the facility to the adjacent container terminal, facilitated creation of bus
service fitted to the plant shift system and provided a contact person to deal with problems and issues. Reebok
describes its relationship as a partnership with the port.
(World Bank, 2001)
44 Free Trade Zone and Port Hinterland Development
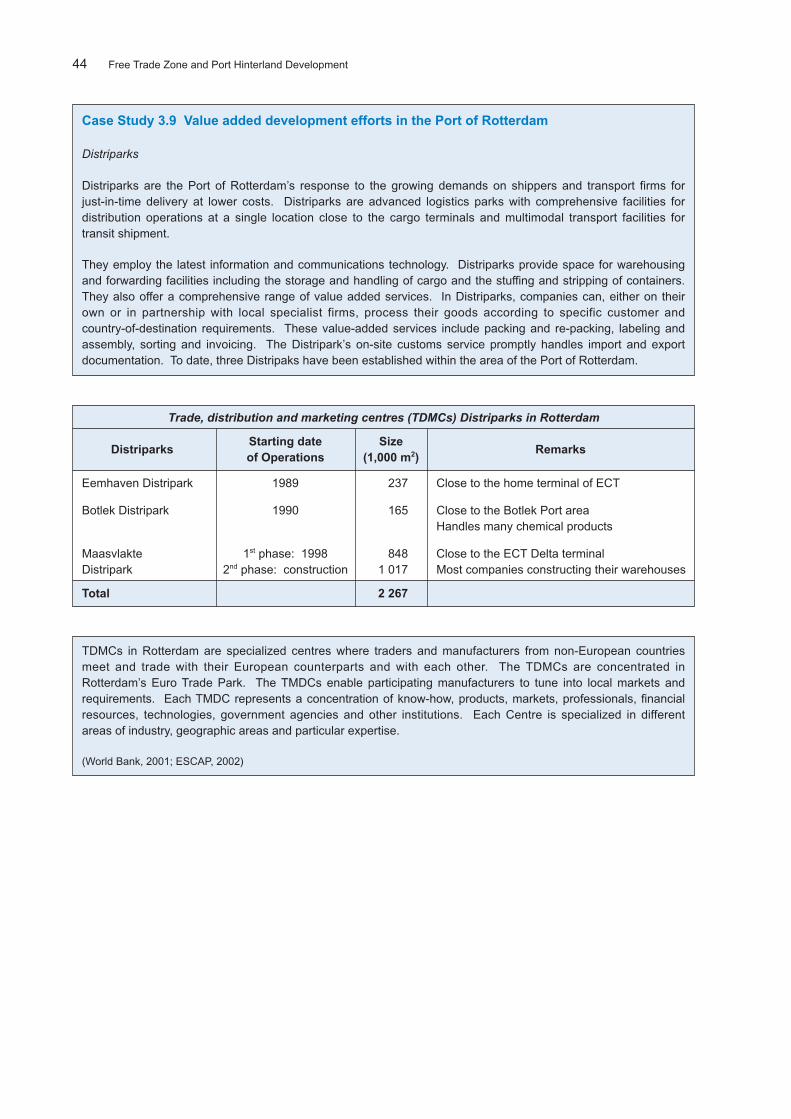
Case Study 3.9 Value added development efforts in the Port of Rotterdam
Distriparks
Distriparks are the Port of Rotterdam’s response to the growing demands on shippers and transport firms for
just-in-time delivery at lower costs. Distriparks are advanced logistics parks with comprehensive facilities for
distribution operations at a single location close to the cargo terminals and multimodal transport facilities for
transit shipment.
They employ the latest information and communications technology. Distriparks provide space for warehousing
and forwarding facilities including the storage and handling of cargo and the stuffing and stripping of containers.
They also offer a comprehensive range of value added services. In Distriparks, companies can, either on their
own or in partnership with local specialist firms, process their goods according to specific customer and
country-of-destination requirements. These value-added services include packing and re-packing, labeling and
assembly, sorting and invoicing. The Distripark’s on-site customs service promptly handles import and export
documentation. To date, three Distripaks have been established within the area of the Port of Rotterdam.
TDMCs in Rotterdam are specialized centres where traders and manufacturers from non-European countries
meet and trade with their European counterparts and with each other. The TDMCs are concentrated in
Rotterdam’s Euro Trade Park. The TMDCs enable participating manufacturers to tune into local markets and
requirements. Each TMDC represents a concentration of know-how, products, markets, professionals, financial
resources, technologies, government agencies and other institutions. Each Centre is specialized in different
areas of industry, geographic areas and particular expertise.
(World Bank, 2001; ESCAP, 2002)
Trade, distribution and marketing centres (TDMCs) Distriparks in Rotterdam
DistriparksStarting date Size
Remarksof Operations (1,000 m2)
Eemhaven Distripark 1989 237 Close to the home terminal of ECT
Botlek Distripark 1990 165 Close to the Botlek Port area
Handles many chemical products
Maasvlakte 1st phase: 1998 848 Close to the ECT Delta terminal
Distripark 2nd phase: construction 1 017 Most companies constructing their warehouses