33
§3.1–Measures of Center Tom Lewis Fall Term 2009 Tom Lewis () §3.1–Measures of Center Fall Term 2009 1/8
| Date post: | 30-Jan-2018 |
| Category: |
Documents |
| Upload: | truongthuan |
| View: | 216 times |
| Download: | 1 times |

§3.1–Measures of Center
Tom Lewis
Fall Term 2009
Tom Lewis () §3.1–Measures of Center Fall Term 2009 1 / 8

Outline
1 The mean
2 The median
3 The mode
4 Comparisons of measures of center
5 The sample mean
Tom Lewis () §3.1–Measures of Center Fall Term 2009 2 / 8

The mean
Definition (The mean)
The mean of a data set is the sum of the observations divided by thenumber of observations. In other words, it is the average value of the dataset.
Problem
Compute the mean of the ACT data. Use the three different methods:
Calculator method 1
Calculator method 2
R
Tom Lewis () §3.1–Measures of Center Fall Term 2009 3 / 8
The median
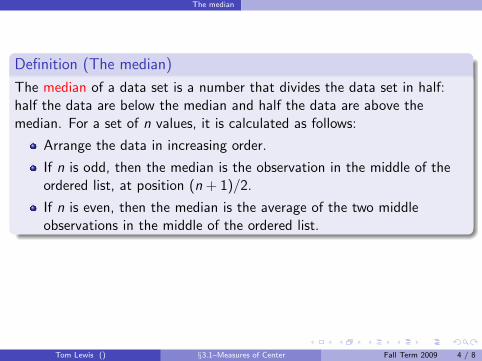
Definition (The median)
The median of a data set is a number that divides the data set in half:half the data are below the median and half the data are above themedian. For a set of n values, it is calculated as follows:
Arrange the data in increasing order.
If n is odd, then the median is the observation in the middle of theordered list, at position (n + 1)/2.
If n is even, then the median is the average of the two middleobservations in the middle of the ordered list.
Problem
Find the median of the ACT data.
Tom Lewis () §3.1–Measures of Center Fall Term 2009 4 / 8
The median
Definition (The median)
The median of a data set is a number that divides the data set in half:half the data are below the median and half the data are above themedian. For a set of n values, it is calculated as follows:
Arrange the data in increasing order.
If n is odd, then the median is the observation in the middle of theordered list, at position (n + 1)/2.
If n is even, then the median is the average of the two middleobservations in the middle of the ordered list.
Problem
Find the median of the ACT data.
Tom Lewis () §3.1–Measures of Center Fall Term 2009 4 / 8

The mode
Definition (The mode)
The mode of a data set is the most frequent observation in the data set.Please note:
If no value occurs more than once, then the data set has no mode.
Otherwise, any value that occurs with greatest frequency is a mode ofthe data set.
Tom Lewis () §3.1–Measures of Center Fall Term 2009 5 / 8
Comparisons of measures of center
Problem
Find the mode of the ACT data.
Tom Lewis () §3.1–Measures of Center Fall Term 2009 6 / 8
Comparisons of measures of center
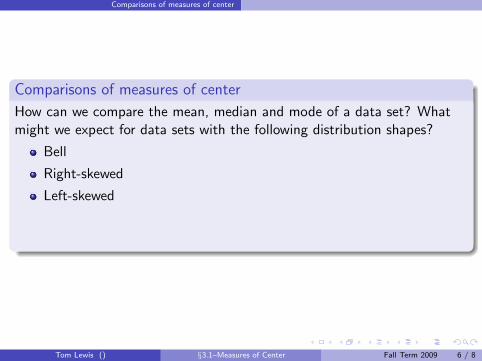
Comparisons of measures of center
How can we compare the mean, median and mode of a data set? Whatmight we expect for data sets with the following distribution shapes?
Bell
Right-skewed
Left-skewed
Uniform
J shaped
Tom Lewis () §3.1–Measures of Center Fall Term 2009 6 / 8

Comparisons of measures of center
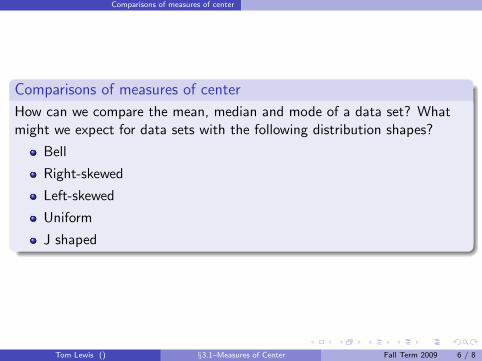
Comparisons of measures of center
How can we compare the mean, median and mode of a data set? Whatmight we expect for data sets with the following distribution shapes?
Bell
Right-skewed
Left-skewed
Uniform
J shaped
Tom Lewis () §3.1–Measures of Center Fall Term 2009 6 / 8
Comparisons of measures of center
Comparisons of measures of center
How can we compare the mean, median and mode of a data set? Whatmight we expect for data sets with the following distribution shapes?
Bell
Right-skewed
Left-skewed
Uniform
J shaped
Tom Lewis () §3.1–Measures of Center Fall Term 2009 6 / 8

Comparisons of measures of center
Comparisons of measures of center
How can we compare the mean, median and mode of a data set? Whatmight we expect for data sets with the following distribution shapes?
Bell
Right-skewed
Left-skewed
Uniform
J shaped
Tom Lewis () §3.1–Measures of Center Fall Term 2009 6 / 8
Comparisons of measures of center
Comparisons of measures of center
How can we compare the mean, median and mode of a data set? Whatmight we expect for data sets with the following distribution shapes?
Bell
Right-skewed
Left-skewed
Uniform
J shaped
Tom Lewis () §3.1–Measures of Center Fall Term 2009 6 / 8

Comparisons of measures of center
A summary of measures of center
Mean
This is a standard measure of center for quantitativedata.It can be influenced by outlying values (non-resistant).
Median
The median resists the influence of outliers.It does not always seem to be a faithful measure of thecenter.
Mode
Especially helpful for qualitative data.Can be a misleading measure if the data set is small.
Tom Lewis () §3.1–Measures of Center Fall Term 2009 7 / 8

Comparisons of measures of center
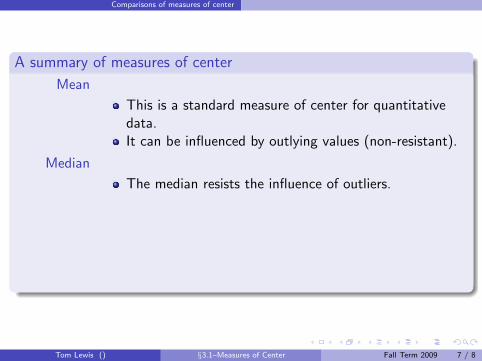
A summary of measures of center
Mean
This is a standard measure of center for quantitativedata.
It can be influenced by outlying values (non-resistant).
Median
The median resists the influence of outliers.It does not always seem to be a faithful measure of thecenter.
Mode
Especially helpful for qualitative data.Can be a misleading measure if the data set is small.
Tom Lewis () §3.1–Measures of Center Fall Term 2009 7 / 8

Comparisons of measures of center
A summary of measures of center
Mean
This is a standard measure of center for quantitativedata.It can be influenced by outlying values (non-resistant).
Median
The median resists the influence of outliers.It does not always seem to be a faithful measure of thecenter.
Mode
Especially helpful for qualitative data.Can be a misleading measure if the data set is small.
Tom Lewis () §3.1–Measures of Center Fall Term 2009 7 / 8

Comparisons of measures of center
A summary of measures of center
Mean
This is a standard measure of center for quantitativedata.It can be influenced by outlying values (non-resistant).
Median
The median resists the influence of outliers.It does not always seem to be a faithful measure of thecenter.
Mode
Especially helpful for qualitative data.Can be a misleading measure if the data set is small.
Tom Lewis () §3.1–Measures of Center Fall Term 2009 7 / 8
Comparisons of measures of center
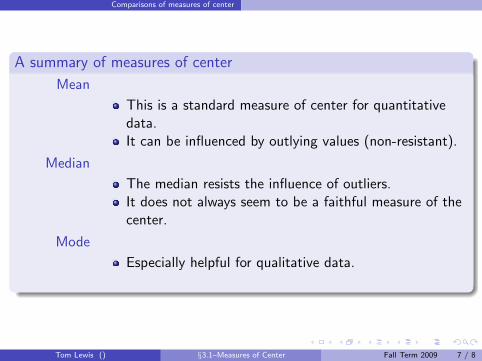
A summary of measures of center
Mean
This is a standard measure of center for quantitativedata.It can be influenced by outlying values (non-resistant).
Median
The median resists the influence of outliers.
It does not always seem to be a faithful measure of thecenter.
Mode
Especially helpful for qualitative data.Can be a misleading measure if the data set is small.
Tom Lewis () §3.1–Measures of Center Fall Term 2009 7 / 8

Comparisons of measures of center
A summary of measures of center
Mean
This is a standard measure of center for quantitativedata.It can be influenced by outlying values (non-resistant).
Median
The median resists the influence of outliers.It does not always seem to be a faithful measure of thecenter.
Mode
Especially helpful for qualitative data.Can be a misleading measure if the data set is small.
Tom Lewis () §3.1–Measures of Center Fall Term 2009 7 / 8
Comparisons of measures of center
A summary of measures of center
Mean
This is a standard measure of center for quantitativedata.It can be influenced by outlying values (non-resistant).
Median
The median resists the influence of outliers.It does not always seem to be a faithful measure of thecenter.
Mode
Especially helpful for qualitative data.
Can be a misleading measure if the data set is small.
Tom Lewis () §3.1–Measures of Center Fall Term 2009 7 / 8

Comparisons of measures of center
A summary of measures of center
Mean
This is a standard measure of center for quantitativedata.It can be influenced by outlying values (non-resistant).
Median
The median resists the influence of outliers.It does not always seem to be a faithful measure of thecenter.
Mode
Especially helpful for qualitative data.Can be a misleading measure if the data set is small.
Tom Lewis () §3.1–Measures of Center Fall Term 2009 7 / 8

The sample mean
Definition (The sample mean)
For a variable x , the mean of the observations for a sample is called asample mean and is denoted by x . If the sample data is {x1, x2, . . . , xn},then
x =sum of data
number of observations=
∑ni=1 xi
n=
∑xi
n
Tom Lewis () §3.1–Measures of Center Fall Term 2009 8 / 8
![The De Continuo of Thomas Bradwardine - Furman …math.furman.edu/~dcs/sandiego.pdf · History or philsophy? I Etienne Gilson, in Being and Some Philosophers: I [The] author may well](https://static.documents.pub/doc/80x56/5ba7b09e09d3f20c5f8b7e2b/the-de-continuo-of-thomas-bradwardine-furman-math-dcssandiegopdf-history.jpg)


