Completion Report Project Number: 35242-013 Loan Numbers: 2188-BAN/2189-BAN(SF) Grant: 0019 July 2019 Bangladesh: Gas Transmission and Development Project This document is being disclosed to the public in accordance with ADB’s Access to Information Policy.
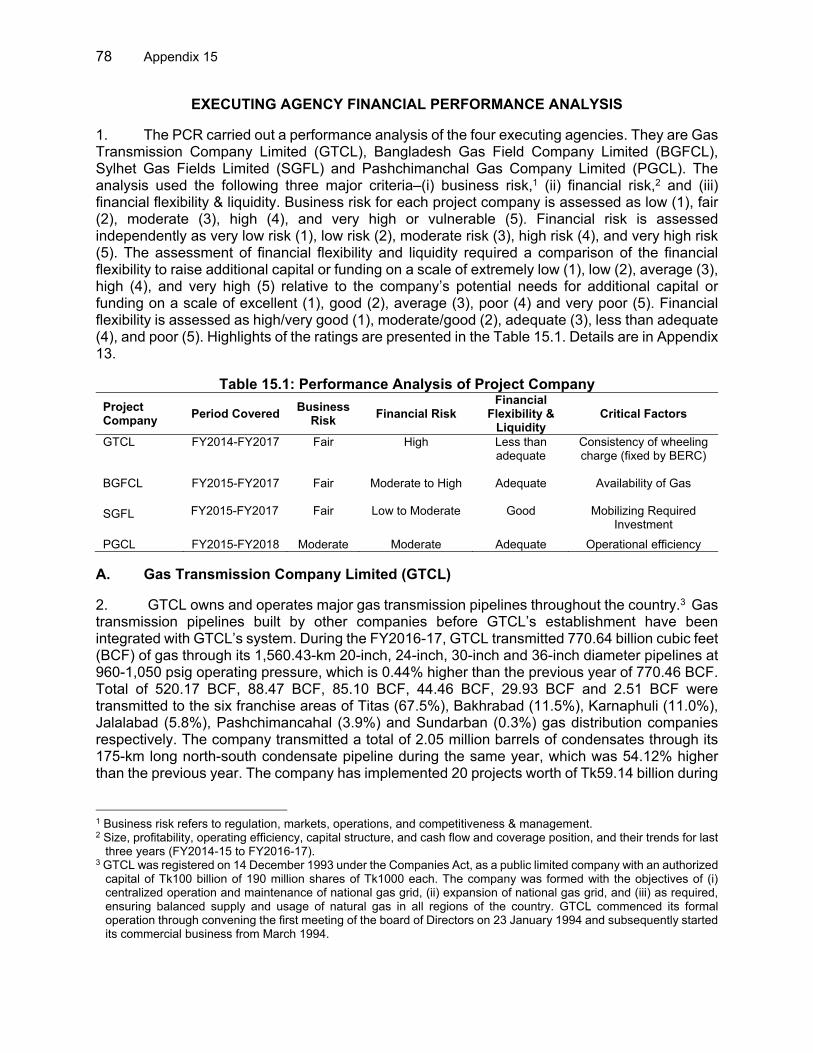
Transcript
Completion Report
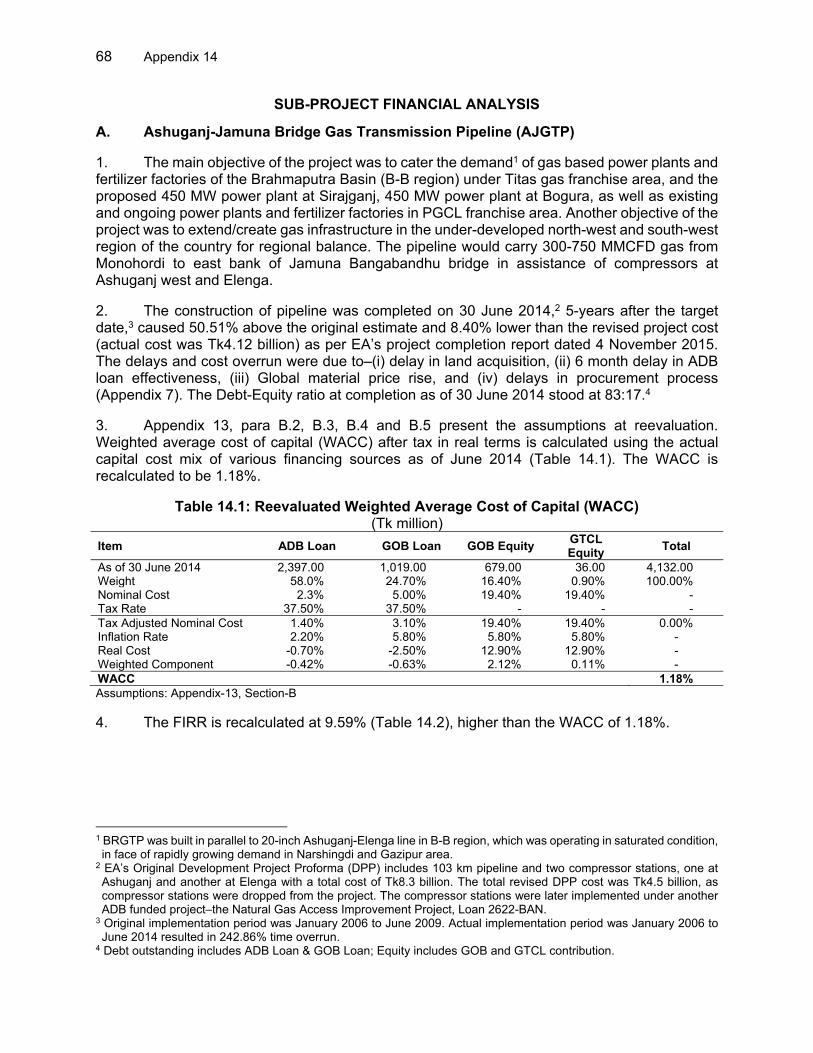
Project Number: 35242-013 Loan Numbers: 2188-BAN/2189-BAN(SF) Grant: 0019 July 2019
Bangladesh: Gas Transmission and Development Project This document is being disclosed to the public in accordance with ADB’s Access to Information Policy.
CURRENCY EQUIVALENTS
Currency unit – taka (Tk) At Appraisal At Project Completion (16 May 2005) (31 December 2016)
Tk1.00 = $0.06 $0.01 $1.00 = Tk64.45 Tk78.70
ABBREVIATIONS
ADB – Asian Development Bank BAPEX – Bangladesh Petroleum Exploration and Production Company Limited BERC – Bangladesh Energy Regulatory Commission BGFCL – Bangladesh Gas Fields Company Limited CCPP – combined cycle power plant CNG – compressed natural gas DMF – design and monitoring framework EMP – environmental management plan EMR – environmental management report EMRD – Energy and Mineral Resources Division EVC – electronic volume corrector GTCL – Gas Transmission Company Limited GTP – gas transmission pipeline HCU – Hydrocarbon Unit LNG – liquefied natural gas O&M – operation and maintenance OCR – ordinary capital resources PGCL – Pashchimanchal Gas Company Limited PCR – project completion report RRP – report and recommendation of the President SCADA – supervisory control and data acquisition SDR – special drawing rights SGFL – Sylhet Gas Fields Limited TGTDCL – Titas Gas Transmission and Distribution Company Limited WACC – weighted average cost of capital
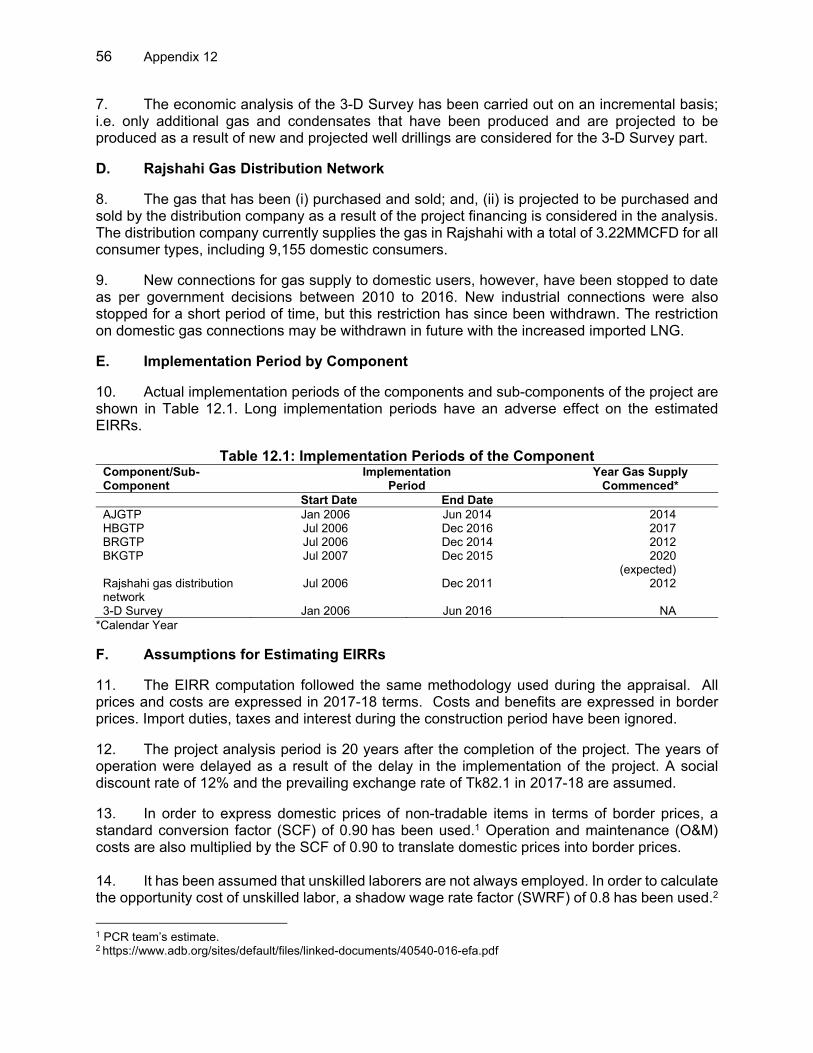
WEIGHTS AND MEASURES BCF – billion cubic feet km – kilometer MMBTU – million British thermal unit MCF – million cubic feet MMCFD – million cubic feet per day MW – megawatt TCF – trillion cubic feet
NOTES (i) The fiscal year (FY) of the government and its agencies ends on 30 June. FY before a
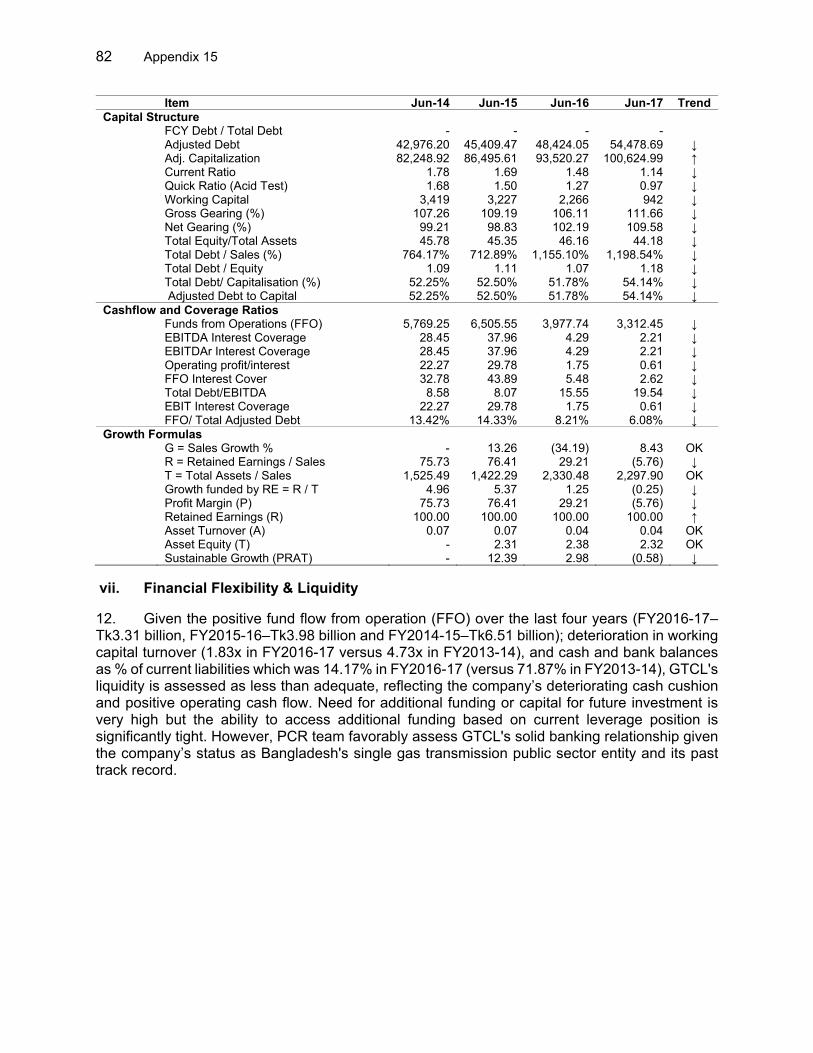
calendar year denotes the year in which the fiscal year ends, e.g., FY2018 ends on 30 June 2018.
(ii) In this report, "$" refers to US dollars.
Vice-President Shixin Chen, Vice President, Operations 1 Director General Hun Kim, South Asia Department (SARD) Director
In preparing any country program or strategy, financing any project, or by making any designation of or reference to a territory or geographic area in this document, the Asian Development Bank does not intend to make any judgments as to the legal or other status of any territory or area.
CONTENTS Page
BASIC DATA i MAP vii I. PROJECT DESCRIPTION 1 II. DESIGN AND IMPLEMENTATION 2
A. Project Design and Formulation 2 B. Project Outputs 3 C. Project Costs and Financing 7 D. Disbursements 7 E. Project Schedule 7 F. Implementation Arrangements 8 G. Consultant Recruitment and Procurement 8 H. Gender Equity 9 I. Safeguards 9 J. Monitoring and Reporting 10
III. EVALUATION OF PERFORMANCE 11 A. Relevance 11 B. Effectiveness 12 C. Efficiency 12 D. Sustainability 13 E. Development Impact 14 F. Performance of the Borrower and the Executing Agency 14 G. Performance of Cofinancier 14 H. Performance of the Asian Development Bank 14 I. Overall Assessment 14
IV. ISSUES, LESSONS, AND RECOMMENDATIONS 15 A. Issues and Lessons 15 B. Recommendations 15
APPENDIXES
1. Design and Monitoring Framework 16
2. Project Cost at Appraisal and Actual 19
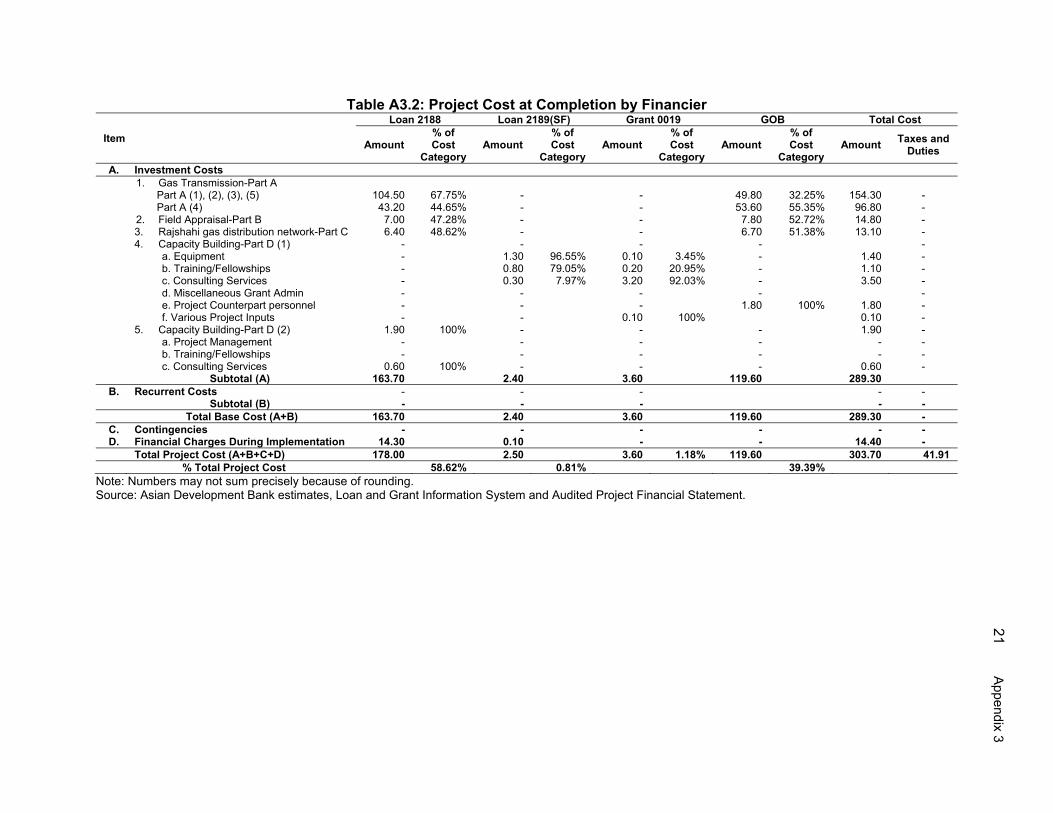
3. Project Cost by Financier 20
4. Disbursement of ADB Loan Proceeds 22
5. Implementation Schedule: Planned versus Actual 23
6. Contract Awards of ADB Loan Proceeds 24
7. Chronology of Main Events 25
8. Implementation of Safeguards 30
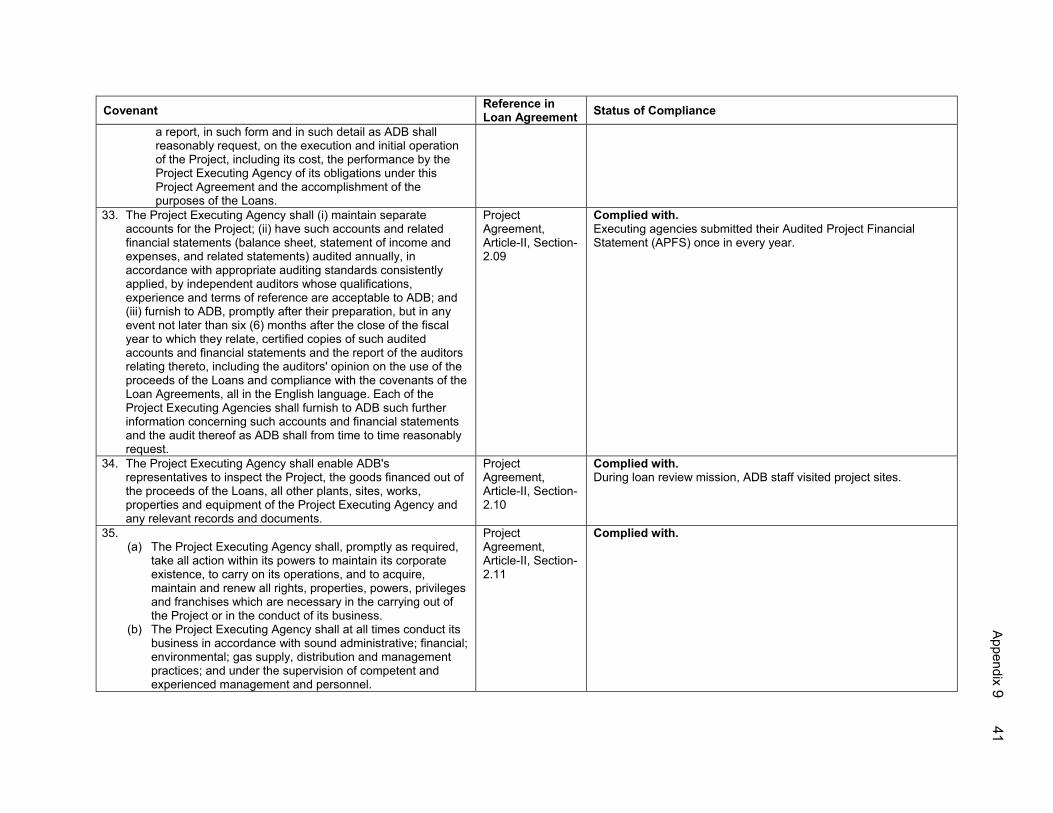
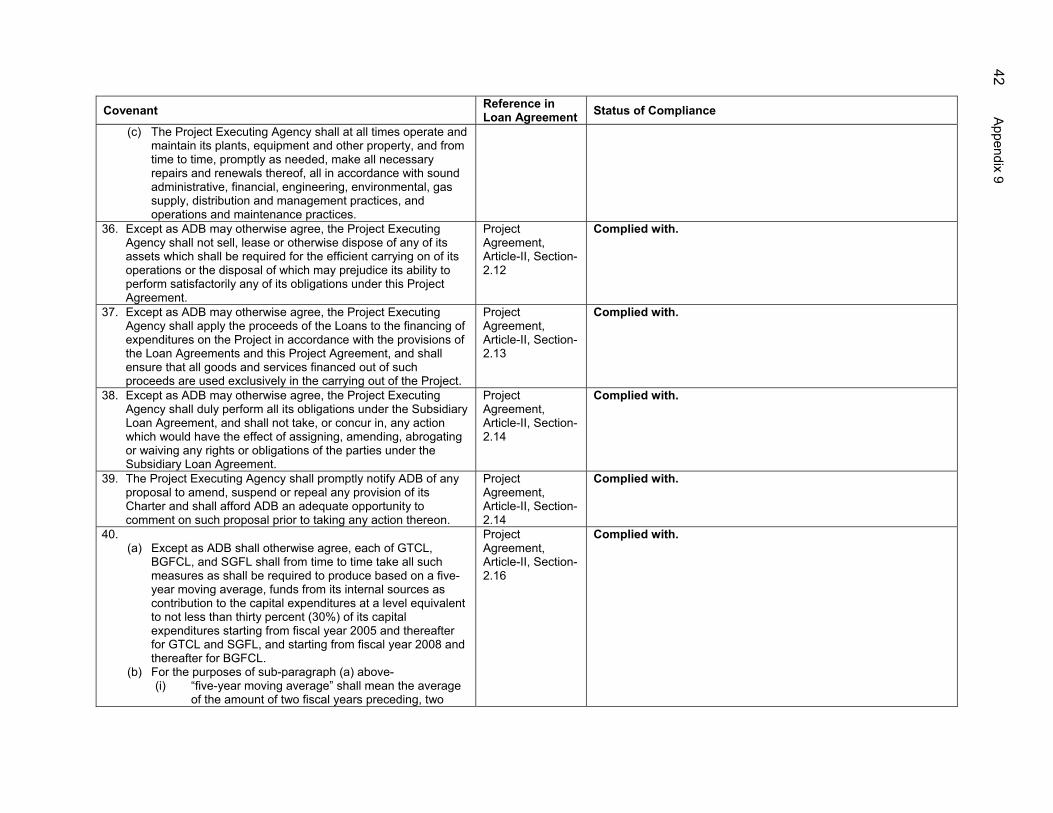
9. Status of Compliance with Loan Covenants 32
10. Weighting Factors to Determine Project Effectiveness 45
1. Country Bangladesh 2. Loan number and financing source 2188-BAN(OCR)/2189-BAN(SF)
Grant number 0019-BAN 3. Project title Gas Transmission and
Development Project 4. Borrower People’s Republic of Bangladesh 5. Executing agency Part-A: Gas Transmission Company
Limited (GTCL), Part-B: Bangladesh Gas Fields Company Limited (BGFCL) and the Sylhet Gas Fields Limited (SGFL) with Bangladesh Petroleum Exploration Company Limited (BAPEX) as implementing agency, Part-C: Pashchimanchal Gas Company Limited (PGCL), and Part-D: Petrobangla (including Grant 0019) in coordination with the Energy and Mineral Resources Division (EMRD) of the Ministry of Power, Energy and Mineral Resources and other concerned entities.
6. Amount of loan and grant
Loan 2188-BAN US$225,000,000 Loan 2189-BAN(SF) SDR3,401,000 Grant 0019-BAN US$5,000,000
7. Financing modality Project Lending B. Loan and Grant Data
1. Appraisal
– Date started 16 May 2005 – Date completed 23 May 2005
2. Loan and grant negotiations
– Date started 19 September 2005 – Date completed 20 September 2005
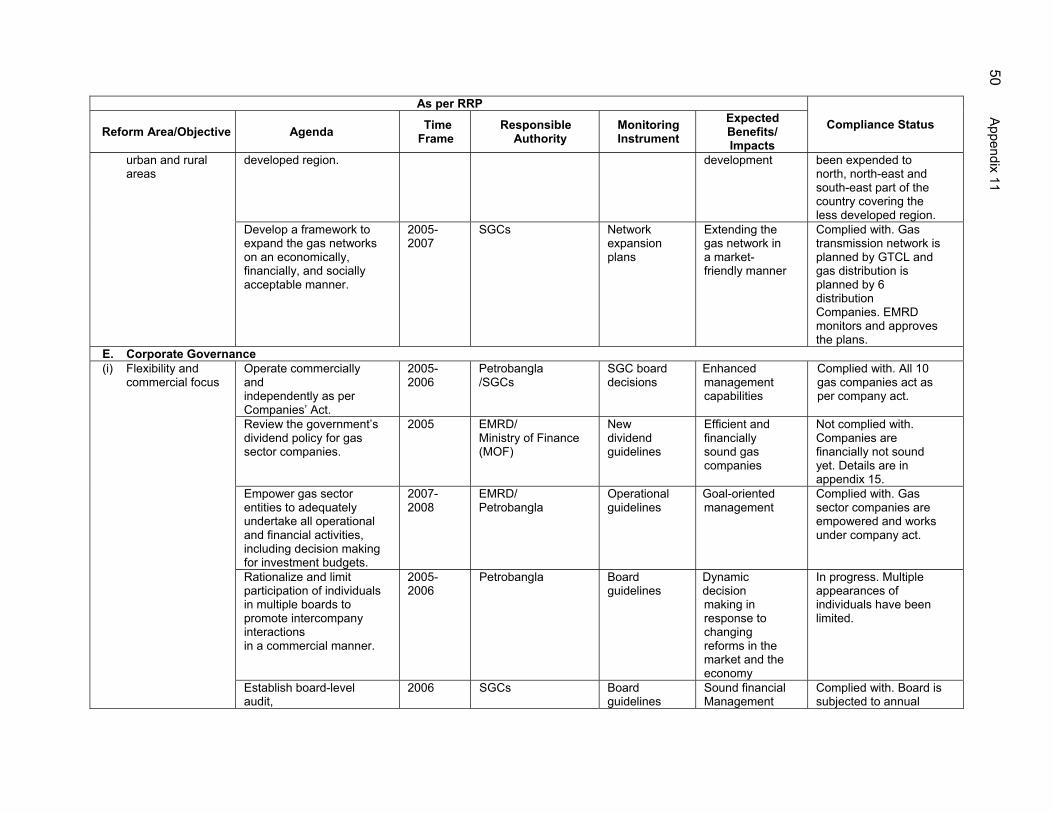
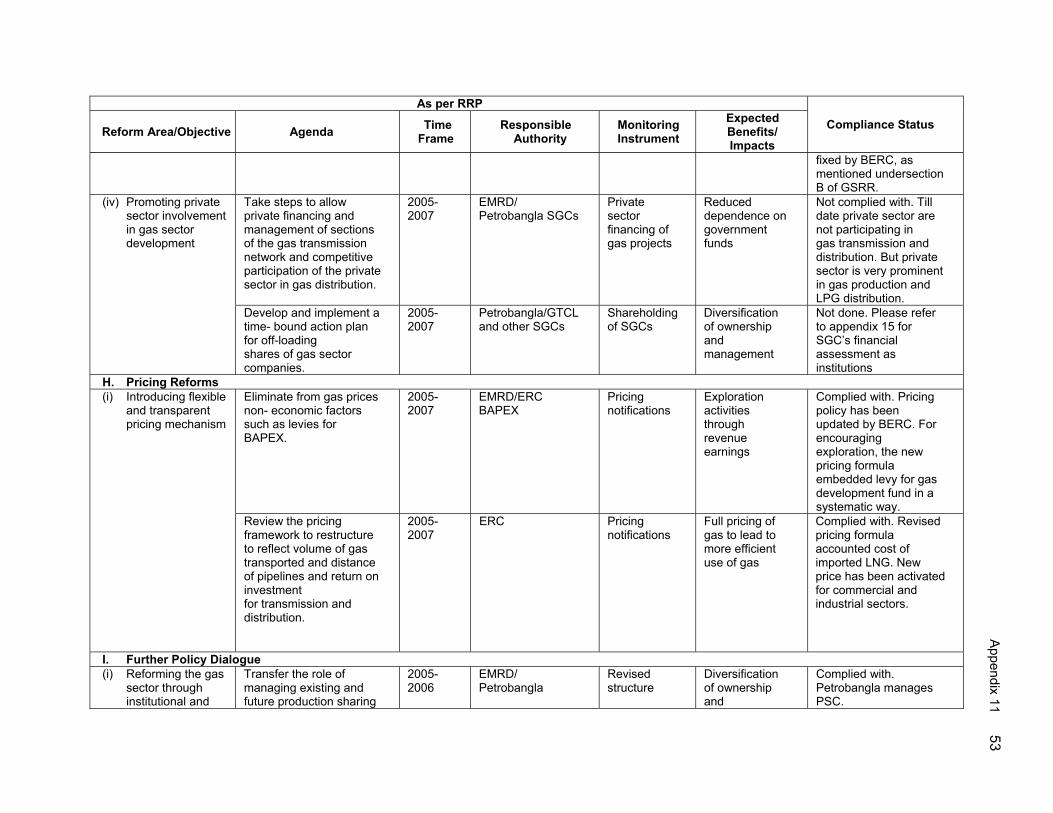
3. Date of Board approval
– Loan 2188, Loan 2189 & Grant 0019 27 October 2005
4. Date of agreement – Loan 2188-BAN 18 June 2006 – Loan 2189-BAN (SF) 18 June 2006 – Grant 0019 11 October 2006
ii
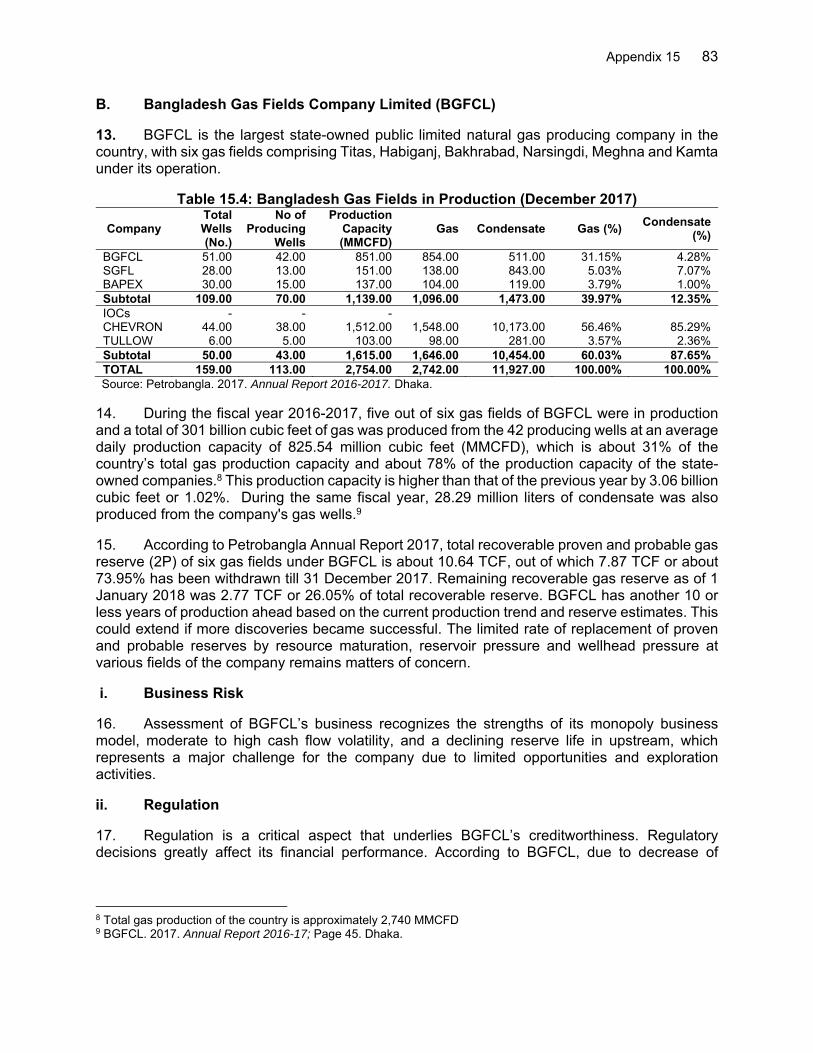
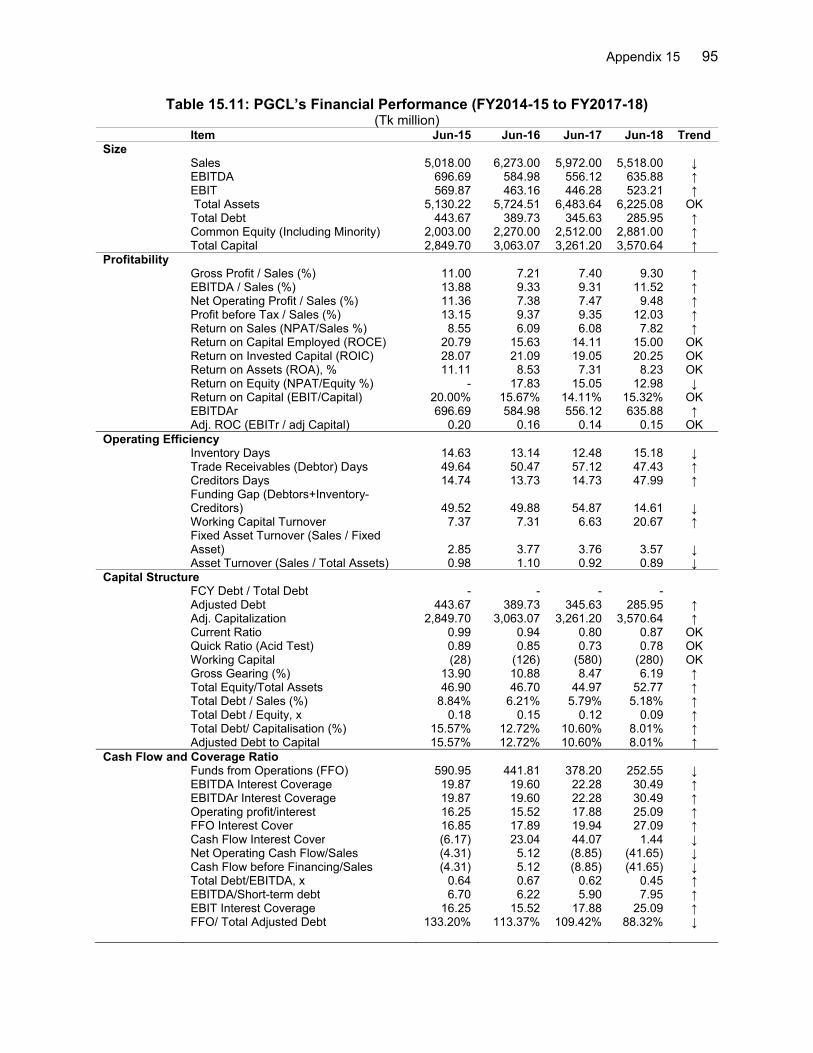
5. Date of loan or grant effectiveness Loan 2188-BAN
– In loan agreement 16 September 2006 (90 days) – Actual 28 November 2006 – Number of extensions 4
Loan 2189-BAN(SF)
– In loan agreement 16 September 2006 (90 days) – Actual 28 November 2006 – Number of extensions 4
Grant 0019
– In loan agreement 11 October 2006 – Actual 11 October 2006
6. Project completion date
Loan 2188-BAN – Appraisal 31 December 2010 – Actual 31 December 2016
Loan 2189-BAN(SF)
– Appraisal 31 December 2010 – Actual 31 December 2012
Grant 0019
– Appraisal 11 October 2011 – Actual 10 October 2013
7. Loan or grant closing date
Loan 2188-BAN – In loan agreement 31 December 2010 – Actual 31 December 2016 – Number of extensions 3
Loan 2189-BAN(SF)
– In loan agreement 31 December 2010 – Actual 31 December 2012 – Number of extension 1
Grant 0019
– In agreement 11 October 2011 – Actual 10 October 2013 – Number of extensions 2
8. Financial closing date
Actual – Loan 2188-BAN 18 May 2017 – Loan 2189-BAN(SF) 4 June 2013 – Grant 0019 13 February 2014
iii
9. Terms of loan Loan 2188-BAN
– Interest rate London Interbank offered rate (LIBOR) and 0.60%
– Maturity (number of years) 20 years – Grace period (number of years) 5 years
Loan 2189-BAN(SF)
– Interest rate 1% during grace period, thereafter 1.5% fixed
– Maturity (number of years) 32 years – Grace period (number of years) 8 years
10. Terms of Relending
Loan 2188-BAN – Interest rate 5% per annum – Maturity (number of years) 15 years – Grace period (number of years) 5 years – Second-step borrower (i) GTCL
(ii) SGFL (iii) BGFCL (iv) PGCL (v) Petrobangla
Loan 2189-BAN(SF)
– Interest rate 1% during grace period, thereafter 1.5% fixed
– Maturity (number of years) 32 years – Grace period (number of years) 8 years – Second-step borrower Petrobangla
11. Disbursements
a1. Dates: Loan 2188-BAN Initial Disbursement
30 April 2007 Final Disbursement
7 April 2017 Time Interval 119.80 months
Effective Date 28 November 2006
Actual Closing Date 18 May 2017
Time Interval 125.20 months
a2. Dates: Loan 2189-BAN(SF)
Initial Disbursement 28 January 2010
Final Disbursement 14 December 2012
Time Interval 34.50 months
Effective Date 28 November 2006
Actual Closing Date 4 June 2013
Time Interval 78.20 months
a3. Dates: Grant 0019
Initial Disbursement 27 May 2009
Final Disbursement 21 January 2014
Time Interval 55.00 months
Effective Date 11 October 2006
Actual Closing Date 13 February 2014
Time Interval 88.00 months
iv
b1. Amount: Loan 2188-BAN ($ million)
Category Original
Allocation (1)
Increased during
Implementation (2)
Canceled during
Implementation (3)
Last Revised
Allocation (4=1+2-3)
Amount Disbursed
(5)
Undisbursed Balance
(6=4-5)
1a. Part A (A1-A3, A5) 120.57 16.02 104.55 104.55 0 1b. Part A (A4) 43.93 0.71 43.22 43.22 0 2. Part B 12.36 5.37 6.99 6.99 0 3. Part C 8.57 2.22 6.35 6.35 0 4. Part D(II) 1.60 0.35 0 1.95 1.95 0 5. Project management 1.00 1.00 0 0 0 6. Training and fellowships 2.30 2.30 0 0 0 7. Consulting services 4.44 3.80 0.64 0.64 0 8. Interest and
commitment charge 16.80 2.47 14.33 14.33 0
9. Unallocated 13.43 13.43 0 0 0 Total in USD 225.00 0.35 47.32 178.03 178.03 0
Note. $26.801 million was cancelled on 19 August 2013 and $20.16 million on 18 May 2017.
b2. Amount: Loan 2189-BAN(SF) (SDR million)
Category
Original Allocation
(1)
Increased during
Implementation (2)
Canceled during
Implementation (3)
Last Revised
Allocation (4=1+2-3)
Amount Disbursed
(5)
Undisbursed Balance
(6=4-5)
1. Equipment 1.06 0.21 0.85 0.85 0 2. Training and fellowship 0.52 0.01 0.53 0.53 0 3. Consulting services 1.61 1.43 0.18 0.18 0 4. Interest 0.09 0.06 0.03 0.03 0 5. Unallocated 0.12 0.12 0 0 0 Total in SDR 3.40 0.01 1.82 1.59 1.59 0 Total in USD 5.00 0.17 2.71 2.46 2.46 0 Note. SDR1.08 million (equivalent $2.70 million) was cancelled on 4 June 2013.
b3. Amount: Grant 0019-BAN ($ million)
Category
Original Allocation
(1)
Increased during
Implementation (2)
Canceled during
Implementation (3)
Last Revised
Allocation (4=1+2-3)
Amount Disbursed
(5)
Undisbursed Balance
(6=4-5)
1. Equipment 0.40 0.30 0.10 0.10 0 2. Training and fellowship 0.70 0.50 0.20 0.20 0 3. Consulting services 2.40 0.80 0 3.20 3.20 0 4. Miscellaneous grant
administration 0.10 0.10 0 0 0
5. Project counterpart personnel
0.30 0.30 0 0 0
6. Various project input 1.10 1.00 0.10 0.10 Total in USD 5.00 0.80 2.20 3.60 3.60 0 C. Project Data
1. Project cost ($ million) Cost Appraisal Estimate Actual Foreign exchange cost 235.00 180.12 Local currency cost 178.40 123.60 Total 413.40 303.71
v
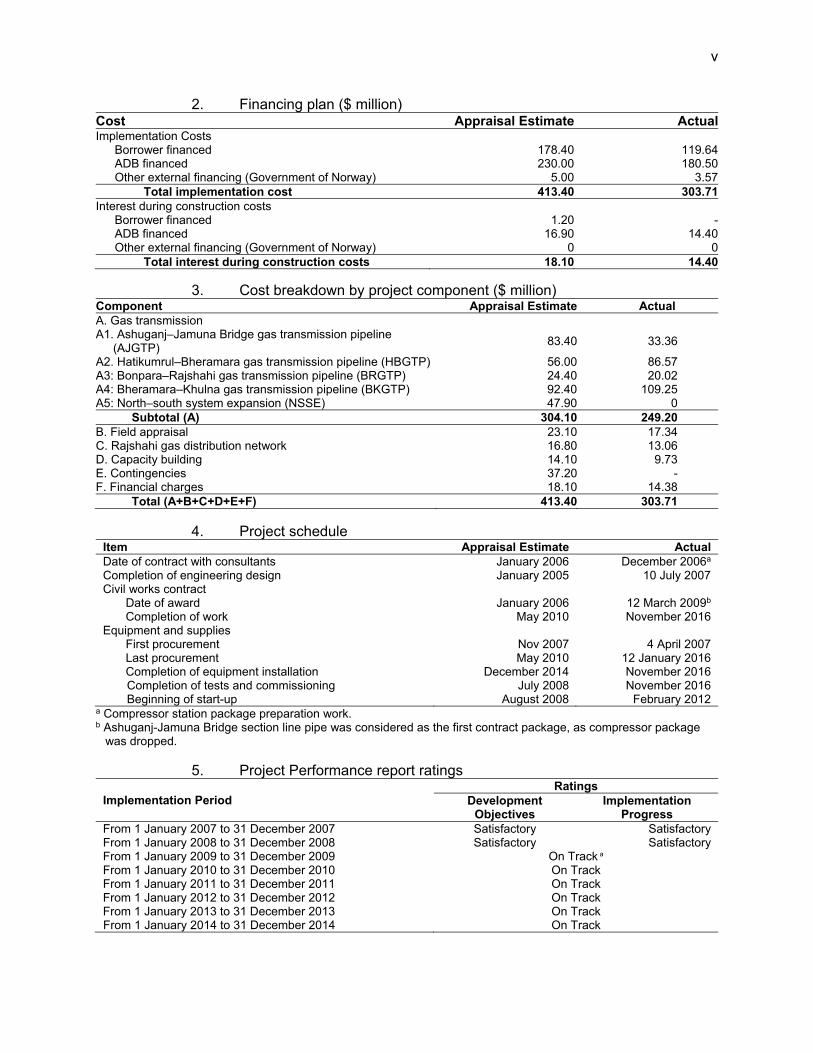
2. Financing plan ($ million) Cost Appraisal Estimate ActualImplementation Costs Borrower financed 178.40 119.64 ADB financed 230.00 180.50 Other external financing (Government of Norway) 5.00 3.57
Total implementation cost 413.40 303.71Interest during construction costs Borrower financed 1.20 - ADB financed 16.90 14.40 Other external financing (Government of Norway) 0 0
Total interest during construction costs 18.10 14.40
3. Cost breakdown by project component ($ million) Component Appraisal Estimate Actual A. Gas transmission A1. Ashuganj–Jamuna Bridge gas transmission pipeline
(AJGTP) 83.40 33.36
A2. Hatikumrul–Bheramara gas transmission pipeline (HBGTP) 56.00 86.57 A3: Bonpara–Rajshahi gas transmission pipeline (BRGTP) 24.40 20.02 A4: Bheramara–Khulna gas transmission pipeline (BKGTP) 92.40 109.25 A5: North–south system expansion (NSSE) 47.90 0
Subtotal (A) 304.10 249.20 B. Field appraisal 23.10 17.34 C. Rajshahi gas distribution network 16.80 13.06 D. Capacity building 14.10 9.73 E. Contingencies 37.20 - F. Financial charges 18.10 14.38
Total (A+B+C+D+E+F) 413.40 303.71
4. Project schedule Item Appraisal Estimate Actual Date of contract with consultants January 2006 December 2006a Completion of engineering design January 2005 10 July 2007 Civil works contract Date of award January 2006 12 March 2009b
Completion of work May 2010 November 2016 Equipment and supplies First procurement Nov 2007 4 April 2007 Last procurement May 2010 12 January 2016 Completion of equipment installation December 2014 November 2016
Completion of tests and commissioning July 2008 November 2016 Beginning of start-up August 2008 February 2012
a Compressor station package preparation work. b Ashuganj-Jamuna Bridge section line pipe was considered as the first contract package, as compressor package
was dropped.
5. Project Performance report ratings
Implementation Period Ratings
Development Objectives
Implementation Progress
From 1 January 2007 to 31 December 2007 Satisfactory Satisfactory From 1 January 2008 to 31 December 2008 Satisfactory Satisfactory From 1 January 2009 to 31 December 2009 On Track a From 1 January 2010 to 31 December 2010 On Track From 1 January 2011 to 31 December 2011 On Track From 1 January 2012 to 31 December 2012 On Track From 1 January 2013 to 31 December 2013 On Track From 1 January 2014 to 31 December 2014 On Track
vi
Implementation Period Ratings Development
Objectives Implementation
Progress From 1 January 2015 to 31 December 2015 On Track From 1 January 2016 to 31 December 2016 On Track
a ADB performance rating system changed during this time. D. Data on Asian Development Bank Missions
Name of Mission Date No. of
Persons
No. of Person-
Days
Specialization of Members
Fact-finding 26 Feb–10 Mar 2005 4 10 b, g, h, a Appraisal mission 16–23 May 2005 3 6 b, g. a, Consultation mission 9–12 Oct 2005 2 4 b, d Loan inception mission 10–18 Jul 2006 3 7 g, e, b, d Review mission 1 11–15 Feb 2007 2 5 g, d Special project administration mission 17–19 Dec 2007 2 3 g, c Review mission 2 14–23 Sep 2008 1 8 g, f Review mission 3 (handover mission) 2–11 Feb 2009 2 8 g, c Review mission 4 17 Feb –11 Mar 2010 2 17 c, e Review mission 5 24 Oct–4 Nov 2010 2 10 d, e Review mission 6 5–18 Aug 2011 2 12 d, e Safeguard review mission 5-10 Mar 2011 2 5 g, h Review mission 7 14 Feb–4 Mar 2012 2 17 d, e Review mission 8 11–30 May 2013 4 17 d, g, h, e Review mission 9 1–18 Feb 2014 4 16 d, e, g, h, c Review mission 10 14–28 Nov 2016 3 13 d, e, c Project completion report mission 9–17 Dec 2018 3 6 d, e, h
a = counsel, b = economist, c = procurement consultant or specialist, d = project officer, e = analyst, f = staff consultant, g = specialist, h = safeguards officer.
vii
MAP
I. PROJECT DESCRIPTION 1. In 2005, the per capita gross domestic product of Bangladesh was $484, and the poverty rate was 40%. Only 44% of population had access to electricity at a per capita consumption of 171 kWh, one of the lowest in South Asia.1 Inadequate energy supply was a key constraint on economic development. Natural gas—although pivotal in the economy since 1973 and shared 70% of the country’s primary energy in 2005—was under-used compared to the immense potential of domestic reserves.2 Insufficient investment, inadequate infrastructure, low extraction, lack of commercial orientation in tariffs, and poor maintenance all drove the underdevelopment of country’s gas sector. Bangladesh needed investment in the gas sector to grow the economy and reduce poverty. 2. In 2005, the country’s natural gas demand was 1,350 million cubic feet per day (MMCFD) and projected to reach 2,420 MMCFD in 2015 and 3,785 MMCFD in 2025, with an annual growth of 7%–8%.3 At project appraisal, there was a net 105 MMCFD demand–supply gap for gas, with forecast to reach 249 MMCFD in 2016 and 4,421 MMCFD in 2025. To meet growing demand, in 2002 the Asian Development Bank (ADB) helped Petrobangla4 develop a $3 billion investment plan for 2002–2020 for the gas sector—for exploration, field development, transmission, and distribution—aligned with the national gas sector reform roadmap (GSRR).5 ADB designed the Gas Transmission and Development Project as part of Petrobangla’s investment plan. 3. On 27 October 2005, ADB approved the Gas Transmission and Development Project, 6 which comprised:
(i) Loan 2188-BAN for $225 million from ADB’s ordinary capital resources (OCR); (ii) Loan 2189-BAN(SF) for $5 million equivalent (SDR3.4 million) from ADB’s Special
Funds (SF); and (iii) Grant 0019-BAN for $5 million from the Government of Norway, administered by
ADB under a cofinancing arrangement. 4. The loan agreements were signed on 18 June 2006 and declared effective on 28 November 2006; the grant agreement was signed and declared effective on 11 October 2006. Project implementation closed physically on 31 December 2016, and financially on 18 May 2017. The projected impact was the increased pace of economic development and the projected outcome was the enhanced use of natural gas by residential, industrial, and commercial users. Project outputs included (i) improved and expanded gas transmission and distribution networks in the project area; (ii) gas field appraisal to update estimated reserves and determine exact
1 World Bank. Indicators. https://data.worldbank.org/indicator/. 2 Proven recoverable gas reserves from 22 fields were estimated at 20.4 trillion cubic feet (TCF) in 2005, of which 5.09 TCF were extracted. Excluding the 9 TCF estimated underdeveloped and undiscovered reserves, 15.31 TCF of recoverable reserve remained.
3 From 2002 to 2004, national gas consumption grew at an annual rate of 8%, preceded by steady annual growth rate of 7% in the previous decade.
4 Petrobangla is a department under the Ministry of Power, Energy and Mineral Resources and is responsible for the exploration and development of the oil, gas, and mineral resources of the country. 5 Government of Bangladesh, Ministry of Power, Energy and Mineral Resource, Energy and Mineral Resource Division. 2005. Gas Sector Reform Roadmap. GSRR was adopted in 2005 for a period of 5 years. It aimed to support an investment plan for 2002–2020. The roadmap covered: (i) institutional and financial restructuring of gas sector companies to ensure long term financial sustainability, (ii) strengthening public–private partnership in the gas sector aimed to create an environment for private sector led growth, (iii) transforming gas companies to diversify ownership involving private investors, (iv) restructuring and unbundling gas sector institutions and enterprises; and (v) market oriented energy pricing reflecting energy parity, eliminating noneconomic factors and levies. It was approved as a national plan in 2009. 6 ADB. 2005. Report and Recommendation of the President to the Board of Directors: Proposed Loans Gas Transmission and Development Project (Bangladesh). Manila.
2
location for future drilling activities; (iii) enhanced financial performance, governance, and efficiency indicators of the gas sector utilities through the GSRR’s capacity building and implementation; and (iv) improved air quality.
II. DESIGN AND IMPLEMENTATION A. Project Design and Formulation 5. The project design and formulation were aligned with the poverty reduction strategy paper prepared by the government and development partners in 2005. The strategy emphasized (i) enhancing gas production to properly use reserves and promote industrialization and (ii) expanding gas transmission infrastructure to less developed regions for balanced regional development and equitable distribution of benefits. The strategy targeted halving the poverty rate from 50% in 2000 to 25% in 2015. To attain the target, Bangladesh needed to accelerate poverty reduction at 3.3% during 2000–2015, which required raising annual economic growth from 5% in 2005 to 6%–7%, sustained over the next 15 years. 6. The project and the GSRR were part of Petrobangla’s $3 billion investment plan for 2002–2020 (para. 2) to develop Bangladesh’s gas resources—which provided almost 90% of input to power generation—and infrastructure to meet the rapidly growing commercial energy demand. The project envisaged necessary development of the natural gas sector and infrastructure and targeted replacing expensive and polluting fossil and biomass fuels with less polluting natural gas for industrial and commercial sectors. Considering the project’s well identified scope, its linkage with Petrobangla’s long-term investment plan and necessary reform agenda through GSRR, ADB chose a project lending modality. 7. The project design was consistent with ADB’s country strategy and program, 2004–2006 to promote domestic gas resources to replace imported fossil fuels and restructure the gas sector, allow full autonomy to gas sector entities, and deregulate and depoliticize tariff setting.7 Project covenants assured GSRR and loss reduction plan implementation. The project was consistent with ADB’s energy policy (1995) supporting balanced infrastructure investment, financially robust and efficient operations, deregulated energy markets, and private sector development.8 8. At appraisal, project implementation arrangements involved relevant agencies and planned necessary review processes. Thus, project design and formulation remained sound and adequate for the foreseen needs at appraisal for future gas transmission, distribution, sector reform, loss reduction, field appraisal, and capacity development. However, there were some changes in project scope during implementation due to the excessive increase in bid prices (paras. 10, 14 and 40). A major challenge during implementation was the severe gas supply shortage in the country amid the rapidly growing demand, as a series of drillings were unsuccessful starting from 2009. The energy crisis was experienced when construction of facilities under the project was already in full swing. To manage the situation, the 2010 National Power System Master Plan focused on expanding the gas network with more efficient power stations and constructing deep-sea ports to import liquified natural gas (LNG). The government formulated the Bangladesh Gas Act 2010 and Gas Development Fund Policy 2012 to enhance field exploration and equitable distribution. The government’s Seventh Five-Year Plan, 2016–2020 and 2016 Power System Master Plan targeted at least 33% power generation with natural gas by 2041, importing 4,000 MMCFD natural gas by 2041. The government has signed two long term LNG sales and purchase agreement with RasGas of Qatar and Oman Trading International in
7 ADB. 2004. Country Strategy and Program Update Bangladesh: 2004–2006. Manila. 8 ADB. 1995. Bank Policy for Energy Sector. Manila.
3
2011 on a government to government basis. In July 2018, Bangladesh began importing 500 MMCFD of LNG with the country’s first floating storage regassification unit (FSRU). Second FSRU for another 500 MMCFD LNG import capacity started to operate partially from early 2019. While the imported LNG helped meet growing industrial and commercial demand in the greater Chattogram division, most of the 2,700 MMCFD indigenous natural gas from the eastern region of the country is being transmitted to cater greater Dhaka and the western region’s demand. The transmission of indigenous natural gas requires networks developed by the project; hence, the project remains relevant at completion. While the gas supply shortage was unforeseen, the government is addressing the problem through several initiatives. The infrastructure established under the project will support gas supply from imports and indigenous sources. B. Project Outputs 9. The project had four outputs with eight indicators and, through its various parts (A–D), achieved seven out of eight (Appendix 1).9 Under output 1, improving gas transmission and the distribution network system, executed by Gas Transmission Company Limited (GTCL), the project achieved two out of three indicators: it (i) constructed 345 kilometers (km) of gas transmission line with an aggregate 342 MMCFD gas throughput (part A, components A1–A4), and (ii) constructed 270 km of gas distribution network (part C). The third indicator, installation of compressors at Ashuganj and Muchai (component A5) was dropped. Under output 2, the field appraisal, the project carried out seismic surveys in five gas fields as targeted (part B). Under output 3, enhancing the capacity of gas sector utilities, the project (part D) implemented the GSRR and helped (i) reduce system losses, (ii) efficiently operate and manage gas entities with the appropriate debt service and self-financing ratios, and (iii) achieve approval of policies such as the Bangladesh Gas Act of 2010, the Gas Development Fund Policy of 2012, and other regulations to streamline processes and attract private investment in liquified petroleum gas and LNG. Under output 4, air quality, the project installed distribution networks that helped households to shift from firewood to gas burners, which improved the ambient and indoor air quality (part C).
1. Part A: Gas Transmission Expansion and Reinforcement 10. A1: Ashuganj west–Jamuna Bridge east bank gas transmission pipeline. The project completed: (i) a 50.5 km, 30-inch-diameter transmission pipeline (appraisal estimate 51 km) in two sections from Monohardi to Dhanua through Narshingdi and Gazipur; and Elenga to Jamuna Bridge east bank through Tangail; (ii) a 1.004 km river crossing at Brahmaputra and Shitalakhya; and (iii) a metering and manifold station at Dhanua. Commercial operation began on 30 June 2014. The Ashuganj–Jamuna gas transmission pipeline (GTP) carries gas up to 342 MMCFD, against the appraisal estimate of 390 MMCFD.10 The project completed all scopes under this component except the compressor station at Ashuganj (west) and Elenga for throughput of 390 MMCFD, which was dropped because of an excessively high bid compared to the engineer’s estimate. It was later financed by another ADB project (para. 14). The project directly benefited commercial and industrial customers of Gazipur and Narshingdi and provided gas to four power plants totaling 1 gigawatt generation capacity at Sirajganj. Network use is expected to increase to full capacity once gas supply from the second FSRU reaches to 500 MMCFD within 2019. 11. A2: Hatikumrul–Ishwardi–Bheramara gas transmission pipeline. The project constructed 79.83 km (97% of the target 87 km) for Hatikumrul–Bheramara GTP with a 30-inch-
9 The outputs presented is based on the components outlined in RRP. The MAP shows the completed infrastructures. 10 The gas flow was recorded up to 420 MMCFD in 2014 but fell to 142 MMCFD after construction of a parallel 36-inch-
diameter 140 km pipeline from Bibiana gas field to Dhanua with government funding in 2015. The new pipeline affected Ashuganj–Jamuna GTP from 2015 to 2018, but use resumed from late 2018, after the LNG import began.
4
diameter pipe—larger than appraisal design (24-inch-diameter). It has increased the cost by $30 million. It included five river crossings at the Goja, Atrai, Borai, Khalishdanga, and Padma rivers. The pipeline and city gate station at Bheramara was completed in May 2013 but commercial operation was delayed until 27 November 2016 because of the delays in Padma river crossing. At Padma river, the first contractor failed in horizontal directional drilling because of hard rocks and, after failing in two attempts, it abandoned the site. A new contractor completed the job in November 2016 after a delay of 3 years. GTCL commissioned the city gate station at Bheramara for 68 MMCFD gas from May 2017, against the estimate of 235 MMCFD. Its capacity will be utilized once the LNG import reaches 1,000 MMCFD. Project beneficiaries include Bheramara 410 megawatt (MW) combined cycle power plant (CCPP), four ready-made garment factories, one battery and plastic factories in the Ishwardi export processing zone, several compressed natural gas (CNG) refueling stations, and residential customers of Ishwardi and Bheramara. 12. A3: Bonpara–Rajshahi gas transmission pipeline. The project constructed 53 km of 12.75-inch-diameter pipeline (106% of target 50 km of 12-inch-diameter); commercial operation began on 8 February 2012. The component included the Nandagoja river crossing, Rajshahi city gate station, and district regulating stations at Natore and Puthia. It connected Natore and the divisional cities of Rajshahi with natural gas for the first time. From 2012, the pipeline carried only 3–5 MMCFD gas against the target of 25–30 MMCFD. Suspension of new gas connections, unforeseen at appraisal, hampered the industrialization in project area, resulting in low gas uses.11 13. A4: Bheramara–Khulna gas transmission pipeline. The project constructed 162.5 km of 20-inch-diameter Bheramara–Khulna GTP (98% of target 165 km) on 31 July 2012. Six river crossings with length of 2.5 km, across Kumar, Nabaganga-I, Nabaganga-II, Chitra, Buribhairab and Begabati rivers were completed in December 2012. Major beneficiaries of the facilities include two ADB-funded projects–the Khulna CCPP, which is commissioned in June 2016, and Rupsha 800 MW CCPP, expected to start in June 2022. Utilization of pipeline has not yet started because of the delays in distribution pipeline construction (under another ADB project) connecting Khulna city gate station to Khulna 225 MW CCPP.12 The contract for construction of pipeline from Khulna city gate station to Khulna CCPP is awarded in January 2019 and is under implementation. It is expected that the pipeline will start to supply gas from 2020 and reach full utilization (75–125 MMCFD at appraisal) by 2022. 14. A5: North–south system expansion. This component comprised of installing two gas turbine compressors at Ashuganj south and Muchai with throughputs of 370–890 MMCFD. Two consecutive biddings for procurement in 2006 and 2008 had failed. The first round of bid was canceled due to a perceived integrity violation. ADB advised to rebid it. Second round of bid was failed due to the increase in steel price in international market and design change—both caused excessively high bids.13 In April 2009 the EMRD requested ADB for additional financing for compressor stations. Given the lead time for processing of additional financing, ADB advised
11 Due to the nationwide supply crisis from 2009, the Government intermittently suspended new gas connections in
2010–2014. Commercial and industrial connections resumed in 2014. Residential connections are permanently suspended from 16 July 2016.
12 Construction of 12 km Khulna city gate station to Khulna 225MW CCPP pipeline is part of ADB Loan 2622-BAN. 13 The cost estimate in first bid on 16 April 2006 was $41 million for compressor capacities—1,050 MMCFD at Ashuganj
and 1,100 MMCFD at Muchai. Rebid in 2008 increased compressor capacities—1,500 MMCFD for Ashuganj; 1,160 MMCFD for Muchai and added a 500 MMCFD compressor at Elenga based on revised demand forecast. Elenga compressor station’s original design was 209 MMCFD. The lowest received bid on 9 February 2009 was $147.9 million against the estimate of $55 million. Similar high price trend was also observed in contemporary contract for package A-B-1, awarded on 11 March 2009 at $46.2 million against estimate of $23 million, and the contract for package A-A-1, awarded on 12 March 2009 at $ 26.8 million against the estimate of $14.7 million.
5
transferring the compressor stations to another ADB project being processed.14 Hence, both gas compressor stations were dropped from the project. ADB provided its concurrence to drop the compressor stations on 23 September 2009.15 The contracts for Ashuganj (south and west) compressor stations for throughput of 1,500 and Elenga for 500 MMCFD were awarded on 21 October 2011 under Loan 2622-BAN; the stations were commissioned in June 2016. Chevron Bangladesh Ltd. (a private oil and gas company) constructed the Muchai compressor station for 1,160 MMCFD throughput under a production sharing contract, commissioned in March 2012.16
15. Supervisory control and data acquisition (SCADA) system under components A2–A4 was procured in a single package—western zone SCADA package—and completed in November 2015. The system interfaced with GTCL’s existing SCADA system, financed by JICA, and enabled GTCL to access the real time gas transmission data from Dhaka from August 2018.
16. Overall, under output 1, the project constructed a 345.8 km pipeline, 98% of the target 353 km, with throughput capacity up to 342 MMCFD, 95% of the target of 360 MMCFD (Table 1).
Table 1: Gas Transmission Lines Capacity Expansion at Appraisal and Completion At Appraisal At Completion
17. As targeted, the project’s part B completed appraisal of five gas fields (1,250 square km) in April 2014, with 4 years’ delay. The component’s two executing agencies—Bangladesh Gas Fields Limited (BGFCL) and Sylhet Gas Fields Limited (SGFL)—procured 3-D survey equipment and provided it to the implementing agency, Bangladesh Petroleum Exploration and Production Company Limited (BAPEX), for survey, instead of contracting to an external firm. BAPEX completed the field survey and data interpretation in 2007–2012. As a result, the project proposed drilling 30 new gas wells (Titas-11 and Bakhrabad-3 under BGFCL; Rashidpur-9, Kailastilla-4 and Sylhet gas field-3 under SGFL)—12 wells were drilled successfully in subsequent years.17 Instead of foreign training, the project arranged on-the-job training at local levels from international experts.18 BAPEX used the equipment procured and expertise gained under the project for revision of data interpretation in 2016 for precise determination of drilling locations.
14 ADB. 2010. Bangladesh: Natural Gas Access Improvement Project. 15 ADB approved cancellation of compressors on post facto on 8 October 2013. Subsequently, ADB review mission on
13–16 December 2009 recorded gas turbine compressor stations to be funded by the ensuing Loan 2622-BAN. 16 The contract value for the Ashuganj and Elenga compressor stations was $122 million; the contract value for the
Muchai compressor station was $52.8 million. 17 Seven out of 12 drillings were successful and added 114 MMCFD gas to the national grid. Four drillings were carried
out under ADB project from Loan 2622. 18 BAPEX invited expressions of interest three times, but the single responsive proposal was much higher than estimate.
6
3. Part C: Rajshahi Gas Distribution Network
18. The project’s part C completed 270.16 km of distribution pipelines of 1- to 8-inch-diameter (over 85% of the target 280–320 km), including a 34 km ring main of 8-inch-diameter pipeline and accessories, in July 2012.19 Pashchimanchal Gas Company Limited (PGCL) executed the project component, providing Rajshahi city with piped gas for the first time and connecting a total of 9,155 households (228% of the appraisal target of 4,000 households) when the temporary suspension on new domestic connection was relaxed (footnote 11).20 Starting July 2012, the project connected 11 industries, 2 captive power plants (2 MW and 2.4 MW) and one CNG station, against the target of 150 commercial and 75 industrial connections. Part C supplies 3.22 MMCFD gas against the target 20 MMCFD. Gas supply shortage and the government’s continued suspension on new connections hampered industrial development and led to low capacity use. Table 2 summarizes the gas distribution network at appraisal and at completion.
Table 2: Rajshahi Gas Distribution Network at Appraisal and Completion At Appraisal At Completion
Component Pipeline Length
(km)
Gas Connections
(Nos.)
Gas Throughput
(MMCFD)
Pipeline Length
(km)
Gas Connections
(Nos.)
Gas Throughput
(MMCFD) Rajshahi gas distribution network
280.00 4,225.00 20.00 270.16 9,167.00 3.22
km = kilometer, MMCFD = million cubic feet per day
4. Part D: Capacity Building 19. Part D helped enhance financial performance, governance and institutional efficiency of the executing and implementing agencies—Petrobangla, BAPEX, and Titas Gas Transmission and Distribution Company Ltd (TGTDCL)—through capacity building and implementing the GSRR (footnote 5). It implemented four capacity building components (D1–D4). 20. D1: Institutional strengthening of hydrocarbon unit (HCU). Grant 0019 funded the HCU work plan. As planned, nine consulting firms were recruited. The terms of references were updated to accommodate gas production augmentation services. Though delayed, the HCU became a permanent technical arm of EMRD on 1 January 2014, which is a major achievement. 21. D2: BAPEX data center upgrade. The BAPEX data center was upgraded in May 2011 and digitized old data in 2012; the upgraded center digitally preserves geological, geophysical, and well data of the gas fields. 22. D3: Development of institutional capacity of gas sector entities. 154.8 person-weeks of training (71% of 218 person-weeks at appraisal) were provided to 340 gas sector staff. Training included engineering design; operation and maintenance of processing plants and transmission and distribution pipelines; exploration of geophysics; 3-D seismic acquisition, processing and interpretation; reservoir engineering and management; compressor station planning and management; techno-commercial engineering; and decision making and executive management. 23. D4: System loss reduction of Titas Gas Transmission and Distribution Company. In 2009, 604 turbine and rotary meters with electronic volume correctors (EVC) and five mobile on-site meter calibration units were procured; by June 2011, 575 rotary meters with EVC were installed. However, TGTDCL does not bill gas consumption based on the EVC meters, except for the industries and CNG fueling stations, and does not use corrected readings from the installed 19 The RRP presents the length as 320 km, the DMF as 200 km, and the project administration manual as 280 km. 20 9,155 newly connected households included 9,103 non-metered and 52 metered, comprising 14,638 dual burners.
7
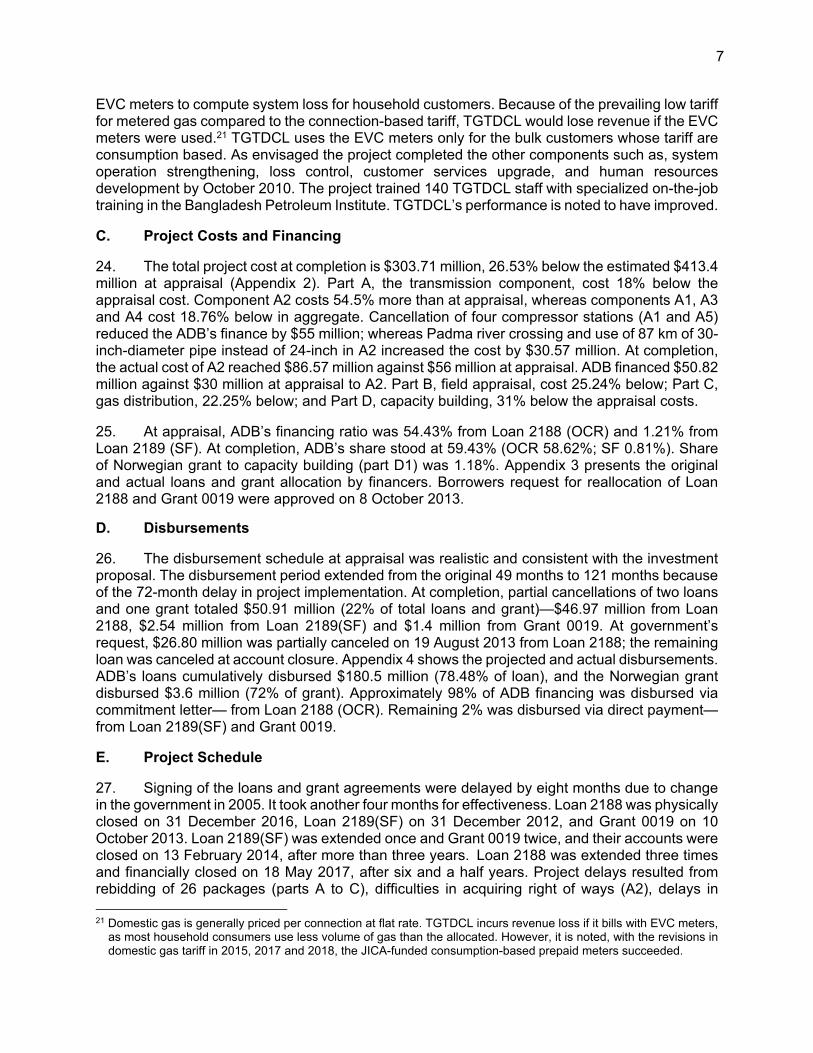
EVC meters to compute system loss for household customers. Because of the prevailing low tariff for metered gas compared to the connection-based tariff, TGTDCL would lose revenue if the EVC meters were used.21 TGTDCL uses the EVC meters only for the bulk customers whose tariff are consumption based. As envisaged the project completed the other components such as, system operation strengthening, loss control, customer services upgrade, and human resources development by October 2010. The project trained 140 TGTDCL staff with specialized on-the-job training in the Bangladesh Petroleum Institute. TGTDCL’s performance is noted to have improved. C. Project Costs and Financing 24. The total project cost at completion is $303.71 million, 26.53% below the estimated $413.4 million at appraisal (Appendix 2). Part A, the transmission component, cost 18% below the appraisal cost. Component A2 costs 54.5% more than at appraisal, whereas components A1, A3 and A4 cost 18.76% below in aggregate. Cancellation of four compressor stations (A1 and A5) reduced the ADB’s finance by $55 million; whereas Padma river crossing and use of 87 km of 30-inch-diameter pipe instead of 24-inch in A2 increased the cost by $30.57 million. At completion, the actual cost of A2 reached $86.57 million against $56 million at appraisal. ADB financed $50.82 million against $30 million at appraisal to A2. Part B, field appraisal, cost 25.24% below; Part C, gas distribution, 22.25% below; and Part D, capacity building, 31% below the appraisal costs. 25. At appraisal, ADB’s financing ratio was 54.43% from Loan 2188 (OCR) and 1.21% from Loan 2189 (SF). At completion, ADB’s share stood at 59.43% (OCR 58.62%; SF 0.81%). Share of Norwegian grant to capacity building (part D1) was 1.18%. Appendix 3 presents the original and actual loans and grant allocation by financers. Borrowers request for reallocation of Loan 2188 and Grant 0019 were approved on 8 October 2013.
D. Disbursements 26. The disbursement schedule at appraisal was realistic and consistent with the investment proposal. The disbursement period extended from the original 49 months to 121 months because of the 72-month delay in project implementation. At completion, partial cancellations of two loans and one grant totaled $50.91 million (22% of total loans and grant)—$46.97 million from Loan 2188, $2.54 million from Loan 2189(SF) and $1.4 million from Grant 0019. At government’s request, $26.80 million was partially canceled on 19 August 2013 from Loan 2188; the remaining loan was canceled at account closure. Appendix 4 shows the projected and actual disbursements. ADB’s loans cumulatively disbursed $180.5 million (78.48% of loan), and the Norwegian grant disbursed $3.6 million (72% of grant). Approximately 98% of ADB financing was disbursed via commitment letter— from Loan 2188 (OCR). Remaining 2% was disbursed via direct payment—from Loan 2189(SF) and Grant 0019. E. Project Schedule 27. Signing of the loans and grant agreements were delayed by eight months due to change in the government in 2005. It took another four months for effectiveness. Loan 2188 was physically closed on 31 December 2016, Loan 2189(SF) on 31 December 2012, and Grant 0019 on 10 October 2013. Loan 2189(SF) was extended once and Grant 0019 twice, and their accounts were closed on 13 February 2014, after more than three years. Loan 2188 was extended three times and financially closed on 18 May 2017, after six and a half years. Project delays resulted from rebidding of 26 packages (parts A to C), difficulties in acquiring right of ways (A2), delays in 21 Domestic gas is generally priced per connection at flat rate. TGTDCL incurs revenue loss if it bills with EVC meters,
as most household consumers use less volume of gas than the allocated. However, it is noted, with the revisions in domestic gas tariff in 2015, 2017 and 2018, the JICA-funded consumption-based prepaid meters succeeded.
8
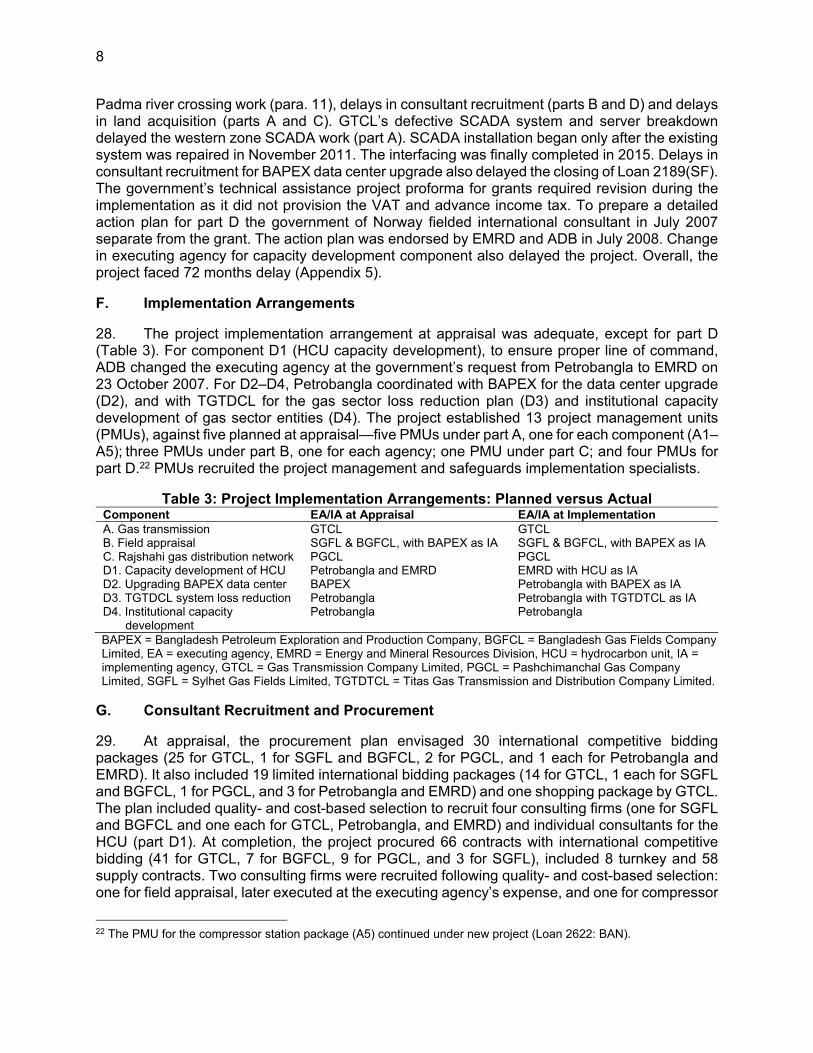
Padma river crossing work (para. 11), delays in consultant recruitment (parts B and D) and delays in land acquisition (parts A and C). GTCL’s defective SCADA system and server breakdown delayed the western zone SCADA work (part A). SCADA installation began only after the existing system was repaired in November 2011. The interfacing was finally completed in 2015. Delays in consultant recruitment for BAPEX data center upgrade also delayed the closing of Loan 2189(SF). The government’s technical assistance project proforma for grants required revision during the implementation as it did not provision the VAT and advance income tax. To prepare a detailed action plan for part D the government of Norway fielded international consultant in July 2007 separate from the grant. The action plan was endorsed by EMRD and ADB in July 2008. Change in executing agency for capacity development component also delayed the project. Overall, the project faced 72 months delay (Appendix 5). F. Implementation Arrangements 28. The project implementation arrangement at appraisal was adequate, except for part D (Table 3). For component D1 (HCU capacity development), to ensure proper line of command, ADB changed the executing agency at the government’s request from Petrobangla to EMRD on 23 October 2007. For D2–D4, Petrobangla coordinated with BAPEX for the data center upgrade (D2), and with TGTDCL for the gas sector loss reduction plan (D3) and institutional capacity development of gas sector entities (D4). The project established 13 project management units (PMUs), against five planned at appraisal—five PMUs under part A, one for each component (A1–A5); three PMUs under part B, one for each agency; one PMU under part C; and four PMUs for part D.22 PMUs recruited the project management and safeguards implementation specialists.
Table 3: Project Implementation Arrangements: Planned versus Actual Component EA/IA at Appraisal EA/IA at Implementation A. Gas transmission GTCL GTCL B. Field appraisal SGFL & BGFCL, with BAPEX as IA SGFL & BGFCL, with BAPEX as IA C. Rajshahi gas distribution network PGCL PGCL D1. Capacity development of HCU Petrobangla and EMRD EMRD with HCU as IA D2. Upgrading BAPEX data center BAPEX Petrobangla with BAPEX as IA D3. TGTDCL system loss reduction Petrobangla Petrobangla with TGTDTCL as IA D4. Institutional capacity
development Petrobangla Petrobangla
BAPEX = Bangladesh Petroleum Exploration and Production Company, BGFCL = Bangladesh Gas Fields Company Limited, EA = executing agency, EMRD = Energy and Mineral Resources Division, HCU = hydrocarbon unit, IA = implementing agency, GTCL = Gas Transmission Company Limited, PGCL = Pashchimanchal Gas Company Limited, SGFL = Sylhet Gas Fields Limited, TGTDTCL = Titas Gas Transmission and Distribution Company Limited.
G. Consultant Recruitment and Procurement 29. At appraisal, the procurement plan envisaged 30 international competitive bidding packages (25 for GTCL, 1 for SGFL and BGFCL, 2 for PGCL, and 1 each for Petrobangla and EMRD). It also included 19 limited international bidding packages (14 for GTCL, 1 each for SGFL and BGFCL, 1 for PGCL, and 3 for Petrobangla and EMRD) and one shopping package by GTCL. The plan included quality- and cost-based selection to recruit four consulting firms (one for SGFL and BGFCL and one each for GTCL, Petrobangla, and EMRD) and individual consultants for the HCU (part D1). At completion, the project procured 66 contracts with international competitive bidding (41 for GTCL, 7 for BGFCL, 9 for PGCL, and 3 for SGFL), included 8 turnkey and 58 supply contracts. Two consulting firms were recruited following quality- and cost-based selection: one for field appraisal, later executed at the executing agency’s expense, and one for compressor
22 The PMU for the compressor station package (A5) continued under new project (Loan 2622: BAN).
9
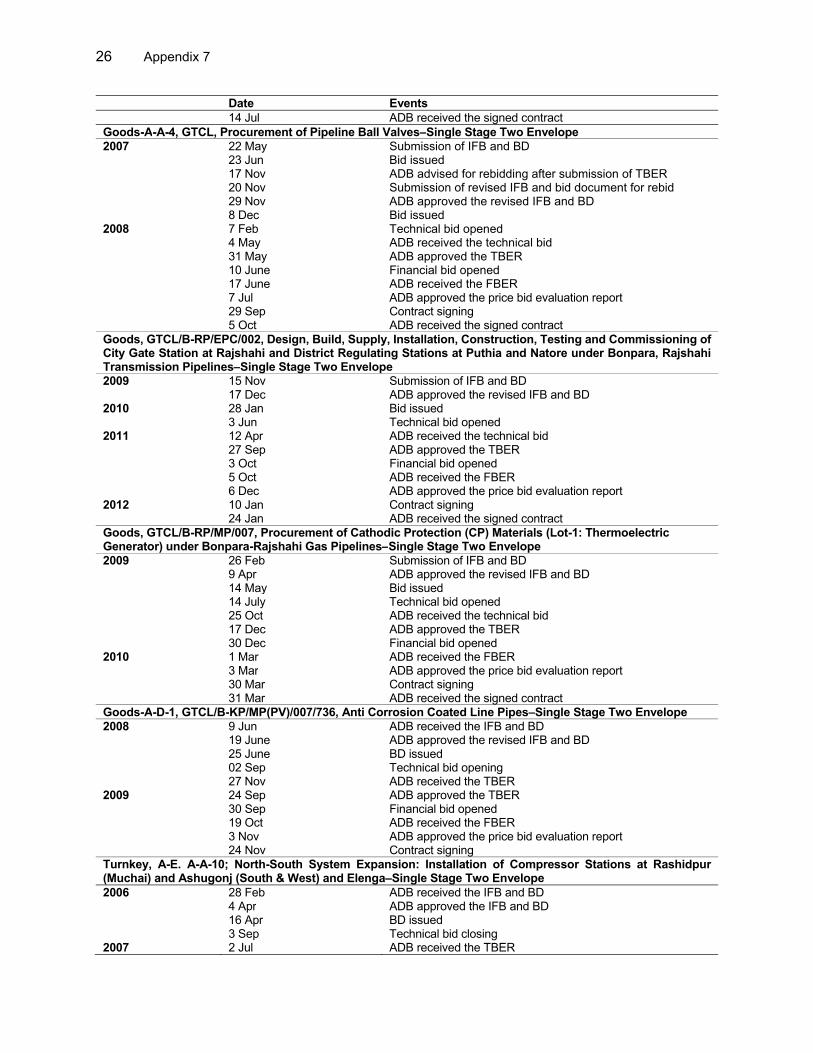
station implementation, including technical support for bidding.23 To support studies and trainings, the project recruited individual consultants instead of a firm (para. 20). ADB’s prior approval were secured for all changes in methods and packages. Appendix 6 presents the contract awards at appraisal and at completion. Chronology of major procurement events is in Appendix 7. 30. Twenty-six procurement packages under GTCL (components A1–A2), BGFCL, and PGCL required rebidding due to lack of competition, international market price increases, and packaging issues (one package in part B required goods from six different manufacturers, bidders could not succeed as they failed to consolidate bids). Contract execution was hampered by supplier’s failure to complete the job because of increase in price of materials (component A1). Technical failures of the induction bend (component A2) caused replacement of materials during warranty period. Outdated cost estimates, changes in specification during implementation and unforeseen price increases in the international market forced cancellation of four gas compressor stations. Lowest bid value for the compressors was more than twice of the estimates (footnote 13). Good technical due diligence and robust cost estimate would have avoided procurement delays and cost overrun. H. Gender Equity 31. Though categorized as no gender element at appraisal, certain positive benefits to women and children were observed at project implementation. The project provided gas connections to 9,155 households comprising 14,638 cooking stoves and one textile factory with 85% women employees in Rajshahi creating positive impact on the quality of life for women and children. By replacing firewood and kerosene with cleaner gas, project helped improve health of women and children. It reduced the time spent in cooking that gave them more time for productive work. I. Safeguards 32. Environment. The project was categorized B for environmental safeguards, as the impact on environment was expected to be less significant and mitigation measures were readily available. The initial environmental examinations and environmental management plans were prepared for all components following the ADB environment policy (2002), environmental assessment guidelines (2003), the government of Bangladesh’s environment conservation act (1995), environmental impact assessment guidelines for industries, and related national policies and legislations. A summary initial environmental examination for entire project was prepared and disclosed per ADB environment policy 2002. On the government side, an environmental impact assessment was prepared and environmental clearance certificate was obtained from department of environment, as the government decided to consider the project a part of “exploration, extraction and distribution of mineral resources,” falling under item 65 in the red category list of Bangladesh environmental conservation rules (1997). 33. At implementation, environmental management clauses were incorporated in the bidding documents for eight civil works packages that required specific environmental safeguard measures. Both PGCL and GTCL, who implemented the civil works, recruited consultants for environmental monitoring and training. Consultants prepared environmental monitoring reports for both PGCL and GTCL (Appendix 8) and organized a training workshop on environment for PGCL engineers and officials. The project used suitable technology such as horizontal directional drilling to minimize construction effects and avoid significant adverse impacts on navigation, fisheries, and other aquatic resources in fourteen river crossings. During site visits, the PCR mission noted good environmental health and safety practices at the project sites, including
23 ADB did not finance the consulting firm for field appraisal since only one technically responsive firm emerged even
after three consecutive expressions of interest. The scope was reduced, and the executing agency funded it.
10
monthly safety reporting systems, mock fire drills, availability of first aid boxes, and no record of accidents. Because the natural gas replaces alternative fuels including high speed diesel for power plants and industries, it is expected to have mitigated greenhouse gas emissions. The project is expected to reduce carbon dioxide emissions by 61,351,249 tons over the period up to 2037.24 Delay in project categorization, long implementation period and dropping of the compressors have led to nondisclosure of some reports in ADB website—they were subsequently traced and found satisfactory. The overall environmental safeguards compliance is rated satisfactory. 34. Social safeguards. The project was categorized A for involuntary resettlement and C for indigenous peoples. The policy framework and entitlements are based on ADB’s involuntary resettlement policy (1995).25 At appraisal, GTCL and PGCL prepared six resettlements plans to mitigate permanent and temporary socioeconomic impacts. The project involved land acquisition and temporary requisition in parts A, B, and C (Appendix 8). Under part A, the component causing maximum social impact, four resettlement plans (RP) stipulated permanent acquisition of 351.55 hectares and temporary requisition of 628.5 hectares of lands, affecting 1,249 households. Under Part B, field appraisal activities caused temporary effects for 15 days—RP anticipated 270 hectares of land having only short-term impact on crops affecting 800 households. The RP for part C (gas distribution pipeline) required 3 hectares land acquisition. 35. At project closure, all six RPs were implemented (Appendix 8). The project hired a nongovernment organization to monitor implementation of RPs as per loan covenant. GTCL and PGCL disclosed the external monitor’s comprehensive reports on RP implementation on the ADB website. With support from the local government, BAPEX delivered crop compensation under part B. At closure, no unresolved grievances needed resolution. The delays in land acquisition (Appendix 8) occurred because of the complexity of acquisition process, as natural gas transmission projects require permanent acquisition of a 20- to 30-feet wide strip and temporary acquisition of another 40-feet wide strip throughout the pipelines. These affects thousands of landowners and requires substantial time to complete. The overall social safeguards compliance for the project is rated satisfactory. J. Monitoring and Reporting 36. The project fully complied with 40 out of 41 covenants (Appendix 9). The project partially complied with one covenant on air quality improvement monitoring under the project performance monitoring system. Due to lack of baseline and current data, the project did not measure air quality improvement and instead used the secondary data. All executing agencies submitted the semiannual environmental monitoring reports, except for part B, where the impact was temporary. All executing agencies submitted the quarterly progress reports and social monitoring reports to ADB on time. No covenants were modified, suspended, or waived during implementation. However, changes in PMU staffs and project delays caused some gaps in reports disclosure. 37. Submission of annual audited project financial statements and audited entity financial statements were timely, but some discrepancies exist with the data from loan and financial information system which is being reconciled. Project review missions regularly monitored the financial and physical implementation progress against the implementation schedule and compliance with the covenants. Further follow up is needed to resolve some audit observations. 24 Carbon dioxide emissions were calculated following the guidelines of the United Nations Framework Convention on
Climate Change (https://unfccc.int/resource/docs/publications/09_resource_guide3.pdf). 25 Summary resettlement plan (Appendix 14, p. 52) in ADB. 2005. Report and Recommendation of the President to the
Board of Directors on a Proposed Loan and Grant to the People’s Republic of Bangladesh for Gas Transmission and Development Project. Manila.
11
III. EVALUATION OF PERFORMANCE A. Relevance 38. The project is rated relevant. The design and formulation were consistent with the poverty reduction strategy paper of 2005 (para. 4) for enhancing natural gas production and distribution to promote industrialization and ensure equitable distribution of benefits. The depth of development coordination has prevented overlaps in support among development partners. At completion, the project is aligned with the government’s Seventh Five-Year Plan, 2016–202026 that targeted higher, sustainable, and inclusive growth through continued focus on natural gas infrastructure, including LNG import facilities. Similarly, the project at appraisal was aligned with ADB’s country strategy and program, 2004–2006 and continued to align with ADB’s country partnership strategy, 2016–2020, which prioritized easing infrastructure constraints in key sectors like energy.27 The project remains consistent with ADB’s energy policy (2009).28 The project played a vital role in improving the energy infrastructure, connecting the energy-starved western region and catering need for energy in the rapidly growing industrial and commercial zones around Dhaka by constructing 345-km transmission pipelines and 270-km distribution pipelines. At appraisal, the existing pipeline in the Brahmaputra basin from Ashuganj to Elenga (B-B line) was operating in saturated condition. The Ashuganj–Jamuna Bridge GTP, built in parallel to B-B line, strengthened the national gas grid backbone, now capable of serving the regional gas demand up to 420 MMCFD. The Hatikumrul–Bheramara GTP and Bonpara–Rajshahi GTP deliver gas to the south-western zone, a future industrial hub. The network will harness its full potential once the import of LNG, begun in 2018, is fully realized (para. 8). On upstream exploration, a sub-surface 3-D survey provided a solid basis for adding proven gas reserves up to 3 TCF. The western zone SCADA system interfaces with the pre-existing SCADA network so GTCL can access countrywide real time data remotely. While utilization of some project outputs was affected by the gas supply shortage, the government’s current interventions and future plans for the energy sector show that the facilities established under the project would play a crucial role as the country’s demand for energy continues to increase (para. 8). 39. The project lending modality was appropriate (para. 5) given the defined scope of investments. Synergies between the hard and soft components were ensured with their alignment with Petrobangla’s investment plan and the GSRR. The project design and monitoring framework (DMF) though could have benefited from having a more logical linkage of results, realistic and measurable indicators and relevant baseline data (DMF output 4). Applying lessons and recommendations from the previous project PCR, the project included a system loss reduction plan aligned to the GSRR and pursued a reform agenda, including autonomy of Bangladesh Energy Regulatory Commission (BERC) and HCU functionality.29 The government’s power system master plan of 2016 targets 33% of electricity generation fueled by gas by 2041. The Bangladesh Gas Act (2010) and Gas Development Fund Policy (2012) both emphasized new exploration, production, and transmission infrastructure. The project remained relevant at completion and will continue to be relevant after project completion (para. 8). 40. The implementation arrangement was adjusted to improve management and coordination of project components (para. 28). The project scope was modified with cancellation of compressor stations (para. 10 and 14). The canceled compressor component constituted only 13.3% of the
26 Government of Bangladesh, Planning Commission. 2015. Seventh Five Year Plan FY2016–FY2020: Accelerating
Growth, Empowering Citizens. Dhaka. 27 ADB. 2016. Country Partnership Strategy: Bangladesh, 2016–2020. Manila; 28 ADB. 2009. Energy Policy. Manila. 29 ADB. 2005. Project Completion Report: Third Natural Gas Development Project. Manila.
12
total project cost and financed by another ADB project. The Rajshahi gas distribution network under part C achieved more than 85% of its physical target, but capacity use was low because of low industrialization due to shortage of indigenous gas supply during 2010–2014 (footnote 11). B. Effectiveness 41. The project is rated effective. The outcome and outputs envisioned at appraisal were substantially achieved (Appendixes 1 and 10). The country’s gas consumption increased from 1,400 MMCFD in 2005 to 1,925 MMCFD in 2010 and 2,450 MMCFD in 2015, against the outcome target 1,760 MMCFD in 2014. Outcome indicator 1 was fully achieved by year 2010 (109% of the target). The country’s gas consumption in 2018 reached about 3,200 MMCFD, 170% of the outcome target. The population using natural gas as a primary fuel (outcome indicator 2) increased from 6% in 2005 to 10% in 2015, against the target of 10% by 2012. Suspension on gas connections and shortage of gas lowered the use of project assets (footnote 11). 42. Parts A and B of the project directly contributed to outcome indicators 1 and 2. In 2019, 342 MMCFD gas (11.4% of national consumption) flowed through the Ashuganj–Elenga pipeline, which is 95% of the outcome target (addition of 360 MMCFD). Field appraisal and a 3-D survey (part B) eventually resulted in additional gas production of 114 MMCFD (4.2% of total indigenous gas production). The project constructed 345 km of new transmission pipelines (98% of the output 1 target of 353 km). Under part C, 270 km of distribution pipelines in Rajshahi and adjoining area (96% of the target 280 km) were constructed. Under part B, five gas fields of 1,250 square km (100% of the target) were 3-D surveyed. 43. The capacity building component (part D) strengthened the gas sector utilities’ financial performance, governance, and efficiency. GTCL, SGFL and BGFCL generally achieved the debt service coverage ratio of 1.2 from 2005 onwards. The project helped implement the GSRR (Appendix 11), which became a policy roadmap for Petrobangla from 2009. The project enhanced private sector participation—in 2019, the private sector produced 58.32% of domestic gas under production sharing contracts. System loss fell to 1.82% in 2010 against the target 2% and remained below 2% thereafter. Implementation of GSRR led to the functionality of BERC and the formulation of the Bangladesh Gas Act (2010) and Petroleum Act (2016). The outcome will be visible in 2021, once the LNG import reaches its full potential. Implementation of environmental and social safeguard management plans was satisfactory (paras. 33 and 35). C. Efficiency 44. The project is rated efficient. The economic reevaluation was conducted following ADB guidelines, consistent with the approach adopted at appraisal.30 Because the project comprised distinct parts, separate economic analyses were carried out for each part and subsequently aggregated and weighted to reflect the significance and size of the subprojects. Despite a 72-month implementation delay, the economic internal rate of return (EIRR) at project completion is 39.8% in aggregate (Appendix 12). The aggregate EIRR, though lower than at appraisal’s 56.6%, it is higher than the benchmark 12%.31 The reevaluated EIRR has been assessed as robust. The sensitivity analysis shows the EIRR would remain unchanged if O&M cost increased by 10%. The EIRR would drop to 38.0% if the benefit decreased by 10%. Likewise, the EIRR would drop to 38.9% if the gas costs increased by 10%. If all three events took place simultaneously, the EIRR would drop to 35.1%. Table 4 shows the EIRR at appraisal and at completion. 30 ADB. 2017. Guidelines for the Economic Analysis of Projects. Manila. 31 RRP para. 49 states the EIRR at appraisal was 28.1%. In its Appendix 12, Table A12.1, the O&M costs were noted
to be grossly overestimated. This resulted in the low value of EIRR. The supplementary appendix to RRP has calculated the EIRR of 56.6%. For comparison, the PCR considered the EIRR at appraisal to be 56.6%.
13
Table 4: Comparison of EIRR at Appraisal and Completion
Components EIRR (%)
At Appraisal At Completion Part A A1 and A5. AJGTP and NSSE
57.30
84.00
A2. HBGTP 33.50 26.80 A3. BRGTP 25.00 9.90 A4. BKGTP 28.00 21.30 Overall part A: Gas transmissiona 57.10 37.90 Part B: Field appraisal 42.60 48.90 Part C: Rajshahi gas distribution network NA 13.10 Overall 56.60 39.80 AJGTP = Ashuganj–Jamuna Bridge gas transmission pipeline, BKGTP = Bheramara–Khulna gas transmission pipeline, BRGTP = Bonpara–Rajshahi gas transmission pipeline, EIRR = economic internal rate of return, HBGTP = Hatikumrul–Bheramara gas transmission pipeline, NSSE = north–south system expansion. a Includes the Rajshahi gas distribution network. The EIRR for Part C is also computed separately above.
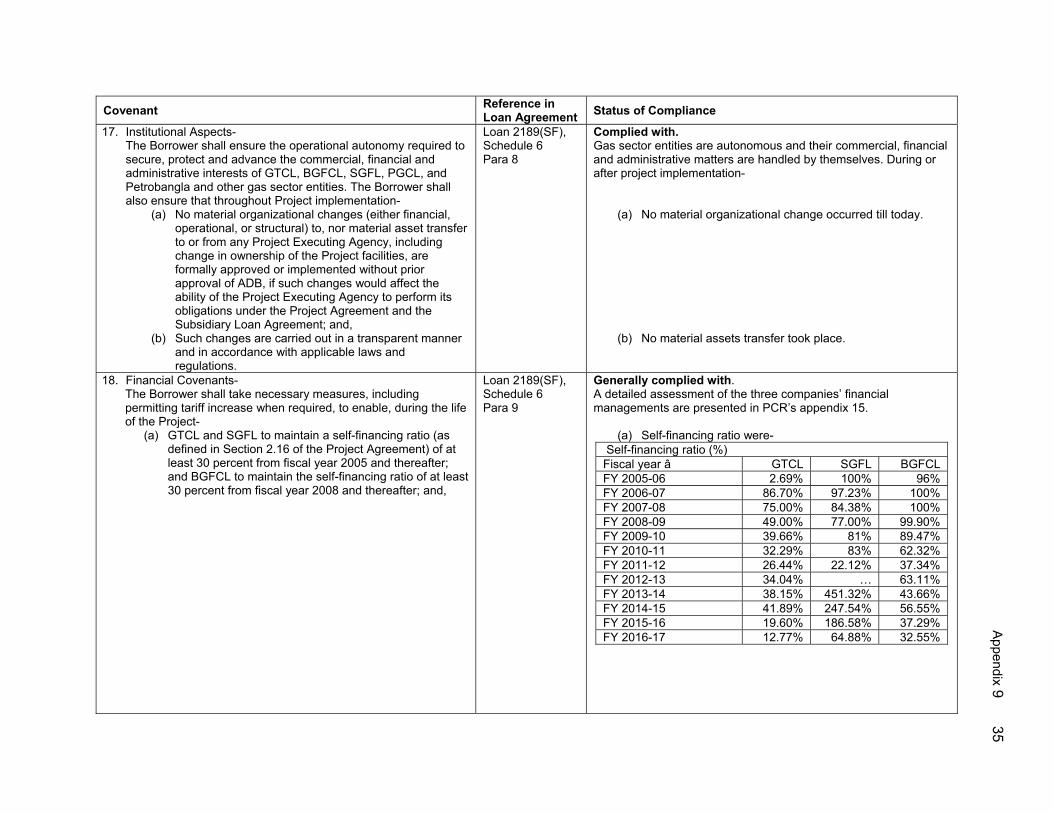
45. Due to multiple reasons (para. 27), the project was delayed. Pipeline use remains low because the gas supply through Bheramara–Khulna GTP has not started as of June 2019. Full capacity use is expected from 2022 (para. 13). Nevertheless, the economic benefits far outweigh the cost of project factoring the delays as discussed above. The project used 73.46% of resources allocated by all financiers suggesting efficient use of resources. D. Sustainability 46. The project is rated likely sustainable. The aggregate reevaluated FIRR following ADB guidelines on financial management is 3.20%,32 which is higher than the aggregate weighted average cost of capital (WACC) of 1.46% (Appendix 13), but lower than the FIRR of 12.0% at appraisal. Because the reevaluated FIRR exceeds the WACC, it confirms the investment was robust. However, implementation delay, low pipeline use, and higher O&M costs reduced the revenue of Bonpara–Rajshahi transmission and Rajshahi distribution pipelines during FY2014–2018, resulting in negative FIRR (Appendix 14). Imported LNG and commissioning of the Rupsha 800 MW CCPP will ensure full utilization of the south-western Bheramara–Khulna GTP by 2022. 47. The institutional sustainability of gas utilities, namely, GTCL, PGCL, BGFCL, and SGFL were assessed based on their business and financial risks, and financial flexibility and liquidity (Appendix 15). Overall, their business risks are assessed to be insignificant. However, because tariffs are highly regulated, their revenue risk continues, for example, delays in approving new tariffs caused significant margin and cash flow pressure during the analysis period of FY2015–2017. Implementation of the GSRR and ADB’s continued policy dialogue with the government are supporting BERC on the formulation of market-based gas tariff, which is expected to start after the 1,000 MMCFD LNG import plan fully materializes by end of 2019. Although financial performances were mixed, the country’s stable and stronger economic outlook indicates gas companies will continue with investments as their credit metrics remain robust, supported by positive operating cash flow. But despite the positive cash flow, gas utilities need to focus on controlling the O&M costs. This is being monitored by the BERC. Implementation of GSRR, the Bangladesh Gas Act (2010), the Gas Development Fund Policy (2012), establishment of HCU, and formulation of gas sector master plan are expected to uphold the business and financial sustainability of gas sector entities. Gas system loss reduction plan achieved its targets (Appendix 16). There are no foreseen environmental and social risks in the project. The quality of assets created are deemed sound and likely to withstand normal weather patterns and other adversities.
32 ADB. 2005. Financial Management and Analysis of Projects. Manila.
14
E. Development Impact
48. Overall developmental impact is assessed satisfactory. The project improved the gas supply around greater Dhaka. Transmission pipelines up to Khulna and Rajshahi have ensured adequate gas supply to the existing, ongoing, and upcoming power plants at Sirajganj, Rajshahi, Bheramara, and Khulna. Access to gas has increased to 8% against a target of 10% by 2012, and further increased to 13% in 2017.33 Domestic gas production reached 2,700 MMCFD in 2015. Power generation capacity increased from approximately 6,000 MW in 2005 to 19,000 MW in 2018, with 56% fueled by gas. In 2019, natural gas contributes 62% of primary energy. Access to electricity is over 90%, up from 40% at appraisal. Gross domestic product growth reached 7.6% in 2018 from 5.5% at appraisal. Thus, project has fostered the accelerated economic activities. F. Performance of the Borrower and the Executing Agency 49. The performance of the borrower and executing agencies is rated satisfactory. The executing agencies established the PMUs on time with proper resources. The government funded 39% of the project cost, close to the appraisal estimate of 43%. GTCL has put all its efforts to complete the delayed Padma river crossing. Likewise, the EMRD fully owned the capacity development activities. All EAs have submitted the quarterly progress reports and annual audited project financial statements as required. They prepared the PCRs on time. However, their financial management could have been better as some audit and reconciliation issues continued. G. Performance of Cofinancier
50. Performance of the government of Norway was satisfactory. It worked closely with ADB and the government, participated in reviews and timely transferred its cofinancing share to ADB. H. Performance of the Asian Development Bank
51. ADB’s performance was satisfactory. It responded timely to the needs of executing agencies including changes in specifications in part A2, financing arrangements for compressor stations (footnote 15), and extension of loans and grant (para. 27) to complete the delayed components. ADB reviewed and approved the procurement documents in time and provided guidance to executing agencies through review missions and meetings. ADB promptly canceled $49.5 million loan and $1.4 million grant at government’s request. Project performance remained satisfactory or on-track for the entire period from 2007 to 2016. However, some audit observations and reconciliation issues were persisted over the years. The financial management could have been better. The project missed to fully comply with the environment safeguard report disclosure (Appendix 8). The DMF’s output 4 (improved air quality) should have been placed at outcome level, and it lacked baseline data and methodology of monitoring. After the cancellation of compressor stations, the relevant output indicator should have been revised. I. Overall Assessment 52. Overall, the project is successful based on the ratings of relevance, effectiveness, efficiency, and sustainability. The project is relevant as it financed important natural gas infrastructure and reforms for equitable distribution of benefits and economic growth as per the government and ADB policies. It is effective as both the outcome indicators are fully achieved, and except the installation of compressor stations all eight output indicators are substantially
33 The increase in access to gas is one of the project’s contributions to ADB’s results framework. Other results indicators
include (i) 2,794,510 tons of carbon dioxide emission reduction as of December 2018, (ii) 345 km of gas transmission lines installed, and (iii) 270 km of gas distribution lines installed.
15
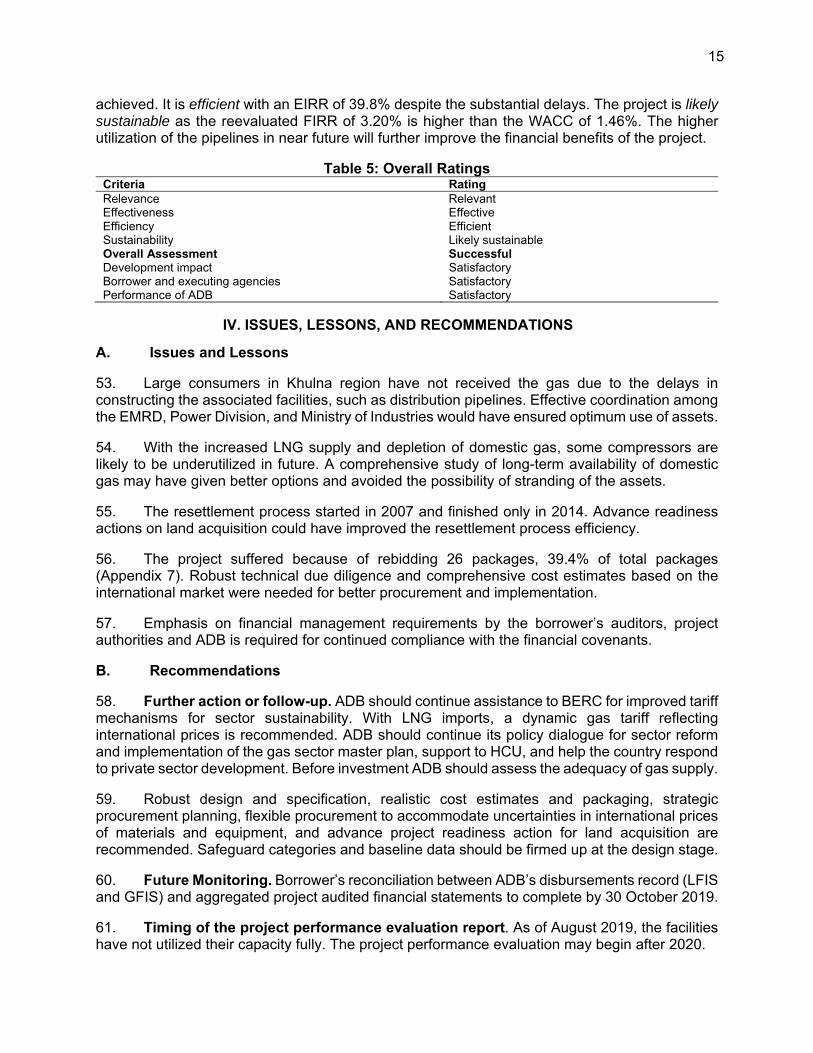
achieved. It is efficient with an EIRR of 39.8% despite the substantial delays. The project is likely sustainable as the reevaluated FIRR of 3.20% is higher than the WACC of 1.46%. The higher utilization of the pipelines in near future will further improve the financial benefits of the project.
Table 5: Overall Ratings Criteria Rating Relevance Relevant Effectiveness Effective Efficiency Efficient Sustainability Likely sustainable Overall Assessment Successful Development impact Satisfactory Borrower and executing agencies Satisfactory Performance of ADB Satisfactory
IV. ISSUES, LESSONS, AND RECOMMENDATIONS
A. Issues and Lessons 53. Large consumers in Khulna region have not received the gas due to the delays in constructing the associated facilities, such as distribution pipelines. Effective coordination among the EMRD, Power Division, and Ministry of Industries would have ensured optimum use of assets. 54. With the increased LNG supply and depletion of domestic gas, some compressors are likely to be underutilized in future. A comprehensive study of long-term availability of domestic gas may have given better options and avoided the possibility of stranding of the assets. 55. The resettlement process started in 2007 and finished only in 2014. Advance readiness actions on land acquisition could have improved the resettlement process efficiency. 56. The project suffered because of rebidding 26 packages, 39.4% of total packages (Appendix 7). Robust technical due diligence and comprehensive cost estimates based on the international market were needed for better procurement and implementation. 57. Emphasis on financial management requirements by the borrower’s auditors, project authorities and ADB is required for continued compliance with the financial covenants. B. Recommendations 58. Further action or follow-up. ADB should continue assistance to BERC for improved tariff mechanisms for sector sustainability. With LNG imports, a dynamic gas tariff reflecting international prices is recommended. ADB should continue its policy dialogue for sector reform and implementation of the gas sector master plan, support to HCU, and help the country respond to private sector development. Before investment ADB should assess the adequacy of gas supply. 59. Robust design and specification, realistic cost estimates and packaging, strategic procurement planning, flexible procurement to accommodate uncertainties in international prices of materials and equipment, and advance project readiness action for land acquisition are recommended. Safeguard categories and baseline data should be firmed up at the design stage. 60. Future Monitoring. Borrower’s reconciliation between ADB’s disbursements record (LFIS and GFIS) and aggregated project audited financial statements to complete by 30 October 2019. 61. Timing of the project performance evaluation report. As of August 2019, the facilities have not utilized their capacity fully. The project performance evaluation may begin after 2020.
16 Appendix 1
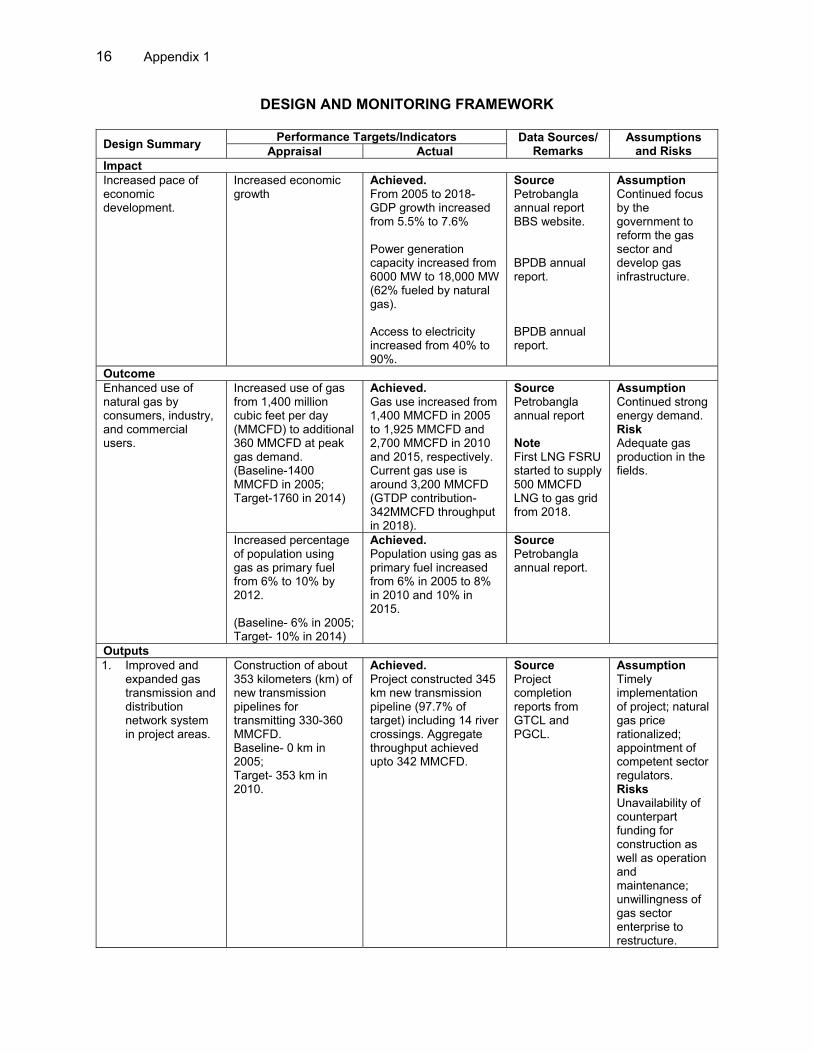
DESIGN AND MONITORING FRAMEWORK
Design Summary Performance Targets/Indicators Data Sources/
Remarks Assumptions
and Risks Appraisal Actual Impact Increased pace of economic development.
Increased economic growth
Achieved. From 2005 to 2018- GDP growth increased from 5.5% to 7.6% Power generation capacity increased from 6000 MW to 18,000 MW (62% fueled by natural gas). Access to electricity increased from 40% to 90%.
Assumption Continued focus by the government to reform the gas sector and develop gas infrastructure.
Outcome Enhanced use of natural gas by consumers, industry, and commercial users.
Increased use of gas from 1,400 million cubic feet per day (MMCFD) to additional 360 MMCFD at peak gas demand. (Baseline-1400 MMCFD in 2005; Target-1760 in 2014)
Achieved. Gas use increased from 1,400 MMCFD in 2005 to 1,925 MMCFD and 2,700 MMCFD in 2010 and 2015, respectively. Current gas use is around 3,200 MMCFD (GTDP contribution- 342MMCFD throughput in 2018).
Source Petrobangla annual report Note First LNG FSRU started to supply 500 MMCFD LNG to gas grid from 2018.
Assumption Continued strong energy demand. Risk Adequate gas production in the fields.
Increased percentage of population using gas as primary fuel from 6% to 10% by 2012. (Baseline- 6% in 2005; Target- 10% in 2014)
Achieved. Population using gas as primary fuel increased from 6% in 2005 to 8% in 2010 and 10% in 2015.
Source Petrobangla annual report.
Outputs 1. Improved and
expanded gas transmission and distribution network system in project areas.
Construction of about 353 kilometers (km) of new transmission pipelines for transmitting 330-360 MMCFD. Baseline- 0 km in 2005; Target- 353 km in 2010.
Achieved. Project constructed 345 km new transmission pipeline (97.7% of target) including 14 river crossings. Aggregate throughput achieved upto 342 MMCFD.
Source Project completion reports from GTCL and PGCL.
Assumption Timely implementation of project; natural gas price rationalized; appointment of competent sector regulators. Risks Unavailability of counterpart funding for construction as well as operation and maintenance; unwillingness of gas sector enterprise to restructure.
Appendix 1 17
Design Summary Performance Targets/Indicators Data Sources/
Remarks Assumptions
and Risks Appraisal Actual Installation of
compressors at Ashuganj and Muchai with throughputs of 370-890 MMCFD. Baseline- 0 in 2005; Target- 4 in 2010.
Not achieved under this project.1 The component was transferred and completed under subsequent ADB project (Loan 2622-BAN) for a throughput of 2000 MMCFD (footnote 15).
Source Government’s project completion report of ADB Loan 2622-BAN.
Construction of new gas distribution network of about 200 km in the Rajshahi area in western Bangladesh. Baseline- 0 km in 2005; Target- 200 km in 2010.
Substantially Achieved. 270 km distribution pipelines constructed (135% of target) and commissioned in 2011.
Source PGCL’s project completion report
2. Field appraisal of gas fields to update estimated gas reserves and determine exact location for future exploration activities
Five three-dimensional seismic survey reports from Bakhrabad, Kailastila, Rashidpur, Sylhet, and Titas. Baseline- 0 in 2005; Target- 5 in 2010
Achieved. Seismic surveys were carried out in 5 gas fields covering 1250 square KM area from 2012 to 2013. Data interpretation report prepared from 5 gas fields (100% of target) was submitted in 2014.
Source Project completion reports from BGFCL and SGFL.
3. Enhanced financial performance, governance and efficiency indicators of the gas sector utilities through capacity building and implementation of the GSRR to attract private sector investment
Formulation and implementation of the GSRR, a program to reduce system losses to 6% in 2005, 4% by 2007, and 2% by 2010.
Achieved. GSRR was formulated in 2005 and approved in 2009. System loss was brought to 1.82% by 2010 and kept less than 2% onwards. Please refer to Appendix 11 for GSRR agenda achievement and Appendix 16 for updates on gas system loss reduction plan.
Source TGTDCL’s annual Report.
Efficient operation and management of gas entities. Debt service coverage ratio of 1.2 from 2007 and self- financing ratio of 30% from 2008 onwards.
Achieved. Please refer to covenant 18 of Appendix 9.
Source Petrobangla annual Report
Introduction of policies and regulations to streamline processes and attract private sector investment.
Achieved. Bangladesh Gas Act was approved in 2010. Gas Development Fund Policy was approved in 2012. Compressor station at Muchai was constructed by
Source Petrobangla annual Report
1 ADB dropped the compressor stations package from the loan on 23 November 2009. The scope change was approved
by ADB post facto vide memo dated 8 October 2013. However, DMF was not updated to reflect the change in scope.
18 Appendix 1
Design Summary Performance Targets/Indicators Data Sources/
Remarks Assumptions
and Risks Appraisal Actual Cheveron Bangladesh Limited under Production sharing contract with Petrobangla. Govt. introduced policies and regulations to streamline processes and attract private sector investment for LPG and LNG sector (para 39; Appendix 11).
4. Improved air quality. Baseline to be determined during project implementation.
Baseline - None Achieved. Baseline was not determined during project processing or at implementation. But overall air quality improved. Connection of 9,155 households with 14,638 gas stoves in Rajshahi area replaced the firewood for cooking and contributed to improved ambient and indoor air quality. Approximately 2,794,510 tons of CO2 emission has been estimated to have avoided till 2018. 61,351,249 tons of CO2
emission reduction is expected by up to 2037
Source PCR Appendix 12.
BBS = Bangladesh Bureau of Statistics, BGFCL= Bangladesh Gas Fields Company Ltd, BPDB = Bangladesh Power Development Board, GDP = gross domestic product, GSRR = gas sector reform roadmap, GTCL = Gas Transmission Company Ltd., GTDP = Gas Transmission And Development Project, LNG = liquefied natural gas, LPG = liquefied petroleum gas, MMCFD = million cubic feet per day, PGCL = Pashchimanchal Gas Company Ltd., PSC = production sharing contract, SGFL = Sylhet Gas Fields Company Ltd.
19 A
ppendix 2
PROJECT COST AT APPRAISAL AND ACTUAL
Table A2.1: Estimated Project Cost at Appraisal and at Actual completion ($'000)
Item Appraisal Estimate Actual
Foreign Currency
Local Currency
Total Cost Foreign
Currency Local
Currency Total Cost
A. Gas Transmission A1. Ashuganj-Jamuna Brdg Gas Trans Pipeline (AJGTP) 53,400.00 30,000.00 83,400.00 31,195.63 2,165.33 33,360.95 A2. Hatikumrul-Bheramara Gas Trans Pipeline (HBGTP) 30,000.00 26,000.00 56,000.00 50,819.46 35,749.41 86,568.87 A3: Bonpara-Rajshahi Gas Trans Pipeline (BRGTP) 12,000.00 12,400.00 24,400.00 8,173.29 11,848.11 20,021.40 A4: Bheramara Khulna Gas Trans Pipeline (BKGTP) 44,000.00 48,400.00 92,400.00 55,680.17 53,568.50 109,248.67 A5: North-South System Expansion (NSSE) 31,600.00 16,300.00 47,900.00 - - -
Subtotal (A) 171,000.00 133,100.00 304,100.00 145,868.54 103,331.35 249,199.89 B. Field Appraisal 13,200.00 9,900.00 23,200.00 9,480.36 7,863.85 17,344.21 C. Rajshahi Gas Distribution Network 8,600.00 8,200.00 16,800.00 2,636.40 10,425.57 13,061.98 D. Capacity Building 11,700.00 2,400.00 14,100.00 7,755.14 1,972.52 9,727.66 E. Contingencies* 13,600.00 23,600.00 37,200.00 - - F. Financial Charges 16,900.00 1,200.00 18,100.00 14,375.91 - 14,375.91
Total (A+B+C+D+E+F) 235,000.00 178,400.00 413,400.00 184,329.71 123,593.30 303,709.65 Source: Asian Development Bank estimates, Loan and Grant Information System and Audited Project Financial Statement and government’s project completion
reports. Notes:
(i) *Includes local price contingency. (ii) Local currency actual expenditures converted to $1= Tk80.00
20 A
ppendix 3
PROJECT COST BY FINANCIER
Table A3.1: Project Cost at Appraisal by Financier
Item
Loan 2188 Loan 2189(SF) Grant 0019 GOB Total Cost
Amount % of Cost
Category Amount
% of Cost
Category Amount
% of Cost
Category Amount
% of Cost
Category Amount
Taxes and
Duties A. Investment Costs
1. Gas Transmission-Part A Part A (1), (2), (3), (5) 120.60 58.74% - - - - 84.70 41.26% 205.30 -
Part A (4) 43.90 47.58% - - - - 48.40 52.42% 92.30 - 2. Field Appraisal-Part B 12.40 55.53% - - - - 9.90 44.47% 22.30 - 3. Rajshahi gas distribution network-Part C 8.60 51.10% - - - - 8.20 48.90% 16.80 -
Subtotal (B) - - - - - Total Base Cost (A+B) 163.70 2.40 3.60 119.60 289.30 -
C. Contingencies - - - - - - D. Financial Charges During Implementation 14.30 0.10 - - 14.40 -
Total Project Cost (A+B+C+D) 178.00 2.50 3.60 1.18% 119.60 303.70 41.91 % Total Project Cost
58.62%
0.81% 39.39%
Note: Numbers may not sum precisely because of rounding. Source: Asian Development Bank estimates, Loan and Grant Information System and Audited Project Financial Statement.
22 Appendix 4
DISBURSEMENT OF ADB LOAN PROCEEDS
Table 4.1: Annual and Cumulative Disbursement of ADB Loan Proceeds ($ million)
Date Events 2005 26 Feb-10 Mar Loan fact-finding mission fielded 11 Apr Management review meeting held 16 May-23 May Loan appraisal mission fielded 27 Oct Board approval 2006 18 Jun
28 Nov 10-18 Jul
Loan and project agreement signed between government of Bangladesh and ADB Loan declared effective Inception mission
2007
11-15 Feb 17-19 Dec
Review mission Special administration mission
2008 14-23 Sep Loan review mission fielded 2009 2-11 Feb Review mission/ handover mission 2010 17 Feb-11 Mar
2011 5 Aug-18 Aug Loan review mission fielded 2012 14 Feb -4 Mar Loan review mission fielded 2013 11 May- 30 May Loan review mission fielded 2014 1 Feb- 18 Feb Loan review mission fielded 2016 14 Nov-28 Nov Loan review mission fielded 2017 18 May Loan closing date B. Procurement Goods-A-A-1, GTCL (Project)/M-J/MP/001 (R)/632, Procurement of Line Pipes (Corrosion Coated Line Pipe, Station Pipes and Casing Pipe)–Single Stage Two Envelope 2006 22 Nov Submission of IFB and BD 24 Jan Bid issued 2007 1 Nov After successful bidding, contract was signed and later
terminated 2008 1 Jun Submission of revised IFB and BD for rebid 6 Jun ADB approved revised IFB and BD 14 Jun Bid issued 11 Aug Technical bid opened 29 Oct ADB received the technical bid 24 Dec ADB approved the TBER 2009 1 Jan Financial bid opened 26 Jan ADB received the FBER 30 Mar ADB approved the price bid evaluation report 14 May Contract signing 16 May ADB received the signed contract Goods-A-A-2, GTCL, Procurement of Pipeline Induction Bends Line Pipes (Corrosion Coated Line Pipe, Station Pipes and Casing Pipe)–Single Stage Two Envelope 2007 22 May Submission of IFB and BD 23 Jun Bid issued 5 Oct ADB advised for rebidding after submission of TBER 30 oct Submission of revised IFB and bid document for 2nd time
bid 12 Nov Bid issued 2008 7 July FBER received. Price 300% above estimate. Rebid decision 9 Jul Submission of revised IFB and bid document for 3rd time
bidding 21 Jul ADB approved the revised IFB and BD 22 Jul Bid issued 1 Sep Technical bid opened 29 Oct ADB received the technical bid 7 Nov ADB approved the TBER 3 Dec Financial bid opened 2009 26 Jan ADB received the FBER 14 May ADB approved the price bid evaluation report 12 Jul Contract signing
26 Appendix 7
Date Events 14 Jul ADB received the signed contract Goods-A-A-4, GTCL, Procurement of Pipeline Ball Valves–Single Stage Two Envelope 2007 22 May Submission of IFB and BD 23 Jun Bid issued 17 Nov ADB advised for rebidding after submission of TBER 20 Nov Submission of revised IFB and bid document for rebid 29 Nov ADB approved the revised IFB and BD 8 Dec Bid issued 2008 7 Feb Technical bid opened 4 May ADB received the technical bid 31 May ADB approved the TBER 10 June Financial bid opened 17 June ADB received the FBER 7 Jul ADB approved the price bid evaluation report 29 Sep Contract signing 5 Oct ADB received the signed contract Goods, GTCL/B-RP/EPC/002, Design, Build, Supply, Installation, Construction, Testing and Commissioning of City Gate Station at Rajshahi and District Regulating Stations at Puthia and Natore under Bonpara, Rajshahi Transmission Pipelines–Single Stage Two Envelope 2009 15 Nov Submission of IFB and BD 17 Dec ADB approved the revised IFB and BD 2010 28 Jan Bid issued 3 Jun Technical bid opened 2011 12 Apr ADB received the technical bid 27 Sep ADB approved the TBER 3 Oct Financial bid opened 5 Oct ADB received the FBER 6 Dec ADB approved the price bid evaluation report 2012 10 Jan Contract signing 24 Jan ADB received the signed contract Goods, GTCL/B-RP/MP/007, Procurement of Cathodic Protection (CP) Materials (Lot-1: Thermoelectric Generator) under Bonpara-Rajshahi Gas Pipelines–Single Stage Two Envelope 2009 26 Feb Submission of IFB and BD 9 Apr ADB approved the revised IFB and BD 14 May Bid issued 14 July Technical bid opened 25 Oct ADB received the technical bid 17 Dec ADB approved the TBER 30 Dec Financial bid opened 2010 1 Mar ADB received the FBER 3 Mar ADB approved the price bid evaluation report 30 Mar Contract signing 31 Mar ADB received the signed contract Goods-A-D-1, GTCL/B-KP/MP(PV)/007/736, Anti Corrosion Coated Line Pipes–Single Stage Two Envelope 2008 9 Jun ADB received the IFB and BD 19 June ADB approved the revised IFB and BD 25 June BD issued 02 Sep Technical bid opening 27 Nov ADB received the TBER 2009 24 Sep ADB approved the TBER 30 Sep Financial bid opened 19 Oct ADB received the FBER 3 Nov ADB approved the price bid evaluation report 24 Nov Contract signing Turnkey, A-E. A-A-10; North-South System Expansion: Installation of Compressor Stations at Rashidpur (Muchai) and Ashugonj (South & West) and Elenga–Single Stage Two Envelope 2006 28 Feb ADB received the IFB and BD
4 Apr ADB approved the IFB and BD 16 Apr BD issued 3 Sep Technical bid closing
2007 2 Jul ADB received the TBER
Appendix 7 27
Date Events 25 Oct Decision for rebidding
19 Dec ADB receive the revised IFB and BD 2008 10 Jan ADB approved the revised IFB and BD
23 Jan BD issued 4 Jun Technical bid closing 29 Oct ADB received the TBER
2009 7 Jan ADB approved the TBER 9 Feb Financial bid opened 13 May ADB received the FBER 23 Sep Declared annulled
Turnkey, A-B-9, GTCL/J-B/EPC/Rx-ing/Gr.B/460, River Crossing (Group-B), Goai, Atrai, Boral, khalishasenga and Nondogoja–Single Stage Two Envelope 2008 17 Sep ADB received the IFB and BD 2009 7 Jan ADB approved the revised IFB and BD 3 Aug BD issued 27 Oct Technical bid closing 2010 2 Mar ADB received the TBER 13 May ADB approved the TBER 19 May Financial bid opened 31 May ADB received the FBER 10 Jun ADB approved the price bid evaluation report 24 Aug Contract signing 26 Aug ADB received the signed contract Goods, GTDP/3-D/BGFCL/ MATS/G2l2.3, (BB-1), Procurement of Survey Data Processing Hardware (Workshop & Laptop) for 3-D Seismic Operation–Single Stage One Envelope 2008 11 Mar ADB received the IFB and BD 17 Mar ADB approved the revised IFB and BD 2 Apr BD issued 1 Jun Bid opening held 7 Aug ADB received the BER 8 Sep ADB approved the contract awards 15 Oct Contracts signed Goods, B-B-8, BGFCL, Procurement of Explosive, Detonator and Cone-Anchor Set–Single Stage One Envelope 2008 29 May ADB received the IFB and BD 05 Aug ADB approved the revised IFB and BD 10 Aug BD issued 15 Oct Bid opening held 4 Nov ADB received the BER 14 Nov ADB approved the contract awards 2009 20 Mar Contracts signed 24 Jun ADB received the signed contracts Goods, C-A, Procurement of Line Pipe–Single Stage Two Envelope 2007 18 Dec ADB received the IFB and BD 10 Jan ADB approved the revised IFB and BD 20 Feb BD issued 25 Apr Technical bid closing 28 Jun ADB received the TBER 18 Jul ADB approved the TBER 24 Jul Financial bid opened 30 Jul ADB received the FBER 10 Aug ADB approved the price bid evaluation report 16 Sep Contract signing Goods – B-A-1, SGFL, Procurement of Equipment, Hardware, Software and Accessories for 3-D Seismic Survey (Impulsive Operation)–Single Stage One Envelope 2006 2 Jul ADB received the IFB and BD 3 Jul ADB approved the revised IFB and BD 18 Jul BD issued 02 Nov Bid opening held 10 Dec ADB received the BER 2007 01 Mar ADB approve the BER 04 Apr Contract signed
28 Appendix 7
Date Events Goods – B-A-2, SGFL, Procurement of Materials of Geophone Sting–Single Stage One Envelope 2007 4 Nov ADB received the IFB and BD 15 Nov ADB approved the revised IFB and BD 2008 27 Jan BD issued 20 Mar Bid opening held 20 May ADB received the BER 8 Jul ADB approved the contract awards 26 Aug Contract signed Consulting Services–Data Conversion, BAPEX–Quality and Cost Based Selection (QCBS)/ Full Technical Proposal (FTP) 2008 5 Jul Date of advertisement 2009 10 Feb Submission of draft RFP and shortlist of consultants to ADB 11 May
21 May ADB’s approval of RFP and shortlist of consultant Issuance of RFP
21 Jul Deadline for submission of proposal 13 Oct Submission of technical evaluation report to ADB 2010 13 May ADB’s approval of the technical evaluation report 20 May Opening of financial proposals 10 Jun Submission of financial evaluation and final ranking documents 11 Jul ADB’s approval of the financial evaluation and final ranking
documents 2011 3 Jan Submission of the negotiated contract to ADB 18 Apr ADB’s approval of the negotiated contract 26 May Contract signed 15 Jun Consultants mobilized Consulting Services, GTDP/3-D/BGFCL/SV(01)–3-D Seismic Operation Service Provider–Quality and Cost Based Selection(QCBS)/ Full Technical Proposal (FTP) 2008 21 Sep Date of advertisement in ADBBO 2009 3 Feb Submission of draft RFP and shortlist of consultants to ADB 2 Apr ADB’s approval of RFP and shortlist of consultant 21 Apr Issuance of RFP 22 Jun Deadline for submission of proposal 19 July Submission of technical evaluation documents to ADB 16 Aug ADB’s approval of the technical evaluation documents 2010 27 Aug Opening of financial proposals 29 Sep Submission of financial evaluation and final ranking documents 29 Sep ADB’s approved financial evaluation and final ranking
documents 14 Feb Submission of the negotiated contract to ADB 31 Mar ADB’s approval of the negotiated contract 21 Jun Contract signed Consultants mobilized
ADB = Asian Development Bank, ADBBO = ADB Business Opportunities, BD = Bidding Document, TBER = Technical Bid Evaluation Report, FBER= Financial Bid Evaluation Report, IFB = Invitation for Bids, RFP= Request for Proposal. Source: Asian Development Bank C. Procurement Issues Affecting Project Implementation (i) Cancellation of financing for Part-B, Field appraisal consultant engagement: ADB did not finance
expert services under this component, since the offered price from the sole firm that was declared responsive after 3 consecutive EOIs, was much higher than the estimate. The firm was engaged under EA’s own financing.
(ii) Rebidding: A total of 26 rebidding under Loan 2188 including 15 under GTCL, 3 under BGFCL and 8 under PGCL took a long time to complete procurement. Details are–
Components Description Number of Rebidding
Remarks
A1: AJGTP Package A-A-1 (Line Pipe)
1 The first contractor and manufacturer of the project M/S LSTC denied supplying pipes at the contract price due to global increase of steel price. GTCL encashed performance guarantee (Tk250 million) and invited re-bidding in expense of 2 years delay.
Appendix 7 29
Components Description Number of Rebidding
Remarks
A1: AJGTP Package A-A-2 (Induction bend)
2 Procurement of induction bend went for rebid twice due to non-responsive technical bids, causing more than a year of delay.
1 Rebidding due to lack of competition. Packaging issue.
Drilling machine and rig 1 Rebidding due to lack of competition. Total Number of Rebidding for BGFCL 3 C: PGCL C-B-Group-A (Filter
separator and strainer) 1 Cost overruns.
C-B-Group B (Regulator, slam, shut valve & relief vale)
2 Cost overruns.
C-B-Group D (Valve) 1 Cost overruns. C-B-Group F (Coating
material) 2 Cost overruns.
C-B-Group-G (Odonizer) 2 Cost overruns. Total Number of Rebidding for PGCL 8 Total Number of Rebidding under 2188 26
(iii) Contractors performance. Followed by a burst at a 45-degree 8D induction bend at Belpukur
valve station at 43 km chainage on 2 November 2013, GTCL conducted mechanical property test and chemical composition tests for the procured materials from Bangladesh University of Engineering and Technology (BUET). BUET test report in July 2014 confirmed the conformity with the requirements of chemical composition and dimension of the materials as per contract specifications but found deviations in tensile properties of the procured bend materials with that of contract specifications. Heat treatment requirement was not complied for the materials, which, according to test report of BUET, was the reason behind the failure of the bends. The incident occurred beyond the warranty period ending in March 2011. The defective bend was replaced with new bend from the same lot.
30 Appendix 8
IMPLEMENTATION OF SAFEGUARDS
A. Environmental Safeguard 1. Two consulting firms (i) Center for Environmental and Geographic Information Services (CEGIS) for PGCL and (ii) Resource Control Company Limited (RCC) for GTCL were recruited for environmental monitoring including the EMP implementation performance. In PGCL component, environmental monitoring was carried out under an EMP Monitoring Framework and five quarterly progress reports, one annual report, and a final environmental monitoring report were prepared where at least eight consultation meetings and some focused group discussions were organized with project stakeholders on the implementation performance of EMP. While CEGIS had carry out on-the-job training on implementation of EMP, a professional training on environmental safeguard training was organized for 20 PGCL engineers and officials. 2. Under the GTCL component, an environmental management framework (EMF) and a safety hazard mitigation plan were prepared in accordance with the EMP. While there was an established environment unit at GTCL, project has also recruited a firm for environmental monitoring. It prepared and submitted an inception report and EMR in September 2008. However, the overall environmental quality monitoring and reporting (EMR) in GTCL component had some inadequacy, primarily due to the cancellation of compressor stations that resulted in turnover of the PMU staff to another project in 2010.1 Absence of firm environment safeguard category at the processing had also caused this lapse. Staff turnover in PMU also affected the disclosure of environmental monitoring reports prepared by consultant, but the consultant’s inception report was duly shared with ADB. ADB continued to review, monitor and resolve the issues arisen on environmental compliances. Although, the records of systematic environmental monitoring or EMR are not fully available, PCR mission found adoption of suitable technology, such as horizontal directional drilling, for river crossings that minimized construction impacts and avoided significant adverse impacts on the navigation, fishery and other aquatic resources. A total of 734 trees were reported to have cut after the compensation to the owners were ensured. In Part B (3D seismic survey), there was an incidence of gas seepage, which was reviewed, monitored and duly addressed by EMRD under subsequent ADB Loan 2622-BAN.
B. Social Safeguard
3. ADB Monitoring at implementation. As a category A project for Involuntary Resettlement, in addition to the internal monitoring by PMU, ADB missions also included safeguards focal. A separate safeguards mission was conducted in March 2011. In addition to that, ADB resettlement officer and consultants joined the review missions of 2013, 2014 and 2016.
4. Use of best practices. The project secured adequate funding for social safeguards in Development Project Proforma (DPP) and ensured availability in due course as per estimates during implementation of resettlement plans (RP). Vulnerability allowance of Tk3,000.00 was paid to the affected female headed and vulnerable households. During implementation, the project avoided private land acquisition and impact on residential or commercial structures as best practice recommendations. However, livelihood restoration trainings were not done as anticipated at appraisal. Due to the unique nature of land acquisition requirement (20-30 feet wide strip of land throughout the line length) as discussed in Para 35 of the PCR, government needs
1 Compressor stations component prepared separate IEE, EIA, SIEE and EMP. When the compressor stations component was transferred to Loan 2622-BAN due to cost over-run, the PMU was also transferred. EMP for compressor stations was implemented under Loan 2622.
Appendix 8 31
customized options to support the affected people. Next ADB project may include adequate training plans for this.
5. Actual implementation. The major resettlement impact generated by the project was in part A sub-components executed by GTCL. GTCL hired an independent auditor on 3 February 2008 under the environment management framework to monitor the activities of the RP implementation. But due to premature termination of the consultant due to underperformance, the independent monitoring activities under the RP could not continue after 30 June 2011. Therefore, during RP implementation, there were no monitoring or reporting system for safeguards from 2011 to 2014. An external monitoring NGO for RP implementation was engaged in 2014. As all the RP implementation work was completed prior to their engagement, their reports cover documentation for consultation, focused group discussions, key informant interviews carried out by their team in the monitoring report, but not the monitoring reports at RP implementation. However, the PCR Mission found that though the reporting was interrupted, compensations were provided as documented in the six project completion reports from the executing agencies. In part B, the 3-D seismic survey caused no relocation or impact on livelihood as impact was only for 15 days. The project ensured compensation for crop loses through local government. In part C, the RP anticipated 3.03 hectares of land acquisition in the PGCL section. During implementation- impact was on 2.02 hectares—0.58 hectares from the Rajshahi Development Authority (RDA) and 1.44 hectares from four households in Khorkhori-Rajshahi for the substation. The handover of compensation has been completed in due course. As the land was completely barren during acquisition, no relocation or impact on livelihood had been involved in the process. During laying pipelines, the project avoided impacting private assets by following roadside right of way. Therefore, majority of the compensation was for inter-department land transfers and reconstruction of roads to pre-project level. Table 8.1 summarized actual land acquisition compared to the plan.
Table 8.1: Land acquisition – Planned versus Actual
Components Executing and implementing agency
Social Impact at appraisal
Social Impact at completion
Part A: Gas Transmission GTCL 351.55 hectares permanent acquisition + 628.5 hectares temporary requisition.
Part B: Field Appraisal BGFCL and SGFL with BAPEX as IA
Short term impact on crop of 270 hectares crop land, amounting $155,000.
$1,473 cash compensation for crops3.
Part C: Gas distribution pipeline
PGCL 3.03 hectares permanent acquisition.
2.02 hectares permanent acquisition4.
6. Grievance Redress Committees. For resolving grievances at project level, 216 union level grievance redress committees had been formed5 under part A, the component with maximum social impact as per the RRP. Total 3,037 issues had been recorded and 2,337 issues had been resolved through 117 sessions, considering rest of the issues unqualified as per record.
2 GTCL’s monitoring reports December 2015 and December 2014. 3 As per government’s project completion report, only 1.16% of the estimated budget for compensation has been handed over based on the revised requirement during implementation. 4
0.58 hectares of land has been acquired from Rajshahi Development Authority and 1.44 hectares of private land has been acquired from four households. Source: Govt PCR. 5 Social Safeguard Monitoring Report 02 & 03, Section 4.3 (GRM);
32 A
ppendix 9
STATUS OF COMPLIANCE WITH LOAN COVENANTS
Covenant Reference in Loan Agreement
Status of Compliance
1. (a) The Borrower shall cause GTCL, SGFL, BGFCL, PGCL,
and Petrobangla to carry out the Project with due diligence and efficiency and in conformity with sound administrative, financial, engineering, environmental and social practices.
(b) In the carrying out of the Project and operation of the Project facilities, the Borrower shall perform, or cause to be performed, all obligations set forth in Schedule 6 to the Special Operations Loan Agreement, the Project Agreement, and the Subsidiary Loan Agreement.
Loan 2188, Article-IV, Section 4.01
(a) Complied with.
Project was carried out by GTCL, SGFL, BGFCL, PGCL and Petrobangla with due diligence and efficient manner.
(b) Complied with.
2. The Borrower shall make available to GTCL, SGFL, BGFCL, PGCL, and Petrobangla, promptly as needed and on terms and conditions acceptable to ADB, the funds, facilities, services, land and other resources which are required, in addition to the proceeds of the Loan, for the carrying out of the Project.
Loan 2188, Article-IV, Section 4.02
Complied with.
3. The Borrower shall ensure that the activities of its departments and agencies with respect to the carrying out of the Project and operation of the Project facilities are conducted and coordinated in accordance with sound administrative policies and procedures.
Loan 2188, Article-IV, Section 4.03
Complied with.
4. The Borrower shall take all action which shall be necessary on its part to enable GTCL, SGFL, BGFCL, PGCL, and Petrobangla to perform their obligations under the Project Agreement and their respective obligations under Schedule 6 of the Special Operations Loan Agreement, including the establishment and maintenance of tariffs, and shall not take or permit any action which would interfere with the performance of such obligations.
Loan 2188, Article-IV, Section 4.04
Complied with.
5. (a) The Borrower shall exercise its rights under the Subsidiary
Loan Agreement in such a manner as to protect the interests of the Borrower and ADB and to accomplish the purposes of the Loan.
(b) No rights or obligations under the Subsidiary Loan Agreement shall be assigned, amended, abrogated or waived without the prior concurrence of ADB.
Loan 2188, Article-IV, Section 4.05
(a) Complied with.
Subsidiary Loan agreements were signed with all Executing Agencies in due time
(b) Complied with.
6. In the carrying out of the Project and operation of the Project facilities, the Borrower shall perform, or cause to be performed, all obligations set forth in Schedule 6 to this Loan Agreement, the Project Agreement, and the Subsidiary Loan Agreement.
Loan 2189(SF), Article-IV, Section 4.01
Complied with.
Appendix 9
33 A
ppendix 9 33
Covenant Reference in Loan Agreement
Status of Compliance
7. The Borrower shall enable ADB’s representatives to inspect the Project, the goods financed out of the proceeds of the Loan, and any relevant records and documents.
Loan 2189(SF), Article-IV, Section 4.02
Complied with. Review missions were held in every year during the project period.
8. The Borrower shall take all action which shall be necessary on its part to enable Petrobangla to perform its obligations under the Project Agreement,and shall not take or permit any action which would interfere with the performance of such obligations.
Loan 2189(SF), Article-IV, Section 4.03
Complied with. Petrobangla acted as the coordinating agency.
9. (a) The Borrower shall exercise its rights under the Subsidiary
Loan Agreement in such a manner as to protect the interests of the Borrower and ADB and to accomplish the purposes of the Loan.
(b) No rights or obligations under the Subsidiary Loan Agreement shall be assigned, amended, or waived without the prior concurrence of ADB.
Loan 2189(SF), Article-IV, Section 4.04
(a) Complied with. (b) Complied with.
10. Project Executing Agencies (a) GTCL shall be the Project Executing Agency for Part A of the
Project. SGFL and BGFCL shall be the Project Executing Agencies for Part B of the Project. PGCL shall be the Project Executing Agency for Part C of the Project. Petrobangla shall be the Project Executing Agency for Part D of the Project in coordination with EMRD and the concerned entities.
(b) For Part B of the Project, within one month of the Effective Date, SGFL, BGFCL and BAPEX, as the implementing agency, shall enter into a project implementation contract to specify the implementation schedule and implementation arrangements, including respective roles and responsibilities with regard to consultant’s selection, procurement, resettlement plan, environmental management plan, project performance monitoring system, and reporting.
Loan 2189(SF), Schedule 6, para 1
(a) Complied with.
The executing agencies are, GTCL for Part A; BGFCL and SGFL for Part B where BAPEX was implementing agency; PGCL for Part C; and TGTDCL, BAPEX, HCU, Petrobangla in coordination with EMRD for Part D.
(b) Complied with three months’ delay due to change in the
democratic government in 2005.
11. Project Coordination Unit (PCU) and Project Management Units- The Project Management Units (PMUs) set up by the Project Executing Agencies for each Part of the Project shall be responsible for the day-to-day project implementation and supervision. The Project Coordination Unit (PCU) established within Petrobangla shall be responsible for coordinating all Project related matters with the PMUs. The PMUs shall communicate with ADB on operational matters. The Borrower shall ensure, or cause the Project Executing Agencies to ensure, that each of the PMUs and PCU is headed by senior officers of respective Project Executing Agency and remain adequately staffed at all times throughout Project implementation period.
Loan 2189(SF), Schedule 6, para 2
Complied with. Total 12 PMUs were set up in following executing agencies- GTCL-4 SGFL-1 BGFCL-1 PGCL-1 TGTDCL-1 BAPEX-1 HCU-1 EMRD-1 Petrobangla-1
34 A
ppendix 9
Covenant Reference in Loan Agreement
Status of Compliance
12. Project Steering Committee- The Borrower shall ensure that the PSC shall meet once a month to coordinate and provide necessary guidance with regard to the Project.
Loan 2189(SF), Schedule 6, para 3
Complied with. PSC held regular coordination meetings and provided necessary guidance regarding the project.
13. Counterpart Funding- Without limiting the generality of Sections 4.02 of this Loan Agreement and the Ordinary Operations Loan Agreement, the Borrower shall ensure that counterpart funds (in the form of loan and equity) necessary for the Project are provided and disbursed in a timely manner to enable successful implementation and completion of Project activities.
Loan 2189(SF), Schedule 6 Para 4
Complied with. $119.64 million was funded from GOB part.
14. Policy Dialogue- The Borrower shall ensure that- (a) GSRR is implemented in accordance with the schedule
outlined, and the Borrower consults ADB prior to making any adjustments to GSRR;
(b) ADB is kept informed of the action program of the Borrower for natural gas exploration and development, and major investment programs, and specific exploration and development works to be carried out by Petrobangla, its related companies, and international oil companies; and,
(c) by 30 June 2006, the draft Gas Act, acceptable to ADB, is submitted to the Parliament for consideration, and the revised Energy Policy of 1996 is submitted to the Cabinet for approval.
Loan 2189(SF), Schedule 6, Para 5
Complied with. (a) The government adopted GSRR in 20091 and implemented
the same. Details are in appendix 10. (b) ADB is kept informed through letters, meetings between ADB
and the government agencies/entities. ADB missions also collected information.
(c) The draft Gas Act was discussed in the caretaker
government’s cabinet meeting in October 2006. The Gas Act was approved by the elected government in July 2010. National Energy Policy is not updated yet. Gas Development Fund Policy was approved in 2012, that addressed the needs of energy policy in the gas sector. Power system master plan was updated and approved twice in 2010 and 2016.
15. System Loss Reduction Plan- The Borrower shall ensure, and cause to be ensured, the implementation of the System Loss Reduction Plan approved by the Borrower and agreed with ADB.
Loan 2189(SF), Schedule 6 Para 6
Complied with. System loss reduction plan has been approved and implemented (Appendix 16).
16. Tariffs- The Borrower shall ensure that by 31 December 2005, the tariff determination at the end user level is transferred to the BERC, according to Chapter 7, Section 34 (1) Tariff of the Borrower’s ERC Act No. 13 of 2003, and tariffs for gas transmission, operation, and distribution companies are set at an adequate level to cover operating costs, maintenance and depreciation, and financing costs.
Loan 2189(SF), Schedule 6 Para 7
Complied with. The Bangladesh Energy Regulatory Commission was established on March 13, 2003 through a legislative Act of the government of Bangladesh. The commission became effective on April 27, 2004, with the appointment of two, of the five-member commission including the Chairman. The 1st Chairman was appointed on June 4, 2005. All five members were appointed in 2009. The commission has the mandate to regulate electricity, gas and Petroleum products for the whole of Bangladesh. Details are in appendix 11.
1 Approval of GSRR was confirmed by Petrobangla through its letter dated 5 January 2009.
Appendix 9
35 A
ppendix 9 35
Covenant Reference in Loan Agreement
Status of Compliance
17. Institutional Aspects- The Borrower shall ensure the operational autonomy required to secure, protect and advance the commercial, financial and administrative interests of GTCL, BGFCL, SGFL, PGCL, and Petrobangla and other gas sector entities. The Borrower shall also ensure that throughout Project implementation-
(a) No material organizational changes (either financial, operational, or structural) to, nor material asset transfer to or from any Project Executing Agency, including change in ownership of the Project facilities, are formally approved or implemented without prior approval of ADB, if such changes would affect the ability of the Project Executing Agency to perform its obligations under the Project Agreement and the Subsidiary Loan Agreement; and,
(b) Such changes are carried out in a transparent manner and in accordance with applicable laws and regulations.
Loan 2189(SF), Schedule 6 Para 8
Complied with. Gas sector entities are autonomous and their commercial, financial and administrative matters are handled by themselves. During or after project implementation-
(a) No material organizational change occurred till today.
(b) No material assets transfer took place.
18. Financial Covenants- The Borrower shall take necessary measures, including permitting tariff increase when required, to enable, during the life of the Project-
(a) GTCL and SGFL to maintain a self-financing ratio (as defined in Section 2.16 of the Project Agreement) of at least 30 percent from fiscal year 2005 and thereafter; and BGFCL to maintain the self-financing ratio of at least 30 percent from fiscal year 2008 and thereafter; and,
Loan 2189(SF), Schedule 6 Para 9
Generally complied with. A detailed assessment of the three companies’ financial managements are presented in PCR’s appendix 15.
(b) GTCL, SGFL and BGFCL to maintain a debt-service ratio (as defined in Section 2.17 of the Project Agreement) of not less than 1.2 times estimated debt-service requirement from fiscal year 2005 and thereafter.
(b) Debt service ratio were- Debt -service ratio Fiscal year GTCL SGFL BGFCL FY 2005-06 1.20 3.47 3.76 FY 2006-07 1.46 4.94 3.91 FY 2007-08 1.94 6.23 4.32 FY 2008-09 2.28 10 4.44 FY 2009-10 3.08 12.31 4.20 FY 2010-11 3.99 12.33 3.68 FY 2011-12 4.42 4.88 3.82 FY 2012-13 4.29 N/A 6.72 FY 2013-14 4.99 No debt to coverage 5.28 FY 2014-15 7.24 No debt to coverage 10.94 FY 2015-16 3.30 No debt to coverage 11.11 FY 2016-17 0.81 No debt to coverage 6.08
19. Land Acquisition and Resettlement- (a) The Borrower through GTCL and PGCL shall ensure that
land acquisition and resettlement activities under the Project are implemented strictly in accordance with the Resettlement Framework and the Resettlement Plans. This will include the following: (a) all land and rights-of-way required for the Project are acquired and made available in a timely manner; (b) compensations are provided and disbursed to affected persons prior to possession of land and assets on the basis of replacement cost in a manner satisfactory to ADB; (c) within two months of the Effective Date, an independent auditor, acceptable to ADB, is hired by each of GTCL and PGCL to undertake external monitoring of the activities under the Resettlement Plans, and to report regularly on the progress; (d) grievance redressal committees, comprised of representatives of local authorities, affected persons, local communities, and senior officials of the respective Project Executing Agency, are set up to address concerns and grievances of the local communities and affected persons; (e) adequate information are disseminated, and affected persons are regularly consulted; and (f) any changes to the Resettlement Framework and Resettlement Plan become effective only after review and approval by ADB and are disclosed to affected persons.
Loan 2189(SF), Schedule 6 Para 10 ,11,12
(a) Complied with.
Resettlement activities under the project are implemented in accordance with the resettlement Framework and plan by GTCL and PGCL for gas transmission lines and gas distribution network. Impacts on land have been avoided through design changes, which reduced land acquisition impact from stipulated impacts of the resettlement plans. An external monitor team has been engaged and the monitoring reports submitted are disclosed to the website.
Appendix 9
37 A
ppendix 9 37
Covenant Reference in Loan Agreement
Status of Compliance
(b) The Borrower shall ensure that by 31 December 2005, the Resettlement Plan for Part A(iv) is prepared based upon a detailed final design, measurement and survey and is submitted to ADB for review and approval. In all cases compensations to affected persons shall be at replacement cost.
(c) The Borrower shall ensure that all Resettlement Plans are updated, if required, based on the detailed design, measurement and survey, submitted to ADB for review and approval, and disclosed to the affected persons prior to commencing construction works.
(b) Complied with. Loans and grant were made effective in November 2006. RP was prepared in 2007 (Appendix 8).
(c) Complied with.
RP implementation was closely supervised by executing agencies and reviewed by ADB.
20. Environmental and Social Issues- The Borrower through GTCL, SGFL, BGFCL, PGCL and Petrobangla shall ensure that the design, construction and operation of all Project facilities comply with the environmental laws and regulations of the Borrower and environmental policies and regulations of ADB, specifically ADB’s Environment Policy (2002), and the environmental mitigation measures and the environmental management plans (EMPs) described in the IEEs and in the Summary IEE are implemented for the Project. These include (a) binding requirements for the contractors to fully reinstate local roads and infrastructure and agricultural lands to at least their original condition; (b) monitoring of EMPs implementation by external monitors to be hired by the Project Executing Agencies, and (c) incorporation of environmental safeguards and practices in a model construction contract with contractors.
Loan 2189(SF), Schedule 6 Para 13
Complied with. Appendix 8 elaborates status of safeguards implementation. GTCL and PGCL appointed environmental safeguard implementation consultant and submitted reports. However, BAPEX (covering the requirements for SGFL and BGFCL) did not submit any report, as the impact was considered temporary at appraisal (for 15 days only). Relevant terms of environmental safeguards were embedded in project’s bidding documents. Implementation was closely supervised by executing agencies and their consultants and reviewed by ADB.
21. The Borrower, through GTCL, SGFL, BGFCL, and PGCL shall ensure that contractors under the Project, where applicable, are required to- (a) Be responsible for carrying out of information and
education campaigns on sexually transmitted diseases and human immunodeficiency virus for construction workers as part of their health and safety program during the construction period;
(b) Comply with all applicable labor laws, and will not employ child labor for construction and maintenance activities,
(c) Set employment targets for women, acceptable to ADB, for project activities; and
(d) Provide equal wages for men and women for work of equal value.
Loan 2189(SF), Schedule 6, Para14
Complied with. Relevant terms were embedded in the bid documents. Implementation was closely supervised by executing agencies and reviewed by ADB.
38 A
ppendix 9
Covenant Reference in Loan Agreement
Status of Compliance
22. Anticorruption Measures- ADB shall be entitled to investigate directly, or through its agents, any possible financial or management impropriety in conducting the Project. The Borrower shall, and shall cause GTCL, SGFL, BGFCL, PGCL and Petrobangla to, cooperate with any such investigation and extend necessary assistance, including access to all relevant books and records, as well as engagement of independent experts that may be needed for satisfactory completion of such investigations. All external costs related to the investigations will be borne by the Project.
Loan 2189(SF), Schedule 6 Para15
Complied with.
23. Project Performance Monitoring System (PPMS)- The Borrower shall ensure that a PPMS is established to assess Project implementation and progress, and to measure Project impacts and outcomes. The Borrower shall also ensure that routine air quality monitoring by its Department of Environment shall be used to indicate improvement in air quality.
Loan 2189(SF), Schedule 6 Para 16
Partially complied with. PPMS were established within the executing agencies. All executing agencies submitted quarterly progress reports. Air quality, however, was not monitored under this project. Secondary data was used to monitor improvement.
24. Cofinancing The Borrower shall ensure that in the event the Grant referred to in Recital (C) of this Agreement does not become available, appropriate arrangements shall be made to cover the shortfall through additional counterpart funding or through other sources. If such arrangements cannot be made within reasonable time, the activities under Part D(i) of the Project shall be scaled down after consultations between the Borrower and ADB.
Loan 2189(SF), Schedule 6 Para 17
Complied with. Grant was available and there was no shortfall.
25. (a) The Project Executing Agency shall carry out the Project
with due diligence and efficiency, and in conformity with sound administrative, financial, engineering, environmental and gas supply, distribution and management practices.
(b) In the carrying out of the Project and operation of the Project facilities, the Project Executing Agency shall perform all obligations set forth in each of the Loan Agreements to the extent that they are applicable to the Project Executing Agency and the Subsidiary Loan Agreement.
Project Agreement, Article-II, Section-2.01
Complied with. Project Executing agencies (total 9) performed all obligations as per loan agreement.
26. The Project Executing Agency shall make available, promptly as needed, the funds, facilities, services, equipment, land and other resources which are required, in addition to the proceeds of the Loans, for the carrying out of the Project.
Project Agreement, Article-II, Section-2.02
Complied with. All executing agencies ensured funds and resources and took all necessary measures as required time to time to carry out the project.
27. (a) In the carrying out of the Project, the Project Executing
Agency shall employ competent and qualified consultants
Project Agreement,
(a) Complied with.
Appendix 9
39 A
ppendix 9 39
Covenant Reference in Loan Agreement
Status of Compliance
and contractors, acceptable to ADB, to an extent and upon terms and conditions satisfactory to ADB.
(b) Except as ADB may otherwise agree, all goods and services to be financed out of the proceeds of the Loans shall be procured in accordance with the provisions of Schedule 4 and Schedule 5 to the Ordinary Operations Loan Agreement. ADB may refuse to finance a contract where goods or services have not been procured under procedures substantially in accordance with those agreed between the Borrower and ADB or where the terms and conditions of the contract are not satisfactory to ADB.
Article-II, Section-2.03
GTCL appointed one consulting firm. BGFCL and SGCL appointed one consulting firm, BAPEX appointed one consulting firm, TGTDCL appointed one consulting firm and HCU unit appointed total nine individual consultants. All consultant recruitment was duly approved by ADB.
(b) Complied with. All goods and works under this project procured in accordance with the loan agreement.
28. The Project Executing Agency shall carry out the Project in accordance with plans, design standards, specifications, work schedules and construction methods acceptable to ADB. The Project Executing Agency shall furnish, or cause to be furnished, to ADB, promptly after their preparation, such plans, design standards, specifications and work schedules, and any material modifications subsequently made therein, in such detail as ADB shall reasonably request.
Project Agreement, Article-II, Section-2.04
Complied with.
29. (a) The Project Executing Agency shall take out and maintain
with responsible insurers, or make other arrangements satisfactory to ADB for, insurance of the Project facilities to such extent and against such risks and in such amounts as shall be consistent with sound practice.
(b) Without limiting the generality of the foregoing, the Project Executing Agency undertakes to insure, or cause to be insured, the goods to be imported for the Project and to be financed out of the proceeds of the Loans against hazards incident to the acquisition, transportation and delivery thereof to the place of use or installation, and for such insurance any indemnity shall be payable in a currency freely usable to replace or repair such goods.
Project Agreement, Article-II, Section-2.05
Complied with.
30. The Project Executing Agency shall maintain, or cause to be maintained, records and accounts adequate to identify the goods and services and other items of expenditure financed out of the proceeds of the Loans, to disclose the use thereof in the Project, to record the progress of the Project (including the cost
Project Agreement, Article-II, Section-2.06
Complied with.
40 A
ppendix 9
Covenant Reference in Loan Agreement
Status of Compliance
thereof) and to reflect, in accordance with consistently maintained sound accounting principles, its operations and financial condition.
31. (a) ADB and the Project Executing Agency shall cooperate
fully to ensure that the purposes of the Loans will be accomplished.
(b) The Project Executing Agency shall promptly inform ADB of any condition which interferes with, or threatens to interfere with, the progress of the Project, the performance of its obligations under this Project Agreement or the Subsidiary Loan Agreement, or the accomplishment of the purposes of the Loans.
(c) ADB and the Project Executing Agency shall from time to time, at the request of either party, exchange views through their representatives with regard to any matters relating to the Project, the Project Executing Agency, and the Loans.
Project Agreement, Article-II, Section-2.07
Complied with.
32. (a) The Project Executing Agency shall furnish to ADB all
such reports and information as ADB shall reasonably request concerning (i) the Loans and the expenditure of the proceeds thereof; (ii) the goods and services and other items of expenditure financed out of such proceeds; (iii) the Project; (iv) its administration, operations and financial condition; and (v) any other matters relating to the purposes of the Loans.
(b) Without limiting the generality of the foregoing, the Project Executing Agency shall furnish to ADB quarterly reports on the execution of the Project and on the operation and management of the Project facilities. Such reports shall be submitted in such form and in such detail and within such a period as ADB shall reasonably request, and shall indicate, among other things, progress made and problems encountered during the quarter under review, steps taken or proposed to be taken to remedy these problems, and proposed program of activities and expected progress during the following quarter.
(c) Promptly after physical completion of the Project, but in any event not later than three (3) months thereafter or such later date as ADB may agree for this purpose, the Project Executing Agency shall prepare and furnish to ADB
Project Agreement, Article-II, Section-2.08
(a) Complied with.
Executing agencies submitted bid evaluation reports, monitoring reports and kept ADB aware of the project progress regularly.
(b) Complied with.
All executing agencies submitted quarterly progress reports. During loan review mission, executing agencies provided necessary data as and when required.
(c) Complied with.
Executing agencies submitted nine project completion reports in due time.
Appendix 9
41 A
ppendix 9 41
Covenant Reference in Loan Agreement
Status of Compliance
a report, in such form and in such detail as ADB shall reasonably request, on the execution and initial operation of the Project, including its cost, the performance by the Project Executing Agency of its obligations under this Project Agreement and the accomplishment of the purposes of the Loans.
33. The Project Executing Agency shall (i) maintain separate accounts for the Project; (ii) have such accounts and related financial statements (balance sheet, statement of income and expenses, and related statements) audited annually, in accordance with appropriate auditing standards consistently applied, by independent auditors whose qualifications, experience and terms of reference are acceptable to ADB; and (iii) furnish to ADB, promptly after their preparation, but in any event not later than six (6) months after the close of the fiscal year to which they relate, certified copies of such audited accounts and financial statements and the report of the auditors relating thereto, including the auditors' opinion on the use of the proceeds of the Loans and compliance with the covenants of the Loan Agreements, all in the English language. Each of the Project Executing Agencies shall furnish to ADB such further information concerning such accounts and financial statements and the audit thereof as ADB shall from time to time reasonably request.
Project Agreement, Article-II, Section-2.09
Complied with. Executing agencies submitted their Audited Project Financial Statement (APFS) once in every year.
34. The Project Executing Agency shall enable ADB's representatives to inspect the Project, the goods financed out of the proceeds of the Loans, all other plants, sites, works, properties and equipment of the Project Executing Agency and any relevant records and documents.
35. (a) The Project Executing Agency shall, promptly as required,
take all action within its powers to maintain its corporate existence, to carry on its operations, and to acquire, maintain and renew all rights, properties, powers, privileges and franchises which are necessary in the carrying out of the Project or in the conduct of its business.
(b) The Project Executing Agency shall at all times conduct its business in accordance with sound administrative; financial; environmental; gas supply, distribution and management practices; and under the supervision of competent and experienced management and personnel.
Project Agreement, Article-II, Section-2.11
Complied with.
42 A
ppendix 9
Covenant Reference in Loan Agreement
Status of Compliance
(c) The Project Executing Agency shall at all times operate and maintain its plants, equipment and other property, and from time to time, promptly as needed, make all necessary repairs and renewals thereof, all in accordance with sound administrative, financial, engineering, environmental, gas supply, distribution and management practices, and operations and maintenance practices.
36. Except as ADB may otherwise agree, the Project Executing Agency shall not sell, lease or otherwise dispose of any of its assets which shall be required for the efficient carrying on of its operations or the disposal of which may prejudice its ability to perform satisfactorily any of its obligations under this Project Agreement.
Project Agreement, Article-II, Section-2.12
Complied with.
37. Except as ADB may otherwise agree, the Project Executing Agency shall apply the proceeds of the Loans to the financing of expenditures on the Project in accordance with the provisions of the Loan Agreements and this Project Agreement, and shall ensure that all goods and services financed out of such proceeds are used exclusively in the carrying out of the Project.
Project Agreement, Article-II, Section-2.13
Complied with.
38. Except as ADB may otherwise agree, the Project Executing Agency shall duly perform all its obligations under the Subsidiary Loan Agreement, and shall not take, or concur in, any action which would have the effect of assigning, amending, abrogating or waiving any rights or obligations of the parties under the Subsidiary Loan Agreement.
Project Agreement, Article-II, Section-2.14
Complied with.
39. The Project Executing Agency shall promptly notify ADB of any proposal to amend, suspend or repeal any provision of its Charter and shall afford ADB an adequate opportunity to comment on such proposal prior to taking any action thereon.
Project Agreement, Article-II, Section-2.14
Complied with.
40. (a) Except as ADB shall otherwise agree, each of GTCL,
BGFCL, and SGFL shall from time to time take all such measures as shall be required to produce based on a five-year moving average, funds from its internal sources as contribution to the capital expenditures at a level equivalent to not less than thirty percent (30%) of its capital expenditures starting from fiscal year 2005 and thereafter for GTCL and SGFL, and starting from fiscal year 2008 and thereafter for BGFCL.
(b) For the purposes of sub-paragraph (a) above- (i) “five-year moving average” shall mean the average
of the amount of two fiscal years preceding, two
Project Agreement, Article-II, Section-2.16
Complied with.
Appendix 9
43 A
ppendix 9 43
Covenant Reference in Loan Agreement
Status of Compliance
fiscal years subsequent and the respective fiscal year in consideration, applied both to the numerator and the denominator;
(ii) the term “capital expenditures” shall mean any expenditure incurred on account of fixed or capital assets, including interest charged to construction financed under a loan contract, but excluding interest during construction financed from funds from its internal sources; and
(iii) the term “funds from internal sources” shall mean the difference between: (aa) the sum of net operating revenue, net non-
operating income, and any other cash inflows other than funds for financing capital expenditures; and
(bb) the sum of all expenses of operations including maintenance and administration (excluding depreciation and other non-cash operating charges), interest and other charges on debt (excluding interest during construction financed under a loan contract), repayment of loans (including sinking fund payment, if any), all tax payments or payments in lieu of taxes, all cash distributions or surplus and any other cash outflows other than capital expenditures.
(c) GTCL, BGFCL, and SGFL shall from time to time take all necessary measures (including adjustments of tariffs) as shall provide the company with revenue sufficient to cover all operating expenses including taxes, depreciation, interest payments and other charges on borrowings.
41. (a) Except as the Bank shall otherwise agree, GTCL, BGFCL,
and SGFL shall not incur any debt, if after the incurrence of such debt the internal cash generation of the company would be less than 1.2 times the estimated maximum debt service requirement starting from its fiscal year 2005 and thereafter.
(b) For the purposes of sub-paragraph (a) above: (i) the term “debt” means any indebtedness of the
company maturing by its terms more than one year after the date on which it is originally incurred,
Project Agreement, Article-II, Section-2.17
Complied with.
44 A
ppendix 9
Covenant Reference in Loan Agreement
Status of Compliance
(including that portion of any such debt payable within one year from the date of any debt-service ratio calculation), provided that debt shall be counted only to the extent that it is drawn down and outstanding;
(ii) debt shall be deemed to be incurred under a loan contract or agreement or other instrument providing for such debt or for the modification of its terms of payment on the date of such contract, agreement or instrument;
(iii) the term “debt-service requirement” shall mean the aggregate amount of debt amortization (including sinking fund payments, if any), interest and other charges on debt, other than interest and other charges on debt which are financed under any loan to the company; and
(iv) the term “internal cash generation” shall mean the sum of net operating revenues, net non-operating income, and other cash inflow other than funds for financing capital expenditures, less the sum of all expenses of operations including maintenance and operation (excluding depreciation and non-cash operating charges) and taxes, but excluding interest and other charges on debt.
Appendix 10 45
WEIGHTING FACTORS TO DETERMINE PROJECT EFFECTIVENESS
Table 10.1: Calculation of Project Effectiveness
Item
Physical Completion
Completion Cost
($ million)
Weight of Component
based on completion
Weighted completion
of Component
A. Gas Transmission A.1. Ashuganj-Jamuna Bridge GTP* (AJGTP) 99.00% 33.36 11.50% 11.00% A.2. Hatikumrul-Bheramara GTP (HBGTP) 97.00% 86.57 30.00% 29.00% A.3. Bonpara-Rajshahi GTP (BRGTP) 88.00% 20.02 7.00% 6.00% A.4. Bheramara Khulna GTP (BKGTP) 98.00% 109.25 38.00% 37.00% A.5. North-South System Expansion (NSSE) 0.00% 0.00 0.00% 0 .00% B. Field Appraisal 100.00% 17.34 6.00% 6.00% C. Rajshahi Gas Distribution Network 96.00% 13.06 4.50% 4.00% D. Capacity Building 100.00% 9.73 3.00% 3.00% Total 289.33 100.00% 98.00%
* Gas Transmission Pipeline
46 A
ppendix 11
GAS SECTOR REFORM ROAD MAP As per RRP
Compliance Status Reform Area/Objective Agenda
Time Frame
Responsible Authority
Monitoring Instrument
Expected Benefits/ Impacts
A. Policy Framework (i) Energy policy to
provide a broad framework for energy sector development
Finalize and submit to cabinet for approval of the revised energy policy.
2006
Energy and Mineral Resources Division (EMRD)
Energy policy statement
Promote energy sector development.
Partially complied with. Energy policy was last revised in 2004 and is not approved yet. But a Gas Development Fund Policy was approved in 2012, that has covered policy requirements for the gas sector.
(ii) Policy formulation capabilities
Finalize and submit the draft Gas Act for approval by parliament. Strengthen the policy formulation and monitoring capacity of the Planning Cell of EMRD.
2006
EMRD
Notification on Planning Cell
Better management of gas sector policy
Complied. Gas Act was approved on 19 July 2010.
Make the Hydrocarbon Unit (HCU) a permanent part of EMRD to provide technical advice.
2006
EMRD
Notification of new role of HCU
Streamlining technical capabilities of EMRD
Complied with. HCU became permanent as a technical arm of EMRD from 15 June 2008.
EMRD, with support of HCU and Bangladesh Oil, Gas, and Minerals Corporation (Petrobangla), to prepare long-term projections for gas production and 10-year rolling gas cost and blended prices.
2006–2007
EMRD/HCU/ Petrobangla
Gas supply projections
Balanced gas sector development
Complied with. government’s power system master plan-2010 contained road map and action plan for gas sector development. Gas pricing formula has been updated in 2017 considering LNG blending factors. A gas sector master plan is prepared by the World bank, which is under EMRD’s approval.
B. Regulatory Instruments (iii) Developing a
transparent regulatory
Appoint the remaining two members of the Energy Regulatory
2005
EMRD
Notification by EMRD
An environment conducive to private
BERC is fully functional since 2010 after appointing all 5
Appendix 11
47
As per RRP
Compliance Status Reform Area/Objective Agenda
Time Frame
Responsible Authority
Monitoring Instrument
Expected Benefits/ Impacts
framework
Commission (ERC) to make it fully operational.
investment and a competitive market
members
Under the provisions of the ERC Act, the government will transfer the responsibility for tariff setting and other regulatory functions to ERC.
2005
government/ ERC
Notification by EMRD
Complied with. BERC is responsible for tariff setting and other regulatory functions for gas, electricity and petroleum products. First gas tariff was fixed by BERC on 1 August 2009.
(iv) Ensuring efficient and economic use of natural gas in safe and sustainable manner
Gas Transmission Company Limited (GTCL) will submit its proposal to ERC. ERC holds first hearing.
2006 GTCL/ERC Approved tariff
Market-oriented energy pricing
Complied with. GTCL, once in a year, submits its tariff related proposal to BERC. BERC assesses the tariff proposal, arranges public hearing and finally set the tariff. First hearing was held on 20 August 2008.
(v) Access to gas infrastructure
Finalize and approve the Gas Act that would regulate transmission and distribution of natural gas, ensure private sector participation (PSP) including offloading shares.
2005- 2006
EMRD
Approved Gas Act
Effective natural gas resource management and promotion of competitiveness
Complied with. Gas Act was approved in 2010 to regulate transmission and distribution of natural gas.
EMRD to develop rules and regulations for PSP.
2005- 2006
EMRD Relevant Rules
Reduction of market dominance
Complied with. EMRD has adopted Gas Development Fund Policy in 2012 and Bangladesh petroleum act 2016 to encourage private sector participation in gas production including PSP, transmission and
48 A
ppendix 11
As per RRP
Compliance Status Reform Area/Objective Agenda
Time Frame
Responsible Authority
Monitoring Instrument
Expected Benefits/ Impacts
distribution specifically in development of CNG and LPG sector.
Identify facilities specifically for gas transmission and distribution that could be undertaken by PSP under different modalities.
2006- 2007
EMRD investment guidelines
Reduced dependence of gas sector organizations on government funds
Complied with. LPG sector is operated by the private sector. EMRD approved private sector projects for LNG sector. Reference: LNG FSRUs at Moheshkhali on BOOT arrangement.
Establish a framework for all gas companies concerning rights in relation to ownership of assets, access to transmission and distribution systems.
2005-2007
EMRD Institutional structure of gas companies
Foster development of gas companies
Accomplished. Under Petrobangla, there is 1 gas transmission company, 6 distribution companies, 2 production companies and one exploration company. All are fully autonomous.
Establish contracts that reflect the rights of gas sector companies in gas purchase, sale, and transmission.
2005 Petrobangla
Formal contracts
Competition and Efficiency enhancement
Accomplished. All 10 natural gas Companies are managing their own assets and liable for their own work.
Appendix 11
49
As per RRP
Compliance Status Reform Area/Objective Agenda
Time Frame
Responsible Authority
Monitoring Instrument
Expected Benefits/ Impacts
C. Sector Planning (vi) Ensuring no
constrained supply of natural gas
Implement public sector investment program based on financial and economic viability and social development impact
Ongoing basis
PB/ State Gas Companies (SGCs)
Investment proposals
Harmonization of gas sector development
Complied with. All public projects under EMRD has DPP approved by the planning commission. DPP includes technical, economic, social and environmental due diligence studies.
Continually update the master plan and disseminate investment options for private sector.
2005-2008
PB
Private sector investment proposals
Optimal development through private sector participation
Complied with. PSMP 2010 and PSMP 2016 was approved by the Ministry of Power, Energy and Mineral Resources. PSMP 2010 covered gas sector in detail. PSMP 2016 excluded gas sector, as a separate gas sector master plan has been prepared in 2018 and waiting for EMRD approval.
Obtain inputs from energy sector in a participatory manner.
2006- 2009
EMRD Energy policy
Broad support for sector development
D. Increased Access to Natural Gas (i) Natural gas
resources discovered and delivered
Develop strategy for exploration and utilization of undiscovered reserves
2005- 2006
PB/ Bangladesh Petroleum Exploration and Production Company Limited (BAPEX)
Exploration proposals
Maximum utilization of indigenous non- renewable resources
Complied with. BAPEX is mandated exploration company under Petrobangla. Through this project BAPEX gathered knowledge to do 3D seismic survey and functioning with high efficiency to carry out exploration activities.
(ii) Expanding natural gas access to more
Expand natural gas network to cover less
2006- 2010
Petrobangla/ GTCL
Network plans
Regional economic
Complied with. Natural gas network has
50 A
ppendix 11
As per RRP
Compliance Status Reform Area/Objective Agenda
Time Frame
Responsible Authority
Monitoring Instrument
Expected Benefits/ Impacts
urban and rural areas
developed region.
development
been expended to north, north-east and south-east part of the country covering the less developed region.
Develop a framework to expand the gas networks on an economically, financially, and socially acceptable manner.
2005- 2007
SGCs Network expansion plans
Extending the gas network in a market- friendly manner
Complied with. Gas transmission network is planned by GTCL and gas distribution is planned by 6 distribution Companies. EMRD monitors and approves the plans.
E. Corporate Governance (i) Flexibility and
commercial focus
Operate commercially and independently as per Companies’ Act.
2005- 2006
Petrobangla /SGCs
SGC board decisions
Enhanced management capabilities
Complied with. All 10 gas companies act as per company act.
Review the government’s dividend policy for gas sector companies.
2005
EMRD/ Ministry of Finance (MOF)
New dividend guidelines
Efficient and financially sound gas companies
Not complied with. Companies are financially not sound yet. Details are in appendix 15.
Empower gas sector entities to adequately undertake all operational and financial activities, including decision making for investment budgets.
2007- 2008
EMRD/ Petrobangla
Operational guidelines
Goal-oriented management
Complied with. Gas sector companies are empowered and works under company act.
Rationalize and limit participation of individuals in multiple boards to promote intercompany interactions in a commercial manner.
2005- 2006
Petrobangla
Board guidelines
Dynamic decision making in response to changing reforms in the market and the economy
In progress. Multiple appearances of individuals have been limited.
Establish board-level audit,
2006 SGCs Board guidelines
Sound financial Management
Complied with. Board is subjected to annual
Appendix 11
51
As per RRP
Compliance Status Reform Area/Objective Agenda
Time Frame
Responsible Authority
Monitoring Instrument
Expected Benefits/ Impacts
compensation, and investment committees.
audits.
The government should gradually move toward providing independence to gas sector companies in determining compensation structures.
2005
EMRD/MOF
Guidelines for benefits
Improved management
Complied with. Compensation structures are improved.
(ii) Improving commercial operation
Reduce accounts receivable from public and private consumers to no more than 3 months
2006- 2007
SCGs Financial statements
Improved performance and financial management
Ongoing with significant success. Penalty mechanism has been established for defaulters.
Establish cost centers for activities of BAPEX such as drilling, seismic surveys, gas development, and a promotion exploration.
2006 BAPEX Annual report
Improved operational efficiency
Complied with. BAPEX is operating under companies act to carry out the drilling, seismic survey and other exploration activities.
(iii) Reducing system loss
Develop and implement a comprehensive action plan to minimize system loss in distribution and transmission. Establish proper and transparent accounting for system losses.
2005-2007
Petrobangla /SGCs
System loss reduction plan
Enhanced revenue generation for additional investment and improved debt- service coverage
A gas system loss reduction plan is implemented over the years (Appendix 16). System loss has been significantly reduced (current system loss is less than 2%). Petrobangla and SGCs regularly report system loss data, which is publicly disclosed in Petrobangla website. Government took several projects to reduce system losses, including JICA financed prepaid meters.
52 A
ppendix 11
As per RRP
Compliance Status Reform Area/Objective Agenda
Time Frame
Responsible Authority
Monitoring Instrument
Expected Benefits/ Impacts
Gas distribution companies to establish and carry out systematic, routine inspection and testing, including methods designed to locate and stop gas thefts and tampering of meters and bypass.
2005- 2006
Petrobangla /SGCs
Monitoring reports
Improved management efficiency in monitoring distribution activities
Complied with. Stringent plan has been established and implemented to carryout systematic, routine inspection and testing, including methods designed to locate and stop gas thefts and tampering of meters and bypass.
F. Gas Sector Restructuring (i) Improving enterprise
performance
Capacity building of gas sector companies
Ongoing basis
Petrobangla /SGCs EMRD/ Petrobangla
Institutional Structure
Improved sector Efficiency
Ongoing.
(ii) Redefining the franchise areas of the Titas Gas and Transmission and Distribution Company Limited (TGTDCL) and Bakhrabad Gas Systems Limited (BGSL) for unbundling into three and two companies, respectively
Establish into three and two separate companies TGTDCL and BGSL, respectively, to decrease system losses and improve management efficiency
2006 TGTDCL BGSL
Restructured companies
Improved performance
Complied with. At present there are 6 distribution companies, as per the geographical location. System loss has been decreased significantly presented in DMF.
G. Private Sector participation (iii) Institutional reforms
and creating a competitive market
Petrobangla to perform as a single buyer to buy gas from each field monthly, blend prices, and sell gas to distribution companies.
2007- 2008
Petrobangla
Gas pricing
Transparency in gas costing, financial planning, and pricing policy formulation
Not complied with. Petrobangla’s role is supervisory in nature. Gas Transmission and production companies receive revenue from the six-gas distribution companies. Tariff is
Appendix 11
53
As per RRP
Compliance Status Reform Area/Objective Agenda
Time Frame
Responsible Authority
Monitoring Instrument
Expected Benefits/ Impacts
fixed by BERC, as mentioned undersection B of GSRR.
(iv) Promoting private sector involvement in gas sector development
Take steps to allow private financing and management of sections of the gas transmission network and competitive participation of the private sector in gas distribution.
2005- 2007
EMRD/ Petrobangla SGCs
Private sector financing of gas projects
Reduced dependence on government funds
Not complied with. Till date private sector are not participating in gas transmission and distribution. But private sector is very prominent in gas production and LPG distribution.
Develop and implement a time- bound action plan for off-loading shares of gas sector companies.
2005- 2007
Petrobangla/GTCL and other SGCs
Shareholding of SGCs
Diversification of ownership and management
Not done. Please refer to appendix 15 for SGC’s financial assessment as institutions
H. Pricing Reforms (i) Introducing flexible
and transparent pricing mechanism
Eliminate from gas prices non- economic factors such as levies for BAPEX.
2005- 2007
EMRD/ERC BAPEX
Pricing notifications
Exploration activities through revenue earnings
Complied with. Pricing policy has been updated by BERC. For encouraging exploration, the new pricing formula embedded levy for gas development fund in a systematic way.
Review the pricing framework to restructure to reflect volume of gas transported and distance of pipelines and return on investment for transmission and distribution.
2005- 2007
ERC Pricing notifications
Full pricing of gas to lead to more efficient use of gas
Complied with. Revised pricing formula accounted cost of imported LNG. New price has been activated for commercial and industrial sectors.
I. Further Policy Dialogue (i) Reforming the gas
sector through institutional and
Transfer the role of managing existing and future production sharing
2005- 2006
EMRD/ Petrobangla
Revised structure
Diversification of ownership and
Complied with. Petrobangla manages PSC.
54 A
ppendix 11
As per RRP
Compliance Status Reform Area/Objective Agenda
Time Frame
Responsible Authority
Monitoring Instrument
Expected Benefits/ Impacts
financial restructuring
contracts (PSCs) to an appropriate body.
management
Outline a time-bound plan for institutional restructuring of Petrobangla including reviewing the Petrobangla Act.
2005- 2006
EMRD/ Petrobangla
Restructured entities
Diversification of ownership and management
Not complied with.
Implement the institutional restructuring program for Petrobangla.
2007-2009
EMRD/ Petrobangla
Restructured entities
Diversification of ownership and management
Not complied with.
Appendix 12 55
ECONOMIC REEVALUATION A. General 1. For economic reevaluation, PCR structured the project into four components: (i) gas transmission system expansion and reinforcement comprising of 365 km of transmission lines and three gas compressor stations for a throughput of 400 MMCFD of gas; (ii) field appraisal by 3-D seismic survey of 5 gas fields covering an area of 1,250 square kilometers; (iii) Rajshahi gas distribution network comprising of 200 km of gas distribution pipelines; and (iv) institutional strengthening. At implementation, three gas compressors were dropped from the project, and later installed under other financing programs; hence, the economic reevaluation did not consider gas compressor component. In the institutional strengthening component, EVC meters, even when installed, are not being used for billing purposes. As a result, changes in system loss attributable to this component could not be isolated. Hence, economic analysis for the system loss sub-component has not been considered. B. Gas Transmission Pipelines 2. The Ashuganj-Jamuna bridge gas transmission pipeline (AJGTP) was laid in parallel with prevailing lines in order to increase total gas supply capacity of the system. The assumption was- in the absence of these new ADB-assisted pipelines, additional gas supply would not be possible for this section. The other gas transmission lines under the economic reevaluation are Hatikumrul-Bheramara gas transmission pipeline (HBGTP), Bonpara-Rajshahi gas transmission pipeline (BRGTP), and Bheramara-Khulna gas transmission pipeline (BKGTP), for which no pipelines prevailed. The new pipelines are expected to accelerate economic development of the southwest and northwest regions of the country. 3. It was assumed that the network did not have additional capacity beyond the demand levels of 2005. Increased gas sales will be possible after the installation of new gas transmission lines financed under the project. Therefore, the increase in gas supply volume is attributed to installation of these new transmission lines. C. Field appraisal by 3-D Seismic Survey 4. This component had been implemented by BGFCL and SGFL. Of the proposed 30 well drillings, 14 were proposed in the areas under BGFCL, and 16 in the SGFL. Altogether, 12 well drillings are completed. Until 2018, around 38 billion cubic feet of gas was produced from these wells and added to the national grid. 5. In economic analysis, the increase in proven and probable reserves (P2) compared to past estimates is considered as part of the benefits associated with 3-D surveying. In this case, drilling has already been undertaken after the 3-D survey in as many as 12 wells. BGFCL has drilled 7 wells and found gas in them. The newly drilled wells have already started gas production. The BGFCL yearly estimates of gas production and associated gas extraction costs for the next 20 years for the 3-D surveyed fields have been used in the cost-benefit analysis. 6. In contrast, the proposed wells drilled so far by SGFL either turned out to be dry or produced negligible gas. The wells have consequently been abandoned. In the analysis, the associated drilling costs of the drilled SGFL wells have nonetheless been considered as part of the total capital costs of developing the 3-D surveyed fields as a whole. Additionally, the benefit side of the analysis did not consider any output from the 3-D surveyed SGFL fields.
56 Appendix 12
7. The economic analysis of the 3-D Survey has been carried out on an incremental basis; i.e. only additional gas and condensates that have been produced and are projected to be produced as a result of new and projected well drillings are considered for the 3-D Survey part. D. Rajshahi Gas Distribution Network 8. The gas that has been (i) purchased and sold; and, (ii) is projected to be purchased and sold by the distribution company as a result of the project financing is considered in the analysis. The distribution company currently supplies the gas in Rajshahi with a total of 3.22MMCFD for all consumer types, including 9,155 domestic consumers. 9. New connections for gas supply to domestic users, however, have been stopped to date as per government decisions between 2010 to 2016. New industrial connections were also stopped for a short period of time, but this restriction has since been withdrawn. The restriction on domestic gas connections may be withdrawn in future with the increased imported LNG. E. Implementation Period by Component 10. Actual implementation periods of the components and sub-components of the project are shown in Table 12.1. Long implementation periods have an adverse effect on the estimated EIRRs.
Table 12.1: Implementation Periods of the Component Component/Sub-Component
Implementation Period
Year Gas Supply Commenced*
Start Date End Date AJGTP Jan 2006 Jun 2014 2014 HBGTP Jul 2006 Dec 2016 2017 BRGTP Jul 2006 Dec 2014 2012 BKGTP Jul 2007 Dec 2015 2020
(expected) Rajshahi gas distribution network
Jul 2006 Dec 2011 2012
3-D Survey Jan 2006 Jun 2016 NA *Calendar Year F. Assumptions for Estimating EIRRs 11. The EIRR computation followed the same methodology used during the appraisal. All prices and costs are expressed in 2017-18 terms. Costs and benefits are expressed in border prices. Import duties, taxes and interest during the construction period have been ignored. 12. The project analysis period is 20 years after the completion of the project. The years of operation were delayed as a result of the delay in the implementation of the project. A social discount rate of 12% and the prevailing exchange rate of Tk82.1 in 2017-18 are assumed. 13. In order to express domestic prices of non-tradable items in terms of border prices, a standard conversion factor (SCF) of 0.90 has been used.1 Operation and maintenance (O&M) costs are also multiplied by the SCF of 0.90 to translate domestic prices into border prices. 14. It has been assumed that unskilled laborers are not always employed. In order to calculate the opportunity cost of unskilled labor, a shadow wage rate factor (SWRF) of 0.8 has been used.2
However, in the case of skilled labor, it is assumed that their shadow wage rate doesn’t differ from their market wage rate, so no adjustment is necessary. Both wages are multiplied by the SCF to arrive at their border prices. 15. Expected life of the assets are assumed as 40 years and residual values assumed as 30% of the original values at the end of 20-year starting from the completion of subprojects.3 16. The benefit of gas supply is mostly measured as the benefit gained from natural gas substituting a variety of alternative fuels which would be used in the absence of gas supply. Use of alternative fuels by customer category is given below.
Table 12.2: Use of Alternative Fuels by Customer Category Customer Category Alternative Fuel Power HSD, Fuel Oil Industrial HSD Commercial Fuel-wood Residential Fuel-wood
17. Since gas will be used as a substitute for other fuels which are currently being used or will be used in the future, calorific value of a unit of each type of fuel is taken into account in order to calculate the replacement value of alternative fuels using gas (Table 12.3). As prices and units of measurement differ across fuels, the estimation has calculated the cost of one MMBTU of each fuel type for the purpose of computing gas usage benefits in monetary terms. 18. In order to determine the economic value of supplied gas, the demand for gas needs to be classified as incremental and non-incremental demand. The gas demand in AJGTP region is assumed to be non-incremental as the increased supply is supposed to meet existing deficit in supply. However, the demand from upcoming power plants in Sirajganj has been considered as incremental. In the case of BKGTP, future demand of existing Khulna 225 MW has been considered as non-incremental. The plant is expected to complete the required gas supply infrastructure within 2020. The gas demand from other power plants scheduled to come up later, however, has been considered as incremental. 19. The gas demand in HBGTP area has been treated as incremental demand only as the power plants which are operating there and will be operating in the future came/will come into operation after the project completion. The gas demand in BRGTP region has been considered non-incremental as a whole. There used to be no gas supply in the area before the project. The demand is quite small compared to other components of the project. However, due to shortage of gas supply, even small non-incremental demand is not being met or will be met in the foreseeable future. Hence, the demand in this component has been treated as non-incremental. 20. The price of crude petroleum plays a crucial role in determining the prices of the majority of fuels. Gasoline and diesel prices, being dependent on the international price of crude oil, vary with it. The prices of these petroleum products are assumed to be in a certain ratio relative to the crude oil price. The conversion factors for diesel and gasoline are based on the relations between their past CIF prices and the corresponding CIF price of crude oil in 2017-18. Based on past import price figures of BAPEX, 120% of crude price has been assumed as the CIF prices for both diesel and gasoline. The World Bank’s forecasts for crude petroleum prices show little variation from the price which prevailed in 2018. Hence, the prices of 2018 are assumed to hold constant in real terms throughout the analysis period. Distribution costs of imported fuels are then added
3 Using straight line depreciation method, the residual values at the end of 20 years is 50% of the original values of the assets.
58 Appendix 12
to their respective CIF fuel prices. Fuel-wood prices (retail) are based on a survey conducted in 2018.
Table 12.3: Calorific Values of Different Fuels Fuel type Calorific Value (BTU) Unit MCF Required to Replace One Unit Gas 1.037 million mcf 1.00 HSD 5.77 million Barrel 5.56 Gasoline 5.06 million Barrel 4.89 Fuel-wood 43.20 million ton 13.69 MCF = million cubic feet HSD = high speed diesel
G. Estimation of Economic Benefits 21. The economic benefits for GTCL and PGCL have been estimated based on the value of alternative fuels in the absence of project pipelines. An overwhelming proportion of estimated benefits by replacing other fuels is originated from HSD-using sectors, such as power generation. 22. The total benefit depends on the future demand and supply of the gas. The projected demand in the cases of the AJGTP and BRGTP lines are based on projections made by Titas and other government agencies. In the cases of the HBGTP and BKGTP, demand projections are solely based on demand from recently completed power plants in the respective regions and the expected completion of power plants in the future. Increase in gas demand from new and existing domestic, commercial and industrial customers have been ignored, considering the nationwide supply constraint and Petrobangla’s embargo on some new connections. If those incremental demands were considered, the relevant EIRRs might have been higher. 23. The benefits of 3-D survey are valued at the well-head value of gas, which includes purchase price from IOCs and depletion premium. From 2030 onwards, gas is valued at the border price of gas plus re-gasification costs. H. Cost Estimates 24. Capital costs involve all infrastructure development costs from all three segments of the project under consideration. As downstream transmission lines and the Rajshahi area distribution network are beneficiaries of the upstream transmission lines, half of the capital costs of the upstream section is apportioned to the downstream transmission lines. Consequently, only 50% of the original capital costs have been considered for calculations involving the upstream lines. 25. The reapportioned capital costs have been distributed among the beneficiary sub-projects according to their relative share of consumption of gas received from upstream transmission lines. However, as BRGTP and Rajshahi gas distribution network consume a small proportion of total gas-flow through AJGTP and HBGTP, no additional capital costs from upstream transmission lines have been accounted for in the calculations involving these sub-components. The O&M expenses, including capital costs of transmission lines are estimated on the basis of the past financial performances of the respective executing agencies. 26. The economic cost of gas is valued following ADB guidelinesm while non-incremental gas is valued as the sum of the purchase price from IOCs, transmission costs, and the estimated depletion premium. It is assumed that the country will, more or less, run out of gas after 2030. The depletion premium is estimated for each year of operation. After 2030, the gas is valued as the sum of the border price (CIF), re-gasification cost, and transmission cost. The border price of gas is based on IBRD’s commodity price projection reports.
Appendix 12 59
27. The cost of gas for Pashchimanchal Gas Company Limited (PGCL), the distribution company, consists of economic value of gas plus the transmission and distribution cost of gas supply. The same method has been applied in the case of AJGTP area. 28. Regarding 3-D seismic survey, the cost of well development, development of surface and sub-surface infrastructure for gas extraction, extraction costs, and O&M costs have been provided by BGFCL and SGFL and used for the EIRR estimation purposes. I. EIRR Estimates 29. The economic performances of the project have been assessed by estimating the project’s EIRR. Table 12.4 shows EIRR at appraisal and at completion.
Table 12.4: Comparison of EIRR at Appraisal and at Completion
Components EIRR (%)
At Appraisal At Completion A1. AJGTP + A5. NSSE 57.30 84.00 A2. HBGTP 33.50 26.80 A3: BRGTP 25 9.90 A4: BKGTP 28 21.30 Overall Part A: Gas Transmission 57.104 37.90 Part B: Field Appraisal (BGFCL & SGFL) 42.60 48.90 Part C: Rajshahi Gas Distribution Network NA 13.10 Overall 56.60 39.80
30. The estimated EIRR of the BRGTP component is considerably lower compared to what had been estimated at appraisal. This was due to poor demand for gas in the Rajshahi gas distribution area. Overestimation of demand for gas from the industrial sector and the government’s suspension on new domestic and industrial connections resulted the undesired performance. Regarding the BRGTP component, the benefit that could be attributed to this segment could only come from Rajshahi Area Distribution Network, as the decision is yet to be made as to the commencement of gas supply to the Natore and Puthia regions. Similarly, in the case of the BKGTP sub-project, the gas supply is yet to commence. 31. The EIRR of the AJGTP sub-project (84%) is much higher compared to the original estimate. This is because of the large volume of gas flow from the beginning (first year) after its commissioning. In addition, the cost of installing compressors has not been considered as they were dropped from this sub-project. 32. The estimated EIRR for the overall project including Rajshahi Area Distribution Network and 3-D survey is 39.8% (Table 12.5). Based on the overall estimated EIRRs, the project is considered as efficient.
4
For comparison, PCR considered estimated EIRR figure 57.1% at appraisal, as reported in the Supplementary Appendix of the RRP. EIRR figure (28.1%) reported in Appendix 12 of the RRP was noted to be erroneous, as RRP Table A12.1 has gross over estimation of O&M costs, resulting in the discrepancies.
EIRR 39.80% 33. The results from sensitivity analysis for the overall project show that EIRR would remain unchanged if O&M costs increased by 10% (Table 12.6). EIRR would drop to 38.0% if benefits decrease by 10%; while if gas costs rise by 10%, the EIRR would drop to 38.9%. If all three events mentioned above take place simultaneously, the EIRR would drop to 35.1%.
Table 12.6: Sensitivity Analysis of Economic Internal Rate of Return Sensitivity Parameter % Change EIRR (%)
(i) Base Case - 39.80 (ii) Benefit Reduction - 10 38.00 (iii) Gas Cost Increase +10 38.90 (iv) All three combined (ii, iii, iv) - 35.10
J. Conclusion 34. When gas supply commences to the Kushtia, Jhenaidah, and Jashore regions, the benefit from the BKGTP pipeline is expected to be higher. As the proportion of capital cost for BKGTP pipeline is high, the overall rate of return will be higher. Similarly, if the gas supply to Natore and Puthia regions is permitted, the EIRR of the BRGTP sub-project is expected to improve. The actual EIRR would be higher, had the environmental benefits been accounted for in the EIRR estimations. The health benefits of using gas for domestic purposes are substantial. The principal victims of indoor air pollution (IAP) caused by firewood usage for cooking, the women and small children, who tend to be with their mothers most of the time, will benefit. Adoption of gas for
Appendix 12 61
cooking purposes is a great boon for the health of women and children in the project areas. The other important environmental benefit will be a reduction in greenhouse gas emissions as a result of substituting the more polluting fuels such as HSD. The replacement of alternative fuels with natural gas will lead to reduction of carbon dioxide (CO2) emissions by a total of more than 61,351,249 tons over the period up to 2037. Using the EU recommended value of one ton of averted CO2 emissions of 33 Euros, the total gain is estimated at more than $2.29 billion. The reduction in carbon emissions is a global public good whose benefits is not captured exclusively in the project. Overall, the project is efficient.
62 Appendix 13
FINANCIAL REEVALUATION
A. Background 1. The financial reevaluation of the project has been carried out in accordance with the guidelines for the financial governance and management of investment projects financed by the Asian Development Bank (ADB).1 Financial analysis (FA) is conducted for the gas transmission and distribution components of the Project, that generate revenue. The evaluation and computation of the financial internal rate of return (FIRR), including sensitivity evaluation, is carried out for the (i) pipeline extension, (ii) existing system reinforcement, and (iii) overall system including expansions and extensions. FA for each subproject compared FIRR with weighted average cost of capital (WACC). Consolidated level FIRR and WACC (combining subprojects presented in Table 13.1) were compared with consolidated FIRR and WACC at appraisal. Sensitivity tests were undertaken to assess the impact of project risks (as reflected in cost increase and revenue decrease) on the FIRR.
Table 13.1: Sub Project Costs at Actual ($'000)
Sub Project Component Total Cost (%) A1. AJGTP 33,360.95 12.72% A2. HBGTP 86,568.87 33.00% A3: BRGTP 20,021.40 7.63% A4: BKGTP 109,248.67 41.65% C. Rajshahi Gas Distribution Network 13,061.89 4.98% Total 262,261.87 100.00%
B. Assumptions 2. Basic Assumptions. Financial analysis of the five subprojects are based on several revenue and cost assumptions. The capital cost is based on the actual expenditures incurred for the project. For the purpose of the financial analysis, 2018 constant price has been assumed for all subprojects. Cost streams reflect the costs incurred in delivering the estimated benefits. Financial benefits are derived from incremental revenue generated by increased capacity. The financial analysis considers a 30-year operation period with residual value.2 FIRR is compared with the WACC to ascertain financial viability. Cost streams used to determine the FIRR include capital costs, taxes, duties and O&M costs. Gas purchase is included in Rajshahi gas distribution network. Financial and operational information are obtained from the respective project companies. 3. Demand Forecast. Synchronized with economic reevaluation (appendix 12), gas demand for the respective subprojects is assumed for 30 years of operation, including project implementation period (Table 13.2).
1 ADB. 2005. Financial Management and Analysis of Projects. Manila 2 Salvage value has been assumed considering 40 years of economic life and adjusted with 50% of the remaining value of the assets.
Average Demand Per Day 461.90 * 70% time is considered peak hour with 15 days/annum downtime.
** Demand for Rajshahi gas distribution network is not included in total demand calculation since it has been included in upstream BRGTP transmission line.
4. Transmission charges/Gas sales price.3 Wheeling for subproject AJGTP, BRGTP, HBGTP and BKGTP are based on average transmission charges for the period of FY2013-14 to FY2017-18. Increased charge of Tk0.42/CM on September 2018 and annual increased rate of 4.78% from FY2019-20 onwards is based on 7-Year CAGR of transmission charges (2014-2020). Weighted average gas price is calculated based on weight of category of customers (power, captive power, industrial, commercial, domestic and CNG) and respective gas sales price for each customer segments. In FY2017-18, the weighted average gas sales price was Tk9.51/CM. Annual rate increase of 20.20% from FY2018-19 to FY2023-24 is based on 5-Year CAGR of gas price (2014-2018). Wheeling charge and price assumptions are summarized in Table 13.3. 5. O&M Cost. O&M cost is estimated according to the length of transmission/distribution line in each subproject and considered constant for the entire forecast period. Calculated O&M cost for GTCL (AJGTP, BRGTP, HBGTP and BKGTP) is Tk1.13 million per kilometer in FY2016-17, and Tk1.61 million per kilometer for Rajshahi gas distribution network in FY2017-18.
3 Gas sales price is applicable only for Rajshahi distribution network project.
64 Appendix 13
Table 13.3: Transmission charge & weighted average gas price
C. WACC 6. WACC after tax is calculated in real terms using the actual capital and cost mix of various financing sources as of respective closing dates of each subproject4 (Table 13.4), including (i) the 10-year average 3-month London interbank offered rate (LIBOR) of 0.90% plus a spread of 1.35% for the ADB loan; (ii) interest rate of 5% for GOB Loan; and (iii) 19.44% opportunity cost of capital for the equity (for both GOB and GTCL). The cost of equity has been calculated using capital asset pricing model based on the following assumption–Estimated Equity Cost = Risk Free Rate + Equity Risk Premium x Beta; where the risk-free rate is taken as proxy for 10-year government bond rate (7.53%),5 equity risk premium taken as 9.23%,6 and power sector Beta taken as 1.29.7
The consolidated WACC is recalculated at 1.46%, which was lower than 3.79% calculated at appraisal. The difference is due to (i) changes in capital structure on the back of changes in project cost and repayment of loans at value date, and (ii) different cost mix of various components.
4 Source: Final Audit Report of each sub project 5 Bangladesh Bank website https://www.bb.org.bd/pub/quaterly/bbquarterly/oct-dec2017/tables.pdf 6 A. Damodaran.2018. http://pages.stern.nyu.edu/~adamodar/New_Home_Page/datafile/ctryprem.html 7 Apex Capital Market Research. http://www.ail-bd.com/ECensus/UIPages/Admin/Beta.aspx
Appendix 13 65
Table 13.4: Consolidated WACC ($’000)
D. FIRR 7. The reevaluated consolidated FIRR has been calculated at 3.20% (Table 13.5 &13.6) against the FIRR calculated at appraisal at 12.0%. The difference is mainly due to significant cost and time over-run of multiple subprojects (Appendix 14) and lower than expected utilization of the pipelines. However, the reevaluated consolidated FIRR of 3.20% is higher than WACC of 1.46% which indicates sustainability of the project at consolidated level. The project’s reevaluated 3.20% FIRR is however significantly lower compared to 12.0% at appraisal, due to around 5.90 years of implementation delay, lower than expected utilization due to supply shortage of gas, higher O&M cost and lower than expected revenue from wheeling charges during FY2014-2018.
Table 13.5: FIRR & WACC
Sub Project Component Total Cost % of Total 5 Sub
Project Sub Project
WACC A1. AJGTP 33,360.95 12.72% 1.18% A2. HBGTP 86,568.87 33.00% 1.29% A3: BRGTP 20,021.40 7.63% 1.62% A4: BKGTP 109,248.67 41.65% 1.33% C. Rajshahi gas distribution network 13,061.89 4.98% 4.65% Total 262,261.87 100.00% 1.46%
FIRR 3.20% * Gas cost applicable only for Rajshahi gas distribution network; O&M Cost for Rajshahi gas distribution network
includes contribution to BAPEX Margin, deficit fund for BAPEX wellhead margin, transmission charge, price deficit fund margin, gas development fund, asset value of gas, support for shortfall, distribution cost excluding depreciation and Petrobangla actual cost recovery.
E. Sensitivity Analysis 8. The sensitivity of estimated FIRRs of transmission/distribution subprojects and the overall project to adverse changes in key variables is tested (Table 13.7). The variables are (i) decrease in transmission/distribution volume (-10%), (ii) decrease in wheeling charge/gas sales price (-10%), (iii) increase in operating and maintenance costs (+10%), and (iv) increase in gas purchase price (+10%) for Rajshahi gas distribution network. A combination of the above is also tested. Project delays accompanied by increases in project costs as calculated at appraisal is not tested as the project is already completed. The sensitivity indicator and switching value are calculated as well. 9. Since the FIRR in the base case is marginally higher than the WACC, the adverse changes tested on wheeling charge/gas price yielded a FIRR lower than WACC. Returns are more sensitive to a decrease in wheeling charge/gas price followed by transmission/distribution volume and O&M costs. However, there is room for increase in transmission and distribution volume, as well as wheeling charges/gas price that will make the project more robust.
Appendix 13 67
Table 13.7: Sensitivity Analysis of the Financial Internal Rate of Return (%)
Parameters BKGTP HBGTP BRGTP AJGTP Rajshahi
Distribution Network
Consolidated Remarks
Base Case FIRR 2.63 1.42 -12.3 9.59 -0.38 3.20
WACC 1.33 1.29 1.62 1.178 4.65 1.46
Sensitivity Transmission/ Distribution Volume (-10%)
10. Financial Analysis of each subprojects is presented in Appendix 14. F. Conclusion 11. The financial analysis indicates, except BRGTP and Rajshahi gas distribution network (component C), the FIRR of all subprojects are higher than their respective WACCs. The FIRR of BRGTP and Rajshahi gas distribution network are recalculated to be negative and lower than the WACC due to significant implementation delay, lower than expected utilization (resulting from gas supply shortage), and high O&M costs. The consolidated reevaluated FIRR of the project is 3.20%, which is higher than 1.46%, the aggregate WACC. From financial standpoint, the project is financially feasible.
68 Appendix 14
SUB-PROJECT FINANCIAL ANALYSIS
A. Ashuganj-Jamuna Bridge Gas Transmission Pipeline (AJGTP) 1. The main objective of the project was to cater the demand1 of gas based power plants and fertilizer factories of the Brahmaputra Basin (B-B region) under Titas gas franchise area, and the proposed 450 MW power plant at Sirajganj, 450 MW power plant at Bogura, as well as existing and ongoing power plants and fertilizer factories in PGCL franchise area. Another objective of the project was to extend/create gas infrastructure in the under-developed north-west and south-west region of the country for regional balance. The pipeline would carry 300-750 MMCFD gas from Monohordi to east bank of Jamuna Bangabandhu bridge in assistance of compressors at Ashuganj west and Elenga. 2. The construction of pipeline was completed on 30 June 2014,2 5-years after the target date,3 caused 50.51% above the original estimate and 8.40% lower than the revised project cost (actual cost was Tk4.12 billion) as per EA’s project completion report dated 4 November 2015. The delays and cost overrun were due to–(i) delay in land acquisition, (ii) 6 month delay in ADB loan effectiveness, (iii) Global material price rise, and (iv) delays in procurement process (Appendix 7). The Debt-Equity ratio at completion as of 30 June 2014 stood at 83:17.4 3. Appendix 13, para B.2, B.3, B.4 and B.5 present the assumptions at reevaluation. Weighted average cost of capital (WACC) after tax in real terms is calculated using the actual capital cost mix of various financing sources as of June 2014 (Table 14.1). The WACC is recalculated to be 1.18%.
Table 14.1: Reevaluated Weighted Average Cost of Capital (WACC) (Tk million)
Item ADB Loan GOB Loan GOB Equity GTCL Equity
Total
As of 30 June 2014 2,397.00 1,019.00 679.00 36.00 4,132.00 Weight 58.0% 24.70% 16.40% 0.90% 100.00% Nominal Cost 2.3% 5.00% 19.40% 19.40% - Tax Rate 37.50% 37.50% - - - Tax Adjusted Nominal Cost 1.40% 3.10% 19.40% 19.40% 0.00% Inflation Rate 2.20% 5.80% 5.80% 5.80% - Real Cost -0.70% -2.50% 12.90% 12.90% - Weighted Component -0.42% -0.63% 2.12% 0.11% - WACC 1.18% Assumptions: Appendix-13, Section-B 4. The FIRR is recalculated at 9.59% (Table 14.2), higher than the WACC of 1.18%.
1 BRGTP was built in parallel to 20-inch Ashuganj-Elenga line in B-B region, which was operating in saturated condition, in face of rapidly growing demand in Narshingdi and Gazipur area.
2 EA’s Original Development Project Proforma (DPP) includes 103 km pipeline and two compressor stations, one at Ashuganj and another at Elenga with a total cost of Tk8.3 billion. The total revised DPP cost was Tk4.5 billion, as compressor stations were dropped from the project. The compressor stations were later implemented under another ADB funded project–the Natural Gas Access Improvement Project, Loan 2622-BAN.
3 Original implementation period was January 2006 to June 2009. Actual implementation period was January 2006 to June 2014 resulted in 242.86% time overrun.
4 Debt outstanding includes ADB Loan & GOB Loan; Equity includes GOB and GTCL contribution.
Appendix 14 69
Table 14.2: Reevaluated Financial Internal Rate of Return (Tk million)
( ) = negative 5. The sensitivity of the estimated FIRR of AJGTP to adverse changes in key variables is tested (Table 14.3). The variables are (i) decrease in transmission volume (-10%), (ii) decrease in wheeling charge (-10%), (iii) increase in O&M costs (+10%) and (iv) a combination of the above. Project delays accompanied by increases in project costs was not tested as the project has been already completed at the time of the reevaluation. The sensitivity indicator and switching value are calculated as well. Project remains strongly viable in all adverse scenarios (FIRR > WACC) due to strong demand and adequate supply of gas in the area.
Table 14.3: Sensitivity Analysis of the Financial Internal Rate of Return (%)
Parameters AJGTP Remarks Base Case FIRR 9.59 WACC 1.18 Sensitivity Transmission/ Distribution Volume (-10%) 8.87 Moderately Sensitive Wheeling Charge/Gas Sales Price (-10%) 4.97 Highly Sensitive O&M Cost (+10%) 9.59 Least Sensitive Transmission Volume & Charges (-5%) 6.88 Highly Sensitive
70 Appendix 14
B. Hatikumrul-Bheramara Gas Transmission Pipeline (HBGTP) 6. The main objective of the project is to supply gas to existing 60MW power plant and proposed 414 MW power plant at Bheramara (commercial operation started in 2017). The capacity of the pipeline is 400 MMCFD for catering gas demand from Hatikumrul, Sirajganj to Bheramara, Kushtia. 5 7. Construction of pipeline was completed on 31 December 2016,6 7.5-years after the target date at 13.46% below the original estimate and 3.49% lower from revised cost estimate (actual cost was Tk7.13 billion) as per GTCL’s project completion report dated 31 January 2018.7 The original DPP of the project was prepared in 2005 considering the approved material specification, market price of materials, labor cost of that time and the price rates of some previously completed projects of the company. At implementation, based on updated demand-supply analysis, a higher diameter pipeline was considered due to the demand from the future power plants in the western region. The size change increased the project cost. Implementation delay has increased the cost of labor and fuel, exchange rate of currencies, prices of some materials (civil construction and steel materials) in the local and international markets. The project couldn’t be completed as per the original implementation schedule due to–(a) delay in procurement processes that required rebidding for some important packages, such as line pipes and miscellaneous fittings; (b) delay in issuance of notification of award (NoA) and contract signing of office building, residential building and other building structures packages due to shortage of fund in original DPP;8 (c) delay in installation of city gate station and SCADA system; and (d) delay in completion of Padma River horizontal directional drilling (HDD) crossing work. The debt equity ratio as of 31 December 2016 stood at 82:18.9 8. Appendix 13, para B.2, B.3, B.4 and B.5 present the assumptions at reevaluation. Weighted average cost of capital (WACC) after tax is calculated in real terms using actual capital cost mix of various financing sources as of 31 December 2016 (Table 14.4). The WACC is recalculated at 1.29%.
Table 14.4: Reevaluated Weighted Average Cost of Capital (Tk million)
9. The FIRR is recalculated at 1.42% (Table 14.5), higher than WACC of 1.29% (Table 14.4).
5 HBGTP capacity was appraised as 235 MMCFD in RRP, considering 24-inch-diameter pipeline. At completion, a 30
inch-diameter pipeline is installed, whose capacity is 400 MMCFD. 6 The Original DPP includes 82 km pipeline with a total cost of Tk6286.99 million. The total revised DPP cost was Tk7391.37 million. The difference is due to change in pipe size from 24’’ diameter to 30’’ diameter. 7 Original implementation period was July 2006 to June 2009. Actual Implementation Period was July 2006 to 31
December 2016 resulted in 250% time overrun. 8 Contracts were signed after revision of the DPP. 9 Debt outstanding includes ADB and GOB Loans; Equity includes GOB and GTCL contributions.
Appendix 14 71
Table 14.5: Reevaluated Financial Internal Rate of Return (Tk million)
( ) = negative 10. The sensitivity of the estimated FIRR of the subproject to adverse changes in key variables is tested (Table 14.6). The variables are (i) decrease in transmission volume (-10%), (ii) decrease in wheeling charge (-10%), and (iii) increase in O&M costs (+10%). A combination of the above is also tested. Project delays accompanied by increases in project costs is not tested. The sensitivity indicator and switching value are calculated. The analysis confirms, the project would not be viable in any adverse scenarios (FIRR < WACC), except the increase in O&M costs.10
Table 14.6: Sensitivity Analysis of the Financial Internal Rate of Return (%)
10 Except 10% increase in O&M cost; however, it was also in borderline.
72 Appendix 14
C. Bonpara-Rajshahi Gas transmission pipeline (BRGTP) 11. The main objective of the project was to ensure gas supply to the divisional city of Rajshahi and its adjacent area, which is situated in the north-west region of Bangladesh. The project targeted constructing 12-inch-diameter 53.00 km gas transmission pipeline. The project aimed to provide natural gas to domestic, industrial and proposed power plants replacing the imported fossil fuel. RRP stipulated 30 MMCFD gas supply through the pipelines. At competition, 45 MMCFD was the pipeline capacity. 12. The construction of pipeline completed on December 2014,11 5.5 years after the target date,12 with 6.03% cost above the original estimate, and 17.31% lower from the revised estimated cost (actual cost was Tk1.51 billion) as per EA’s project completion report dated June 2015. The project could not be completed as per the original implementation schedule due to the delays in land acquisition & requisition and delay in procurement of line pipe and other materials. The Debt Equity ratio as of 31 December 2014 stood at 79:22.13 13. Appendix 13, para B.2, B.3, B.4 and B.5 present the assumptions at reevaluation. Weighted average cost of capital (WACC) after tax is calculated in real terms using actual capital cost mix of various financing sources as of 31 December 2014 (Table 14.7). The WACC was recalculated to be 1.62%.
Table 14.7: Reevaluated Weighted Average Cost of Capital (Tk million)
14. The FIRR was recalculated at negative 12.30% (Table 14.8), significantly lower and negative than the WACC of 1.62% (Table 14.7) due to the implementation delay, lower than expected utilization of gas and proportionate high O&M Cost.
11 The Original DPP includes 53 km pipeline with a total cost of Tk1.6 billion. The total revised DPP cost was Tk1.8
billion. 12 Original implementation period was July 2006 to June 2009. Actual Implementation Period was July 2006 to 31
December 2014 resulted in 183.33% time overrun. 13 Debt outstanding includes ADB Loan & GOB Loan; Equity includes GOB and GTCL contribution.
Appendix 14 73
Table 14.8: Financial Internal Rate of Return at Reevaluated (Tk million)
( ) = negative 15. Since the FIRR in the base case is significantly lower than the WACC, any further adverse changes were not tested. However, a sensitivity analysis was conducted to test the impact of improvements in transmission volumes (Table 14.9). A 750% improvement in transmission volume from current level yielded an FIRR higher than the WACC. Considering the current economic activities in that region, it unlikely to achieve that demand within next 3 to 5 years. Though this subproject was financially unprofitable, it is economically viable and it has a strategic importance to support government’s equitable development with regional balance.
Table 14.9: Sensitivity Analysis of the Financial Internal Rate of Return
(%) Parameters BRGTP Remarks Base Case FIRR (12.30) WACC 1.62 Sensitivity Transmission Volume 1.99 750% increase
74 Appendix 14
D. Bheramara-Khulna Gas Transmission Pipeline (BKGTP) 16. The main objective of the project is to meet gas demand of the proposed 210 MW and 100 MW, and existing 378 MW power plants in Khulna, as well adequate gas supply to industrial, commercial and other customers of Kushtia, Jhenaidah, Jessore and Khulna city and nearby area. The project constructed 20” diameter 165 km pipeline along with ancillary facilities; about 160 MMCFD gas can flow from Bheramara to Khulna. 17. Construction of pipeline completed in December 2015,14 5.5 years after the target date at 21.43% below the original estimate, and 7.92% lower from the revised estimated cost (actual cost was Tk8.32 billion) as per EA’s project completion report.15 The project could not be completed as per the original implementation period due to- (a) re- routing of the right of way (ROW); (b) delay in acquisition of land; (c) re-tendering in some packages such as line pipe, induction bends, coating materials, CP materials and HDD river-crossing works, (d) delay in DPP revision, and (e) countrywide long-term hartal and blockade on many occasions during project implementation. The original DPP of the project was prepared in 2005 considering the market price of materials, labor cost of that time and the price rates of some previously completed projects of the company. The actual project cost increased due to 5.5 years implementation delay, therefore costs of labor & fuel, exchange rate of currencies, prices of some materials (civil construction and steel materials) have increased significantly in the local and international markets. The Debt-Equity ratio as of 31 December 2014 stood at 79:22.16 18. Appendix 13, para B.2, B.3, B.4 and B.5 present the assumptions at reevaluation. Weighted average cost of capital (WACC) after tax is calculated in real terms using actual capital cost mix of various financing sources as of 31 December 2015 (Table 14.10). The WACC was recalculated to be 1.33%.
Table 14.10: Reevaluated Weighted Average Cost of Capital (Tk million)
( ) = negative 20. The sensitivity of the estimated FIRR of the subproject to adverse changes in key variables was tested (Table 14.12). The variables are (i) decrease in transmission volume (-10%), (ii) decrease in wheeling charge (-10%), (iii) increase in O&M costs (+10%), and (iv) a combination of the above. Project delays accompanied by increase in project costs was not tested due to completion of the subproject. The sensitivity indicator and switching value were calculated. The project remains viable to 10% decreases in transmission volume, and 10% increase in O&M cost. However, 10% decrease in wheeling charges resulted negative FIRR.
Table 14.12: Sensitivity Analysis of the Financial Internal Rate of Return (%)
E. Rajshahi Gas Distribution Network 21. The main objective of the subproject is to provide piped natural gas to Rajshahi city and its adjoining area for residential, commercial, industrial, and power plants through construction of 280 km distribution pipeline network.17 22. The construction of pipeline was completed in December 2011,18 2.5 years after the target date at 6.76% above the original estimate and 7.21% lower than the revised estimated cost (actual cost was Tk974.20 million) as per PGCL’s project completion report dated 10 March 2013.19 The project could not be completed as per the original implementation period due to–(a) delay in land acquisition, and (b) delay in procurement that required extension of bidding periods for not receiving enough bids. The Debt-Equity ratio as of 30 June 2011 stood at 59:41.20 23. Appendix 13, para B.2, B.3, B.4 and B.5 present the assumptions at reevaluation. Weighted average cost of capital (WACC) after tax is calculated in real terms using actual capital cost mix of various financing sources as of 30 June 2011 (Table 14.13). The WACC was recalculated to be 4.65%.
Table 14.13: Reevaluated Weighted Average Cost of Capital21
(Tk million)
24. The FIRR is recalculated at negative 0.38% (Table 14.14), significantly lower than the WACC of 4.65% (Table 14.13). 2.5 years delay in implementation, low capacity utilization, low gas supply, high O&M costs, and slow industrialization–all have adversely affected the project’s financial viability.
17 Actual construction was 270 km distribution pipeline. 18 The Original DPP includes 280 km pipeline with a total cost of Tk1,126.23 million. The total revised DPP cost was Tk1,050.0 million. 19 Original implementation period was July 2006 to June 2009. Actual Implementation Period was July 2006 to 31 December 2011 resulted in 83.33% time overrun. 20 Debt outstanding includes ADB Loan & GOB Loan; Equity includes GOB and GTCL contribution. 21 For assumptions please refer to Appendix 13. Para C (6).
( ) = negative 25. Since the FIRR in the base case is significantly lower than the WACC, any further adverse changes were not tested. However, a sensitivity analysis is conducted to test the impact of improvements in transmission volumes (Table 14.15). A 30% improvement in distribution volume from current level yielded an FIRR higher than the WACC. Considering the current economic activities in that region, project infrastructure is likely to reach the required utilization within next 3 to 5 years.
Table 14.15: Sensitivity Analysis of the Financial Internal Rate of Return (%)
Parameters Rajshahi Distribution
Network Remarks
Base Case
FIRR (0.38) WACC 4.65 Sensitivity
Transmission/ Distribution Volume 4.74 30% increase
78 Appendix 15
EXECUTING AGENCY FINANCIAL PERFORMANCE ANALYSIS 1. The PCR carried out a performance analysis of the four executing agencies. They are Gas Transmission Company Limited (GTCL), Bangladesh Gas Field Company Limited (BGFCL), Sylhet Gas Fields Limited (SGFL) and Pashchimanchal Gas Company Limited (PGCL). The analysis used the following three major criteria–(i) business risk,1 (ii) financial risk,2 and (iii) financial flexibility & liquidity. Business risk for each project company is assessed as low (1), fair (2), moderate (3), high (4), and very high or vulnerable (5). Financial risk is assessed independently as very low risk (1), low risk (2), moderate risk (3), high risk (4), and very high risk (5). The assessment of financial flexibility and liquidity required a comparison of the financial flexibility to raise additional capital or funding on a scale of extremely low (1), low (2), average (3), high (4), and very high (5) relative to the company’s potential needs for additional capital or funding on a scale of excellent (1), good (2), average (3), poor (4) and very poor (5). Financial flexibility is assessed as high/very good (1), moderate/good (2), adequate (3), less than adequate (4), and poor (5). Highlights of the ratings are presented in the Table 15.1. Details are in Appendix 13.
Table 15.1: Performance Analysis of Project Company
Project Company
Period Covered Business
Risk Financial Risk
Financial Flexibility &
Liquidity Critical Factors
GTCL FY2014-FY2017 Fair High Less than adequate
Consistency of wheeling charge (fixed by BERC)
BGFCL FY2015-FY2017 Fair Moderate to High Adequate Availability of Gas
SGFL
FY2015-FY2017
Fair
Low to Moderate
Good
Mobilizing Required
Investment
PGCL FY2015-FY2018 Moderate Moderate Adequate Operational efficiency A. Gas Transmission Company Limited (GTCL) 2. GTCL owns and operates major gas transmission pipelines throughout the country.3 Gas transmission pipelines built by other companies before GTCL’s establishment have been integrated with GTCL’s system. During the FY2016-17, GTCL transmitted 770.64 billion cubic feet (BCF) of gas through its 1,560.43-km 20-inch, 24-inch, 30-inch and 36-inch diameter pipelines at 960-1,050 psig operating pressure, which is 0.44% higher than the previous year of 770.46 BCF. Total of 520.17 BCF, 88.47 BCF, 85.10 BCF, 44.46 BCF, 29.93 BCF and 2.51 BCF were transmitted to the six franchise areas of Titas (67.5%), Bakhrabad (11.5%), Karnaphuli (11.0%), Jalalabad (5.8%), Pashchimancahal (3.9%) and Sundarban (0.3%) gas distribution companies respectively. The company transmitted a total of 2.05 million barrels of condensates through its 175-km long north-south condensate pipeline during the same year, which was 54.12% higher than the previous year. The company has implemented 20 projects worth of Tk59.14 billion during
1 Business risk refers to regulation, markets, operations, and competitiveness & management. 2 Size, profitability, operating efficiency, capital structure, and cash flow and coverage position, and their trends for last
three years (FY2014-15 to FY2016-17). 3 GTCL was registered on 14 December 1993 under the Companies Act, as a public limited company with an authorized
capital of Tk100 billion of 190 million shares of Tk1000 each. The company was formed with the objectives of (i) centralized operation and maintenance of national gas grid, (ii) expansion of national gas grid, and (iii) as required, ensuring balanced supply and usage of natural gas in all regions of the country. GTCL commenced its formal operation through convening the first meeting of the board of Directors on 23 January 1994 and subsequently started its commercial business from March 1994.
Appendix 15 79
1994-2017 funded by the government of Bangladesh (GoB);4 GTCL’s own funding, funding from companies under Petrobangla, and funding from the development partners such as ADB, JICA and World Bank. The Company has plan to invest Tk67.47 billion over the next six years (from 2017-2022) to expand 464 km transmission pipelines.5 i. Business Risk
3. Assessment of GTCL’s business reflects the strengths of its monopoly business model, low industry risk, strong competitive position, moderate to high cash flow volatility and significant investment requirements over the next 5 years. Transmission utilities operate in the least risky segment of the energy market. GTCL has large, long-life assets–high-pressure gas pipelines. Major portion of its revenue is highly regulated and stable. GTCL’s operations are subject to volume-risk as they operate under a volume-based revenue mechanism. However, GTCL does not usually take commodity risk. As they transport fuel for a fee rather than take ownership of the commodity, there is no buy and sell transactions. As a result, the business risk of GTCL is low and they can achieve a given rating level with less financial cushioning than other utilities. ii. Regulation 4. Regulation is a critical aspect that causes GTCL’s creditworthiness. Regulatory decisions largely affect its financial performance. GTCL is expected to remain highly regulated monopoly, with rates set by Bangladesh Energy Regulatory Commission (BERC), based on principles and methodologies set in BERC’s tariff regulations, that are stringent yet flexible to necessities. While the utility is largely protected from business risk, non-responsiveness of rate-setting process to changes in utility's cost structure causes revenue risk on the company. 5. While cost plus regulation is generally favorable for the gas sector agencies, directives to regulators are important. In October 2018, all eight state-owned downstream entities in gas sector including the six distribution companies, one transmission company (GTCL) and an liquified natural gas (LNG) marketing company had appealed to BERC,6 seeking an average 75% increase in the existing gas prices for different consumer groups, except for households and commercial connections. The upward price revision was sought for industrial consumers, power plants, fertilizer factories, captive power plants, and CNG refueling stations. BERC increased gas price and transmission charges in September 2018. iii. Market 6. GTCL has a reasonably diverse customer base–the six distributors. GTCL’s customer concentration to Titas Gas Transmission and Distribution Company Limited (TGTDCL)–a public listed company does not expose to a major risk due to 75% government ownership, although it contributes about 67.5% of GTCL's revenue. Distribution companies’ end-use market’s strength and diversity is also important to GTCL. Accordingly, these end-use markets are evaluated from demand perspective as seen in the Table 15.2 below. 4 Average Project size is Tk2.96 billion; average CAPEX per year is Tk2.46 billion (GTCL. 2017. Annual Report 2016-
17. page 62; and the PCR team’s calculation). 5 Identified six projects but the means of finance not yet decided. 6 Rationale for tariff revision appeals were- i) meeting the revenue demand in line with gas transmission tariff
methodology, ii) considering the overall situation of the previous Fiscal Year (FY), iii) fulfilling the revenue target for the following fiscal year, iv) importing Liquefied Natural Gas (LNG) and v) considering 0.25% of potential technical losses in the FY2018-19. According to GTCL, net transmission costs in FY2016-17 stood at Tk0.28 for each cubic meter gas, while the figure was Tk0.21 and Tk0.19 in the previous two fiscal years respectively.
80 Appendix 15
Table 15.2: Sector wise Gas Demand Forecast (2017-2022) of Bangladesh
Sector 2017-18 2018-19 2019-20 2020-21 2021-22 5 Year Total Sector Composition
(%) Power 607.50 657.50 728.50 705.50 709.50 3,408.50 48.08% Captive 152.50 152.50 152.50 152.50 140.50 750.50 10.59% Fertilizer 98.50 98.00 98.50 98.00 98.00 491.00 6.93% Industry 191.50 253.00 321.50 366.00 390.00 1,522.00 21.47% Commercial 9.00 9.00 9.00 9.00 9.00 45.00 0.63% Domestic 133.00 133.00 134.00 133.00 133.00 666.00 9.39% Tea-Estate 2.00 2.00 2.00 2.00 2.00 10.00 0.14% CNG 41.00 41.00 41.00 39.00 34.00 196.00 2.76% Total in BCF 1,235.00 1,346.00 1,487.00 1,505.00 1,516.00 7,089.00 100.00% Total in TCF 1.24 1.35 1.49 1.51 1.52 Average Requirement of each year in TCF 1.42
7. Persisting shortage is an issue since 2009. TGTDCL and Karnaphuli Gas Distribution Company Ltd (KGDL)–the two distributors who are subsidiaries of Petrobangla, have been running short of gas as demand has risen rapidly from 2009. Since Petrobangla often applies gas distribution rationing, GTCL’s business is highly sensitive to volumetric and economic fluctuations. Usage and growth levels in the end-use markets should also be compared with transmission capacity utilization, which is not in the scope of this PCR. However, in general, underutilized transmission lines that serve growing markets have more positive implications, while fully utilized lines that serve matured markets have less favorable implications. iv. Management 8. GTCL has an experienced management team with a reasonably good track record, having good understanding of issues affecting its business. Management is proactive to guarding against potential threats to its business position. Changes in the senior management team are relatively common considering 100% government ownership structure, but relatively seamless with minor disruption. GTCL prepared a 10-year business plan that plans overcoming the following challenges–(i) handover of all transmission pipeline to the company; (ii) conversion of loan to equity and regular submission of proposal to BERC for increasing transmission charge; (iii) ceasing of taking new projects with company’s own fund; and (iv) creation of separate depreciation fund. GTCL itself is focused on profit but its wheeling charge being determined by BERC affects GTCL’s financial security. v. Strategic Success 9. Strategic success is challenging given GTCL’s perceived strength and weakness. Key factors affecting GTCL’s business position are (i) tariff; (ii) regulatory efficiency and investment requirements; (iii) transparency of regulatory arrangements; (iv) age and condition of assets; (v) operational efficiency; (vi) trend and stability in energy demand in service area; (vii) responsibilities for conducting the market function; (viii) willingness to invest in non-core activities; (ix) physical layout of network, and dependence on a particular region for power or gas supply; and responsibility in system planning and augmentation.
vi. Financial Risk 10. During fiscal year of 2016-2017, GTCL earned gross revenue of Tk4.55 billion (Tk4.22 billion from transmission charge and Tk327.31 million from selling condensates to the gas distribution companies), resulting an increase of profit by 8.43% from FY2015-16 (versus negative growth rate of 34.19% in FY2015-16 from FY2014-15) corresponding to 0.45% and 10.65% growth in volume of gas transmission for the respective periods. Due to increase in transmission
Appendix 15 81
volume and transmission charges (transmission charge increased to Tk0.27/CM from Tk0.16/CM by BERC from 1 March 2017), sales increased by Tk353.25 million. However, gross profit margin significantly dropped to 27.93% in FY2016-17 from 37.59% in FY2015-16 due to 25.20% increase in direct costs (employee cost, repair and maintenance, depreciation, Petrobangla’s service charge and other direct costs). Due to 63.88% growth in operating expenses, operating profit margin contracted to 16.91% in FY2016-17 from 30.30% in FY2015-16. Furthermore, due to high leverage, financial expenses increased to Tk1.26 billion in FY2016-17 from Tk726.2 million in FY2015-16. Hence, profit before tax (adjusted) in FY2016-17 was Tk43.3 million, decreased from Tk1.67 billion in FY2015-16.7 Due to provision for tax, net profit after tax (adjusted) was negative Tk261.83 million in FY2016-17. The profitability level decreased significantly during 2014-15 through 2016-17 as shown in Table 15.3. 11. Leverage and coverage levels and cash flow generation ability deteriorated in recent years as reflected in Table 15.3. Gross gearing and net gearing increased to 111.66% and 109.58% in FY2016-17 from 107.26% and 99.21% in FY2013-14, respectively. Total debt to capitalization (%) and total debt to equity increased to 54.14% and 1.18 in FY2016-17 from 52.25% and 1.09 in FY2013-14 respectively. FFO to debt declined to 6.08% in FY2016-17 from 13.42% in FY2013-14 and debt to EBITDA deteriorated to 19.54x in FY2016-17 from 8.58x in FY2013-14.
Asset Turnover (Sales /Total Assets) 0.07 0.07 0.04 0.04 OK
7 According to audited financial statement for the period 2016-17, reported net profit before tax and after tax was
Tk433.21 million and Tk128.04 million respectively. However, PCR team adjusted the qualified audit opinion as follows–(i) adjusted foreign currency/exchange fluctuation loss for an amount of Tk313.66 million, and (ii) interest on loan from GOB and foreign development agencies to the tune of Tk76.20 million.
82 Appendix 15
Item Jun-14 Jun-15 Jun-16 Jun-17 Trend Capital Structure
FCY Debt / Total Debt - - - - Adjusted Debt 42,976.20 45,409.47 48,424.05 54,478.69 ↓ Adj. Capitalization 82,248.92 86,495.61 93,520.27 100,624.99 ↑ Current Ratio 1.78 1.69 1.48 1.14 ↓ Quick Ratio (Acid Test) 1.68 1.50 1.27 0.97 ↓ Working Capital 3,419 3,227 2,266 942 ↓ Gross Gearing (%) 107.26 109.19 106.11 111.66 ↓ Net Gearing (%) 99.21 98.83 102.19 109.58 ↓ Total Equity/Total Assets 45.78 45.35 46.16 44.18 ↓ Total Debt / Sales (%) 764.17% 712.89% 1,155.10% 1,198.54% ↓ Total Debt / Equity 1.09 1.11 1.07 1.18 ↓ Total Debt/ Capitalisation (%) 52.25% 52.50% 51.78% 54.14% ↓ Adjusted Debt to Capital 52.25% 52.50% 51.78% 54.14% ↓
Growth Formulas G = Sales Growth % - 13.26 (34.19) 8.43 OK R = Retained Earnings / Sales 75.73 76.41 29.21 (5.76) ↓ T = Total Assets / Sales 1,525.49 1,422.29 2,330.48 2,297.90 OK Growth funded by RE = R / T 4.96 5.37 1.25 (0.25) ↓ Profit Margin (P) 75.73 76.41 29.21 (5.76) ↓ Retained Earnings (R) 100.00 100.00 100.00 100.00 ↑ Asset Turnover (A) 0.07 0.07 0.04 0.04 OK Asset Equity (T) - 2.31 2.38 2.32 OK Sustainable Growth (PRAT) - 12.39 2.98 (0.58) ↓
vii. Financial Flexibility & Liquidity
12. Given the positive fund flow from operation (FFO) over the last four years (FY2016-17–Tk3.31 billion, FY2015-16–Tk3.98 billion and FY2014-15–Tk6.51 billion); deterioration in working capital turnover (1.83x in FY2016-17 versus 4.73x in FY2013-14), and cash and bank balances as % of current liabilities which was 14.17% in FY2016-17 (versus 71.87% in FY2013-14), GTCL's liquidity is assessed as less than adequate, reflecting the company’s deteriorating cash cushion and positive operating cash flow. Need for additional funding or capital for future investment is very high but the ability to access additional funding based on current leverage position is significantly tight. However, PCR team favorably assess GTCL's solid banking relationship given the company’s status as Bangladesh's single gas transmission public sector entity and its past track record.
Appendix 15 83
B. Bangladesh Gas Fields Company Limited (BGFCL) 13. BGFCL is the largest state-owned public limited natural gas producing company in the country, with six gas fields comprising Titas, Habiganj, Bakhrabad, Narsingdi, Meghna and Kamta under its operation.
Table 15.4: Bangladesh Gas Fields in Production (December 2017)
14. During the fiscal year 2016-2017, five out of six gas fields of BGFCL were in production and a total of 301 billion cubic feet of gas was produced from the 42 producing wells at an average daily production capacity of 825.54 million cubic feet (MMCFD), which is about 31% of the country’s total gas production capacity and about 78% of the production capacity of the state-owned companies.8 This production capacity is higher than that of the previous year by 3.06 billion cubic feet or 1.02%. During the same fiscal year, 28.29 million liters of condensate was also produced from the company's gas wells.9 15. According to Petrobangla Annual Report 2017, total recoverable proven and probable gas reserve (2P) of six gas fields under BGFCL is about 10.64 TCF, out of which 7.87 TCF or about 73.95% has been withdrawn till 31 December 2017. Remaining recoverable gas reserve as of 1 January 2018 was 2.77 TCF or 26.05% of total recoverable reserve. BGFCL has another 10 or less years of production ahead based on the current production trend and reserve estimates. This could extend if more discoveries became successful. The limited rate of replacement of proven and probable reserves by resource maturation, reservoir pressure and wellhead pressure at various fields of the company remains matters of concern. i. Business Risk
16. Assessment of BGFCL’s business recognizes the strengths of its monopoly business model, moderate to high cash flow volatility, and a declining reserve life in upstream, which represents a major challenge for the company due to limited opportunities and exploration activities. ii. Regulation 17. Regulation is a critical aspect that underlies BGFCL’s creditworthiness. Regulatory decisions greatly affect its financial performance. According to BGFCL, due to decrease of
8 Total gas production of the country is approximately 2,740 MMCFD 9 BGFCL. 2017. Annual Report 2016-17; Page 45. Dhaka.
84 Appendix 15
wellhead margin from Tk0.83/CM to Tk0.42/CM with effect from 1 March 2017 by BERC,10 company's rate of return decreased to 10.40% from 24.58% achieved in the previous year, whereas the minimum rate of return for gas production company is 12%. A financial projection applying wellhead margin of Tk0.42/CM shows that the company will face a financial loss of Tk659.8 million in the fiscal year 2017-2018. The current regulation is affecting the utility’s operating environment. Future changes are expected over short to medium term, but the nature and impact of the regulatory changes are broadly predictable.11 While changes are slightly adverse for BGFCL and reduce its credit quality, they are not expected to be of a catastrophic nature so as to threaten the continued viability of the company. The regulatory regime provides immunization against competitive forces and financial variability but also constrains the utility’s upside potential from increased sales or improved cost efficiencies. iii. Market
18. According to Petrobangla, the remaining reserve of gas in the country at present is about 11.91 TCF. In the face of country’s increasing gas demand (Table 15.5), this reserve would run out within 8 to 9 years.12
Table 15.5: Sector wise Gas Demand Forecast (2017-2022) of Bangladesh
Sector 2017-18 (BCF)
2018-19 (BCF)
2019-20 (BCF)
2020-21 (BCF)
2021-22 (BCF)
5-Year Total (BCF)
Composition (%)
Power 607.50 657.50 728.50 705.50 709.50 3,408.50 48.08% Captive 152.50 152.50 152.50 152.50 140.50 750.50 10.59% Fertilizer 98.50 98.00 98.50 98.00 98.00 491.00 6.93% Industry 191.50 253.00 321.50 366.00 390.00 1,522.00 21.47% Commercial 9.00 9.00 9.00 9.00 9.00 45.00 0.63% Domestic 133.00 133.00 134.00 133.00 133.00 666.00 9.39% Tea-Estate 2.00 2.00 2.00 2.00 2.00 10.00 0.14% CNG 41.00 41.00 41.00 39.00 34.00 196.00 2.76% Total in BCF 1,235.00 1,346.00 1,487.00 1,505.00 1,516.00 7,089.00 100.00% Total in TCF 1.24 1.35 1.49 1.51 1.52 Average Requirement of each year in TCF 1.42
19. Bangladesh was unable to find very large new onshore gas fields in the last decade except small sized gas fields discoveries. The offshore is even less explored, though it holds good possibilities. Far more exploration needs to be carried out in order to realize its real potential. With all the geological parameters in place for a gas rich habitat, Bangladesh should take this into consideration when forming its future gas exploration strategies. 10 The Ministry of Power, Energy and Mineral Resources fixed company’s wellhead margin @Tk0.83/CM with effect
form 1 July 2014, following a submission to increase the wellhead margin for meeting revenue requirement for the period 2014-2015 to 2018-2019. Recently, BERC re-fixed company's wellhead margin @Tk0.42/CM with effect form 1 March 2017. Re-fixation of wellhead margin, following a request from the company, a meeting was held in the administrative Ministry on 07 May 2017 regarding increase of BGFCL's wellhead margin. As per resolution of the meeting, the issue regarding increase of BGFCL's current wellhead margin would be considered after the settlement of the BERC's gas price increase with effect form 01 June 2017 by the honorable court. In the meantime, the issue of gas price increase has been settled by the honorable court and subsequently, the company sent a letter to Pertobangla on 24 October 2017 regarding increase of wellhead margin.
11 Long term macro-economic implications of gas tariff reforms and allocations of a computable general equilibrium (CGE) model needs to be developed. This inter-temporal (i.e. multiple time periods) decision tool to be designed to trace detailed interactions between demand, supply and resource use within economies and in their trade with the global economy. Energy efficiency improvements and energy sector diversification, policies should be implemented together with energy price reforms to ensure better outcomes.
12 However, reserve growth and new reserve addition have been noticed in Bangladesh in the previous decades and it would by all likeliness happen further if a strong exploration campaign is launched. The Bangladesh delta, being the largest in the world, is least likely to be devoid of gas so early in its exploration history, because deltas, throughout the world, tend to be very rich in gas or oil. The exploration in Bangladesh remains at an immature stage and it is too early to contemplate a depleted gas scenario.
Appendix 15 85
iv. Growth Prospect 20. BGFCL operates in a franchise monopoly and this situation is likely to prevail in the foreseeable future. The utility’s energy is significantly less expensive than alternative energy sources and this situation is likely to prevail in the foreseeable future. However, profit potential may be constrained to significant levels by customer-focused regulatory oversight of services. Expected growth rates are positive in terms of volume and revenue (volume increased by 0.20% in FY2015-16 and 1.03% in FY2016-17, revenue increased by 14.61% in 2016 and 2.2% in FY2016-17) but exhibit significant volatility over time. However, capacity to satisfy the demand over the medium to long term may be questionable if growth is significantly higher than expected. v. Management 21. BGFCL has an experienced management team with a reasonable track record, having good understanding of issues affecting its business. It has good understanding of issues that affect its business. The management is proactive with regard to guarding against potential threats to its business position even though, as per management report, it lacks resources. Changes in the senior management team are relatively common (considering the 100% government ownership) but are relatively seamless with minor disruption. Though the company is profit oriented, wellhead margin determined by BERC plays a significant role within its revenues and to some extent undermine financial security. vi. Strategic Success 22. Strategic success in the long term is challenging given the perceived strength and weakness of BGFCL. The reservoir pressure at various fields of the company is declining gradually. As a result, it has become operational requirement to set up gas compressors in the processing stream for raising declined gas pressure to meet the level of national grid pressure and to continue uninterrupted gas supply. Installation and operation of gas compressors in production process is challenging. To meet country’s growing gas demand, BGFCL implements development projects that have added several new installations with the company’s routine operational works. These new lines of activities have financial implications such as costs for installation and operation of the compressors. Company's overall operational expenses along with payment of debt service liability needs to be considered effectively to increase its financial strengths.
vii. Financial Risk
23. During the fiscal year 2016-2017, the company earned gross revenue of Tk36.80 billion (Tk33.85 billion from sales of natural gas and Tk2.95 billion from sales of petroleum products), an increase of revenue by 2.22% from FY2015-16 (verses growth rate of 14.61% in FY2015-16 from FY2014-15) corresponding to 1.03% and 0.20% growth in volume of gas for the same periods. Despite increase in gas production, net sales decreased by Tk912.09 million in FY2016-17 from FY2015-16. Gross profit margin dropped to 10.74% in FY2016-17 from 21.32% in FY2014-15 due to (i) re-fixation of wellhead margin at Tk0.42/CM from Tk0.83/CM effective from 1 March 2017, (ii) increase in supplementary duty & VAT on gas sales, and (iii) increase in cost of production. Furthermore, due to high leverage, financial expenses increased to Tk309.30 million in FY2016-17 from Tk91.9 million in FY2014-15. Hence, profit before tax in FY2016-17 was Tk3.93 billion, decreased by 43.43% from FY2014-15. Due to significant provision for deferred tax, net profit after tax was negative Tk660.20 million and Tk315.10 million in FY2016-17 and FY2015-16 respectively. The profitability level decreased significantly during 2014-15 to 2016-17 as shown in Table 15.6.
86 Appendix 15
24. Leverage and coverage levels and cash flow generation capacity deteriorated in recent years as reflected in Table 15.6. Gross gearing and net gearing increased to 81.29% and 68.56% in FY2016-17 from 39.09% and 28.87% in FY2014-15 respectively. Total debt to capitalization (%) and total debt to equity (x) increased to 45.38% and 0.83x in FY2016-17 from 28.85% and 0.41x in FY2014-15 respectively. FFO to debt declined to 21.04% in FY2016-17 from 50.27% in FY2014-15.
Table 15.6: BGFCL’s Financial Performance (FY2014-15 to FY2016-17)
(Tk million) Item Jun-15 Jun-16 Jun-17 Trend
Size Sales 31,413.00 36,002.00 36,800.00 ↑ EBITDA 7,293.73 6,945.99 5,885.57 ↓ EBIT 6,696.60 5,612.22 3,951.22 ↓ Total Assets 60,347.90 72,372.32 84,424.52 ↑ Total Debt 10,617.82 15,554.57 22,166.07 ↓ Common Equity (Including Minority) 22,144.00 21,089.00 21,372.00 OK Total Capital 36,808.48 41,594.39 48,843.60 ↑
Operating Efficiency Inventory Days 5.04 5.08 5.04 OK Trade Receivables (Debtor) Days 147.36 156.25 141.74 ↑ Creditors Days 84.33 95.02 90.27 OK Funding Gap (Debtors+Inventory-Creditors) 68.07 66.31 56.51 ↓ Working Capital Turnover 4.30 4.54 5.56 ↑ Fixed Asset Turnover (Sales / Fixed Asset) 0.97 0.92 0.79 ↓ Asset Turnover (Sales / Total Assets) 0.52 0.50 0.44 ↓
Capital Structure Adjusted Debt 10,617.82 15,554.57 22,166.07 ↓ Adj. Capitalization 36,808.48 41,594.39 48,843.60 ↑ Current Ratio 1.69 1.32 1.21 ↓ Quick Ratio (Acid Test) 1.66 1.30 1.19 ↓ Working Capital 8,413 5,621 4,254 ↓ Gross Gearing (%) 39.09 58.22 81.29 ↓ Net Gearing (%) 28.87 47.89 68.56 ↓ Total Equity/Total Assets 43.40 35.98 31.60 ↓ Total Debt / Sales (%) 33.80% 43.20% 60.23% ↓ Total Debt / Equity, x 0.41 0.60 0.83 ↓ Total Debt/ Capitalization (%) 28.85% 37.40% 45.38% ↓ Adjusted Debt to Capital 28.85% 37.40% 45.38% ↓
Cash flow and Coverage Ratios Funds from Operations (FFO) 5,337.88 5,361.29 4,663.09 ↓ Free Cash Flow (NOCF+Capex) (5,616.94) 4,539.10 2,835.53
Appendix 15 87
Item Jun-15 Jun-16 Jun-17 Trend EBITDA Interest Coverage 79.34 56.35 19.03 ↓ EBITDAr Interest Coverage 79.34 56.35 19.03 ↓ Operating profit/interest 72.85 45.53 12.78 ↓ FFO Interest Cover 59.07 44.47 16.09 ↓ Cash Flow Interest Cover (57.12) 50.04 16.70 OK Net Operating Cash Flow/Sales (17.88) 12.61 7.71 OK Cash Flow before Financing/Sales (17.88) 12.61 7.71 OK Total Debt/EBITDA, x 1.46 2.24 3.77 ↓ EBITDA/Short-term debt 8.39 15.35 12.91 OK EBIT Interest Coverage 72.85 45.53 12.78 ↓ FFO/ Total Adjusted Debt 50.27% 34.47% 21.04% ↓
viii. Financial Flexibility & Liquidity
25. Given the positive fund flow from operation (FFO) over the last three years (Tk4.66 billion in FY2016-17, Tk5.36 billion in FY2015-16, and Tk5.33 billion in FY2014-15); improvement in working capital turnover (5.56x in FY2016-17 compared to 4.30x in FY2014-15); and average cash and bank balance (as % of current liabilities) of 18.20%, BGFCL's liquidity is assessed to be adequate, reflecting on (i) company’s solid cash cushion and (ii) positive free operating cash flow. Need for additional funding or capital for future investment is high but the ability to access additional funding/capital based on current leverage position is still challenging. However, BGFCL's solid banking relationship is favorable given its past track record and status as Bangladesh's largest public sector gas producing entity. C. Sylhet Gas Field Limited (SGFL) 26. Sylhet Gas Fields Limited (SGFL) is one of the three state-owned public limited natural gas producing company in Bangladesh. Following five gas fields naming Sylhet (Haripur), Kailashtilla, Rashidpur, Beanibazar and Chhatak, with 13 producing gas wells are placed under SGFL for operation. It owns a condensate fractionation plant with capacity of 3,750 barrel per day at Rashidpur that produces motor spirit, octane, diesel and kerosene. 27. During the fiscal year 2016-2017, four out of five gas fields of SGFL were in production, and a total of 51.3 BCF of gas was produced from the 14 producing wells at an average daily production rate of 141 MMCF which is about 5% of the total gas production of the country and about 13% of the production of the state-owned companies. This production is lower than that of the previous year by 2,619.03 MMCF or 4.85%. During the same fiscal year, the company produced 30.93 million liters of heavy and light condensate from its gas wells,13 which is 5.64 million liters, or 15.42% lower than the previous year on the back of declined gas production.14 In addition, a total of 13.31 million liters of petrol, 15.50 million liters of diesel, and 12.78 million liters of kerosene were produced from the fractionation plants at Haripur, Kailashtilla and Rashidpur (RCFP). Furthermore, 24.88 million liters of natural gas liquids (NGL) was sold from Kailashtilla MSTE Plant to Rupantarita Prakritik Gas Company Limited (RPGCL). Table 15.7 presents the country’s total gas and condensate productions by companies.
13 30.81 million liters of heavy condensate and 119.66 kiloliters of light condensate. 14 In 2016-17, 142.41 million liters of condensate from Chevron Bangladesh, BAPEX. JGTDSL-DRS and SGFL was
supplied to the ten condensate fractionation plans, which was 142.78 million liters or 50.06% less than that of the previous year.
88 Appendix 15
Table 15.7: Bangladesh Gas Fields in Production (December 2017)
28. According to Petrobangla’s Annual Report 2017, total recoverable proven and probable gas reserve (2P) from five gas fields under SGFL is about 6.19 TCF; out of which 1.65 TCF or about 26.11% was extracted till 31 December 2017. The remaining recoverable gas reserve as of 1 January 2018 was 4.57 TCF or 73.89% of the total recoverable reserve. i. Business Risk
29. Assessment of SGFL’s business recognizes the strengths of its monopoly business model, a moderate cash flow volatility and a declining reserve life in upstream, which represents a challenge for the company due to limited opportunities and exploration activities. ii. Regulation 30. Regulation is a critical aspect that underlies SGFL’s creditworthiness. Regulatory decisions profoundly affect financial and business performance. Gas pricing remains a sensitive issue in Bangladesh. Retail gas tariff is yet to reflect the true economic cost of delivering gas to consumers. The current retail price, specially for the domestic consumers, still had to take care of the socio-economic aspects. 27-Year CAGR (1990-91 to 2016-17) of weighted average retail tariff was 5.48% versus average inflation rate of 6.36% for the same period. The government also sets the level of supplementary duty (SD) payable by Petrobangla on gas sales and determines the margins to be paid for gas transmission and distribution companies. Gas production companies receive a fixed wellhead price estimated by the government to be adequate to meet their needs. The government’s margin on gas sales is made up of VAT at 15% of the component of the end user price attributable to gas supplied from state companies, the SD levy of 96% on all transmission and network costs, and on gas supplied by state owned companies. In 2018, a new pricing formula has been approved by BERC that reduces VAT and considers the imported LNG prices. Since then the retail gas price has been increased twice. The result is yet to be reflected for the upstream gas companies. 31. The regulatory regime provides protection against competitive forces and financial variability but also constrains the utility’s upside potential from increased sales or improved cost efficiencies. Rate setting mechanism is supportive of credit quality, although the utility may not be able to fully pass on cost increases or increase rates to cover unexpected capital expenditures. iii. Market
32. According to Petrobangla, the remaining reserve of gas in the country as of 1 January 2018 is about 11.91 TCF. In face of increasing gas demand in the country (Table 15.8), this reserve is estimated to run out within 8 to 9 years.
Appendix 15 89
Table 15.8: Sector wise Gas Demand Forecast (2017-2022) of Bangladesh
Sector 2017-18
(BCF) 2018-19
(BCF) 2019-20
(BCF) 2020-21
(BCF) 2021-22
(BCF)
5-Year Total
(BCF)
Composition (%)
Power 607.50 657.50 728.50 705.50 709.50 3,408.50 48.08% Captive 152.50 152.50 152.50 152.50 140.50 750.50 10.59% Fertilizer 98.50 98.00 98.50 98.00 98.00 491.00 6.93% Industry 191.50 253.00 321.50 366.00 390.00 1,522.00 21.47% Commercial 9.00 9.00 9.00 9.00 9.00 45.00 0.63% Domestic 133.00 133.00 134.00 133.00 133.00 666.00 9.39% Tea-Estate 2.00 2.00 2.00 2.00 2.00 10.00 0.14% CNG 41.00 41.00 41.00 39.00 34.00 196.00 2.76% Total in BCF 1,235.00 1,346.00 1,487.00 1,505.00 1,516.00 7,089.00 100.00% Total in TCF 1.24 1.35 1.49 1.51 1.52 Average Requirement of each year in TCF 1.42 Source: Petrobangla Annual Report 2017
33. There is no significant onshore gas reserve discovery in Bangladesh in last decade, apart from small discoveries in Bhola. The offshore is even less explored. More exploration needs to be carried out in order to realize the true gas potential. 34. Although supply shortage is a issue, the pace of exploration has been slow in the past, leaving large area of the country still unexplored or underexplored. However, Bangladesh Petroleum Exploration and Production Company Limited (BAPEX), the lone national exploration company under Petrobangla, has embarked on implementation of extensive exploration programs that include drilling of 53 exploration wells, 20 workover wells and 35 development wells within 2021 along with 3,000 line-kilometre of 2D seismic survey during 2016 to 2019 in the onshore. 35. Petrobangla is set to import LNG in parallel with its endeavor to scale up exploration activities for new resources in the country. Two terminal use agreements (TUA) have been signed with Excelerate Energy Bangladesh Limited and Summit LNG Terminal Co. (Pvt.) Ltd. to install two floating storage re-gasification units (FSRU) at Moheshkhali for supplying 500 MMCFD of LNG each. The first FSRU started operation from July 2018. The second FSRU came into operation with 100 MMCFD supply from early 2019, targeting full utilization from late 2019. Besides, under Petrobangla, RPGCL initiated to install one or more land-based LNG terminal(s). Two long term LNG sales and purchase agreements have been signed with RasGas of Qatar and Oman Trading International on government to government basis. iv. Growth Prospect 36. SGFL operates in a franchise monopoly and this situation is likely to prevail into the foreseeable future. The utility’s energy cost is cheaper than alternative energy sources and this situation is likely to prevail. SGFL has a reasonably diverse product mix (gas, condensate, petrol, diesel, kerosene and NGL) and customer base (Jalalabad Gas Transmission & Distribute System Ltd, Bakhrabad Gas Distribution Company Ltd, Karnaphuli Gas Distribution Company Ltd, and Pashchimanchal Gas Company Ltd). But the revenue growth rates are still negative and exhibit volatility over time (Table 15.9) and overall consumptions are reliant upon a small number of medium to large companies within the market.
90 Appendix 15
Table 15.9: Revenue, Growth & Composition Year 2014 2015 2016 2017 Sales (Tk million) Gas 3,960.76 4,155.86 4,661.02 4,643.35 Petroleum Product 15,498.73 12,515.48 9,335.26 10,719.10 Total 19,459.49 16,671.34 13,996.28 15,362.45 Growth Rate (%) n.a. (14.33)% (16.05)% 9.76% Sales (%) Gas 20.35% 24.93% 33.30% 30.23% Petroleum Product 79.65% 75.07% 66.70% 69.77% Total 100.00% 100.00 % 100.00% 100.00 % Sales (Quantity in MMCM) Gas 1,506.55 1,529.54 1,525.03 1,450.94 Petroleum 340.77 351.02 459.48 337.84 Growth Rate (Gas) n.a 1.53% -0.29% -4.86% Growth Rate (Petroleum) n.a 3.01% 30.90% -26.47% Gas to Petroleum 22.62% 22.95% 30.13% 23.28% SD & VAT Gas - SD & VAT 3,616.37 3,805.60 4,311.80 4,277.00 Petroleum -VAT 2,011.09 1,619.30 1,185.50 1,383.60 Total 5,627.50 5,424.90 5,497.20 5,660.60 Net Sales (Margin) Gas 8.69% 8.43% 7.49% 7.89% Petroleum 87.02% 87.06% 87.30% 87.09% Average Margin 71.08% 67.46% 60.72% 63.15% Average Sales Price (Tk) Gas per CM 2.63 2.72 3.06 3.20 Petroleum per Liter 45.48 35.65 20.32 31.73 Growth Rate (Gas) - 3.35% 12.49% 4.71% Growth Rate (Petroleum) - (21.61)% (43.02)% 56.17%
MMCM = million cubic meter 37. During FY2016-17, SGFL has produced a total of 51.30 BCF of natural gas, 30.81 million liters of heavy and 119.66 kiloliters of light condensates. Besides, an amount of 24.81 million liters of NGL produced from Kailashtila MSTE plant was transported to RPGCL’s NGL fractionation plat at Kailashtilla. In 2016-17, total condensate production reduced due to declined gas production. NGL production was less by 883 kiloliters than that of the previous year due partly to (i) RPGCL’s intermittent receiving of NGL from Kailashtilla MSTE plant, and (ii) receiving gas at a reduced rate. The condensate obtained from Bibiyana gas field of Chevron Bangladesh Limited is fractionated into petrol, diesel and kerosene at Rashidpur condensate fractionation plant (RCFP). SGFL produced a total of 111.14 million literes of petrol, 16.31 million liters of diesel and 12.51 million liters of kerosene in FY2016-17. Petrol production increased by 31.91 million liters, diesel and kerosene production decreased by 724.57 kiloliters and 3.75 million liters respectively from FY2015-16. Composition of the condensate received from Bibiyana gas field of Chevron Bangladesh Limited has changed remarkably after expansion i.e., addition of light recovery unit (LRU) to the existing facilities, resulting into a substantial increase (by about 60%) in petrol production and a proportional decrease in diesel and kerosene production. v. Management 38. The gas sector is primarily regulated and administered by the government. The government, through the EMRD manages the authority for policy formulation, appointment and transfer of officials, investment decision and regulation. Petrobangla was created under the presidential order 27 of 1972, and subsequently incorporated through a series of ordinances as a state corporation for oil and gas exploration, production, transmission and distribution. Since 1994, Petrobangla has served as central authority and sole purchaser of IOC outputs.
Appendix 15 91
Petrobangla no longer has a direct operational role and conducts its sector oversight and management activities through the nine operating companies. These state-owned gas companies are incorporated as public limited companies under the Companies Act of 1994 and governed by separate boards of directors. Petrobangla and EMRD have authority to override major board decisions on matters of pricing, operating and development budgets, operational structure and human resources. The directors of the operating companies are either directors of Petrobangla, or government officials and individuals appointed by EMRD, including representatives from different chambers of commerce and industries, and technical universities. The public sector gas companies including Petrobangla have limited operational autonomy and not entitled to market-based wellhead prices. vi. Strategic Success 39. Strategic success is challenging given the perceived strength and weakness of SGFL. The reservoir pressure at various fields of the company is declining gradually. As a result, it has become operational requirement to set up gas compressors in the processing stream for raising declined gas pressure to the level of national grid pressure in order to continue uninterrupted gas supply. Installation and operation of gas compressors in production process is challenging. To meet country’s growing gas demand, SGFL implements development projects that have added several new installations with the company’s routine operational works. These new lines of activities have financial implications such as costs for installation & operation of the compressors. Company's overall operational expenses along with payment of debt service liability needs to be managed effectively to increase its financial strengths. vii. Financial Risk 40. During the fiscal year 2016-2017, the Company earned gross revenue of Tk15.36 billion (30.23% from sales of natural gas and 69.77% from sales of petroleum products), which is an increase of 9.76% from FY2015-16 (comparing to negative growth of 16.05% in FY2015-16 from FY2014-15) despite negative growth of 4.86% and 26.47% in volume of gas and petroleum products sales for the same period. Despite a decrease in sales volume, net sales increased by Tk1.36 billion in 2016-17 from 2015-16 on the back of 4.71% increase in average sales price of gas (average gas price/CM was Tk3.20 in FY2016-17 and Tk3.06 in FY2015-16) and 56.17% increase in average sales price of petroleum per liter (average petroleum price/liter was Tk31.73 in FY2016-17 and Tk20.32 in FY2015-16) (Table 15.9). SGFL has maintained moderate profitability level over the periods on the back of low leverage and product mix. Around 70% of its revenue are derived from sales of petroleum products. Since there was no SD from petroleum products, net sales margin of petroleum products is much higher compared to net sales margin of gas (Table 15.9). However, the profitability trend is seen continuously decreased since 2014-15 (Table 15.10) due to (i) increase in operational expenses, (ii) decrease in production and sales of gas and liquid petroleum products, (iii) decrease in the income from interests on savings, and (iv) increase in purchase of condensate for Rashidpur condensate fractionation plant (RCFP). Hence, net profit after tax is decreased to Tk3.11 billion in FY2016-17 from Tk3.99 billion in FY2014-15. 41. Leverage and coverage levels and cash flow generation capacity has deteriorated in the recent years as reflected in Table 15.10. Gross gearing and net gearing increased to 25.30% and 21.11% in FY2016-17 from 10.65% and 6.74% in FY2014-15 respectively. Total debt to capitalization (%) and total debt to equity (x) increased to 20.19% and 0.25x in FY2016-17 from 9.62% and 0.11x in FY2014-15 respectively. FFO to debt declined to 21.04% in FY2016-17 from 50.27% in FY2014-15. The increase in the leverage has been caused by increase of debt to
92 Appendix 15
Tk8.97 billion in FY2016-17 from Tk3.99 billion in FY2015-16 due to drilling of Rashidpur 9, 10 and 12 wells.
Table 15.10: SGFL’s Financial Performance (FY2014-15 to FY2016-17) (Tk million)
Item Jun-15 Jun-16 Jun-17 Trend Size
Sales 16,671.00 13,996.00 15,362.00 OK EBITDA 4,746.75 3,849.90 3,910.68 OK EBIT 4,481.59 3,535.58 3,622.63 OK Total Assets 43,853.45 44,992.31 49,004.71 ↑ Total Debt 3,323.71 3,993.77 8,974.23 ↓ Common Equity (Including Minority) 30,688.00 32,967.00 34,937.00 ↑ Total Capital 34,538.88 37,496.12 44,447.39 ↑
Profitability Gross Profit / Sales (%) 26.88 25.26 23.58 ↓ EBITDA / Sales (%) 28.47 27.51 25.46 ↓ Net Operating Profit / Sales (%) 26.88 25.26 23.58 ↓ Profit before Tax / Sales (%) 36.86 36.82 31.14 ↓ Return on Sales (NPAT/Sales %) 23.96 23.93 20.24 ↓ Return on Capital Employed (ROCE) 12.98 9.43 8.15 ↓ Return on Invested Capital (ROIC) 17.52 12.73 11.00 ↓ Return on Assets (ROA), % 10.98 7.96 7.71 ↓ Return on Equity (NPAT/Equity %) 17.12 13.53 10.35 ↓ Return on Capital (EBIT/Capital) 13.96% 9.82% 8.84% ↓
Operating Efficiency Inventory Days 41.08 35.89 32.86 ↑ Trade Receivables (Debtor) Days 165.65 215.44 187.02 OK Creditors Days 204.36 188.79 81.73 ↓ Funding Gap (Debtors+Inventory-Creditors) 2.37 62.54 138.15 ↑ Working Capital Turnover 7.89 3.61 2.44 ↓ Fixed Asset Turnover (Sales / Fixed Asset) 1.72 1.29 0.90 ↓ Asset Turnover (Sales / Total Assets) 0.38 0.31 0.31 OK
Capital Structure FCY Debt / Total Debt - - - Adjusted Debt 3,323.71 3,993.77 8,974.23 ↓ Adj. Capitalization 34,538.88 37,496.12 44,447.39 ↑ Current Ratio 1.47 1.75 2.92 ↑ Quick Ratio (Acid Test) 1.32 1.61 2.69 ↑ Working Capital 4,327 5,603 8,748 ↑ Gross Gearing (%) 10.65 11.92 25.30 ↓ Net Gearing (%) 6.74 9.62 21.11 ↓ Total Equity/Total Assets 71.18 74.46 72.39 OK Total Debt / Sales (%) 19.94% 28.53% 58.42% ↓ Total Debt / Equity, x 0.11 0.12 0.25 ↓ Total Debt/ Capitalization (%) 9.62% 10.65% 20.19% ↓ Adjusted Debt to Capital 9.62% 10.65% 20.19% ↓
viii. Financial Flexibility & Liquidity 42. Given the positive FFO over the last three years (Tk3.64 billion in FY2016-17, Tk3.91 billion in FY2015-16, and Tk4.58 billion in FY2014-15) deterioration in working capital turnover (2.44x in FY2016-17 compared to 7.89x in FY2014-15); and, average cash and bank balances (as % of current liabilities) at 18.81%, SGFL's liquidity is assessed to be good, reflecting on (i) company’s solid cash cushion, and (ii) positive free operating cash flow. Company needs additional funding or capital for future investment and the ability to access additional funding/capital based on current leverage position seems moderate. D. Pashchimanchal Gas Company Limited (PGCL) 43. Pashchimanchal Gas Company Limited (PGCL) is the 4th gas utility under Petrobangla with the objective of distributing gas in the north-west region of the country. The company commenced its business on 23 April 2000. During FY2017-18, a total of 578.98 MMCM15 of gas was sold by the company against 910.97 MMCM gas in the previous year to 0.13 million customers through 1,635.06 km pipeline.16 The weighted average gas sales price stood at Tk9.51/CM with a 5-Year CAGR (2014-2018) of 20.20%. The company earned Tk5.51 billion revenue from sales during FY2017-18, which was 7.71% lower than FY2016-17 and earned Tk663.82 million as net profit before tax, 18.92% higher than FY2016-17.
i. Business Risk 44. Price setting mechanism by the regulator, relatively weak economic activities and low industrialization of its franchise areas, slow growth rate of gas demand and concentration of few customers pose risk in PGCL’s cashflow. However, it enjoys the strength of monopoly business model, hence its business risk is assessed to be moderate. ii. Regulation
45. Regulation is a critical aspect that underlies PGCL creditworthiness. Regulatory decisions affect financial performance. BERC sets the prices based on multiple criteria on different sectors and implication on the overall economy. In FY2017-18, the weighted average gas sales price was Tk9.51/CM, increased by 20.20% over the last 5 years against weighted average gas purchase price of Tk4.27/CM, increased at a rate of 12.39% for the same period. Weighted average gas sales price was 2.23x of gas purchase price in FY2017-18, which was 1.70x in FY2013-14. iii. Market & Growth Prospect 46. For PGCL, the market consists of customers within a defined franchise area that are connected to the grid. As such, prospects for stable growth of revenues and cash flow are related to the strength of the local economy. Strength of long-term demand is examined from a macroeconomic perspective, which enables measurement of trends in investment, income, and employment as indicators of economic change within the service area. The sustainability of increasing demand, affordability and customers' ability and willingness to pay are also analyzed.
15 Volume sales in MMCM by customer segment are– 283.40 (48.95%) to power; 40.303 (6.96%) to captive power;
40.70 (7.03%) to industrial; 6.79 (1.17%) to commercial; 138.961 (24.0%) to domestic; 68.84 (11.89%) to CNG. 16 Number of Customers based on Category– 8 (power); 36 (captive power); 29 (CNG); 87 (CNG); 332 (commercial);
128,818 (domestic).
94 Appendix 15
47. Gas demand growth rates are negative (5-Year CAGR of gas sales volume from FY2013-14 to 2017-18 was negative 14.39%) and also exhibit significant volatility over time and highly reliant upon single industry and small number of large companies.17 A sizeable percentage of the utility's gas sales (24%) are derived from residential customers. However, due to very small industrial area, most people directly or indirectly depend on the industrial complex. Should that industrial complex be impacted by adversity, most customers will get impacted. As such, residential customers cannot be considered as diverse customer base. Limited customer base diversification has historically led to variations in financial stability, with cash flow generation and profitability dependent on consumption from its major customers.18 Different sales prices based on customer segment and customer mix will also impact its financial viability.19 iv. Financial Risk 48. During the fiscal year 2017-2018, the Company earned gross revenue of Tk5.51 billion, a decrease of 7.60% from FY2016-17 due to 36.4% decrease in gas sales volume. O&M cost increased by 22.50% in FY2017-18 from FY2016-17. However, net profit before tax increased to Tk663.8 million in FY2017-18 from Tk558.2 million in FY2016-17, an increase of 18.91% due to (i) weighted average gas sales price increased by 45.21% to Tk9.51/CM from previous year against 10.93% increase of gas purchase price (from Tk3.85/CM to Tk4.27/CM) for the same period; and (ii) net interest income increased to Tk175.50 million in FY2017-18 from Tk141.2 million in FY2016-17, increased by 24.29%. The profitability level increased significantly during 2015-16 to 2017-18 (Table 15.11). 49. Leverage and coverage levels and cash flow show mixed trend in recent years as reflected in Table 15.11. Gross gearing improved to 6.19% in FY2017-18 from 13.90% in FY2014-15. Total debt to capitalization (%) and total debt to equity (x) improved to 8.01% and 0.09x in FY2017-18 from 15.57% and 0.18x in FY2014-15 respectively. FFO to debt declined to 88.32% in FY2017-18 from 133.20% in FY2014-15.
17 44 small power and captive power project represents around 55.91% of gas sales; 29 CNG represents 11.89% of
gas sales; 87 industrial unit represents 7.03% of gas sales. 18 In terms of revenue, 29 CNG contributes around 40.38% of total sales. 19 Gas Sales Price in Tk per CM based on customer segment are–Tk3.80 (Power); Tk10.48 (captive power); Tk8.57
(industrial); Tk18.48 (commercial); Tk9.44 (domestic); and Tk32.30 (CNG).
Appendix 15 95
Table 15.11: PGCL’s Financial Performance (FY2014-15 to FY2017-18) (Tk million)
Item Jun-15 Jun-16 Jun-17 Jun-18 Trend Size
Sales 5,018.00 6,273.00 5,972.00 5,518.00 ↓ EBITDA 696.69 584.98 556.12 635.88 ↑ EBIT 569.87 463.16 446.28 523.21 ↑ Total Assets 5,130.22 5,724.51 6,483.64 6,225.08 OK Total Debt 443.67 389.73 345.63 285.95 ↑ Common Equity (Including Minority) 2,003.00 2,270.00 2,512.00 2,881.00 ↑ Total Capital 2,849.70 3,063.07 3,261.20 3,570.64 ↑
Profitability Gross Profit / Sales (%) 11.00 7.21 7.40 9.30 ↑ EBITDA / Sales (%) 13.88 9.33 9.31 11.52 ↑ Net Operating Profit / Sales (%) 11.36 7.38 7.47 9.48 ↑ Profit before Tax / Sales (%) 13.15 9.37 9.35 12.03 ↑ Return on Sales (NPAT/Sales %) 8.55 6.09 6.08 7.82 ↑ Return on Capital Employed (ROCE) 20.79 15.63 14.11 15.00 OK Return on Invested Capital (ROIC) 28.07 21.09 19.05 20.25 OK Return on Assets (ROA), % 11.11 8.53 7.31 8.23 OK Return on Equity (NPAT/Equity %) - 17.83 15.05 12.98 ↓ Return on Capital (EBIT/Capital) 20.00% 15.67% 14.11% 15.32% OK EBITDAr 696.69 584.98 556.12 635.88 ↑ Adj. ROC (EBITr / adj Capital) 0.20 0.16 0.14 0.15 OK
Operating Efficiency Inventory Days 14.63 13.14 12.48 15.18 ↓ Trade Receivables (Debtor) Days 49.64 50.47 57.12 47.43 ↑ Creditors Days 14.74 13.73 14.73 47.99 ↑ Funding Gap (Debtors+Inventory-
Creditors) 49.52 49.88 54.87 14.61 ↓ Working Capital Turnover 7.37 7.31 6.63 20.67 ↑ Fixed Asset Turnover (Sales / Fixed
Item Jun-15 Jun-16 Jun-17 Jun-18 Trend Growth Formula
G = Sales Growth % - 25.00 (4.80) (7.60) ↓ R = Retained Earnings / Sales 8.55 6.09 6.08 7.82 ↑ T = Total Assets / Sales 102.23 91.26 108.57 112.82 ↑ Growth funded by RE = R / T 8.36 6.68 5.60 6.93 ↑ Profit Margin (P) 8.55 6.09 6.08 7.82 ↑ Retained Earnings (R) 100.00 100.00 100.00 100.00 ↑ Asset Turnover (A) 0.98 1.10 0.92 0.89 ↓ Asset Equity (T) - 2.38 2.43 2.14 ↓ Sustainable Growth (PRAT) - 15.88 13.57 14.80 OK
v. Financial Flexibility & Liquidity
50. Given the positive FFO over the last three years (Tk252.55 million in FY2017-18, Tk378.20 million in FY2016-17, and Tk441.81 million in FY2015-16) improvements in working capital turnover (20.67x in FY2017-18 compared to 7.31x in FY2015-16); and average cash and bank balances (as % of current liabilities) at 29.28%, PGCL's liquidity is assessed to be adequate, reflecting on company’s solid cash cushion and positive free operating cash flow.
Appendix 16 97
GAS SYSTEM LOSS REDUCTION PLAN
Table 16.1: Gas System Loss Reduction Plan
Item Required Measures Indicative Timeframe
Compliance status
1. Empowering distribution SGCs under the Gas Act with adequate provisions for all gas-related cases and disputes.
2005-2006 Complied with. Bangladesh Gas Act has been approved in 2010.
2. Forming gas courts with magistracy powers and enforcing the law against delinquent customers.
2005-2006 Complied with. TGTDCL (largest distribution company) forms mobile court to cut illegal gas connection since 2009.
3. Reducing the number of courts injunctions. - Court injunctions for disconnecting illegal gas connections have been significantly reduced.1
4. Regularizing unauthorized domestic connections and appliances.
2005-2006 Complied with. Unauthorized connections are legalized or disconnected under a stringent program.
5. Creating a permanent vigilance setup in each SGC dealing with transmission and distribution, with adequate authority and responsibility for effective monitoring and control of unaccounted-for gas.
2005-2006 Complied with. Each distribution company has vigilant team to inspect the illegal connection after certain time interval, have the authority to disconnect lines.
6. Full survey of customer facilities and record maintenance systems of all industrial and commercial customers.
2005-2006 Complied with.
7. Routine and random survey of unmetered domestic customers in both well-built and old residential areas.
2005-2006 Vigilant team from distribution companies regularly inspect connections.
8. Upgrading the existing gas sales contracts and safeguarding company interests.
2005-2006 Complied with.
9. Strengthening internal administrative disciplines and control mechanisms.
2005-2007 Complied with.
10. Isolating the metropolitan Dhaka distribution network for zone wise input-output analysis.
- Complied with. Dhaka under TGTDCL is divided into 10 zones as per area.
11. Preparing a handy but elaborate operational manual for personnel engaged in operation and maintenance jobs, and regular monitoring and review of their performance.
2006-07 Complied with.
12. Regular orientation courses and on-the-job training for reduction of system loss.