The Royal Borough of Kensington and Chelsea Surface Water Management Plan Final SWMP Report February 2014 29 3.5.4 Historic Records – Flooding Past records of surface water flooding within the study area have been provided by various stakeholders and previous studies undertaken for the study area. A breakdown of the data provided for the SWMP can be located within Figure 7 located within Appendix C. The model output shows a good correlation with the locations of the properties that experienced flooding during the 20 July 2007 event and other historic incidents, such as those in October 2006 in Notting Hill and Sloane Square Underground Stations, and the flooding of July 2007 affecting the Holland and Norland Wards. The localised areas of ponding shown by the modelling are indicative of areas which may be more susceptible to problems such as roads or risk of flooding to ground floors and basements. Some areas that suffered flooding during the 20 July 2007 were not identified. It should be noted that the properties flooded during this event would have been a result of a combination of surface water and sewer (surcharge) flooding, whereas the modelling outputs only show indicative areas of surface water flooding 3.5.5 Methodology for Assessment of Pluvial Flooding Modelling Overview In order to continue developing an understanding of the causes and consequences of surface water flooding in the study area, intermediate level hydraulic modelling has been undertaken for a range of rainfall event probabilities. The purpose of this modelling is to provide additional information where local knowledge is lacking and forms a basis for future detailed assessments in areas identified as high risk. The following sections outline key aspects of the modelling methodology applied. For a more detailed description refer to Appendix B. To facilitate the accurate identification, retrieval and review of model data a number of actions were undertaken, including: The use of a standard folder structure for all model files; A standardised naming convention that included the model name, grid size, scenario and version number; A model log was initiated at the start of the modelling process that provides a clear and concise record of model development; and The model was reviewed by a senior modeller following Capita standard Quality Assurance protocol. This review incorporated all the model files that were used in the model set-up. An integrated modelling approach (see Table 3-2) has been selected where rainfall events of known probability are applied directly to the ground surface and water is routed overland to provide an indication of potential flow paths and areas where surface water will pond during an extreme event.
Transcript
The Royal Borough of Kensington and Chelsea
Surface Water Management Plan
Final SWMP Report February 2014
29
3.5.4 Historic Records – Flooding
Past records of surface water flooding within the study area have been provided by various
stakeholders and previous studies undertaken for the study area. A breakdown of the data
provided for the SWMP can be located within Figure 7 located within Appendix C. The model
output shows a good correlation with the locations of the properties that experienced flooding
during the 20 July 2007 event and other historic incidents, such as those in October 2006 in
Notting Hill and Sloane Square Underground Stations, and the flooding of July 2007 affecting the
Holland and Norland Wards. The localised areas of ponding shown by the modelling are indicative
of areas which may be more susceptible to problems such as roads or risk of flooding to ground
floors and basements.
Some areas that suffered flooding during the 20 July 2007 were not identified. It should be noted
that the properties flooded during this event would have been a result of a combination of surface
water and sewer (surcharge) flooding, whereas the modelling outputs only show indicative areas of
surface water flooding
3.5.5 Methodology for Assessment of Pluvial Flooding
Modelling Overview
In order to continue developing an understanding of the causes and consequences of surface
water flooding in the study area, intermediate level hydraulic modelling has been undertaken for a
range of rainfall event probabilities. The purpose of this modelling is to provide additional
information where local knowledge is lacking and forms a basis for future detailed assessments in
areas identified as high risk. The following sections outline key aspects of the modelling
methodology applied. For a more detailed description refer to Appendix B.
To facilitate the accurate identification, retrieval and review of model data a number of actions
were undertaken, including:
The use of a standard folder structure for all model files;
A standardised naming convention that included the model name, grid size, scenario and
version number;
A model log was initiated at the start of the modelling process that provides a clear and
concise record of model development; and
The model was reviewed by a senior modeller following Capita standard Quality
Assurance protocol. This review incorporated all the model files that were used in the
model set-up.
An integrated modelling approach (see Table 3-2) has been selected where rainfall events of
known probability are applied directly to the ground surface and water is routed overland to provide
an indication of potential flow paths and areas where surface water will pond during an extreme
event.
The Royal Borough of Kensington and Chelsea
Surface Water Management Plan
Final SWMP Report February 2014
30
Table 3-2: Levels of pluvial modelling
Rolling Ball
Surface water flow routes are identified by topographic
analysis, most commonly in a GIS package
Direct Rainfall Rainfall is applied directly to a surface and is routed overland
to predict surface water flooding
Drainage Systems Based around models of the underground drainage systems
Integrated Approach
Representing both direct rainfall and drainage systems in an
integrated manner, or through linking different models together
dynamically
Hydraulic modelling of the pluvial and ordinary watercourses component of surface water flooding
was undertaken using TUFLOW software (Build 2012-05-AE). TUFLOW simulates water level
variations and flows for depth-averaged, unsteady two-dimensional (2D), free-surface flows and
has been used successfully for many SWMPs to capture the hydrodynamic behaviour and flow
patterns in complex urban environments.
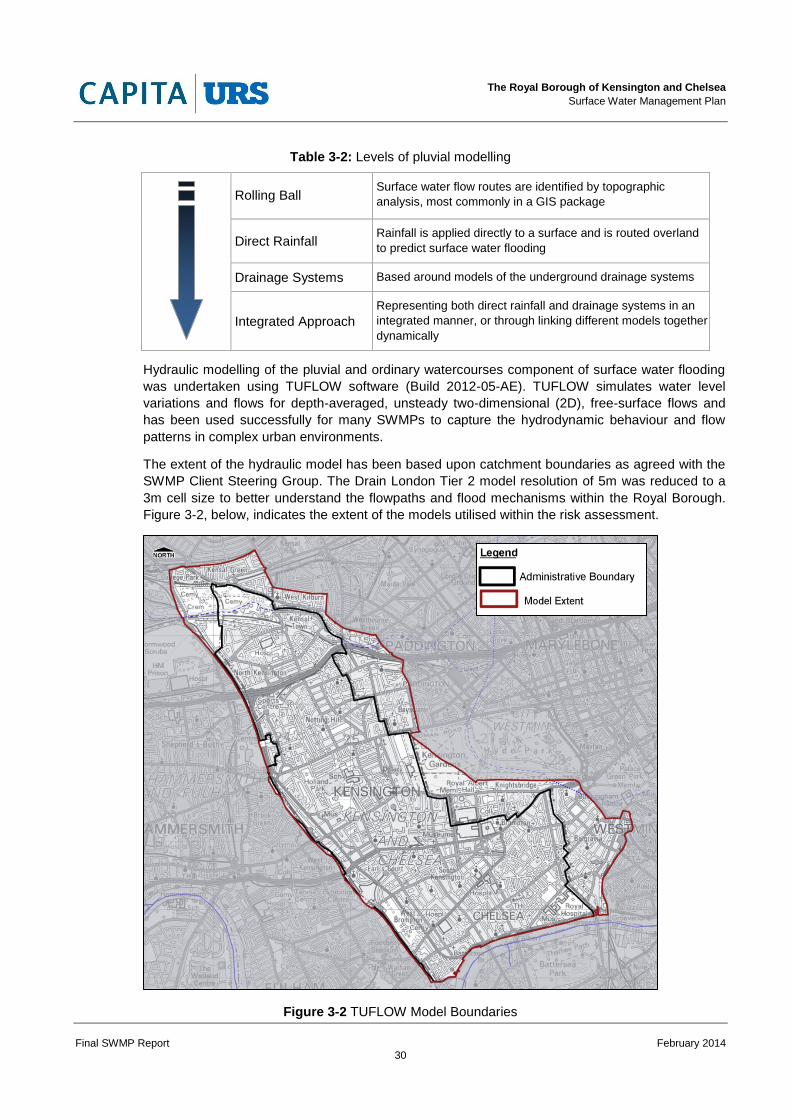
The extent of the hydraulic model has been based upon catchment boundaries as agreed with the
SWMP Client Steering Group. The Drain London Tier 2 model resolution of 5m was reduced to a
3m cell size to better understand the flowpaths and flood mechanisms within the Royal Borough.
Figure 3-2, below, indicates the extent of the models utilised within the risk assessment.
Figure 3-2 TUFLOW Model Boundaries
The Royal Borough of Kensington and Chelsea
Surface Water Management Plan
Final SWMP Report February 2014
31
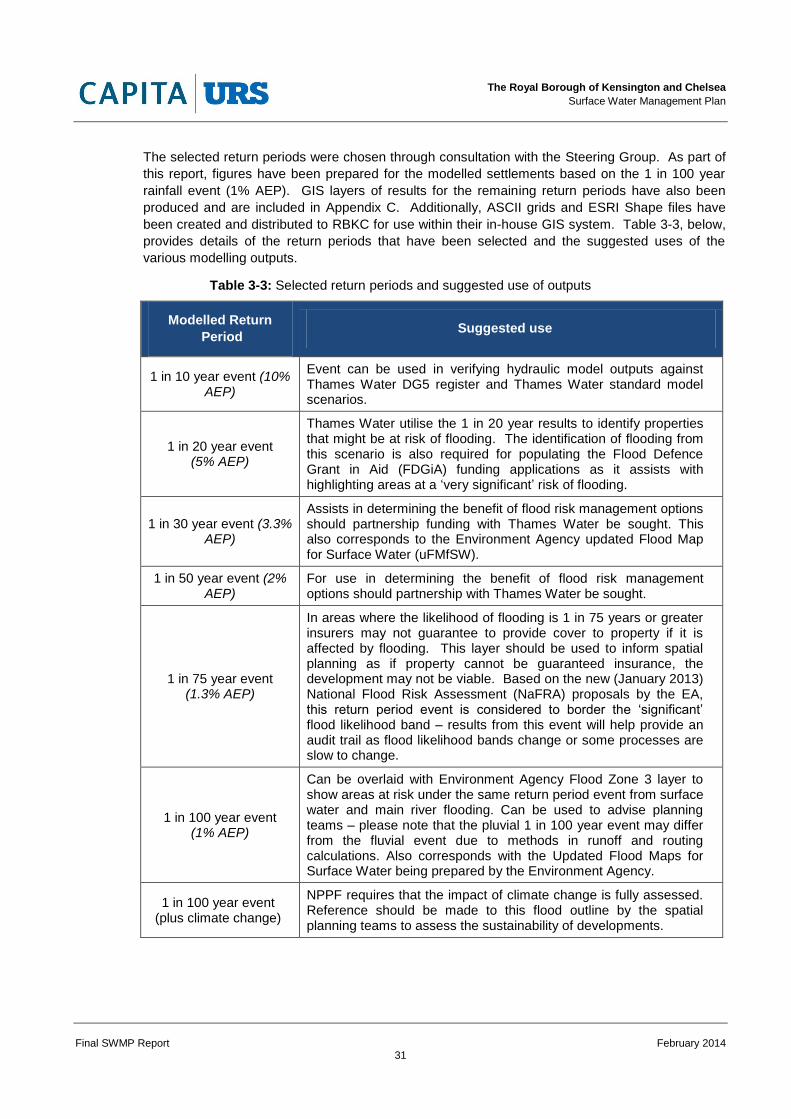
The selected return periods were chosen through consultation with the Steering Group. As part of
this report, figures have been prepared for the modelled settlements based on the 1 in 100 year
rainfall event (1% AEP). GIS layers of results for the remaining return periods have also been
produced and are included in Appendix C. Additionally, ASCII grids and ESRI Shape files have
been created and distributed to RBKC for use within their in-house GIS system. Table 3-3, below,
provides details of the return periods that have been selected and the suggested uses of the
various modelling outputs.
Table 3-3: Selected return periods and suggested use of outputs
Modelled Return
Period Suggested use
1 in 10 year event (10% AEP)
Event can be used in verifying hydraulic model outputs against Thames Water DG5 register and Thames Water standard model scenarios.
1 in 20 year event (5% AEP)
Thames Water utilise the 1 in 20 year results to identify properties that might be at risk of flooding. The identification of flooding from this scenario is also required for populating the Flood Defence Grant in Aid (FDGiA) funding applications as it assists with highlighting areas at a ‘very significant’ risk of flooding.
1 in 30 year event (3.3% AEP)
Assists in determining the benefit of flood risk management options should partnership funding with Thames Water be sought. This also corresponds to the Environment Agency updated Flood Map for Surface Water (uFMfSW).
1 in 50 year event (2% AEP)
For use in determining the benefit of flood risk management options should partnership with Thames Water be sought.
1 in 75 year event (1.3% AEP)
In areas where the likelihood of flooding is 1 in 75 years or greater insurers may not guarantee to provide cover to property if it is affected by flooding. This layer should be used to inform spatial planning as if property cannot be guaranteed insurance, the development may not be viable. Based on the new (January 2013) National Flood Risk Assessment (NaFRA) proposals by the EA, this return period event is considered to border the ‘significant’ flood likelihood band – results from this event will help provide an audit trail as flood likelihood bands change or some processes are slow to change.
1 in 100 year event (1% AEP)
Can be overlaid with Environment Agency Flood Zone 3 layer to show areas at risk under the same return period event from surface water and main river flooding. Can be used to advise planning teams – please note that the pluvial 1 in 100 year event may differ from the fluvial event due to methods in runoff and routing calculations. Also corresponds with the Updated Flood Maps for Surface Water being prepared by the Environment Agency.
1 in 100 year event (plus climate change)
NPPF requires that the impact of climate change is fully assessed. Reference should be made to this flood outline by the spatial planning teams to assess the sustainability of developments.
The Royal Borough of Kensington and Chelsea
Surface Water Management Plan
Final SWMP Report February 2014
32
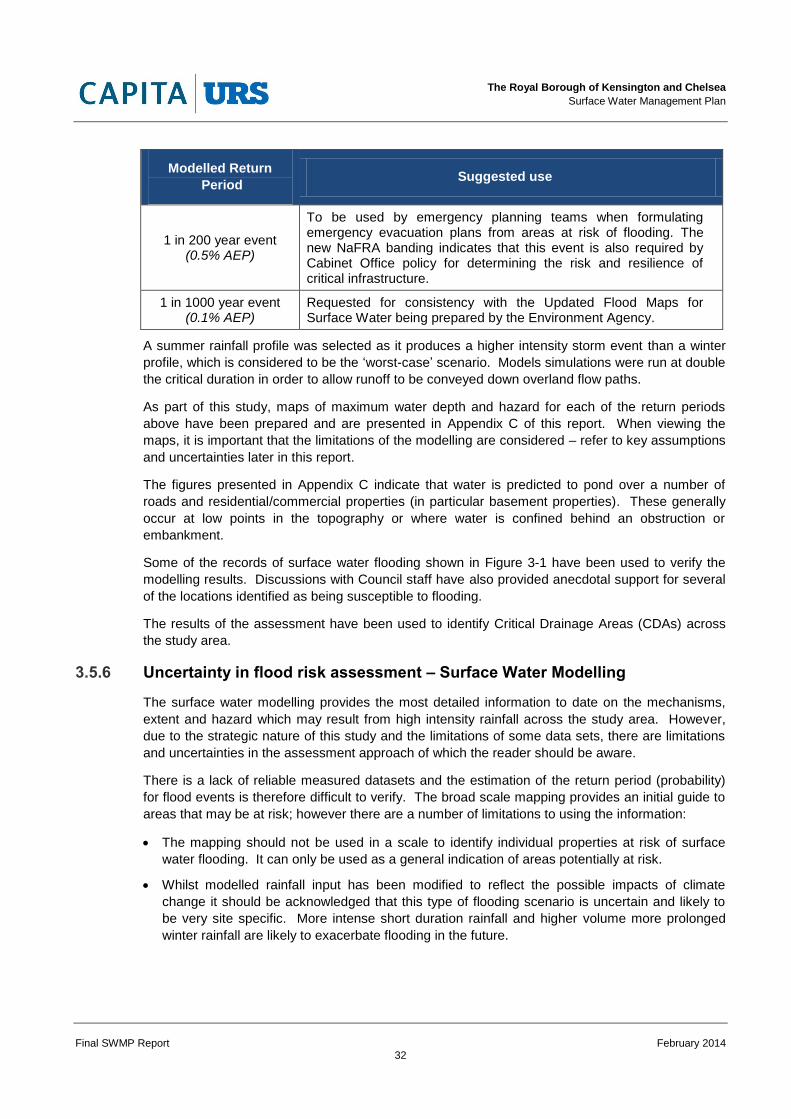
Modelled Return
Period Suggested use
1 in 200 year event (0.5% AEP)
To be used by emergency planning teams when formulating emergency evacuation plans from areas at risk of flooding. The new NaFRA banding indicates that this event is also required by Cabinet Office policy for determining the risk and resilience of critical infrastructure.
1 in 1000 year event (0.1% AEP)
Requested for consistency with the Updated Flood Maps for Surface Water being prepared by the Environment Agency.
A summer rainfall profile was selected as it produces a higher intensity storm event than a winter
profile, which is considered to be the ‘worst-case’ scenario. Models simulations were run at double
the critical duration in order to allow runoff to be conveyed down overland flow paths.
As part of this study, maps of maximum water depth and hazard for each of the return periods
above have been prepared and are presented in Appendix C of this report. When viewing the
maps, it is important that the limitations of the modelling are considered – refer to key assumptions
and uncertainties later in this report.
The figures presented in Appendix C indicate that water is predicted to pond over a number of
roads and residential/commercial properties (in particular basement properties). These generally
occur at low points in the topography or where water is confined behind an obstruction or
embankment.
Some of the records of surface water flooding shown in Figure 3-1 have been used to verify the
modelling results. Discussions with Council staff have also provided anecdotal support for several
of the locations identified as being susceptible to flooding.
The results of the assessment have been used to identify Critical Drainage Areas (CDAs) across
the study area.
3.5.6 Uncertainty in flood risk assessment – Surface Water Modelling
The surface water modelling provides the most detailed information to date on the mechanisms,
extent and hazard which may result from high intensity rainfall across the study area. However,
due to the strategic nature of this study and the limitations of some data sets, there are limitations
and uncertainties in the assessment approach of which the reader should be aware.
There is a lack of reliable measured datasets and the estimation of the return period (probability)
for flood events is therefore difficult to verify. The broad scale mapping provides an initial guide to
areas that may be at risk; however there are a number of limitations to using the information:
The mapping should not be used in a scale to identify individual properties at risk of surface
water flooding. It can only be used as a general indication of areas potentially at risk.
Whilst modelled rainfall input has been modified to reflect the possible impacts of climate
change it should be acknowledged that this type of flooding scenario is uncertain and likely to
be very site specific. More intense short duration rainfall and higher volume more prolonged
winter rainfall are likely to exacerbate flooding in the future.
The Royal Borough of Kensington and Chelsea
Surface Water Management Plan
Final SWMP Report February 2014
33
3.5.7 Key Assumptions for Surface Water Modelling
The surface water modelling methodology for the study has used the following key assumptions:
It has been assumed that land roughness varies with land type (e.g., roads, buildings, grass,
water, etc) and therefore different Manning’s roughness coefficients have been specified for
different land types to represent the effect different surfaces have on the flow of water;
The watercourses, within the study area, have been modelled at the elevations obtained when
the DTM information was gathered;
Building thresholds have been included in the model in order to represent the influence they
have on surface water flow paths. All building polygons within the model were raised by
100mm, meaning they act as barriers to flood waters in the model, up until the water depth
becomes greater than 100mm where it is assumed that the building would flood and water
would flow through the building, as would be the case in an actual flood event;
The presence of a roadside kerb can be a significant influence on the movement of flood water.
The vertical accuracy of the LiDAR often means that the distinction between the road level and
the pavement is not necessarily accurately represented. Therefore, the road features (defined
by the OS MasterMap layer) have been lowered by 125mm to define this difference;
A bespoke approach to modelling basements has been undertaken for this SWMP to reduce
the overproduction of ponding within basement properties. Appendix C provides more details on
the approach; and
Infiltration from permeable landuses (based on MasterMap) occurs across the study area
utilising the Green–Ampt Method, in which infiltration rates are based on hydraulic properties
corresponding to the underlying soil types.
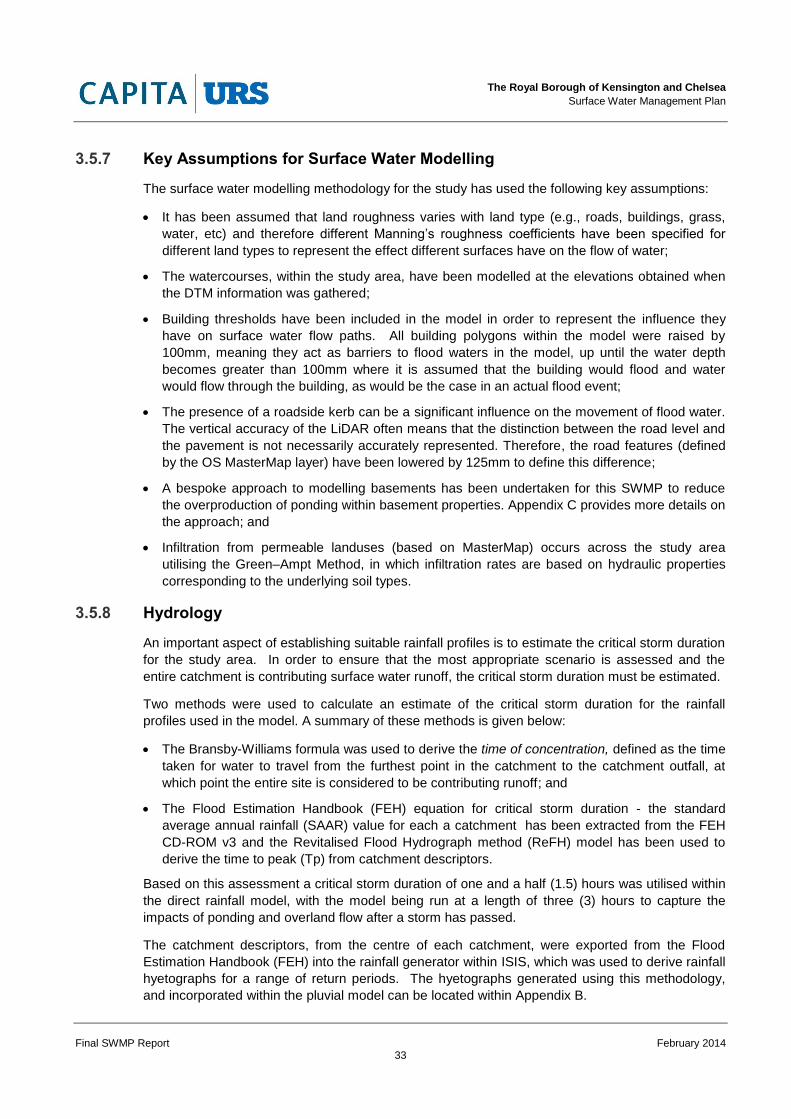
3.5.8 Hydrology
An important aspect of establishing suitable rainfall profiles is to estimate the critical storm duration
for the study area. In order to ensure that the most appropriate scenario is assessed and the
entire catchment is contributing surface water runoff, the critical storm duration must be estimated.
Two methods were used to calculate an estimate of the critical storm duration for the rainfall
profiles used in the model. A summary of these methods is given below:
The Bransby-Williams formula was used to derive the time of concentration, defined as the time
taken for water to travel from the furthest point in the catchment to the catchment outfall, at
which point the entire site is considered to be contributing runoff; and
The Flood Estimation Handbook (FEH) equation for critical storm duration - the standard
average annual rainfall (SAAR) value for each a catchment has been extracted from the FEH
CD-ROM v3 and the Revitalised Flood Hydrograph method (ReFH) model has been used to
derive the time to peak (Tp) from catchment descriptors.
Based on this assessment a critical storm duration of one and a half (1.5) hours was utilised within
the direct rainfall model, with the model being run at a length of three (3) hours to capture the
impacts of ponding and overland flow after a storm has passed.
The catchment descriptors, from the centre of each catchment, were exported from the Flood
Estimation Handbook (FEH) into the rainfall generator within ISIS, which was used to derive rainfall
hyetographs for a range of return periods. The hyetographs generated using this methodology,
and incorporated within the pluvial model can be located within Appendix B.
The Royal Borough of Kensington and Chelsea
Surface Water Management Plan
Final SWMP Report February 2014
34
3.5.9 Model Topography
The boundary of the models was based on a review of the topographical information available for
the area. Light Detecting and Ranging data (LiDAR) was used as the base information for the
model topography. LiDAR data is an airborne survey technique that uses laser to measure the
distance between an aircraft and the ground surface, recording an elevation accurate to 0.15m at
points 1m apart. The technique records elevations from all surfaces and includes features such as
buildings, trees and cars. This raw data is then processed to remove these features and provide
values of the ground surface, which is merged to create a Digital Terrain Model. LiDAR data was
available at a 1m resolution for the study area. Filtered LiDAR data (in preference to unfiltered) has
been used as the base topography to provide the model with a smoother surface to reduce the
potential instabilities in the model and areas of unexpected ponding.
An image of the DTM used to represent the topography of the study area in the pluvial model is
shown in Appendix C – the general topography of the study can be seen in Figure 1-6. The ground
elevations were represented in TUFLOW using a 3m grid. The decision to use a 3m grid is an
optimisation of the computational time required due to the size of the study area and the need for
accuracy in the model in order to resolve features in the urban environment.
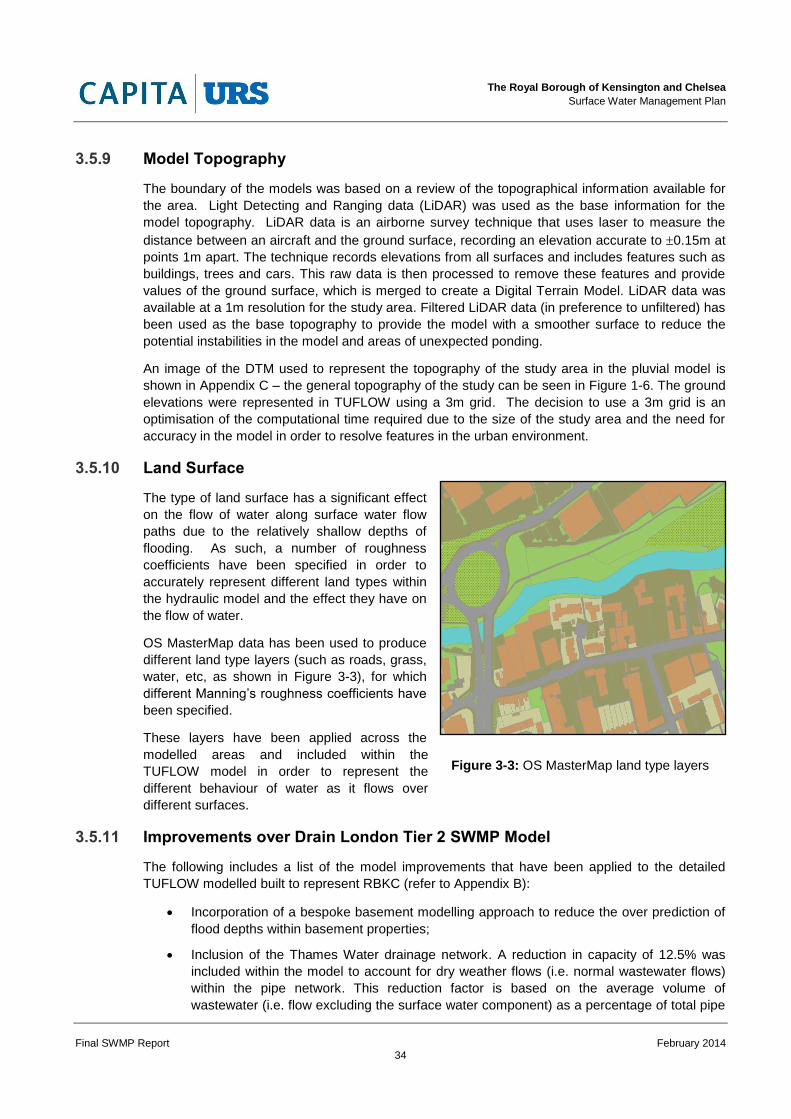
3.5.10 Land Surface
The type of land surface has a significant effect
on the flow of water along surface water flow
paths due to the relatively shallow depths of
flooding. As such, a number of roughness
coefficients have been specified in order to
accurately represent different land types within
the hydraulic model and the effect they have on
the flow of water.
OS MasterMap data has been used to produce
different land type layers (such as roads, grass,
water, etc, as shown in Figure 3-3), for which
different Manning’s roughness coefficients have
been specified.
These layers have been applied across the
modelled areas and included within the
TUFLOW model in order to represent the
different behaviour of water as it flows over
different surfaces.
3.5.11 Improvements over Drain London Tier 2 SWMP Model
The following includes a list of the model improvements that have been applied to the detailed
TUFLOW modelled built to represent RBKC (refer to Appendix B):
Incorporation of a bespoke basement modelling approach to reduce the over prediction of
flood depths within basement properties;
Inclusion of the Thames Water drainage network. A reduction in capacity of 12.5% was
included within the model to account for dry weather flows (i.e. normal wastewater flows)
within the pipe network. This reduction factor is based on the average volume of
wastewater (i.e. flow excluding the surface water component) as a percentage of total pipe
Figure 3-3: OS MasterMap land type layers
The Royal Borough of Kensington and Chelsea
Surface Water Management Plan
Final SWMP Report February 2014
35
volume, which was calculated based on Thames Water data. The reduction accounts for
the fact that a certain proportion of pipe capacity is unavailable for storage and
conveyance of surface water flows;
Inclusion of gulley assets to convey runoff into the Thames Water drainage network;
Reduction of LIDAR levels along ‘road’ assets by 125mm to reflect the influents of kerbs
on overland flowpaths.
Identification of key structures that may influence flooding/overland flowpaths within RBKC;
Infiltration from permeable landuses (based on MasterMap) occurs across the study area
utilising the Green–Ampt Method; and
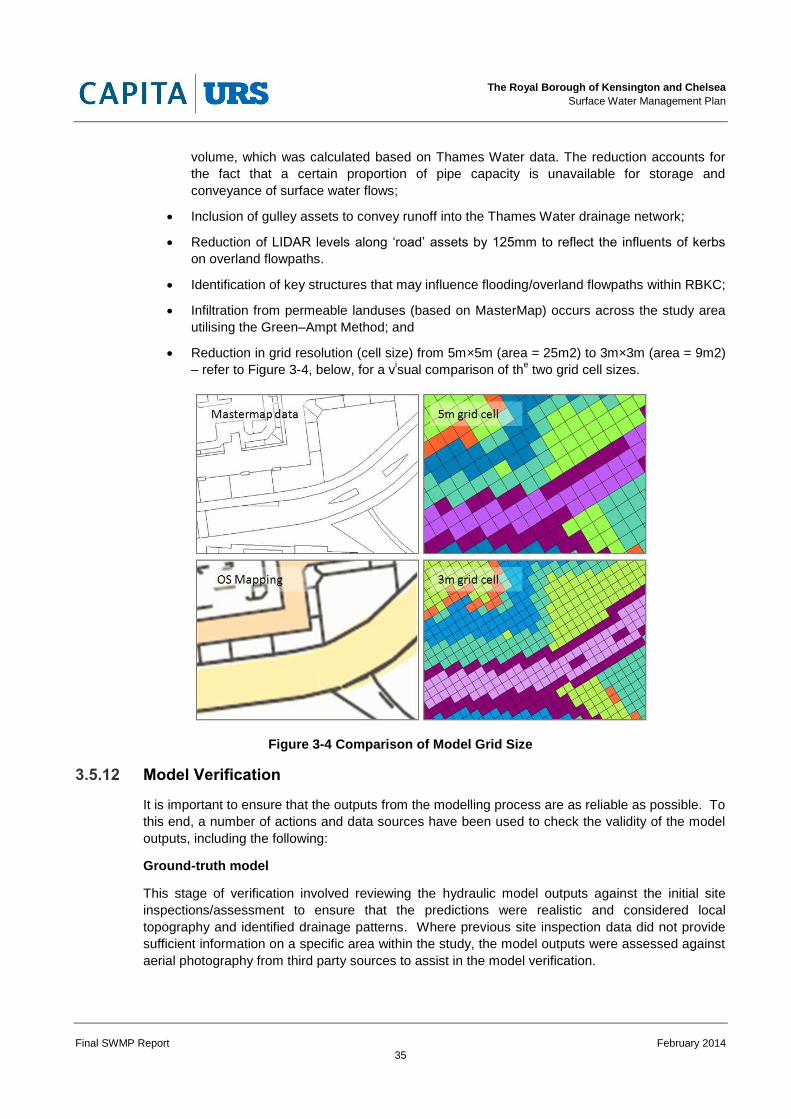
Reduction in grid resolution (cell size) from 5m×5m (area = 25m2) to 3m×3m (area = 9m2)
– refer to Figure 3-4, below, for a visual comparison of th
e two grid cell sizes.
Figure 3-4 Comparison of Model Grid Size
3.5.12 Model Verification
It is important to ensure that the outputs from the modelling process are as reliable as possible. To
this end, a number of actions and data sources have been used to check the validity of the model
outputs, including the following:
Ground-truth model
This stage of verification involved reviewing the hydraulic model outputs against the initial site
inspections/assessment to ensure that the predictions were realistic and considered local
topography and identified drainage patterns. Where previous site inspection data did not provide
sufficient information on a specific area within the study, the model outputs were assessed against
aerial photography from third party sources to assist in the model verification.
The Royal Borough of Kensington and Chelsea
Surface Water Management Plan
Final SWMP Report February 2014
36
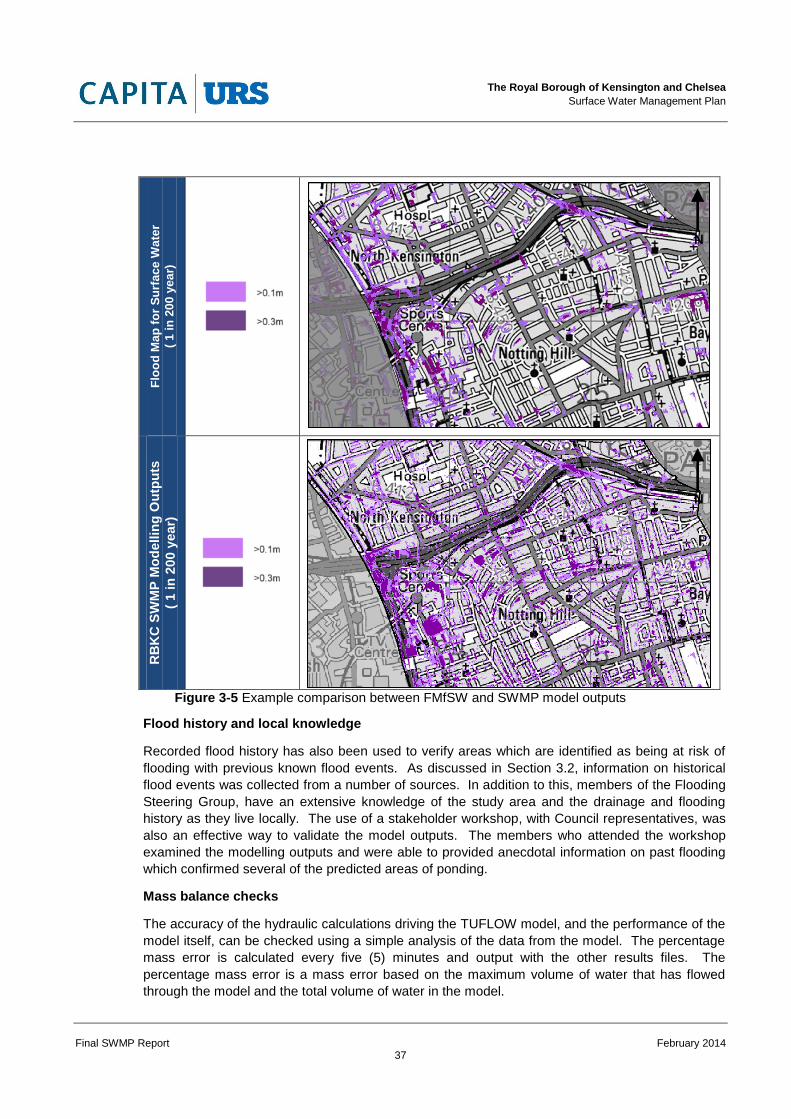
EA national surface water mapping
The Environment Agency has produced two national surface water datasets using a coarse scale
national methodology:
Areas Susceptible to Surface Water Flooding (AStSWF); and
Flood Map for Surface Water (FMfSW).
As a method of validation, the outputs from these datasets have been compared to the SWMP
modelling outputs to ensure similar flood depths and extents have been predicted. There are
slight variations, due to the more accurate methodology used in the SWMP risk assessment, but
generally the outputs with relation to ponding locations and flow paths are very similar. However,
the extent of the depths was noticed to vary, as shown in the example in Figure 3-5, overleaf.
This observation provides confidence in the final model outputs as the variation in the results is
concluded as being related to the more refined DTM (used within this study) and the catchment
specific critical durations (as the Environment Agency FMfSW maps utilised a single duration to
represent runoff throughout England) defined in this report.
Please note that the Environment Agency is preparing new surface water mapping products
coming out shortly that LLFAs will be able to utilise which improve the level of detail and
confidence in the predicted surface water flood risk. LLFAs will be able to utilise this data or more
detailed modelling outputs (such as those presented in this study) to display the predicted risk in
an area.
The Royal Borough of Kensington and Chelsea
Surface Water Management Plan
Final SWMP Report February 2014
37
F
loo
d M
ap
fo
r S
urf
ac
e W
ate
r
( 1
in
20
0 y
ea
r)
RB
KC
SW
MP
Mo
dellin
g O
utp
uts
( 1 in
20
0 y
ear)
Figure 3-5 Example comparison between FMfSW and SWMP model outputs
Flood history and local knowledge
Recorded flood history has also been used to verify areas which are identified as being at risk of
flooding with previous known flood events. As discussed in Section 3.2, information on historical
flood events was collected from a number of sources. In addition to this, members of the Flooding
Steering Group, have an extensive knowledge of the study area and the drainage and flooding
history as they live locally. The use of a stakeholder workshop, with Council representatives, was
also an effective way to validate the model outputs. The members who attended the workshop
examined the modelling outputs and were able to provided anecdotal information on past flooding
which confirmed several of the predicted areas of ponding.
Mass balance checks
The accuracy of the hydraulic calculations driving the TUFLOW model, and the performance of the
model itself, can be checked using a simple analysis of the data from the model. The percentage
mass error is calculated every five (5) minutes and output with the other results files. The
percentage mass error is a mass error based on the maximum volume of water that has flowed
through the model and the total volume of water in the model.
N
N
The Royal Borough of Kensington and Chelsea
Surface Water Management Plan
Final SWMP Report February 2014
38
It is normal for the figure to be large at the start of a simulation, particularly with steep models
using the direct rainfall approach, as the cells are rapidly becoming wet as it begins to rain but flow
through the model is relatively small. Mass balance graphs can be located within Appendix B and
show that the cumulative error of the model is within the recommended range of +/-1% throughout
the simulation for all assessed rainfall events.
3.5.13 Model Outputs
TUFLOW outputs data in a format which can be easily exported into GIS packages. As part of the
surface water modelling exercise, a series of ASCII grids and MapInfo TAB files have been created
including:
Flood depth grids;
Flow velocity grids; and
Flood hazard grids.
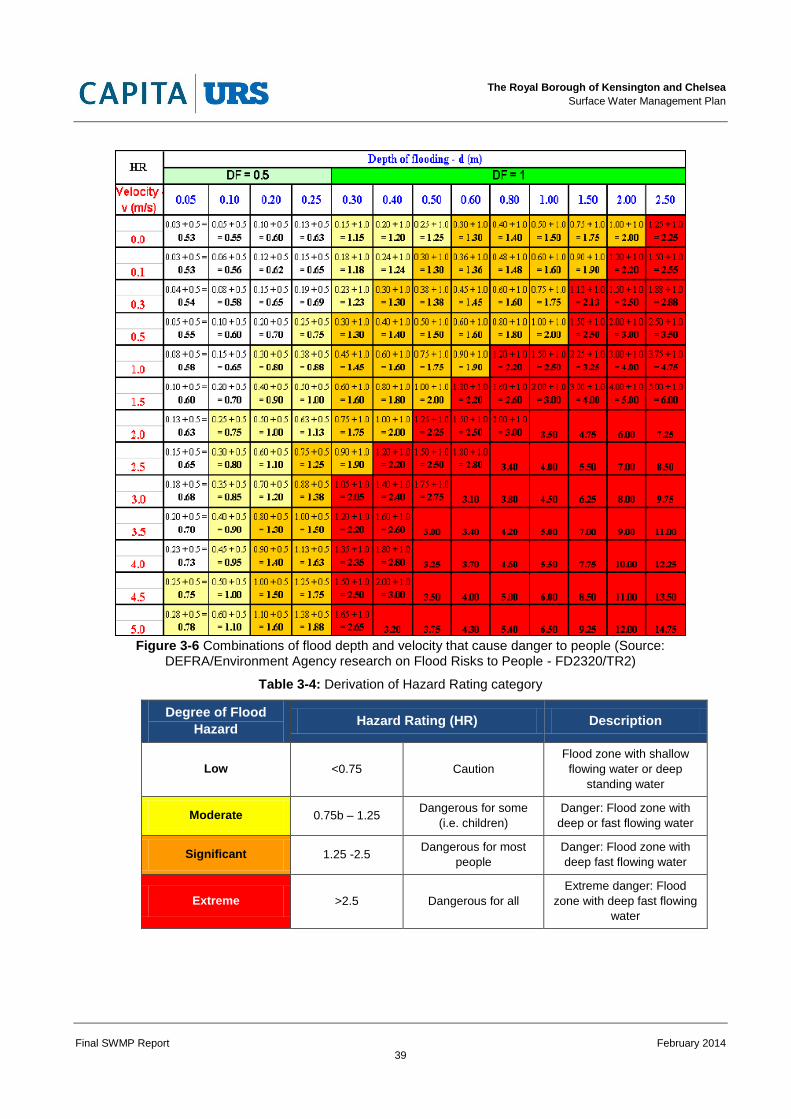
Flood hazard is a function of the flood depth, flow velocity and a debris factor (determined by the
flood depth). Each grid cell generated by TUFLOW has been assigned one of four hazard rating
categories: ‘Extreme Hazard’, ‘Significant Hazard’, ‘Moderate Hazard’ and ‘Low Hazard’.
Guidance on the depths and velocities (hazard) of floodwater that can be a risk to people is shown
within Figure 3-6 (overleaf).
The hazard rating (HR) at each point and at each time step during a flood event is calculated
according to the following formula (Defra/Environment Agency FD2320/TR1 report, 2005):
HR = d (v + 0.5) + DF
Where: HR = flood hazard rating
d = depth of flooding (m)
v = velocity of floodwater (m/s)
DF = Debris Factor, according to depth, d (see below)
Guidance within the FD2320 report recommends the use of a Debris Factor (DF) to account for the
presence of debris during a flood event in the urban environment. The Debris Factor is dependent
on the depth of flooding; for depths less than 0.25m a Debris Factor of 0.5 was used and for
depths greater than 0.25m a Debris Factor of 1.0 was used.
The maximum hazard rating for each point in the model is then converted to a flood hazard rating
category, as described in Table 3-4, below. These are typically classified as caution (very low
hazard), moderate (danger for some), significant (danger for most), extreme (danger for all).
The Royal Borough of Kensington and Chelsea
Surface Water Management Plan
Final SWMP Report February 2014
39
Figure 3-6 Combinations of flood depth and velocity that cause danger to people (Source:
DEFRA/Environment Agency research on Flood Risks to People - FD2320/TR2)
Table 3-4: Derivation of Hazard Rating category
Degree of Flood
Hazard Hazard Rating (HR) Description
Low <0.75 Caution
Flood zone with shallow
flowing water or deep
standing water
Moderate 0.75b – 1.25 Dangerous for some
(i.e. children)
Danger: Flood zone with
deep or fast flowing water
Significant 1.25 -2.5 Dangerous for most
people
Danger: Flood zone with
deep fast flowing water
Extreme >2.5 Dangerous for all
Extreme danger: Flood
zone with deep fast flowing
water
The Royal Borough of Kensington and Chelsea
Surface Water Management Plan
Final SWMP Report February 2014
40
3.6 Ordinary Watercourse Flooding
3.6.1 Description
All watercourses in England and Wales are classified as either ‘Main Rivers’ or ‘ordinary
watercourses’. The difference between the two classifications is based largely on the perceived
importance of a watercourse, and in particular its potential to cause significant and widespread
flooding. However, this is not to say watercourses classified as ordinary watercourses cannot
cause localised flooding. The Water Resources Act (1991) defines a ‘main river’ as “a watercourse
shown as such on a Main River Map”. The Environment Agency stores and maintains information
on the spatial extent of the Main River designations. The Flood and Water Management Act
(2010) defines any watercourse that is not a Main River an ordinary watercourse – including
ditches, dykes, rivers, streams and drains (as in ‘land drains’) but not public sewers.
The Environment Agency has duties and powers in relation to Main Rivers. Local Authorities, or in
some cases Internal Drainage Boards, have powers and duties in relation to ordinary
watercourses.
Flooding from ordinary watercourses occurs when water levels in the stream or river channel rise
beyond the capacity of the channel, causing floodwater to spill over the banks of the watercourse
and onto the adjacent land. The main reasons for water levels rising in ordinary watercourses are:
Intense or prolonged rainfall causing rapid run-off increasing flow in watercourses, exceeding
the capacity of the channel. This can be exacerbated by wet antecedent (the preceding time
period) conditions and where there are significant contributions of groundwater;
Constrictions/obstructions within the channel causing flood water to backup;
Blockage/obstructions of structures causing flood water to backup and overtop the banks; and
High water levels in rivers preventing discharge at the outlet of the ordinary watercourse (often
into a main river).
A review of the EA Main River dataset indicates that there are no ordinary watercourses within
RBKC that the Council is at risk of and needs to maintain as part of the FWMA.
3.7 Groundwater Flooding
3.7.1 Description
Groundwater flooding is water originating from sub-surface permeable strata which emerges from
the ground, either at a specific point (such as a spring) or over a wide diffuse location, and
inundates low lying areas. A groundwater flood event results from a rise in groundwater level
sufficient for the water table to intersect the ground surface and inundate low lying land.
The actual flooding can occur some distance from the emergence zone, with increased flows in
local streams resulting in flooding at downstream constrictions / obstructions. This can make
groundwater flooding difficult to categorise. Flooding from groundwater tends to be long in
duration, developing over weeks or months and continuing for days or weeks.
There are many mechanisms associated with groundwater flooding, which are linked to high
groundwater levels, and can be broadly classified as:
Direct contribution to channel flow;
Springs emerging at the surface;
The Royal Borough of Kensington and Chelsea
Surface Water Management Plan
Final SWMP Report February 2014
41
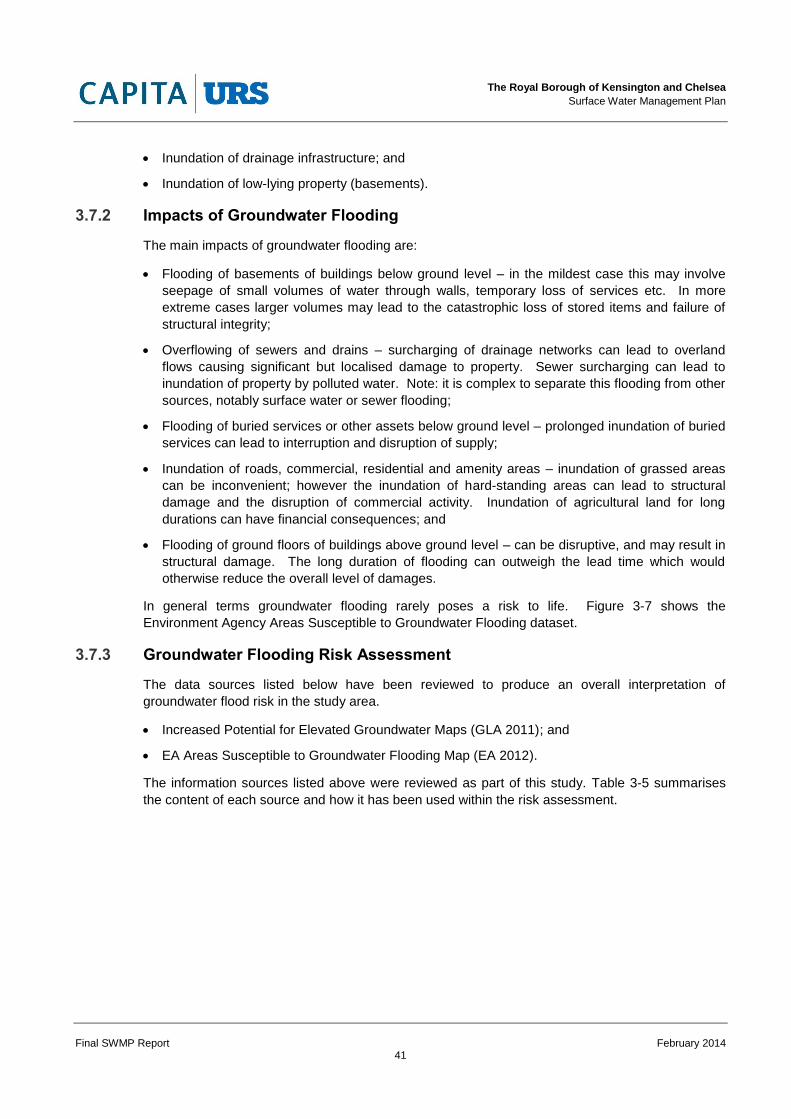
Inundation of drainage infrastructure; and
Inundation of low-lying property (basements).
3.7.2 Impacts of Groundwater Flooding
The main impacts of groundwater flooding are:
Flooding of basements of buildings below ground level – in the mildest case this may involve
seepage of small volumes of water through walls, temporary loss of services etc. In more
extreme cases larger volumes may lead to the catastrophic loss of stored items and failure of
structural integrity;
Overflowing of sewers and drains – surcharging of drainage networks can lead to overland
flows causing significant but localised damage to property. Sewer surcharging can lead to
inundation of property by polluted water. Note: it is complex to separate this flooding from other
sources, notably surface water or sewer flooding;
Flooding of buried services or other assets below ground level – prolonged inundation of buried
services can lead to interruption and disruption of supply;
Inundation of roads, commercial, residential and amenity areas – inundation of grassed areas
can be inconvenient; however the inundation of hard-standing areas can lead to structural
damage and the disruption of commercial activity. Inundation of agricultural land for long
durations can have financial consequences; and
Flooding of ground floors of buildings above ground level – can be disruptive, and may result in
structural damage. The long duration of flooding can outweigh the lead time which would
otherwise reduce the overall level of damages.
In general terms groundwater flooding rarely poses a risk to life. Figure 3-7 shows the
Environment Agency Areas Susceptible to Groundwater Flooding dataset.
3.7.3 Groundwater Flooding Risk Assessment
The data sources listed below have been reviewed to produce an overall interpretation of
groundwater flood risk in the study area.
Increased Potential for Elevated Groundwater Maps (GLA 2011); and
EA Areas Susceptible to Groundwater Flooding Map (EA 2012).
The information sources listed above were reviewed as part of this study. Table 3-5 summarises
the content of each source and how it has been used within the risk assessment.
The Royal Borough of Kensington and Chelsea
Surface Water Management Plan
Final SWMP Report February 2014
42
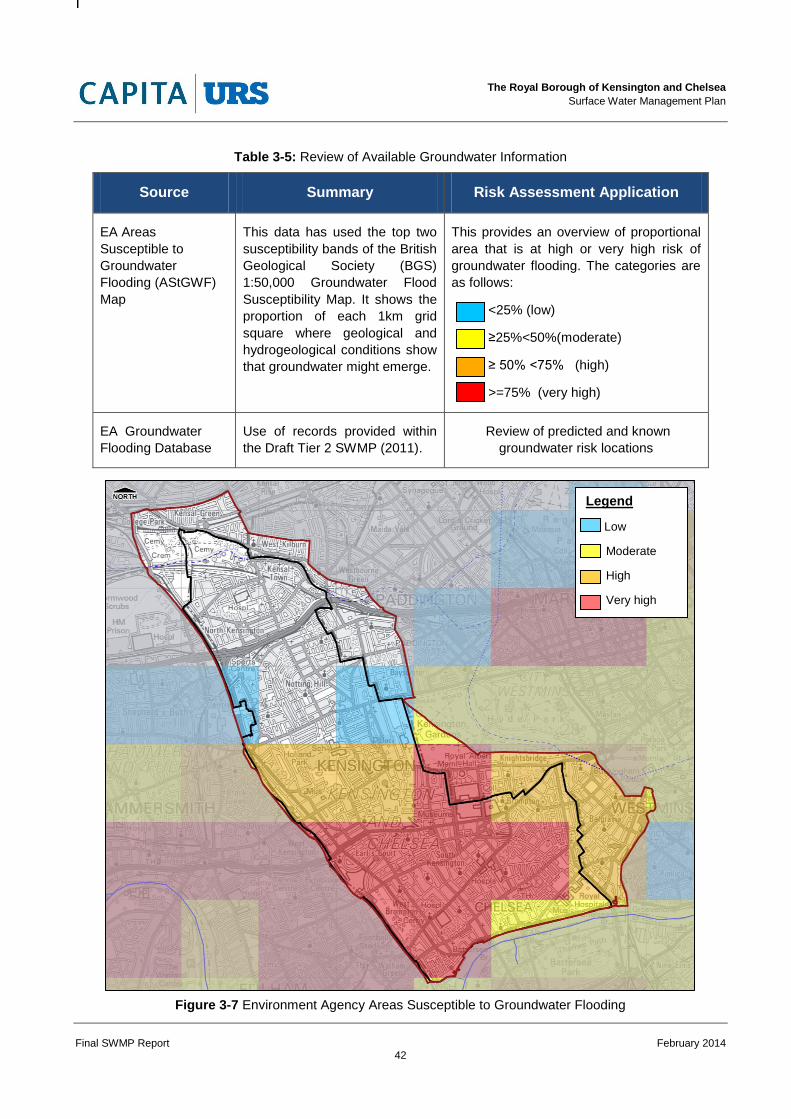
Table 3-5: Review of Available Groundwater Information
Source Summary Risk Assessment Application
EA Areas
Susceptible to
Groundwater
Flooding (AStGWF)
Map
This data has used the top two
susceptibility bands of the British
Geological Society (BGS)
1:50,000 Groundwater Flood
Susceptibility Map. It shows the
proportion of each 1km grid
square where geological and
hydrogeological conditions show
that groundwater might emerge.
This provides an overview of proportional
area that is at high or very high risk of
groundwater flooding. The categories are
as follows:
<25% (low)
≥25%<50%(moderate)
≥ 50% <75% (high)
>=75% (very high)
EA Groundwater
Flooding Database
Use of records provided within
the Draft Tier 2 SWMP (2011).
Review of predicted and known
groundwater risk locations
Figure 3-7 Environment Agency Areas Susceptible to Groundwater Flooding
Legend
Low
Moderate
High
Very high
The Royal Borough of Kensington and Chelsea
Surface Water Management Plan
Final SWMP Report February 2014
43
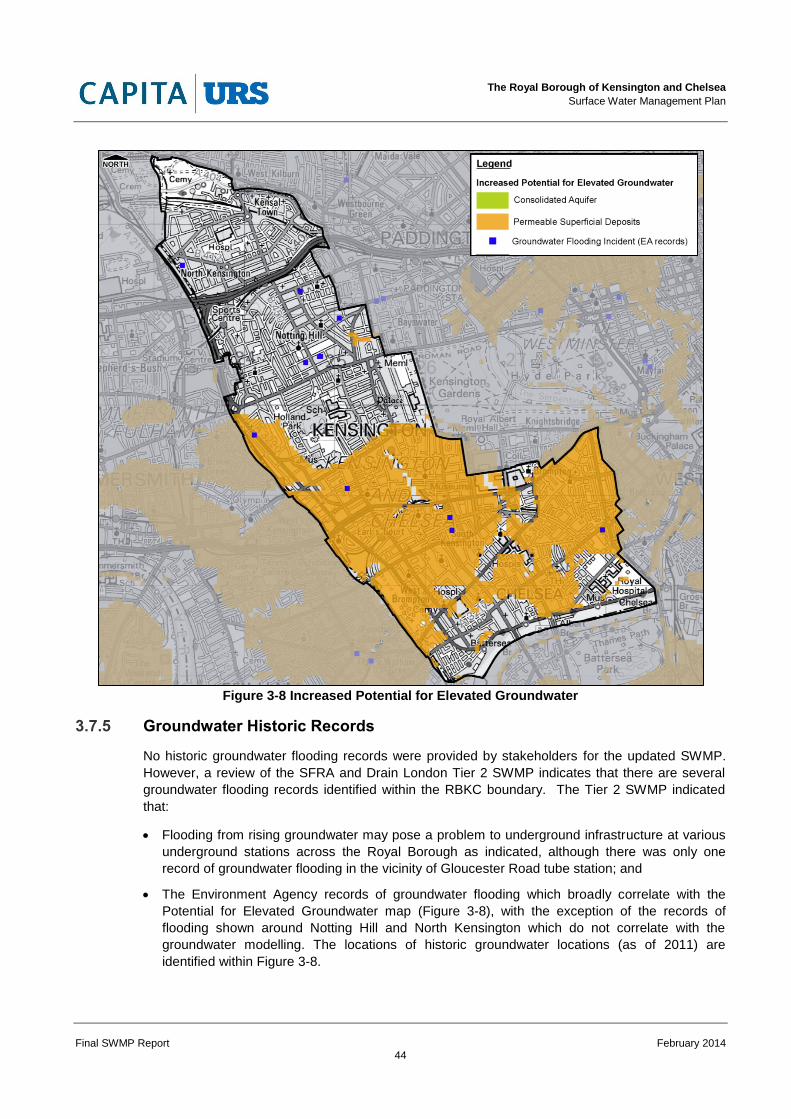
A review of the EA Areas Susceptible to Groundwater Flooding (AStGWF) map highlights that the
southern half of the study are highly susceptible to groundwater flooding. This ‘very high’ – ‘high’
area of risk correlates well with the known areas that have experienced groundwater flooding (refer
to Figure 3-8) for the groundwater flooding records provided for the Drain London Tier 2 SWMP).
The latest dataset for assessing groundwater flood risk in the study is predominantly the EA Areas
Susceptible to Groundwater Flooding map. This map uses underlying geological information to
infer groundwater flood susceptibility. If more detailed data relating to the risk of groundwater
flooding is required, it is recommended that the reader contact the British Geological Society in
order to obtain the Groundwater Flooding Susceptibility Maps. This data covers consolidated
aquifers (chalk, sandstone etc., termed ‘clearwater’ in the data attributes) and superficial deposits.
It does not take account of the chance of flooding from groundwater rebound and classify the
susceptibility into the following categories; very low, low, moderate, high and very high and is not
restricted to identifying the risk with 1km square grids.
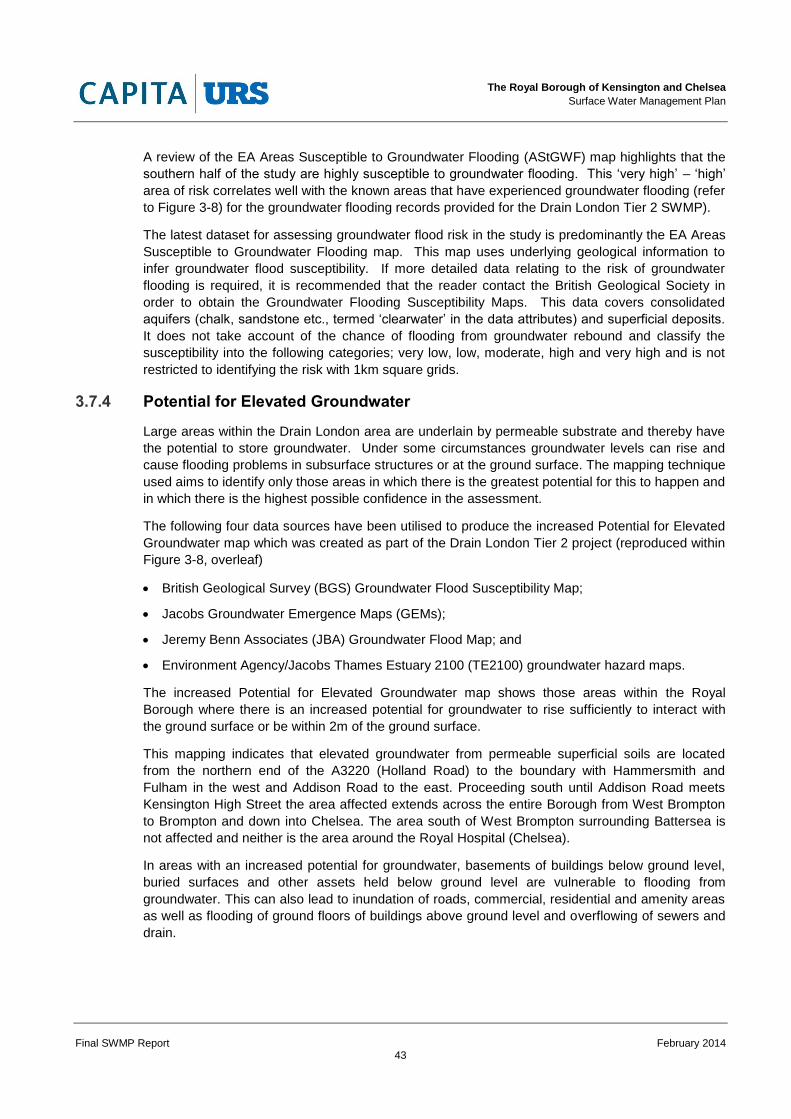
3.7.4 Potential for Elevated Groundwater
Large areas within the Drain London area are underlain by permeable substrate and thereby have
the potential to store groundwater. Under some circumstances groundwater levels can rise and
cause flooding problems in subsurface structures or at the ground surface. The mapping technique
used aims to identify only those areas in which there is the greatest potential for this to happen and
in which there is the highest possible confidence in the assessment.
The following four data sources have been utilised to produce the increased Potential for Elevated
Groundwater map which was created as part of the Drain London Tier 2 project (reproduced within
Figure 3-8, overleaf)
British Geological Survey (BGS) Groundwater Flood Susceptibility Map;
Jacobs Groundwater Emergence Maps (GEMs);
Jeremy Benn Associates (JBA) Groundwater Flood Map; and
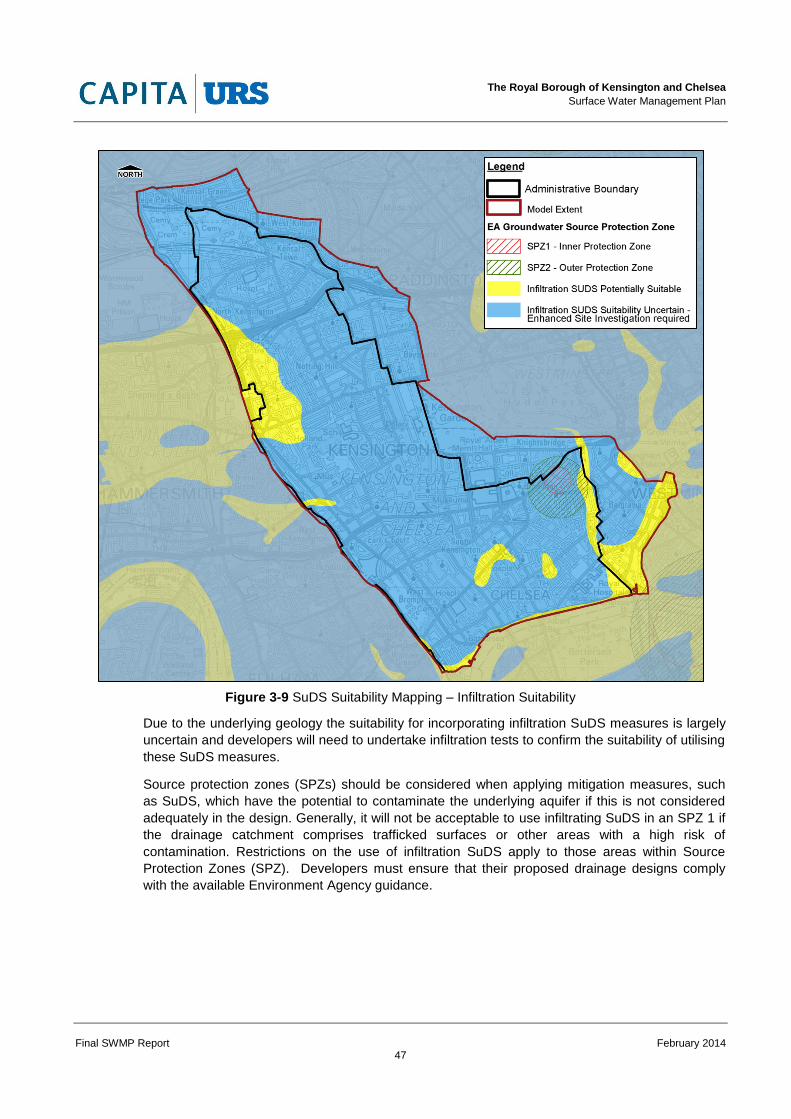
Due to the underlying geology the suitability for incorporating infiltration SuDS measures is largely
uncertain and developers will need to undertake infiltration tests to confirm the suitability of utilising
these SuDS measures.
Source protection zones (SPZs) should be considered when applying mitigation measures, such
as SuDS, which have the potential to contaminate the underlying aquifer if this is not considered
adequately in the design. Generally, it will not be acceptable to use infiltrating SuDS in an SPZ 1 if
the drainage catchment comprises trafficked surfaces or other areas with a high risk of
contamination. Restrictions on the use of infiltration SuDS apply to those areas within Source
Protection Zones (SPZ). Developers must ensure that their proposed drainage designs comply
with the available Environment Agency guidance.
The Royal Borough of Kensington and Chelsea
Surface Water Management Plan
Final SWMP Report February 2014
48
3.8 Sewer Flooding
3.8.1 Description
Flooding which occurs when the capacity of the underground drainage network is exceeded,
resulting in the surcharging of water into the nearby environment (or within internal and external
building drainage networks) or when there is an infrastructure failure. The discharge of the
drainage network into waterways and rivers can also be affected if high water levels in receiving
waters obstruct the drainage network outfalls. In the study area, the sewer network is a combined
system which receives both surface and sewer water.
3.8.2 Causes of sewer flooding
The main causes of sewer flooding are:
Lack of capacity in the sewer drainage networks– this is often a result of the original design
criteria requiring a reduced standard of protection which was acceptable at the time of
construction (Victorian era);
Lack of capacity in sewer drainage networks due to an increase in flow (such as climate
change and/or new developments connecting to the network);
Exceeded capacity in sewer drainage networks due to events larger than the system designed
event;
Loss of capacity in sewer drainage networks when a watercourse has been fully culverted and
diverted or incorporated into the formal drainage network (lost watercourses);
Lack of maintenance or failure of sewer networks which leads to a reduction in capacity and
can sometimes lead to total sewer blockage;
Failure of sewerage infrastructure such as pump stations or flap valves leading to surface
water or combined foul/surface water flooding;
Additional paved or roof areas i.e. paved driveways and conservatories connected onto
existing network without any control;
Lack of gully maintenance restricting transfer of flows into the drainage network;
Groundwater infiltration into poorly maintained or damaged pipe networks; and
Restricted outflow from the sewer systems due to high water or tide levels in receiving
watercourses (‘tide locking’).
3.8.3 Impacts of Sewer Flooding
The impact of sewer flooding is usually confined to relatively small localised areas but, because
flooding is associated with blockage or failure of the sewer network, flooding can be rapid and
unpredictable. Flood waters from this source are also often contaminated with raw sewage and
pose a health risk. The spreading of illness and disease can be a concern to the local population if
this form of flooding occurs on a regular basis.
The Royal Borough of Kensington and Chelsea
Surface Water Management Plan
Final SWMP Report February 2014
49
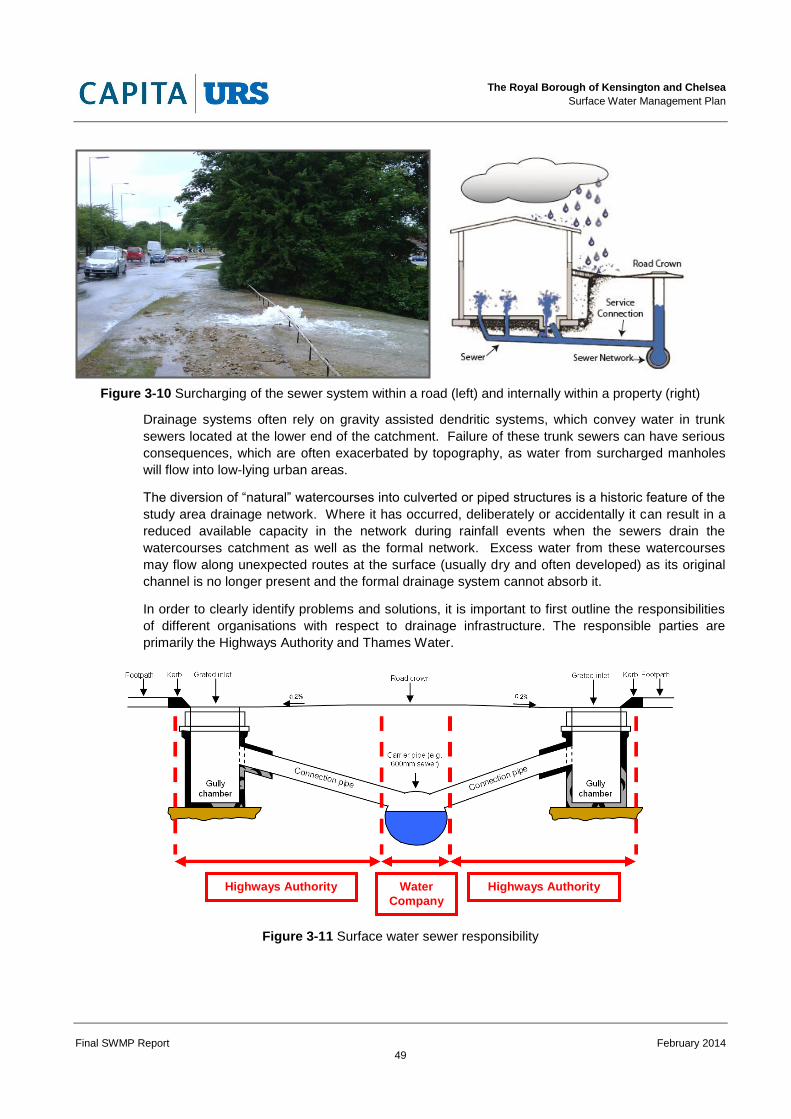
Figure 3-10 Surcharging of the sewer system within a road (left) and internally within a property (right)
Drainage systems often rely on gravity assisted dendritic systems, which convey water in trunk
sewers located at the lower end of the catchment. Failure of these trunk sewers can have serious
consequences, which are often exacerbated by topography, as water from surcharged manholes
will flow into low-lying urban areas.
The diversion of “natural” watercourses into culverted or piped structures is a historic feature of the
study area drainage network. Where it has occurred, deliberately or accidentally it can result in a
reduced available capacity in the network during rainfall events when the sewers drain the
watercourses catchment as well as the formal network. Excess water from these watercourses
may flow along unexpected routes at the surface (usually dry and often developed) as its original
channel is no longer present and the formal drainage system cannot absorb it.
In order to clearly identify problems and solutions, it is important to first outline the responsibilities
of different organisations with respect to drainage infrastructure. The responsible parties are
primarily the Highways Authority and Thames Water.
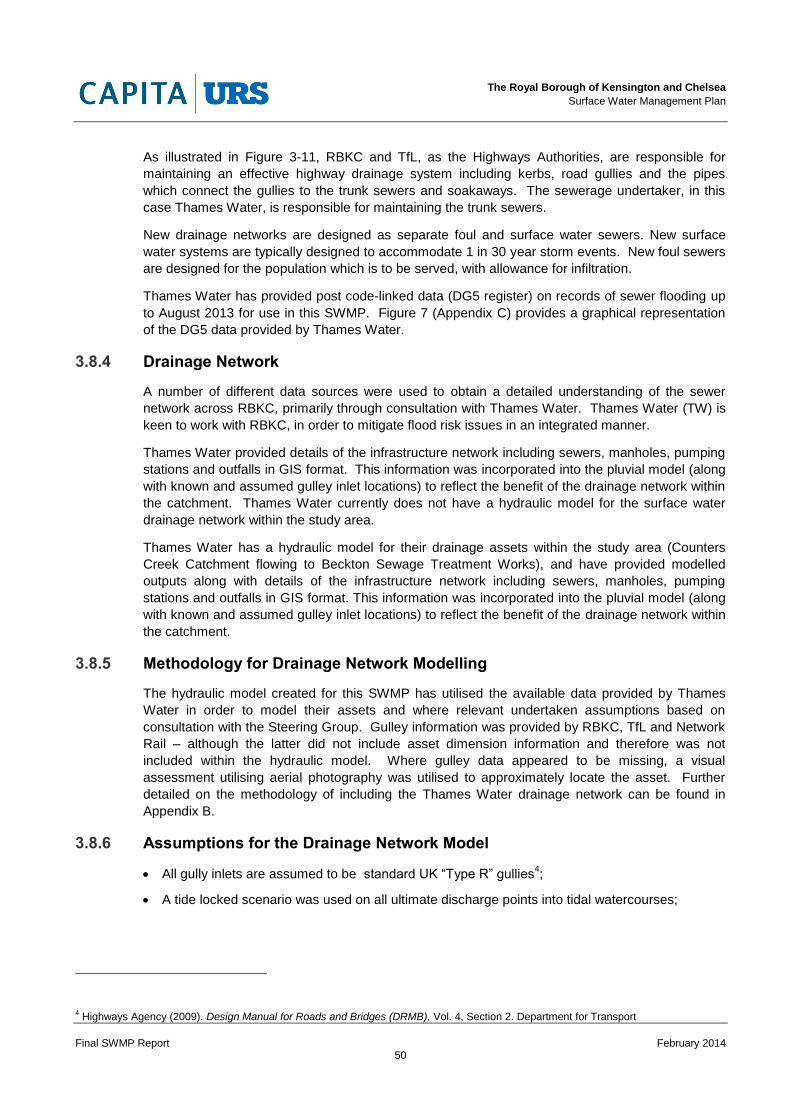
Figure 3-11 Surface water sewer responsibility
Highways Authority Water
Company
Highways Authority
The Royal Borough of Kensington and Chelsea
Surface Water Management Plan
Final SWMP Report February 2014
50
As illustrated in Figure 3-11, RBKC and TfL, as the Highways Authorities, are responsible for
maintaining an effective highway drainage system including kerbs, road gullies and the pipes
which connect the gullies to the trunk sewers and soakaways. The sewerage undertaker, in this
case Thames Water, is responsible for maintaining the trunk sewers.
New drainage networks are designed as separate foul and surface water sewers. New surface
water systems are typically designed to accommodate 1 in 30 year storm events. New foul sewers
are designed for the population which is to be served, with allowance for infiltration.
Thames Water has provided post code-linked data (DG5 register) on records of sewer flooding up
to August 2013 for use in this SWMP. Figure 7 (Appendix C) provides a graphical representation
of the DG5 data provided by Thames Water.
3.8.4 Drainage Network
A number of different data sources were used to obtain a detailed understanding of the sewer
network across RBKC, primarily through consultation with Thames Water. Thames Water (TW) is
keen to work with RBKC, in order to mitigate flood risk issues in an integrated manner.
Thames Water provided details of the infrastructure network including sewers, manholes, pumping
stations and outfalls in GIS format. This information was incorporated into the pluvial model (along
with known and assumed gulley inlet locations) to reflect the benefit of the drainage network within
the catchment. Thames Water currently does not have a hydraulic model for the surface water
drainage network within the study area.
Thames Water has a hydraulic model for their drainage assets within the study area (Counters
Creek Catchment flowing to Beckton Sewage Treatment Works), and have provided modelled
outputs along with details of the infrastructure network including sewers, manholes, pumping
stations and outfalls in GIS format. This information was incorporated into the pluvial model (along
with known and assumed gulley inlet locations) to reflect the benefit of the drainage network within
the catchment.
3.8.5 Methodology for Drainage Network Modelling
The hydraulic model created for this SWMP has utilised the available data provided by Thames
Water in order to model their assets and where relevant undertaken assumptions based on
consultation with the Steering Group. Gulley information was provided by RBKC, TfL and Network
Rail – although the latter did not include asset dimension information and therefore was not
included within the hydraulic model. Where gulley data appeared to be missing, a visual
assessment utilising aerial photography was utilised to approximately locate the asset. Further
detailed on the methodology of including the Thames Water drainage network can be found in
Appendix B.
3.8.6 Assumptions for the Drainage Network Model
All gully inlets are assumed to be standard UK “Type R” gullies4;
A tide locked scenario was used on all ultimate discharge points into tidal watercourses;
4 Highways Agency (2009). Design Manual for Roads and Bridges (DRMB), Vol. 4, Section 2. Department for Transport
The Royal Borough of Kensington and Chelsea
Surface Water Management Plan
Final SWMP Report February 2014
51
No drainage losses have been applied to the impervious surfaces in RBKC. It has been
assumed that no infiltration occurs in regions where the surfaces are impervious, for example,
paved areas such as roads and buildings;
No pumping stations have been included within the model. A ‘worst case scenario’, in which all
pumps fail, has been assumed in order to provide conservative estimates of surface water flood
depths and extents;
Where no pipe invert information was provided a standard cover level (plus pipe depth) was
included within the model schematisation;
Unknown pipes were assumed to have a 150mm diameter unless interpolation from connected
pipe inferred an alternative size; and
Unknown pipe and manhole types were assumed to be circular.
3.8.7 Uncertainties in Flood Risk Assessment – Sewer Flooding
Assessing the risk of sewer flooding over a wide area is limited by the lack of data and the quality
of data that is available. Furthermore, flood events may be a combination of surface water,
groundwater and sewer flooding.
The number of assumptions included within the drainage element of the model can impact the final
result and should be reviewed once more detailed data is available to ensure the model reflect the
actual assets included within the study area.
Use of historic data to estimate the probability of sewer flooding is the most practical approach;
however it does not take account of possible future changes due to climate change or future
development. Nor does it account for improvements to the network, including clearance of
blockages, which may have occurred.
3.8.8 Thames Water Model Verification Process
The Thames Water Counters Creek model was run for the following scenarios:
1 in 10 year 1.5 hour rainfall event;
1 in 30 year 1.5 hour rainfall event (for events greater than 1 in 30 year, it is assumed that the
sewer system is at capacity); and
2007 rainfall validation event.
Model outputs provided by Thames Water from the Counters Creek detail the flood volumes at
each of the manholes (represented as nodes). As the Counters Creek modelling is solely one-
dimensional (1D), it is not appropriate to plot the flood extents resulting from the manholes where
they are shown to surcharge. Therefore, to compare the two modelling approaches an analysis of
the spatial correlation between manholes shown to surcharge in the Counters Creek model and
the SMWP model has been undertaken.
The Counters Creek hydraulic modelling results indicate the main areas that are likely to flood from
the surcharging of sewers would be to the west and north west of Holland Park, Notting Hill and
North Kensington. Smaller clusters of potential surcharging sewers are shown around South
Kensington and Knightsbridge.
By comparison, the SWMP model shows much more widespread flooding across the study area.
An initial comparison of the results for the 2007 rainfall event model runs shows a reasonable
correlation between surcharging manholes from the Counters Creek model and the SWMP model.
The Royal Borough of Kensington and Chelsea
Surface Water Management Plan
Final SWMP Report February 2014
52
The Counters Creek model suggests there would be fewer surcharging sewers within the central
and southern part of the Royal Borough, where the SMWP model indicates there to be a high
number. This potentially indicates that the flooding shown in the SWMP model is due to the
overland surface water component of the model rather than flooding resulting from the sewer
network.
It should be noted that there are a number of large differences between the Counters Creek model
and the SWMP model that mean a direct comparison in results is not appropriate. These include:
The catchment area for the Counters Creek extends well beyond the RBKC administrative area.
Therefore the time to peak of the design storms will differ between the models;
The Counters Creek model allows for storm inflows to enter the upstream areas of RBKC:
potentially indicating greater flooding in the northern parts;
The extent of the 1D network in the SWMP models not accounting for the potential backing up
of water downstream in the sewer network;
The function of the Combined Sewer Overflows (CSOs) is not modelled in the SWMP model.
CSOs allow sewer outflows into the River Thames when pumping stations are not sufficiently
able to pump wastewater to a wastewater treatment works, either due to pump failure or
hydraulic overload. By omitting CSOs from the model, water is not ‘lost’ from the model at these
points, providing a more conservative estimate of the sewer network capacity. The influence of
this on the total flood extents will be most noticeable during the smaller return period events, as
beyond this, the capacity of the sewer system to receive flows is exceeded resulting in more
surface flooding in the upper catchment; and
The SWMP model potentially has isolated areas (‘pockets’) of surface water storage within the
2D domain resulting from depressions in the land surface that are not connected to the sewer
network.
The Counters Creek model is likely to provide a more accurate representation of sewer flooding at
lower magnitude rainfall events due to the explicit representation of the sewer network. The SMWP
model however will be a better representation of high magnitude rainfall events as the function of
the sewer network in these scenarios is less significant.
Sewer flooding records from the past 10 years have been provided by Thames Water as part of
the verification exercise. A visual comparison of the Thames Water sewer flooding records against
the flood records held by the RBKC show a strong correlation between these flood records for
most of the study area.
However the records show there to be little correlation between historic sewer flooding incidents
and modelled areas of surface water flooding. The most notable differences are apparent in the
area to the west of Holland Park and around Knightsbridge. This potentially shows that surface
water flooding within the RBKC is a result of overland flow defined by the local topography, rather
than the influence of the sewer network.
3.9 Main River Fluvial, Tidal Flooding and Other Sources
Interactions between surface water and fluvial flooding are generally a result of watercourses
unable to receive and convey excess surface water runoff. Where the watercourse in question is
defended, surface water can pond behind defences. This may be exacerbated in situations where
high water levels in the watercourse prevent discharge via flap valves through defence walls.
The Royal Borough of Kensington and Chelsea benefits from being protected from tidal and fluvial
flooding (from the River Thames) by defences that provide a high standard of protection. The
The Royal Borough of Kensington and Chelsea
Surface Water Management Plan
Final SWMP Report February 2014
53
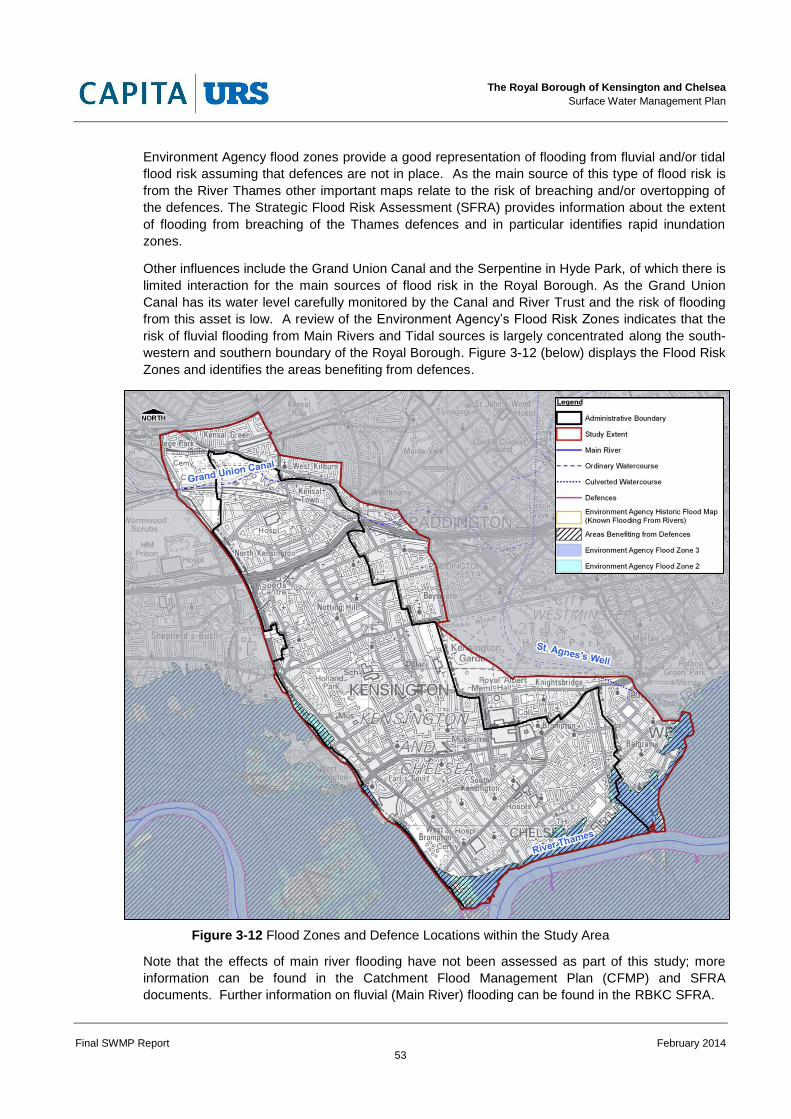
Environment Agency flood zones provide a good representation of flooding from fluvial and/or tidal
flood risk assuming that defences are not in place. As the main source of this type of flood risk is
from the River Thames other important maps relate to the risk of breaching and/or overtopping of
the defences. The Strategic Flood Risk Assessment (SFRA) provides information about the extent
of flooding from breaching of the Thames defences and in particular identifies rapid inundation
zones.
Other influences include the Grand Union Canal and the Serpentine in Hyde Park, of which there is
limited interaction for the main sources of flood risk in the Royal Borough. As the Grand Union
Canal has its water level carefully monitored by the Canal and River Trust and the risk of flooding
from this asset is low. A review of the Environment Agency’s Flood Risk Zones indicates that the
risk of fluvial flooding from Main Rivers and Tidal sources is largely concentrated along the south-
western and southern boundary of the Royal Borough. Figure 3-12 (below) displays the Flood Risk
Zones and identifies the areas benefiting from defences.
Figure 3-12 Flood Zones and Defence Locations within the Study Area
Note that the effects of main river flooding have not been assessed as part of this study; more
information can be found in the Catchment Flood Management Plan (CFMP) and SFRA
documents. Further information on fluvial (Main River) flooding can be found in the RBKC SFRA.
The Royal Borough of Kensington and Chelsea
Surface Water Management Plan
Final SWMP Report February 2014
54
4 Identification of Flood Risk Areas
4.1 Overview
The purpose of the intermediate risk assessment is to identify those parts of the study area that
are likely to require more detailed assessment to gain an improved understanding of the causes
and consequences of surface water flooding. The intermediate assessment was used to identify
areas where the flood risk is considered to be most severe; these areas are identified as Critical
Drainage Areas (CDAs). The working definition of a CDA in this context has been agreed as:
‘a discrete geographic area (usually a hydrological catchment) where multiple or
interlinked sources of flood risk cause flooding during a severe rainfall event thereby
affecting people, property or local infrastructure.’
The CDA comprises the upstream ‘contributing’ catchment, the influencing drainage catchments,
surface water catchments and, where appropriate, a downstream area if this can have an influence
on CDA. They are typically located within Flood Zone 1 but should not be excluded from other
Flood Zones if a clear surface water (outside of other influences) flood risk is present. In spatially
defining a CDA, the following should be taken into account:
Flood depth and extent – CDAs should be defined by looking at areas within the study area
which are predicted to suffer from deep levels of surface water flooding;
Surface water flow paths and velocities – Overland flow paths and velocities should also be
considered when defining CDAs;
Flood hazard – a function of flood depth and velocity, the flood hazard ratings across the
modelled study area should also be used to define CDAs;
Potential impact on people, properties and critical infrastructure – including residential
properties, main roads (access to hospitals or evacuation routes), rail routes, rail stations,
hospitals and schools;
Groundwater flood risk – based on groundwater assessment and the Environment Agency
AStGWF dataset identifying areas most susceptible to groundwater flooding;
Sewer capacity issues – based on sewer flooding assessment and information obtained from
Thames Water and their sewer modelling consultants;
Significant underground linkages – including underpasses, tunnels, large diameter pipelines
(surface water, sewer or combined) or culverted rivers;
Cross boundary linkages – CDAs should not be curtailed by political or administrative
boundaries;
Historic flooding – areas known to have previously flooded during a surface water flood event;
Definition of area – including the hydraulic catchment contributing to the CDA and the area
available for flood mitigation options; and
Source, pathway and receptor – the source, pathway and receptor of the main flooding
mechanisms should be included within the CDA.
Where CDAs are difficult to identify, it is recommended that Local Flood Risk Zones (LFRZ) are
identified to enable further investigation to determine if they are part of a wider CDA. A LFRZ is
defined as discrete areas of flooding that do not exceed the national criteria for a ‘Flood Risk Area’
but still affect properties, businesses or infrastructure. A LFRZ is defined as the actual spatial
The Royal Borough of Kensington and Chelsea
Surface Water Management Plan
Final SWMP Report February 2014
55
extent of predicted flooding in a single location.
4.2 CDA Assessment
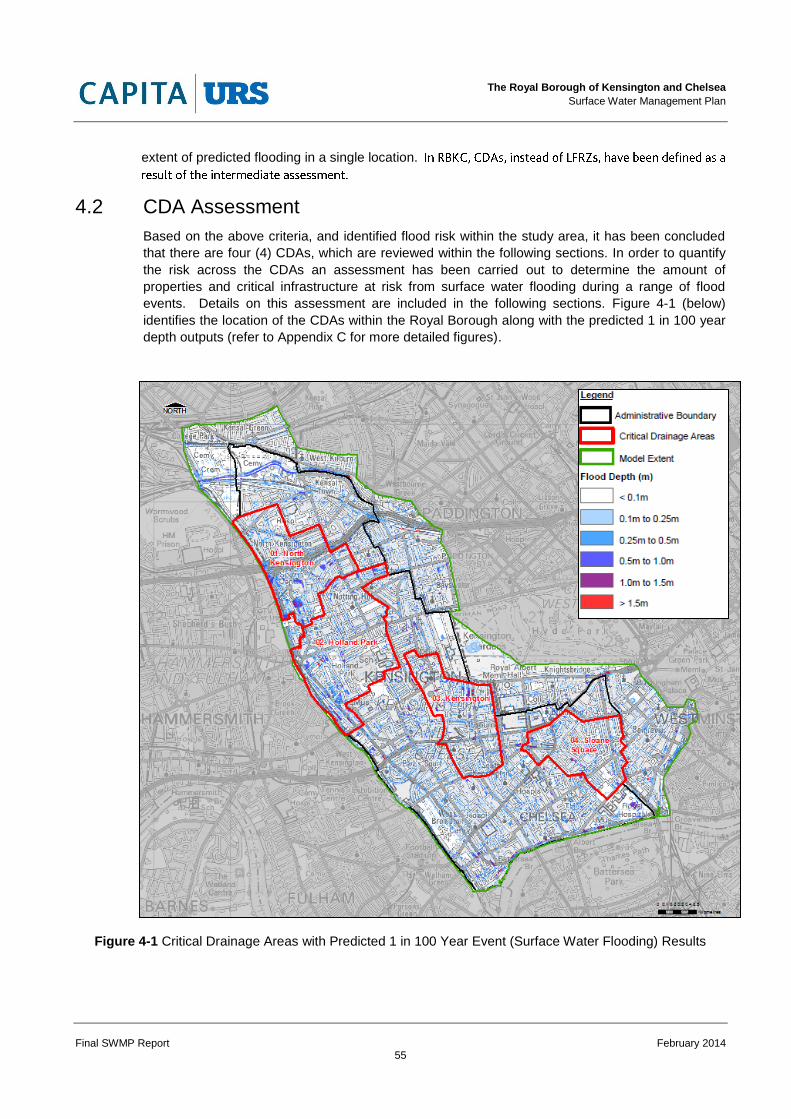
Based on the above criteria, and identified flood risk within the study area, it has been concluded
that there are four (4) CDAs, which are reviewed within the following sections. In order to quantify
the risk across the CDAs an assessment has been carried out to determine the amount of
properties and critical infrastructure at risk from surface water flooding during a range of flood
events. Details on this assessment are included in the following sections. Figure 4-1 (below)
identifies the location of the CDAs within the Royal Borough along with the predicted 1 in 100 year
depth outputs (refer to Appendix C for more detailed figures).
Figure 4-1 Critical Drainage Areas with Predicted 1 in 100 Year Event (Surface Water Flooding) Results
The Royal Borough of Kensington and Chelsea
Surface Water Management Plan
Final SWMP Report February 2014
56
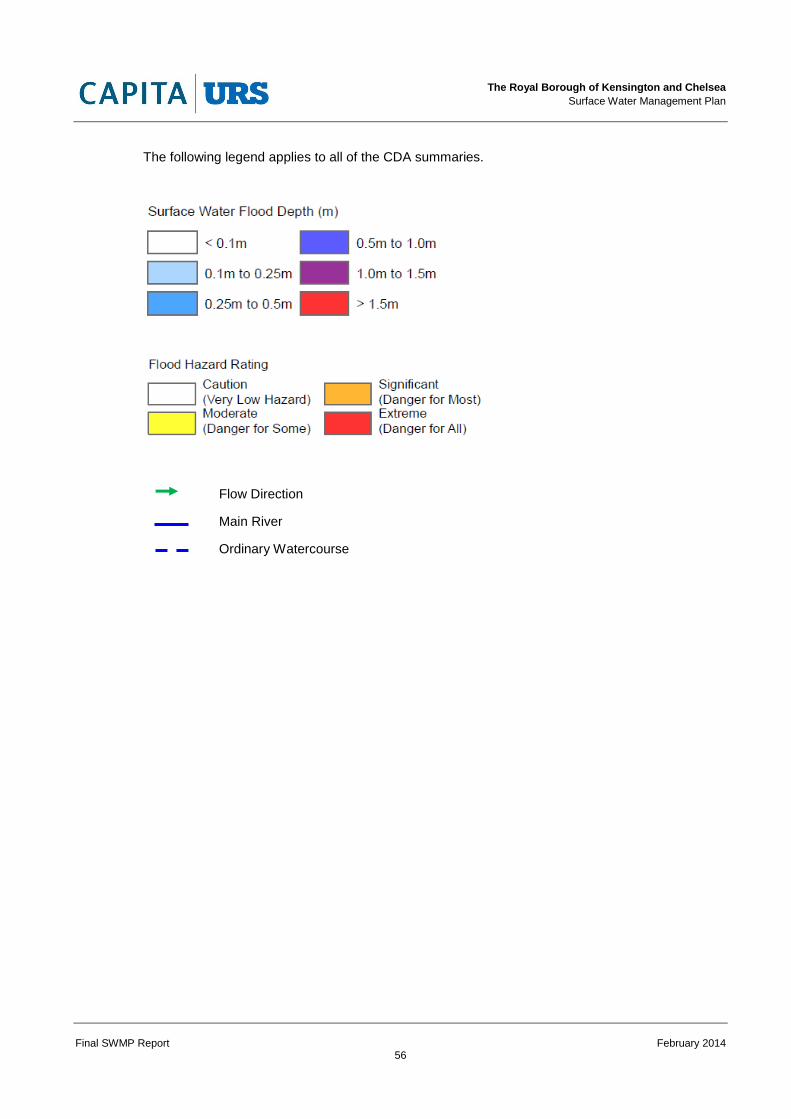
The following legend applies to all of the CDA summaries.
Flow Direction
Main River
Ordinary Watercourse
The Royal Borough of Kensington and Chelsea
Surface Water Management Plan
Final SWMP Report February 2014
57
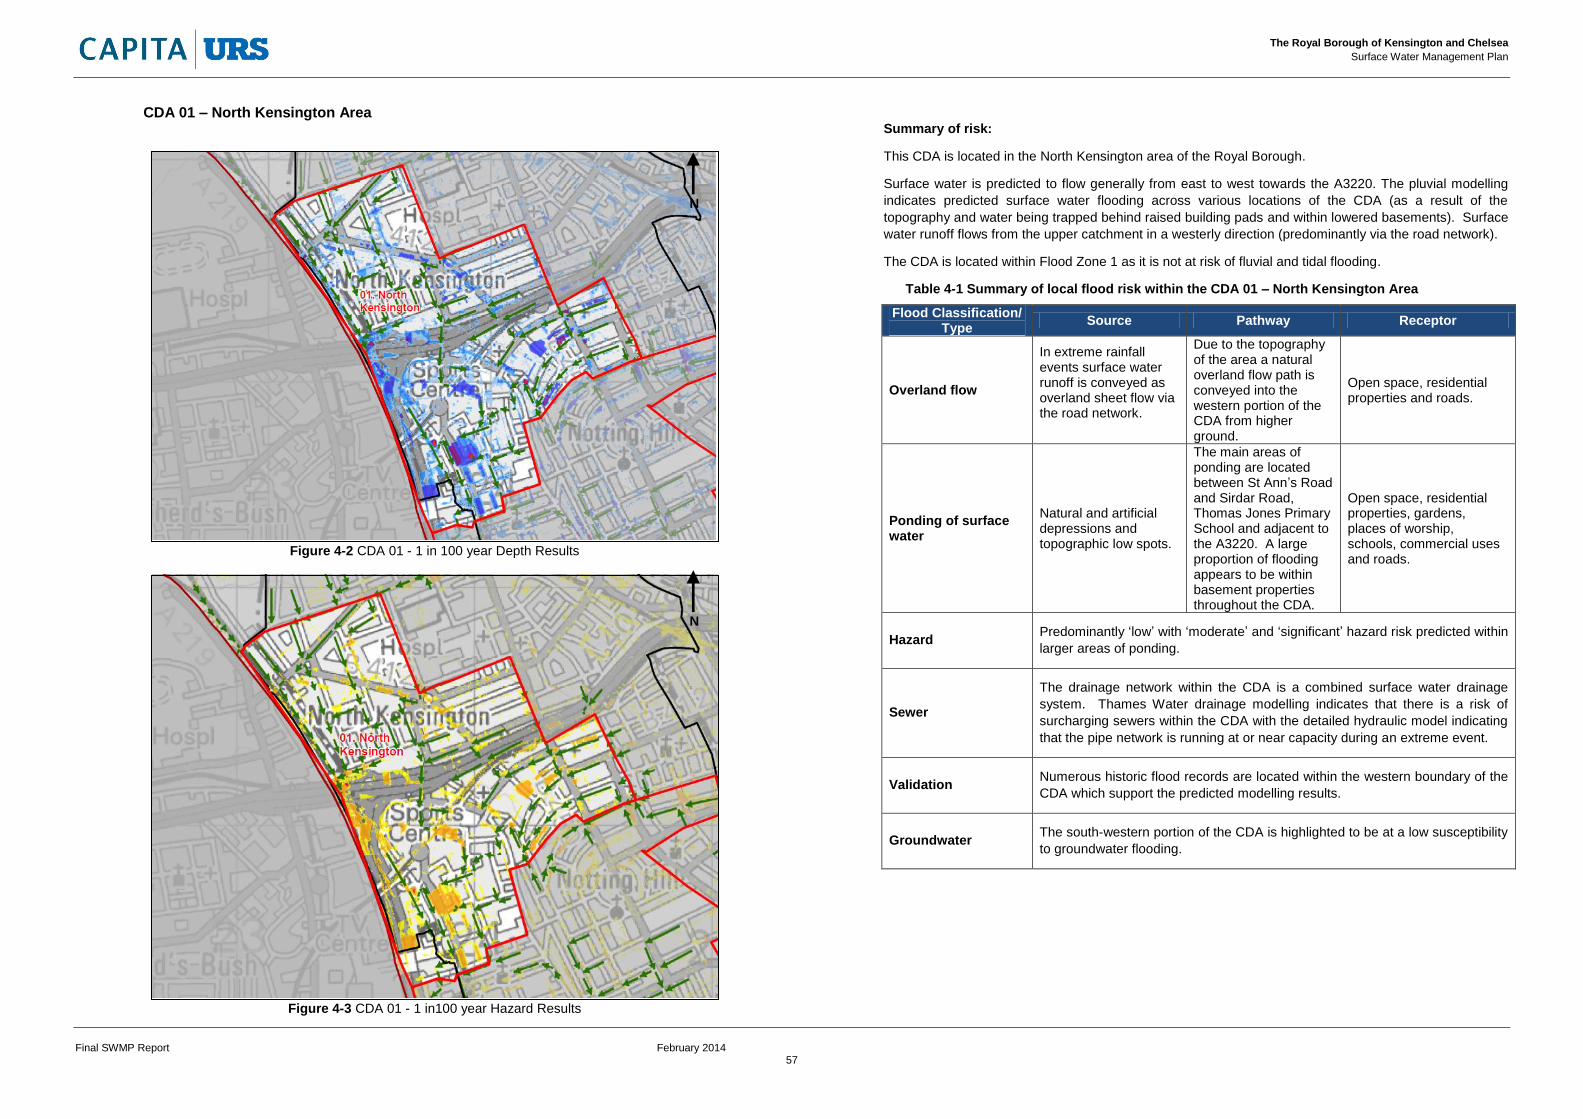
CDA 01 – North Kensington Area
Figure 4-2 CDA 01 - 1 in 100 year Depth Results
Figure 4-3 CDA 01 - 1 in100 year Hazard Results
Summary of risk:
This CDA is located in the North Kensington area of the Royal Borough.
Surface water is predicted to flow generally from east to west towards the A3220. The pluvial modelling
indicates predicted surface water flooding across various locations of the CDA (as a result of the
topography and water being trapped behind raised building pads and within lowered basements). Surface
water runoff flows from the upper catchment in a westerly direction (predominantly via the road network).
The CDA is located within Flood Zone 1 as it is not at risk of fluvial and tidal flooding.
Table 4-1 Summary of local flood risk within the CDA 01 – North Kensington Area
Flood Classification/ Type
Source Pathway Receptor
Overland flow
In extreme rainfall events surface water runoff is conveyed as overland sheet flow via the road network.
Due to the topography of the area a natural overland flow path is conveyed into the western portion of the CDA from higher ground.
Open space, residential properties and roads.
Ponding of surface water
Natural and artificial depressions and topographic low spots.
The main areas of ponding are located between St Ann’s Road and Sirdar Road, Thomas Jones Primary School and adjacent to the A3220. A large proportion of flooding appears to be within basement properties throughout the CDA.
Open space, residential properties, gardens, places of worship, schools, commercial uses and roads.
Hazard Predominantly ‘low’ with ‘moderate’ and ‘significant’ hazard risk predicted within
larger areas of ponding.
Sewer
The drainage network within the CDA is a combined surface water drainage
system. Thames Water drainage modelling indicates that there is a risk of
surcharging sewers within the CDA with the detailed hydraulic model indicating
that the pipe network is running at or near capacity during an extreme event.
Validation Numerous historic flood records are located within the western boundary of the
CDA which support the predicted modelling results.
Groundwater The south-western portion of the CDA is highlighted to be at a low susceptibility
to groundwater flooding.
N
N
The Royal Borough of Kensington and Chelsea
Surface Water Management Plan
Final SWMP Report February 2014
58
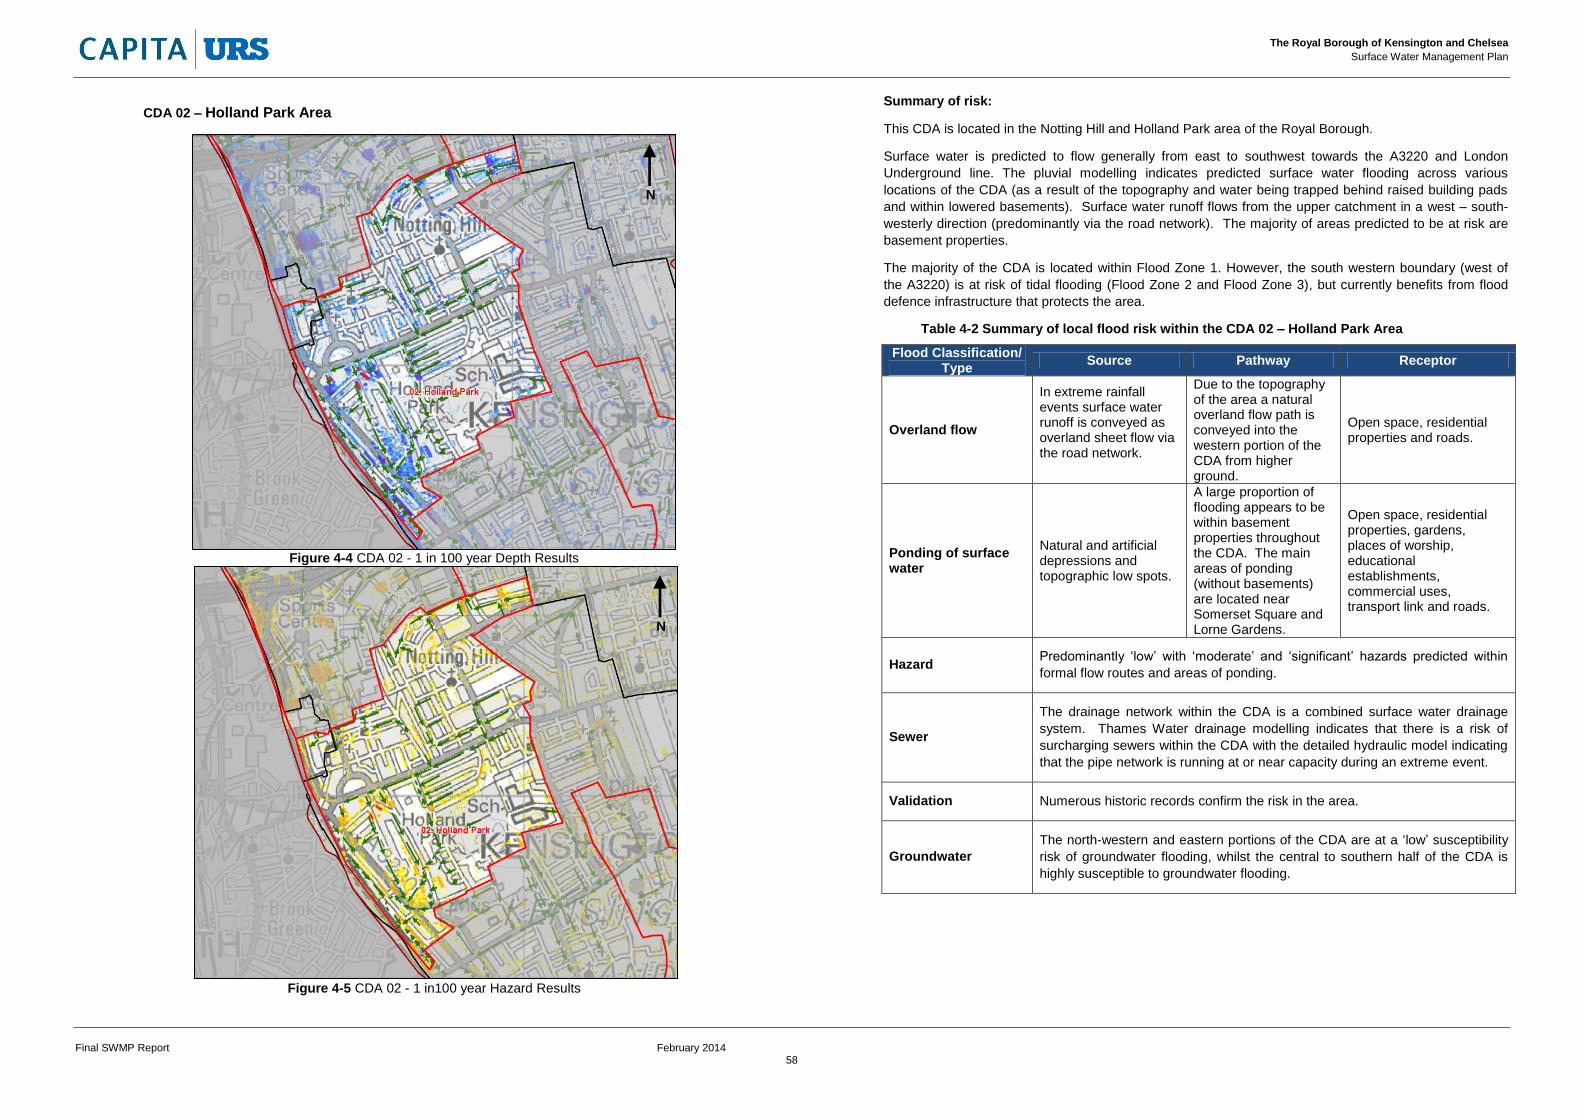
CDA 02 – Holland Park Area
Figure 4-4 CDA 02 - 1 in 100 year Depth Results
Figure 4-5 CDA 02 - 1 in100 year Hazard Results
Summary of risk:
This CDA is located in the Notting Hill and Holland Park area of the Royal Borough.
Surface water is predicted to flow generally from east to southwest towards the A3220 and London
Underground line. The pluvial modelling indicates predicted surface water flooding across various
locations of the CDA (as a result of the topography and water being trapped behind raised building pads
and within lowered basements). Surface water runoff flows from the upper catchment in a west – south-
westerly direction (predominantly via the road network). The majority of areas predicted to be at risk are
basement properties.
The majority of the CDA is located within Flood Zone 1. However, the south western boundary (west of
the A3220) is at risk of tidal flooding (Flood Zone 2 and Flood Zone 3), but currently benefits from flood
defence infrastructure that protects the area.
Table 4-2 Summary of local flood risk within the CDA 02 – Holland Park Area
Flood Classification/ Type
Source Pathway Receptor
Overland flow
In extreme rainfall events surface water runoff is conveyed as overland sheet flow via the road network.
Due to the topography of the area a natural overland flow path is conveyed into the western portion of the CDA from higher ground.
Open space, residential properties and roads.
Ponding of surface water
Natural and artificial depressions and topographic low spots.
A large proportion of flooding appears to be within basement properties throughout the CDA. The main areas of ponding (without basements) are located near Somerset Square and Lorne Gardens.
Open space, residential properties, gardens, places of worship, educational establishments, commercial uses, transport link and roads.
Hazard Predominantly ‘low’ with ‘moderate’ and ‘significant’ hazards predicted within
formal flow routes and areas of ponding.
Sewer
The drainage network within the CDA is a combined surface water drainage
system. Thames Water drainage modelling indicates that there is a risk of
surcharging sewers within the CDA with the detailed hydraulic model indicating
that the pipe network is running at or near capacity during an extreme event.
Validation Numerous historic records confirm the risk in the area.
Groundwater
The north-western and eastern portions of the CDA are at a ‘low’ susceptibility
risk of groundwater flooding, whilst the central to southern half of the CDA is
highly susceptible to groundwater flooding.
N
N
The Royal Borough of Kensington and Chelsea
Surface Water Management Plan
Final SWMP Report February 2014
59
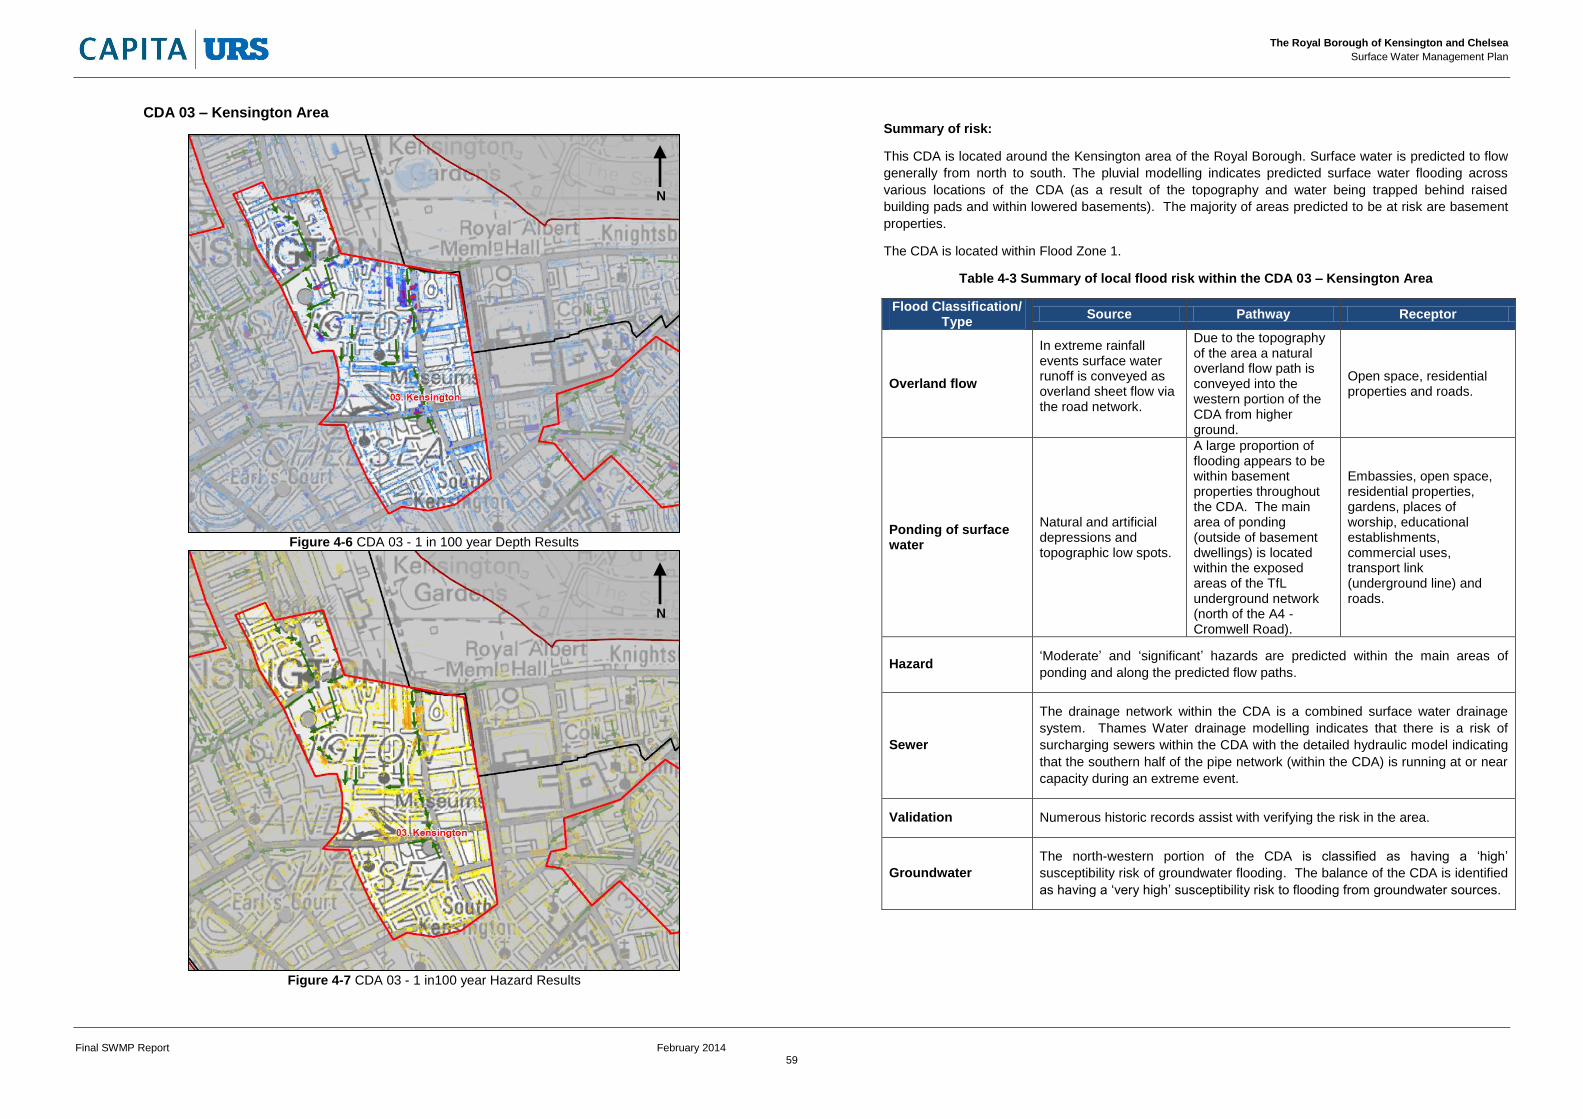
CDA 03 – Kensington Area
Figure 4-6 CDA 03 - 1 in 100 year Depth Results
Figure 4-7 CDA 03 - 1 in100 year Hazard Results
Summary of risk:
This CDA is located around the Kensington area of the Royal Borough. Surface water is predicted to flow
generally from north to south. The pluvial modelling indicates predicted surface water flooding across
various locations of the CDA (as a result of the topography and water being trapped behind raised
building pads and within lowered basements). The majority of areas predicted to be at risk are basement
properties.
The CDA is located within Flood Zone 1.
Table 4-3 Summary of local flood risk within the CDA 03 – Kensington Area
Flood Classification/ Type
Source Pathway Receptor
Overland flow
In extreme rainfall events surface water runoff is conveyed as overland sheet flow via the road network.
Due to the topography of the area a natural overland flow path is conveyed into the western portion of the CDA from higher ground.
Open space, residential properties and roads.
Ponding of surface water
Natural and artificial depressions and topographic low spots.
A large proportion of flooding appears to be within basement properties throughout the CDA. The main area of ponding (outside of basement dwellings) is located within the exposed areas of the TfL underground network (north of the A4 - Cromwell Road).
Embassies, open space, residential properties, gardens, places of worship, educational establishments, commercial uses, transport link (underground line) and roads.
Hazard ‘Moderate’ and ‘significant’ hazards are predicted within the main areas of
ponding and along the predicted flow paths.
Sewer
The drainage network within the CDA is a combined surface water drainage
system. Thames Water drainage modelling indicates that there is a risk of
surcharging sewers within the CDA with the detailed hydraulic model indicating
that the southern half of the pipe network (within the CDA) is running at or near
capacity during an extreme event.
Validation Numerous historic records assist with verifying the risk in the area.
Groundwater
The north-western portion of the CDA is classified as having a ‘high’
susceptibility risk of groundwater flooding. The balance of the CDA is identified
as having a ‘very high’ susceptibility risk to flooding from groundwater sources.
N
N
The Royal Borough of Kensington and Chelsea
Surface Water Management Plan
Final SWMP Report February 2014
60
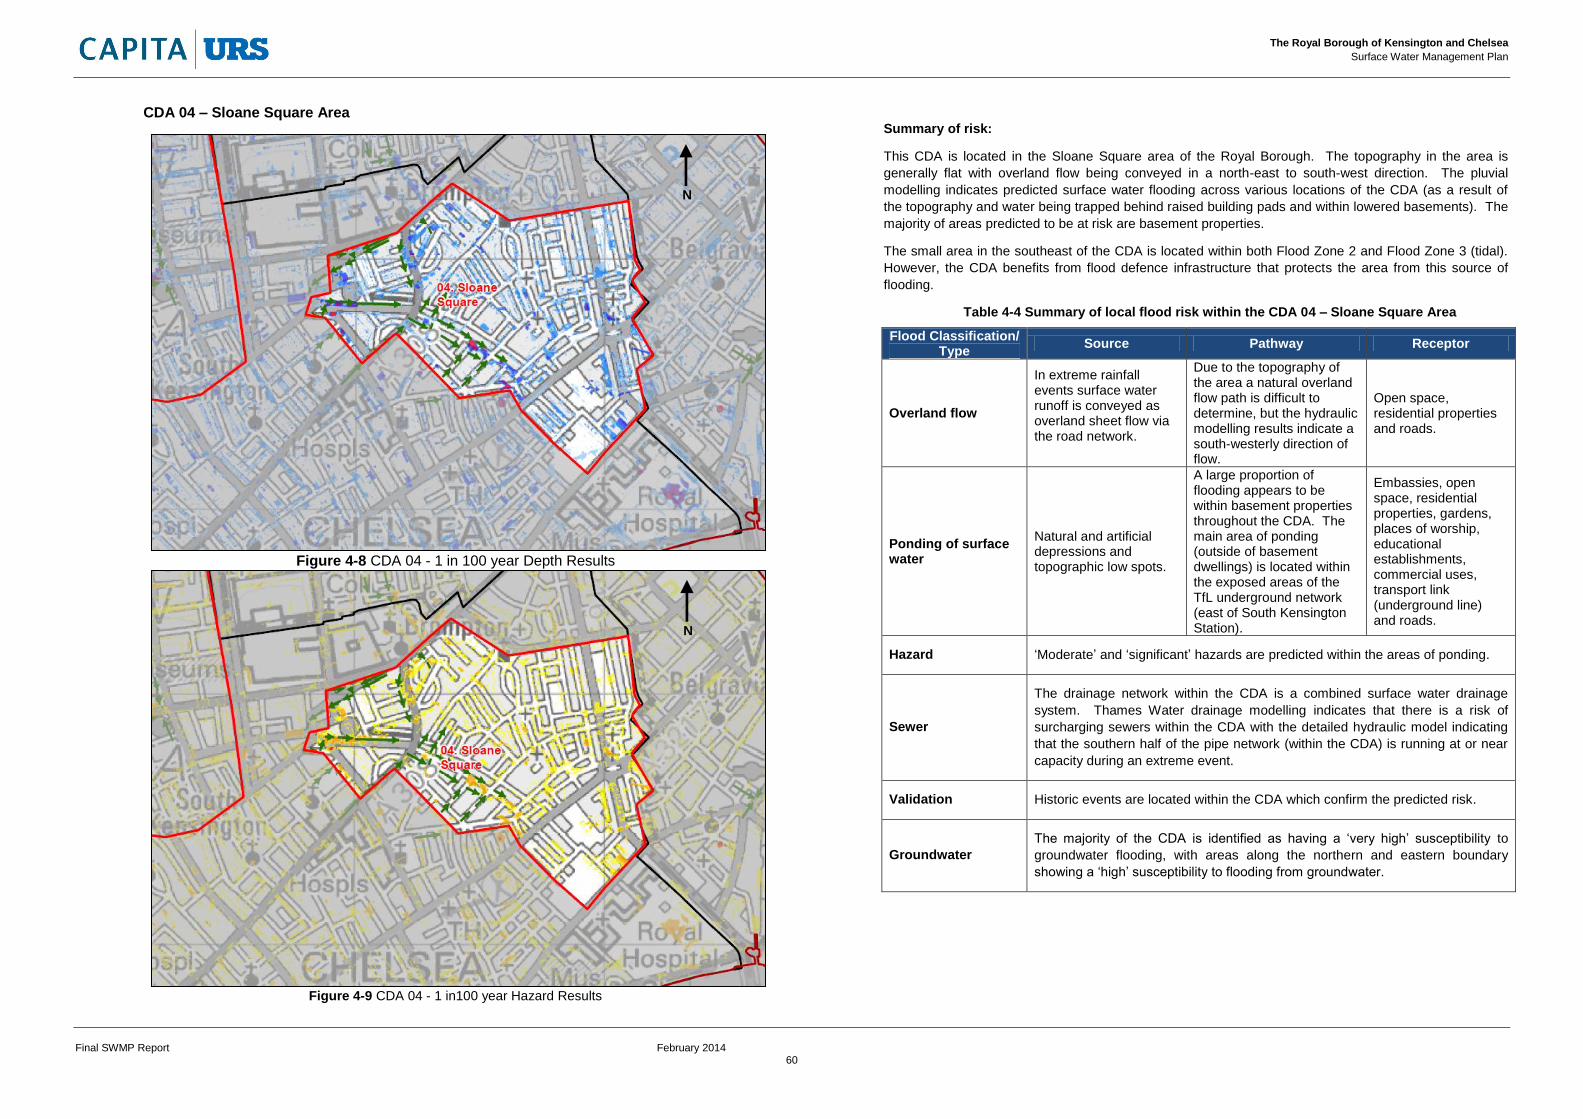
CDA 04 – Sloane Square Area
Figure 4-8 CDA 04 - 1 in 100 year Depth Results
Figure 4-9 CDA 04 - 1 in100 year Hazard Results
Summary of risk:
This CDA is located in the Sloane Square area of the Royal Borough. The topography in the area is
generally flat with overland flow being conveyed in a north-east to south-west direction. The pluvial
modelling indicates predicted surface water flooding across various locations of the CDA (as a result of
the topography and water being trapped behind raised building pads and within lowered basements). The
majority of areas predicted to be at risk are basement properties.
The small area in the southeast of the CDA is located within both Flood Zone 2 and Flood Zone 3 (tidal).
However, the CDA benefits from flood defence infrastructure that protects the area from this source of
flooding.
Table 4-4 Summary of local flood risk within the CDA 04 – Sloane Square Area
Flood Classification/ Type
Source Pathway Receptor
Overland flow
In extreme rainfall events surface water runoff is conveyed as overland sheet flow via the road network.
Due to the topography of the area a natural overland flow path is difficult to determine, but the hydraulic modelling results indicate a south-westerly direction of flow.
Open space, residential properties and roads.
Ponding of surface water
Natural and artificial depressions and topographic low spots.
A large proportion of flooding appears to be within basement properties throughout the CDA. The main area of ponding (outside of basement dwellings) is located within the exposed areas of the TfL underground network (east of South Kensington Station).
Embassies, open space, residential properties, gardens, places of worship, educational establishments, commercial uses, transport link (underground line) and roads.
Hazard ‘Moderate’ and ‘significant’ hazards are predicted within the areas of ponding.
Sewer
The drainage network within the CDA is a combined surface water drainage
system. Thames Water drainage modelling indicates that there is a risk of
surcharging sewers within the CDA with the detailed hydraulic model indicating
that the southern half of the pipe network (within the CDA) is running at or near
capacity during an extreme event.
Validation Historic events are located within the CDA which confirm the predicted risk.
Groundwater
The majority of the CDA is identified as having a ‘very high’ susceptibility to
groundwater flooding, with areas along the northern and eastern boundary
showing a ‘high’ susceptibility to flooding from groundwater.
N
N
The Royal Borough of Kensington and Chelsea
Surface Water Management Plan
Final SWMP Report February 2014
61
4.3 Flood Risk Summary
4.3.1 Overview of Flood Risk in RBKC
The results of the detailed level risk assessment, combined with site visits and a detailed
review of existing data and historical flood records, indicate that there is moderate to very
high risk to the Royal Borough from surface water, groundwater and sewer flooding5 –
particularly as rainfall intensities increase. The results indicate that the flood risk is very
widely dispersed across the study area with areas with low elevations within the catchment
and / or adjacent to obstructions to flow (raised road, rail embankments etc) being at the
greatest risk.
Surface water modelling indicates a widespread vulnerability to surface water flooding
across the Royal Borough and most of central London. This is in part due to the relatively
‘flat’ topography and ‘noisy’ digital terrain data (noise is caused in the digital terrain model
as a result of dense vegetation, high buildings, basements and differences between base
aerial photography due to development. This can cause errors to the digital ground level
and creates ‘steps’ in these areas).
In consultation with RBKC, four CDAs have been identified within the study area. These
CDAs were corroborated by modelling data (both pluvial and Thames Water sewer
modelling) and historical incidents. The CDAs were validated during the virtual site visits
utilising:
LiDAR (terrain, structures);
Detailed pluvial model results,
Environment Agency’s Flood Map for Surface Water,
Thames Water Sewer models, and
AStGWF mapping.
Two of these CDAs are connected to the Counter’s Creek sewer system which may benefit
from the proposed Thames Tideway scheme proposed by Thames Water.
In general, flooding across the study area is moderate to high in the lower order rainfall
events (such as the modelled 1 in 20 year event) and is predicted to experience greater
levels of flooding across the study area during higher order events (such as a 1 in 100 year
event). This is reflected in the analysis of risk to properties, businesses and infrastructure
that is discussed below.
4.3.2 Predicted Risk to Existing Properties & Infrastructure
Maps of predicted flood depths and extents which have been generated from the surface
water modelling results are included in Appendix C. In order to provide a quantitative
indication of potential risks, building footprints (taken from the OS MasterMap dataset) and
the National Receptor Dataset have been overlaid onto the modelling outputs to estimate
the number of properties at risk within the study area. The National Receptor Dataset is not
entirely comprehensive and may not include all known or recent properties.
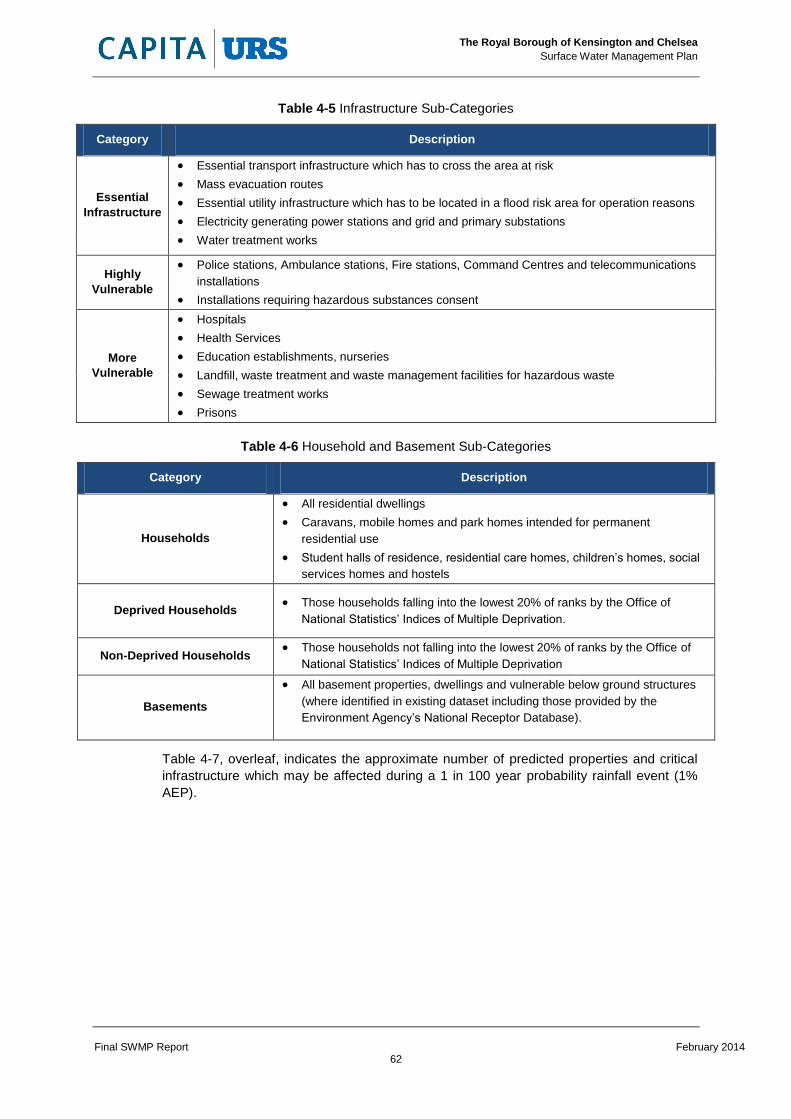
Table 4-5 and Table 4-6 identify the categories used in the assessment of flooded
properties. Please note that in addition to the standard sub-categories provided in these
tables, self-contained basements may be considered “highly vulnerable” and residential
dwellings may be considered “more vulnerable”.
5 Methodology and limitations relating to each source of flooding can be located within Section 2.
The Royal Borough of Kensington and Chelsea
Surface Water Management Plan
Final SWMP Report February 2014
62
Table 4-5 Infrastructure Sub-Categories
Category Description
Essential
Infrastructure
Essential transport infrastructure which has to cross the area at risk
Mass evacuation routes
Essential utility infrastructure which has to be located in a flood risk area for operation reasons
Electricity generating power stations and grid and primary substations
Water treatment works
Highly
Vulnerable
Police stations, Ambulance stations, Fire stations, Command Centres and telecommunications
Landfill, waste treatment and waste management facilities for hazardous waste
Sewage treatment works
Prisons
Table 4-6 Household and Basement Sub-Categories
Category Description
Households
All residential dwellings
Caravans, mobile homes and park homes intended for permanent
residential use
Student halls of residence, residential care homes, children’s homes, social
services homes and hostels
Deprived Households Those households falling into the lowest 20% of ranks by the Office of
National Statistics’ Indices of Multiple Deprivation.
Non-Deprived Households Those households not falling into the lowest 20% of ranks by the Office of
National Statistics’ Indices of Multiple Deprivation
Basements
All basement properties, dwellings and vulnerable below ground structures
(where identified in existing dataset including those provided by the
Environment Agency’s National Receptor Database).
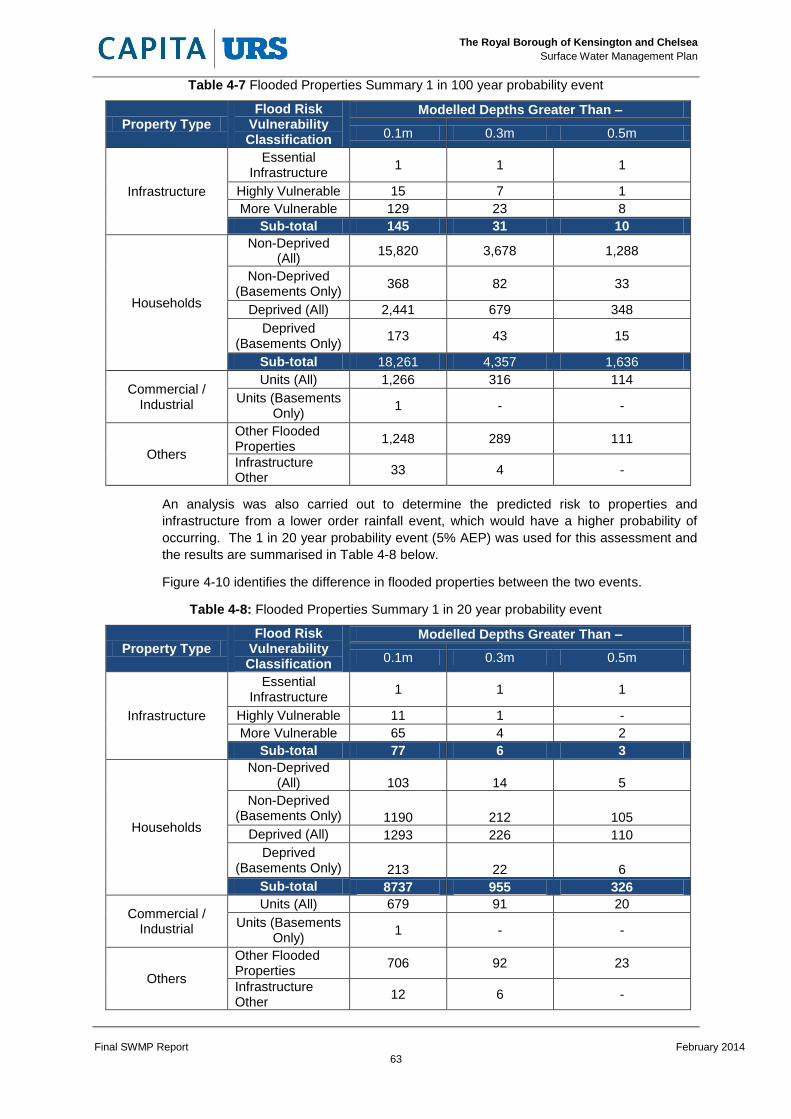
Table 4-7, overleaf, indicates the approximate number of predicted properties and critical
infrastructure which may be affected during a 1 in 100 year probability rainfall event (1%
AEP).
The Royal Borough of Kensington and Chelsea
Surface Water Management Plan
Final SWMP Report February 2014
63
Table 4-7 Flooded Properties Summary 1 in 100 year probability event
Property Type Flood Risk
Vulnerability Classification
Modelled Depths Greater Than –
0.1m 0.3m 0.5m
Infrastructure
Essential Infrastructure
1 1 1
Highly Vulnerable 15 7 1
More Vulnerable 129 23 8
Sub-total 145 31 10
Households
Non-Deprived (All)
15,820 3,678 1,288
Non-Deprived (Basements Only)
368 82 33
Deprived (All) 2,441 679 348
Deprived (Basements Only)
173 43 15
Sub-total 18,261 4,357 1,636
Commercial / Industrial
Units (All) 1,266 316 114
Units (Basements Only)
1 - -
Others
Other Flooded Properties
1,248 289 111
Infrastructure Other
33 4 -
An analysis was also carried out to determine the predicted risk to properties and
infrastructure from a lower order rainfall event, which would have a higher probability of
occurring. The 1 in 20 year probability event (5% AEP) was used for this assessment and
the results are summarised in Table 4-8 below.
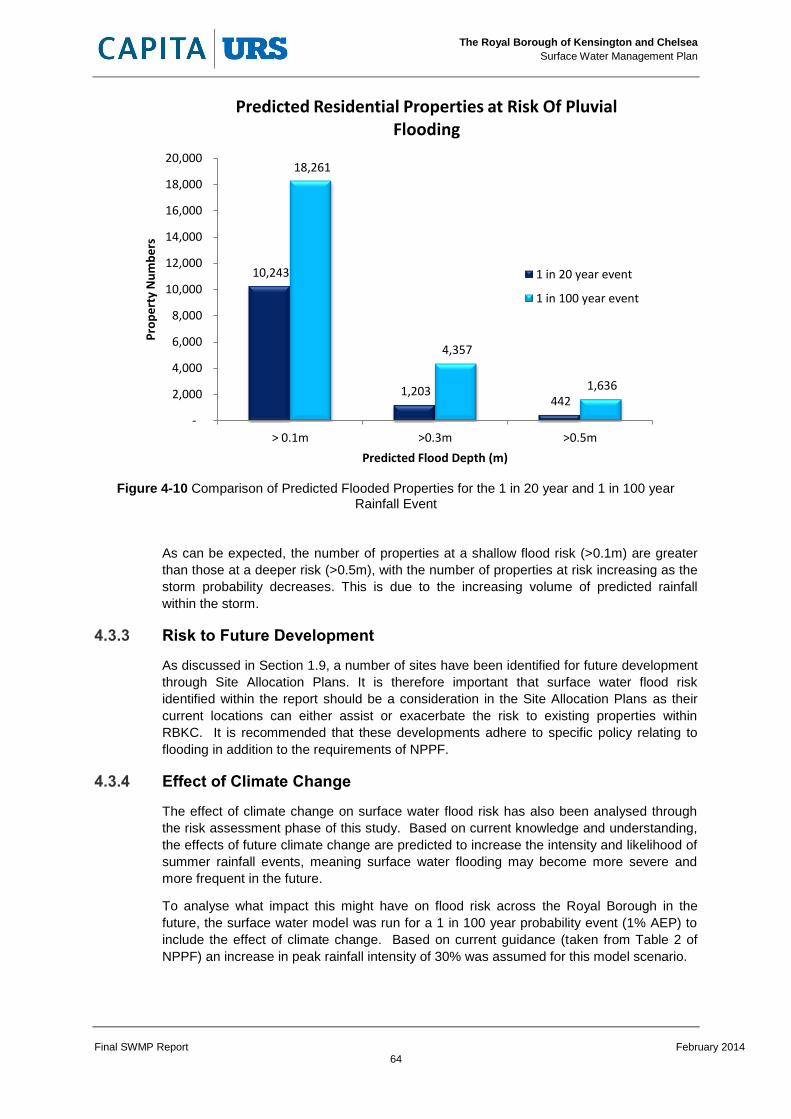
Figure 4-10 identifies the difference in flooded properties between the two events.
Table 4-8: Flooded Properties Summary 1 in 20 year probability event
Property Type Flood Risk
Vulnerability Classification
Modelled Depths Greater Than –
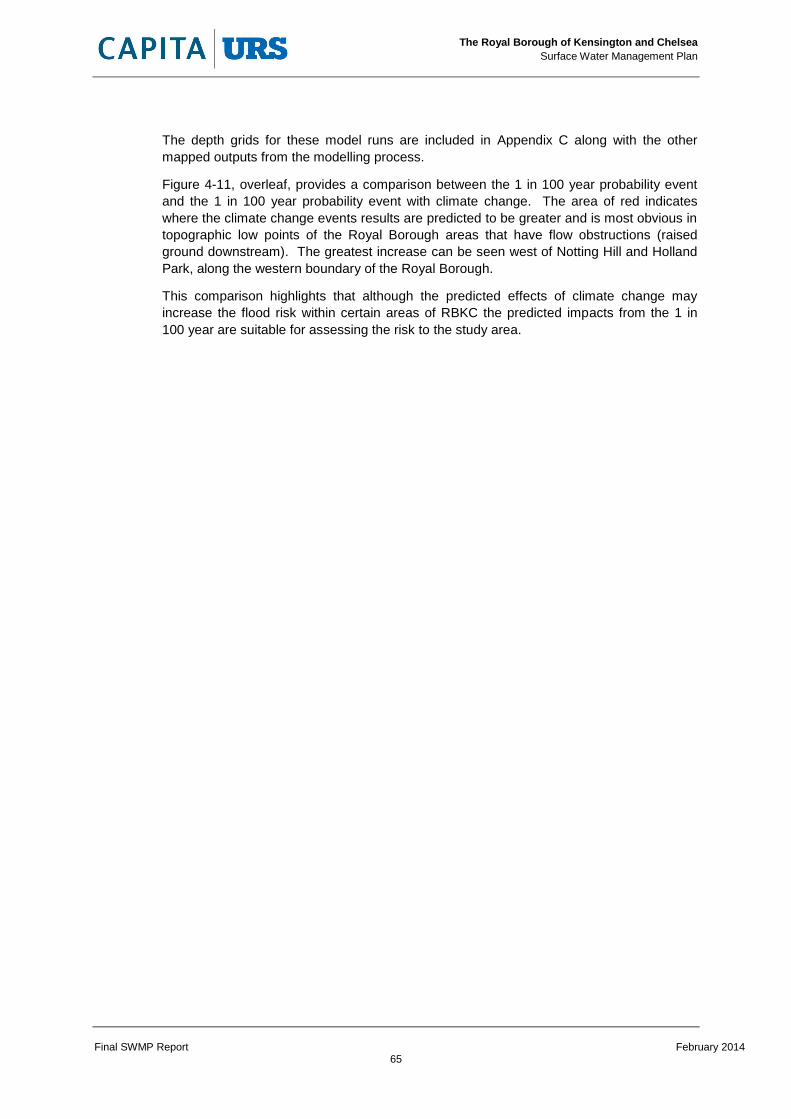
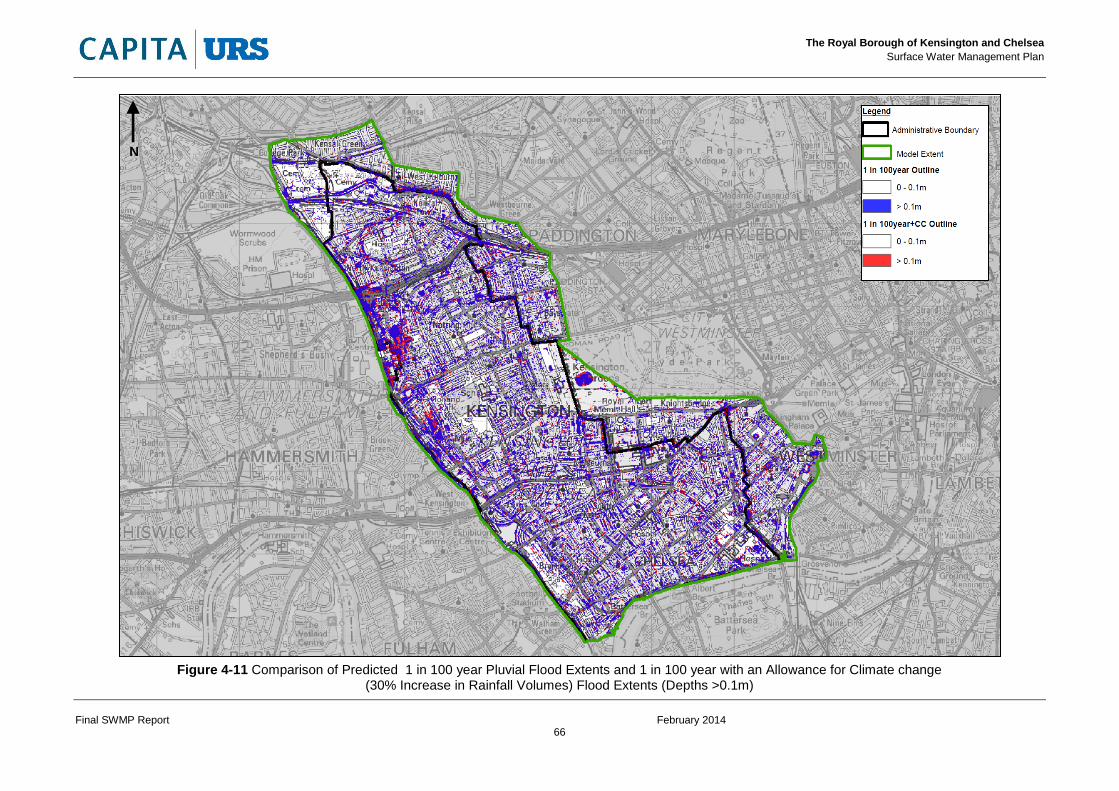
0.1m 0.3m 0.5m
Infrastructure
Essential Infrastructure
1 1 1
Highly Vulnerable 11 1 -
More Vulnerable 65 4 2
Sub-total 77 6 3
Households
Non-Deprived (All) 103 14 5
Non-Deprived (Basements Only) 1190 212 105
Deprived (All) 1293 226 110
Deprived (Basements Only) 213 22 6
Sub-total 8737 955 326
Commercial / Industrial
Units (All) 679 91 20
Units (Basements Only)
1 - -
Others
Other Flooded Properties
706 92 23
Infrastructure Other
12 6 -
The Royal Borough of Kensington and Chelsea
Surface Water Management Plan
Final SWMP Report February 2014
64
Figure 4-10 Comparison of Predicted Flooded Properties for the 1 in 20 year and 1 in 100 year
Rainfall Event
As can be expected, the number of properties at a shallow flood risk (>0.1m) are greater
than those at a deeper risk (>0.5m), with the number of properties at risk increasing as the
storm probability decreases. This is due to the increasing volume of predicted rainfall
within the storm.
4.3.3 Risk to Future Development
As discussed in Section 1.9, a number of sites have been identified for future development
through Site Allocation Plans. It is therefore important that surface water flood risk
identified within the report should be a consideration in the Site Allocation Plans as their
current locations can either assist or exacerbate the risk to existing properties within
RBKC. It is recommended that these developments adhere to specific policy relating to
flooding in addition to the requirements of NPPF.
4.3.4 Effect of Climate Change
The effect of climate change on surface water flood risk has also been analysed through
the risk assessment phase of this study. Based on current knowledge and understanding,
the effects of future climate change are predicted to increase the intensity and likelihood of
summer rainfall events, meaning surface water flooding may become more severe and
more frequent in the future.
To analyse what impact this might have on flood risk across the Royal Borough in the
future, the surface water model was run for a 1 in 100 year probability event (1% AEP) to
include the effect of climate change. Based on current guidance (taken from Table 2 of
NPPF) an increase in peak rainfall intensity of 30% was assumed for this model scenario.
10,243
1,203 442
18,261
4,357
1,636
-
2,000
4,000
6,000
8,000
10,000
12,000
14,000
16,000
18,000
20,000
> 0.1m >0.3m >0.5m
Pro
pe
rty
Nu
mb
ers
Predicted Flood Depth (m)
Predicted Residential Properties at Risk Of Pluvial Flooding
1 in 20 year event
1 in 100 year event
The Royal Borough of Kensington and Chelsea
Surface Water Management Plan
Final SWMP Report February 2014
65
The depth grids for these model runs are included in Appendix C along with the other
mapped outputs from the modelling process.
Figure 4-11, overleaf, provides a comparison between the 1 in 100 year probability event
and the 1 in 100 year probability event with climate change. The area of red indicates
where the climate change events results are predicted to be greater and is most obvious in
topographic low points of the Royal Borough areas that have flow obstructions (raised
ground downstream). The greatest increase can be seen west of Notting Hill and Holland
Park, along the western boundary of the Royal Borough.
This comparison highlights that although the predicted effects of climate change may
increase the flood risk within certain areas of RBKC the predicted impacts from the 1 in
100 year are suitable for assessing the risk to the study area.
The Royal Borough of Kensington and Chelsea
Surface Water Management Plan
Final SWMP Report February 2014
66
Figure 4-11 Comparison of Predicted 1 in 100 year Pluvial Flood Extents and 1 in 100 year with an Allowance for Climate change (30% Increase in Rainfall Volumes) Flood Extents (Depths >0.1m)
N
The Royal Borough of Kensington and Chelsea
Surface Water Management Plan
Final SWMP Report February 2014
67
4.4 Summary of Risk – CDAs
Table 4-9 (below) summarises the surface water flood risk to infrastructure, households and
commercial/industrial receptors for each of the CDAs for the 1 in 100 year event.
Table 4-9: Summary of Surface Water Flood Risk in CDAs
Property Type
Flood Risk Vulnerability Classification
Critical Drainage Areas
01 02 03 04
>0.1m deep
>0.5m deep
>0.1m deep
>0.5m deep
>0.1m deep
>0.5m deep
>0.1m deep
>0.5m deep
Infrastructure
Essential Infrastructure
1 1 1 1
Highly Vulnerable
1
1 1 1
1
More Vulnerable
10 1 10 4 17 2 12 1
Sub-total 11 1 11 5 19 3 14 1
Households
Non-Deprived (All)
279 36 1,853 351 1,930 115 1,435 101
Non-Deprived (Basements
Only) 12 2 65 11 17
14 3
Deprived (All) 1003 228 195 44
Deprived (Basements
Only) 55 5 14 5
Sub-total 1,349 271 2,127 411 1,947 115 1,449 104
Commercial / Industrial
Units (All) 72 16 54 14 165 27 75 4
Units (Basements
Only) 1
Total 1,433 288 2,192 430 2,131 145 1,538 109
The Royal Borough of Kensington and Chelsea
Surface Water Management Plan
Final SWMP Report February 2014
68
PHASE 3: OPTIONS
Phase 1 Preparation:
•Identify need for SWMP
•Establish Partnership
•Clarify Scope
Phase 2 Risk Assessment:
•Undertake selected level of assessment
•Map and communicate risk
Phase 3 Options:
• Identify and short-list options
• Assess and agree preferred options
Phase 4 Implementation and Review:
•Prepare Action Plan
•Implement and Review Action Plan
The Royal Borough of Kensington and Chelsea
Surface Water Management Plan
Final SWMP Report February 2014
69
5 Options Assessment Methodology
5.1 Objectives
Phase 3 provides the methodology for undertaking a high level options assessment and indicates
what options are generally available for reducing flood risk within RBKC. This involves identifying
a range of structural and non-structural options for alleviating flood risk in the study area, and
assessing the feasibility of these options. As well as surface water, consideration must be given to
other sources of flooding and their interactions with surface water flooding, with particular focus on
options which will provide flood alleviation from combined flood sources.
The purpose of this phase of work is to assess and shortlist options in order to eliminate those that
are not feasible or cost beneficial. Options which are not suitable are discarded and the remaining
options are developed and tested against their relative effectiveness, benefits and costs.
Measures which achieve multiple benefits, such as water quality, biodiversity or amenity, should be
encouraged and promoted. The target level of protection is typically set as the 1 in 75 year
probability event (1.3% AEP); this will allow potential solutions to be aligned with the current level
of insurance cover which is available to the public.
The flow chart below (Figure 5-1) presents the process of identifying and short-listing options that
have been identified as part of the Phase 3.
Figure 5-1 Process of identifying and short-listing options and measures [adapted from Defra SWMP Guidance]
To maintain continuity within the report and to reflect the flooding mechanisms within the study
area, the options identification should take place on an area-by-area basis following the process
established in Phase 2. Therefore, the options assessment undertaken as part of the SWMP
identifies the options which are applicable to the study area as a whole and then further detail is
provided for each CDA where locally specific measures should be considered.
The options assessment presented here follows the high level methodology described in the Defra
SWMP Guidance and is focussed on highlighting areas for further analysis and immediate ‘quick
win’ actions.
The Royal Borough of Kensington and Chelsea
Surface Water Management Plan
Final SWMP Report February 2014
70
5.2 Links to Funding Plans
It is important to consider local investment plans and initiatives and committed future investment
when identifying measures that could be implemented within the Royal Borough.
The following schemes could provide linked funding solutions to flood alleviation work in the Royal
Borough, which would provide a cost effective and holistic approach to surface water flood risk
management:
Local Green Infrastructure Delivery Plans;
Local Enterprise Plans (funding plan for delivery of the Local Plans);
Major commercial and housing development is an opportunity to retro-fit surface water
management measures (housing associations and private developers);
TfL and RBKC Highways department investment plans;
Thames Water Business Plan / Asset Management Plan; and
Environment Agency Flood Defence Grant in Aid (FDGiA) funding.
5.3 Options Identification
The Defra SWMP Technical Guidance defines measures and options as:
“A measure is defined as a proposed individual action or procedure intended to minimise
current and future surface water flood risk or wholly or partially meet other agreed
objectives of the SWMP. An option is made up of either a single, or a combination of
previously defined measures.”
This stage aims to identify a number of measures and options that have the potential to alleviate
surface water flooding across the Royal Borough. It has been informed by the knowledge gained
as part of the Phase 1 and Phase 2 assessment. Where possible, options have been identified
with multiple benefits such as alleviating flooding from different sources. At this stage the option
identification pays no attention to constraints such as funding or delivery mechanisms to enable a
robust assessment.
The options assessment considers all types of options including6:
Options that change the source of risk;
Options that modify the pathway or change the probability of flooding;
Options that manage or modify receptors to reduce the consequences;
Temporary as well as permanent options;
Options that work with the natural processes wherever possible;
Options that are adaptable to future changes in flood risk;
Options that require actions to be taken to deliver the predicted benefits (for example, closing a
barrier, erecting a temporary defence or moving contents on receiving a flood warning);
Innovative options tailored to the specific needs of the project; and
Options that can deliver opportunities and wider benefits, through partnership working where