54
39 KPIs TO USE All important KPIs explained and brought together in one piece. IN E-COMMERCE
39 KPIs TO USE
All important KPIs explained and brought together in one piece.
IN E-COMMERCE

"We're in the midst of a profound structural shift from physical to
digital retail… and it’s happening faster
than I could have ever imagined.— Jeff Jordan, General Partner at Andreessen Horowitz

E-COMMERCE IS A RAPIDLY GROWING MARKET
2012 — topped $1 trillion for the first time 2014 — increased sales 22.2% within a year 2020 — is expected to reach $3.5 trillions in sales
Sources: http://www.emarketer.com/Article/Ecommerce-Sales-Topped-1-Trillion-First-Time-2012/1009649 https://www.internetretailer.com/2014/12/23/global-e-commerce-will-increase-22-year https://www.internetretailer.com/2015/07/29/global-e-commerce-set-grow-25-2015
BRIEF OVERVIEW:

WHAT DO PEOPLEBUY ONLINE?

GOODS Global average U.S. UK GERMANY JAPAN INDIA BRAZIL RUSSIA CHINA
ELECTRONICS 77% 83% 84% 90% 53% 79% 86% 71% 96%
SERVICES 76% 80% 76% 77% 63% 82% 70% 63% 87%
FASHION & APPAREL 76% 87% 85% 88% 66% 84% 75% 64% 97%
BOOKS 73% 82% 82% 80% 65% 70% 75% 52% 89%
TICKETS 64% 74% 69% 63% 43% 79% 65% 51% 71%
MUSIC & GAMES 62% 74% 75% 66% 46% 65% 62% 43% 69%
HOME APPLIANCES 59% 46% 65% 58% 41% 67% 70% 62% 83%
BEAUTY PRODUCTS 57% 50% 56% 58% 48% 68% 59% 53% 85%
Source: A.T. Kearney Connected Customer Study

INTERESTING FACT:
According to The Nielsen Company, fashion industry has the most engaged buyers (mostly women) that make up 46% of online shoppers from all over the world.
…that’s why setting the right KPIs is a way to survive in the competitive market.
BUT HOW DO YOU SET THE RIGHT KPIs?

"Choosing KPIs begins with clearly stating goals and
identifying what areas have a direct impact on them.
— Ula Lachowicz, Marketing Leader at Styla
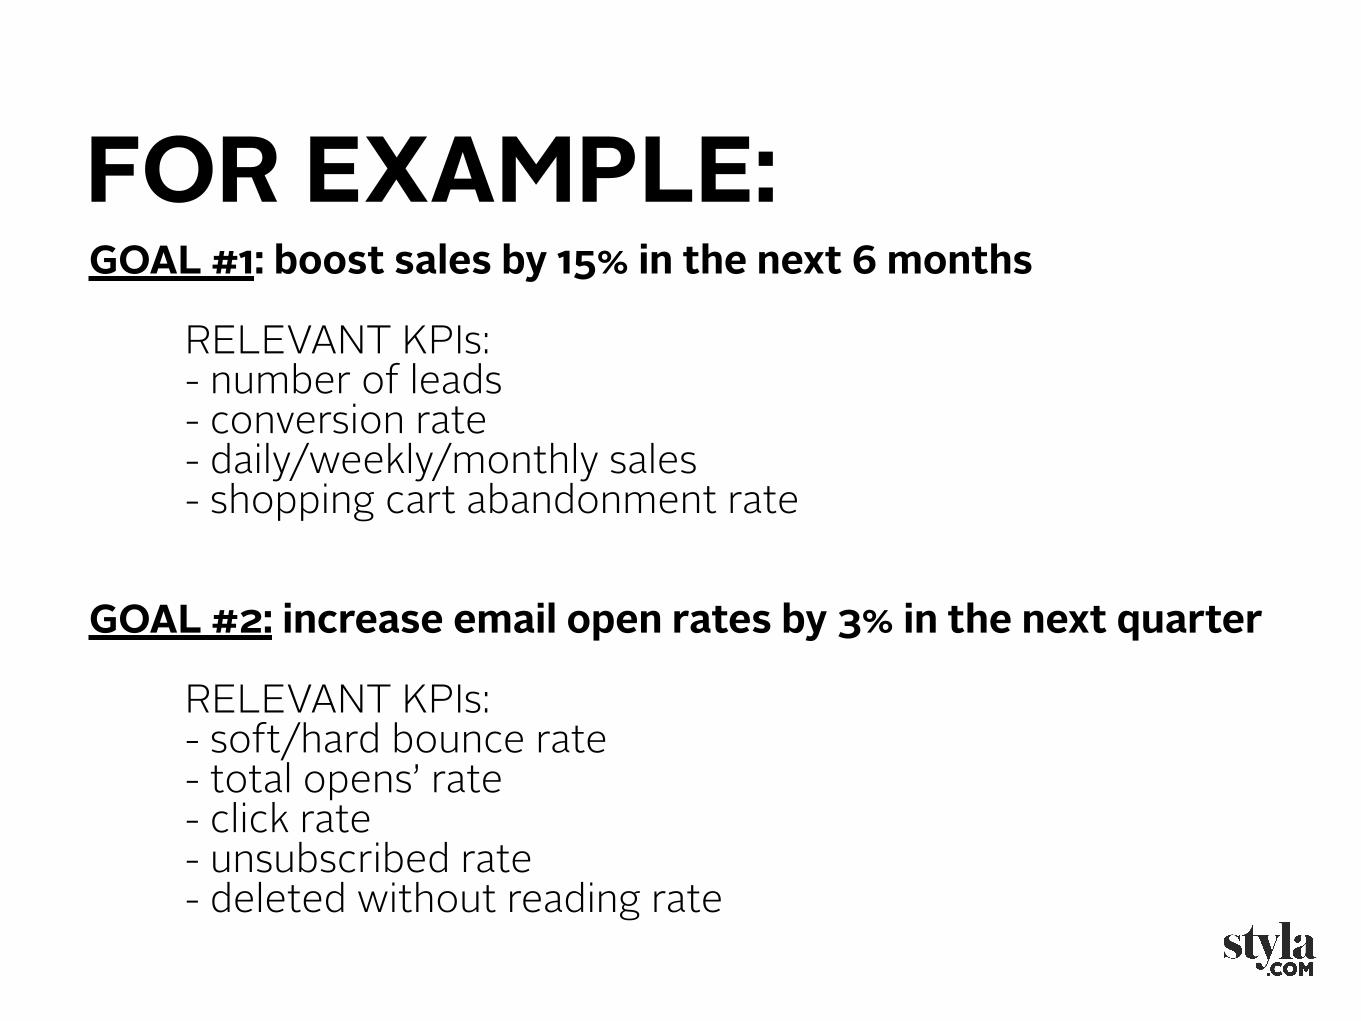
FOR EXAMPLE: GOAL #1: boost sales by 15% in the next 6 months
RELEVANT KPIs: - number of leads - conversion rate - daily/weekly/monthly sales - shopping cart abandonment rate
GOAL #2: increase email open rates by 3% in the next quarter
RELEVANT KPIs: - soft/hard bounce rate - total opens’ rate - click rate - unsubscribed rate - deleted without reading rate

KPIs FOR: PRODUCT

#1 Product quality index Is the quality of your product/service as high as the customers
expect it to be?

#2 Average time between failures
(also known as MTBF, mean time between failures)

#3 Average number of breakdowns
How many times does your product crash within a certain time frame?

KPIs FOR: CUSTOMER SERVICE

It’s been proven that 95% of customers are more likely to share bad service experiences than good ones.
#4 Customer satisfaction rate
#5 Number of customer complaints
Is it increasing or decreasing lately?

#6 Average resolution timeHow long does it take (on average) to
deal with one complaint?

#7 NPS (Net Promoter Score)How likely will a customer recommend your service or product
to somebody else?

#8 Customer retention rate (CRR)
CRR = ((E-N)/S)*100
E = number of customer at the end of a period N = number of new customers acquired during that period S = number of customers at the beginning of that period
What do clients say about your service/product?
#9 Customer feedback

KPIs FOR: SALES

#10 Sales by hour, day, week, month, quarter and year
What is sales’ frequency?
#11 Average order size (average market basket)
In the U.S., average order size is $77.9 across the country, as reported by Statista.

#12 Shopping cart abandonment rate
How many people put items in a shopping cart never to return? According to Baymard Institute, current shopping cart
abandonment rate is at 68.55%.
#13 Checkout abandonment rate
How many people abandon stop the purchasing process during the checkout?

#14 Product clicksi.e. the number of people that clicked on a particular product.
#15 Average number of products purchased togetherGrouping products together in a similar order lets customers see
more variety, claims Shopify.

#16 Average number of products viewed
Your products should be displayed cohesively.
#17 Average delivery costsHow much does it cost you to deliver your product to a client? According to Statista, UK has the most expensive domestic delivery option on Saturdays, with an average cost of £9.19.
#18 Average return costsAn IHL report has estimated that returns cost the global retail
economy $642.6 billion each year.
#19 Repeat buyersA typical online store gets 43% of its revenue from repeat buyers,
according to Bigcommerce.

#20 Number of transactions in a given time frame
What are the peak times?
#21 Leads to customers ratioLead is a prospective consumer of a product/service that is created when an individual shows interest and provides his or her contact
information. (Def: Investopedia)

#22 Customer profitability score
After deducting all the costs of customer attraction, on-boarding, maintenance, advertising expenses, etc, how much profit does
that customer bring to your business?

#23 Return on investmentROI = (Gains – Cost)/Cost
#24 Revenue growth rate and net profit
i.e. income minus expenses

KPIs FOR: MARKETING

#25 Site trafficHow many unique visitors land on your website?

#26 Site traffic to lead ratio known also as the conversion rate.
#27 Bounce rateBounce rate in e-commerce is 35%, which is a bit less than
the average 40.5% on the web in total.
#28 Average time spent on website
55% of visitors spend less than 15 seconds on your website, informs Hubspot.

#29 Page view per userHow many pages does one user explore in one session?

#30 New VS. returning visitorsi.e. measuring the visitor loyalty.

#31 Newsletter subscribersHow many people are subscribed to your newsletter?

#32 Number of leads (from different channels)What channel in particular (direct, organic, referral, etc)
brings you most leads?

#33 Cost per leadHow much does it cost to acquire one lead?

#34 Brand keyword valueHow high is the bid on your brand keyword?

#35 Social media followershipHow many followers does your brand have across all channels?

#36 Social media reach & engagement rate
Engagement = (Number of likes + comments + shares) / total reach of the posts * 100
#37 Email marketing performance rate
According to Mailchimp, the average email campaign stats in e-commerce stand at 16.77% opens and 2.53% URL clicks.

#38 Cost per acquisitionIt is 7 times more expensive to attract a new customer
than retain an old one.

#39 Customer lifetime valueCLV is a calculation of how much profit a business could make from one customer over the whole period that they remain a
customer.

39 Essential KPIs To Swear (And Live) By In E-Commerce
Read the full article on the Styla blog.
SUBSCRIBE HERE

SELLSSTORYTELLING
Styla is the world’s leading content commerce solution that creates shoppable content in a form of
a beautiful magazine integrated into your e-commerce store.


