40
3Q 2017 Opera Software ASA

3Q 2017 Opera Software ASA

• Executive Summary • Financial Review • Operations Review • AdColony (Mobile Advertising) • Closing Comments
Agenda
2

Quarterly highlights
• AdColony revenue below expectations - Weaker Brand IO revenue: as expected, uptick in Performance revenue: weaker than expected
• AdColony, Bemobi, SurfEasy and Skyfire all profitable (Adj. EBITDA) in the quarter
• Cost initiatives in AdColony and Skyfire delivered on plan in 3Q17
• * For further information regarding Adjusted EBITDA and other alternative performance measures used by Opera, see Note 9 of the interim condensed financial statements
Financial metric 3Q17 ($m) 2Q17 ($m) 3Q16 ($m)
Total revenue 108.7 109.9 136.0
Adj. EBITDA* 7.9 3.1 11.9
3
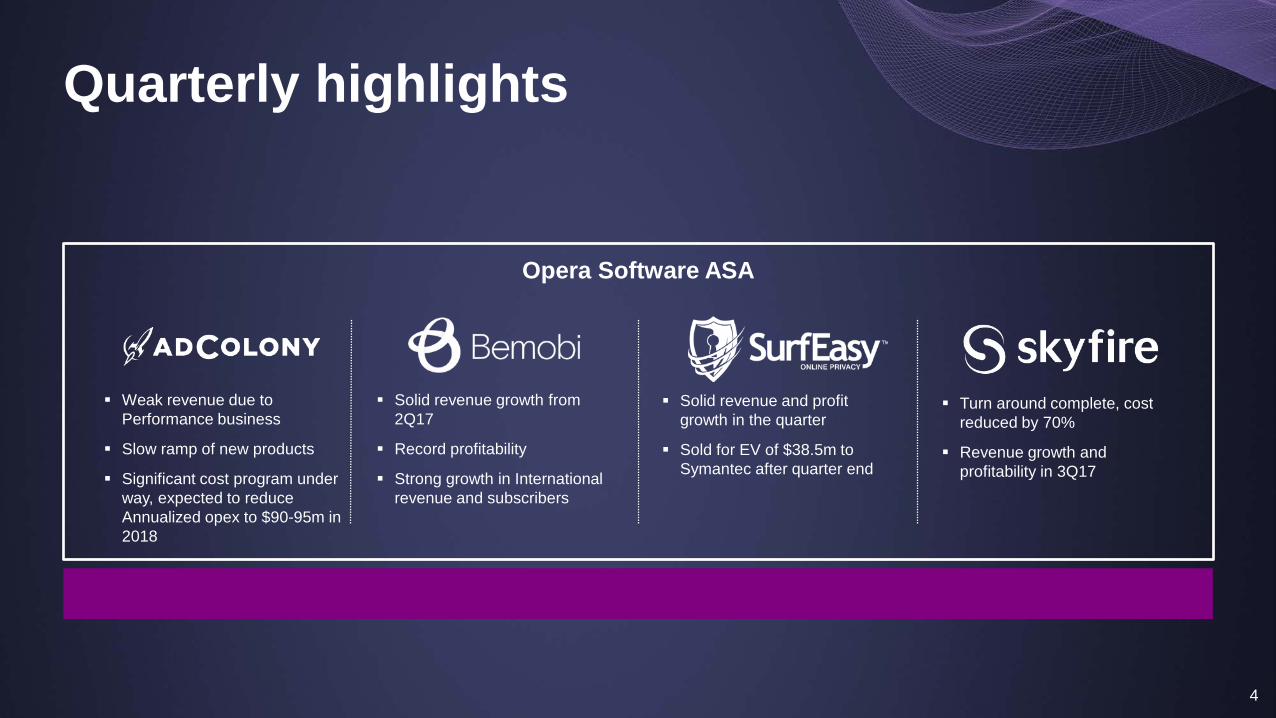
Quarterly highlights
Opera Software ASA
Solid revenue growth from 2Q17
Record profitability
Strong growth in International revenue and subscribers
Turn around complete, cost reduced by 70%
Revenue growth and profitability in 3Q17
Weak revenue due to Performance business
Slow ramp of new products
Significant cost program under way, expected to reduce Annualized opex to $90-95m in 2018
Solid revenue and profit growth in the quarter
Sold for EV of $38.5m to Symantec after quarter end
4

Further cost cuts in AdColony
5
Annualized OPEX run-rate entering 2017
Annualized OPEX run-rate 3Q17
Additional savings executed
Annualized OPEX run-rate 2018
~$145m
~$120million
$24m Headcount $2m Marketing $1m Offices $3m Other
$90-95million
• Focus on Brand and Performance Business
• Significant cuts in support fuctions
• Range for 2018 gives room for investments in products, programmatic and our roll-out in China

Financial Review
6
Disclaimer This presentation contains, and is i.a. based on, forward-looking statements regarding Opera Software ASA and its subsidiaries. These statements are based on various assumptions made by Opera Software ASA, which are beyond its control and which involve known and unknown risks, uncertainties and other factors which may cause our actual results, performance or achievements to be materially different from any future results, performances or achievements expressed or implied by the forward-looking statements. Forward-looking statements may in some cases be identified by terminology such as “may”, “will”, “could”, “should”, “expect”, “plan”, “intend”, “anticipate”, “believe”, “estimate”, “predict”, “potential” or “continue”, the negative of such terms or other comparable terminology. These forward looking statements are only predictions. Actual events or results may differ materially, and a number of factors may cause our actual results to differ materially from any such statement. Such factors include i.a. general market conditions, demand for our services, the continued attractiveness of our technology, unpredictable changes in regulations affecting our markets, market acceptance of new products and services and such other factors that may be relevant from time to time. Although we believe that the expectations and assumptions reflected in the statements are reasonable, we cannot guarantee future results, levels of activity, performance or achievement. Opera Software ASA makes no representation or warranty (express or implied) as to the correctness or completeness of the presentation, and neither Opera Software ASA nor any of its subsidiaries, directors or employees assumes any liability connected to the presentation and the statements made herein. Except as required by law, we undertake no obligation to update publicly any forward-looking statements for any reason after the date of this presentation to conform these statements to actual results or to changes in our expectations. You are advised, however, to consult any further public disclosures made by us, such as filings made with the Oslo Stock Exchange or press releases. This presentation is not an offer or invitation to sell or issue securities for sale in the United States, and does not constitute any solicitation for any offer to purchase or subscribe any securities. Securities may not be sold in the United States unless they are registered or are exempt from registration. Opera Software ASA does not intend to register any securities in the United States or to conduct a public offering in the United States. Any public offering of securities to be made in the United States would be made by means of a prospectus that will contain detailed information about Opera Software ASA and its management, as well as financial statements. Copies of this presentation should not be distributed in or sent into any jurisdiction where such distribution may be unlawful. The information in this presentation does not constitute an offer of securities for sale in Canada, Japan or Australia.
7

Opera Group 3Q17 P&L
8
P&L 3Q 2017 3Q 2016 % Total operating revenue 108.7 136.0 -20% Publisher and revenue share cost (65.1) (80.0) -19% Payroll and related expenses1) (20.4) (25.8) -21% Stock-based compensation expenses (1.7) (3.0) -44% Depreciation and amortization (8.6) (11.0) -21% Other operating expenses (15.4) (18.2) -16% Total operating expenses (111.1) (138.0) -20% Adjusted EBITDA 7.9 11.9 -24%
Operating profit (loss), ("EBIT"), excluding restructuring and impairment costs (2.4) (2.1) Restructuring and impairment cost (1.1) (1.3) Operating profit (loss), ("EBIT") (3.5) (3.3) Net financial items (loss) 1.2 (10.2) Profit (loss) before income tax (2.3) (13.5) Provision for taxes 2.2 7.6 Profit (loss) (0.1) (5.9)
Basic earnings (loss) per share (USD) (0.00) (0.04) Diluted earnings (loss) per share (USD) (0.00) (0.04)
• Revenue and cost both down 20% YoY
• Net financial positive due in part to profit from Vewd (aka Opera TV)
• Items below the Adj. EBITDA line smaller as earn-out liabilites are reduced

Opera Group 3Q17
• Revenue down in 3Q17 vs 3Q16 due to AdColony, growth in Bemobi, Skyfire and SurfEasy
• Opex down significantly versus 3Q16 and 2Q17
• Solid sequential profit trend and all 4 companies Adj. EBITDA profitable in the quarter
9

AdColony –Slow product ramp and shift to programmatic, significant cost cuts
10
• Revenue impacted by weak performance revenue, slow product ramp and shift to programmatic
• Gross margin down due to shift to programmatic and aggressive moves to secure premium publisher inventory
• Expect Gross margin to be stable around current level
• Opex down over 20% YoY
with full effect from the announced cost cutting program reducing annual Opex run rate from $145-150m to $120m
$91
$121 $128
$93 $96

Bemobi – Record quarter
• Record revenue up 13% from 2Q17 and up 2% from 3Q16 (3Q16 included $0.8m extraordinary revenue)
• Solid international revenue growth
• Paced opex growth linked to international rollout
• Continued strong gross margin
• Record profitability (Adj. EBITDA)
11

Skyfire & SurfEasy – Revenue up and cost down
• Revenue up 100%+ YoY with strong revenue growth from both SurfEasy and Skyfire
• OPEX down 40% YoY, all due to cost measures in Skyfire
• 90%+ Gross margin
• First quarterly Adj. EBITDA profit
12

Cash flow – Positive free cash flow
• Operating CF: USD 3.4 million, negatively impacted by restructuring in AdColony and Skyfire
• Capex & Capitalized R&D: USD 2.8 million, down 60% vs 3Q16
• Free cash flow * : USD 0.6m
• Investing & Financing: Earnout payments of USD 8.8 million and USD 8.1 million in share repurchases
• Cash end of quarter: USD 161.7 million, down USD 13 million vs 2Q17
• * Free cash flow = Operating CF - Capex & Capitalized R&D
13

Financial position – Strong net cash position Financial Position Balance sheet
Gross Cash Gross Debt Net Cash Earnout liabilities
$161
.7
$61.
6
-$10
0.1
-$56
.1
Goodwill
Accounts receivables
Cash
Other assets
Loans
Earn-out liabilities
Other liabilities
Equity
14

Financial outlook – FY 2017
• Stable revenue from AdColony with focus on core business offering around Mobile video, Performance and Programmatic
• AdColony opex base to be further reduced from USD 120m annual run-rate to around USD 90m in 2018 to ensure positive free cash flow at today’s revenue level
• Continued revenue and profit growth from Bemobi
• Skyfire to remain profitable
• SurfEasy excluded from Opera’s P&L from November 6th 2017
15

Financial outlook – 4Q17 expectations (vs 3Q17)
Company Revenue Adj. EBITDA
AdColony Flat Flat
Bemobi Up Up
SurfEasy* Down Down
Skyfire Down Down
16
*Revenue only through 6th November 2017

Operational Review
17
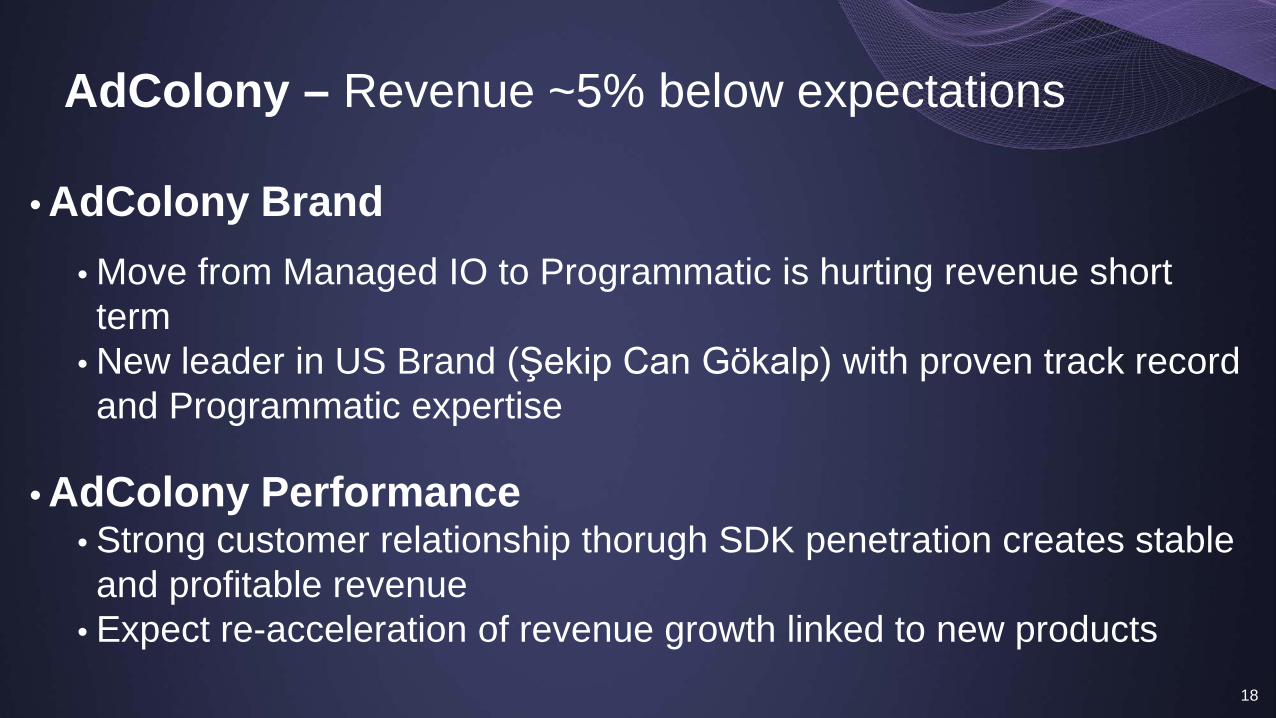
AdColony – Revenue ~5% below expectations
18
• AdColony Brand
• Move from Managed IO to Programmatic is hurting revenue short term
• New leader in US Brand (Şekip Can Gökalp) with proven track record and Programmatic expertise
• AdColony Performance • Strong customer relationship thorugh SDK penetration creates stable and profitable revenue
• Expect re-acceleration of revenue growth linked to new products

AdColony – Opex down 50m+ last 12 months
19
$0
$20
$40
$60
$80
$100
$120
$140
$160
Enter 2017 Enter 2H2017 Enter 2018
Opex annualized run-rate (USD million)
• Reduced headcount from 700+ to 400
• Turned regional offices into sales offices
• Focusing on strategic and profitable businesses
• Committed to be cash flow positive

AdColony – Reasons to be optimistic
20
• Market continues to grow • Market wants independent partners with scale • We have unique footprint through our SDK • Just launching our business in China (world’s 2nd biggest market)
• New leadership in Technology (Andrzej Dzius) • Focused on delivering on plan and on time • 100% aligned with our commercial team
• New leadship in products (Sunil V. Kelath) • Delivering the products the market needs and wants

Bemobi – Record revenue and profit
Revenue 3Q 2017 ($m)
3Q 2017 ($m)
3Q 2016 ($m) Comments
LATAM 11.1 10.1 11.8 Mature market, $0.8m in extraordinary revenue in 3Q16
International 2.8 2.2 1.9 Strong growth of Apps Club and NDNC revenue
Total 13.9 12.3 13.7
21

Bemobi – Subscriber growth driving revenue and scale
• LatAm subscriber base back to growth
• International subscriber base growing, but still very early phase
• Encouraging ARPU trend in new markets
• Total addressable subscriber base now over 2 billion across the globe
22

Bemobi – The International growth case
23
Apps Club 34 operators live outside LATAM:
• 13 operators in South Asia • 11 operators in South-East Asia • 8 operators in CIS • 2 operators in Africa
NDNC 5 NDNC portals live in ROW:
• Vodafone Ukraine • Banglalink Bangladesh • MTS Belarus • Tata India • Grameenphone Bangladesh
Distribution (vs 2Q17) • Opera Browser acquisitions slightly decreased from 55% to 52% • NDNC channel has grown from 12% to 15%. • Digital acquisitions (CPA/rev share) grew from 13% to 18%. • Operator driven acquisitions slightly decreased from 12% to 9%. • App stores/Other flat at 6% • User growth driver => Continuous improvements and
optimizations of conversion through different channels, launch of NDNC portals and investments into Digital acquisitions (CPA/rev share).
• Revenue growth driver => optimizations of conversions, billing rates and churn especially introduction of additional billing cycles at almost all ROW operators.
Entering 4Q17 with $1m+ monthly revenue run-rate

Skyfire – Turnaround complete
24
Delivered on commitment to be profitable
• Profitable in 3Q17
• Guaranteed multi million USD revenue over next 3 years
• Headcount reduced from 30 to 8
• Terminated office lease
• Annualized OPEX <$1.5m
• No direct sales, all sales through Huawei
• Any future cost increase only linked to guaranteed revenue

SurfEasy – Sold to Symantec
• The Transaction values SurfEasy at an enterprise value of USD 38.5m (over 2x what we paid
for it 3 years ago)
• The Transaction has customary net working capital and net debt adjustment mechanisms
• Purchase price consists of an all cash consideration, of which 85% is paid to Opera at closing. The remaining 15% will be held in escrow for up to 15 months
• SurfEasy will be excluded from Opera's financials as of 6 November 2017
• The transaction price is approximately 5-6x revenue and 40x Adj. EBITDA Last Twelve
Months
25

Executive Summary
27
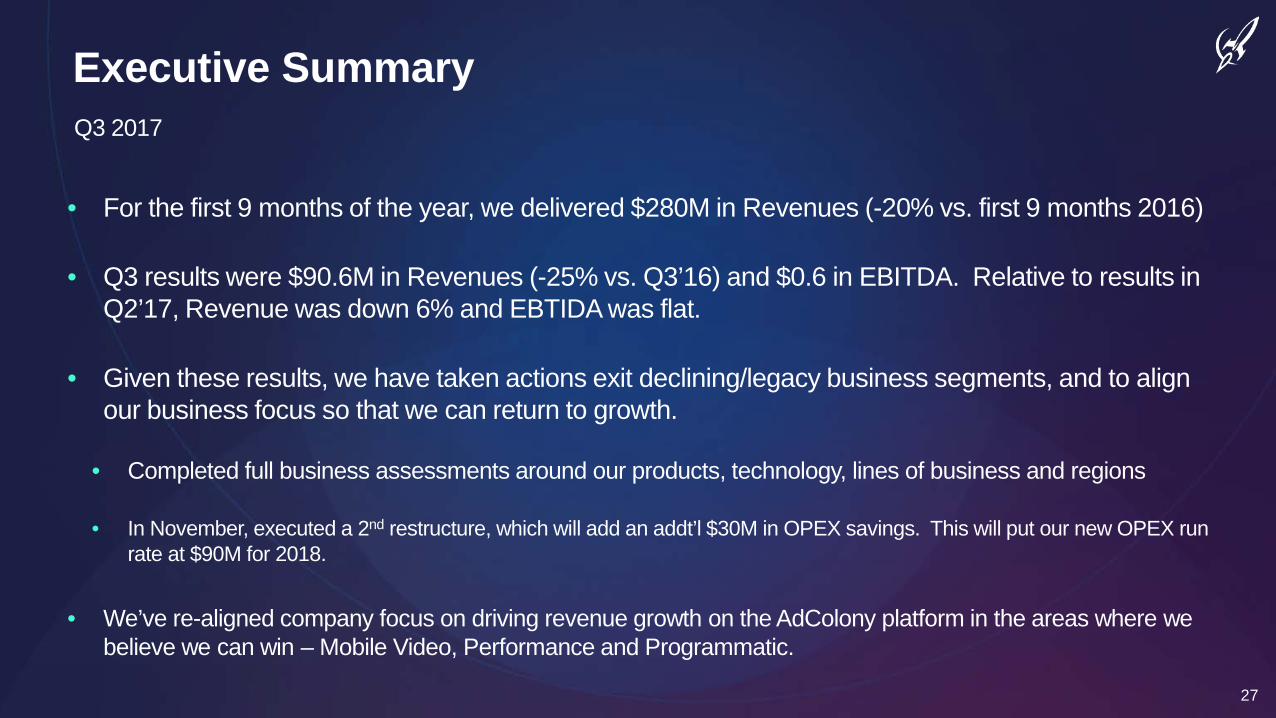
• For the first 9 months of the year, we delivered $280M in Revenues (-20% vs. first 9 months 2016)
• Q3 results were $90.6M in Revenues (-25% vs. Q3’16) and $0.6 in EBITDA. Relative to results in Q2’17, Revenue was down 6% and EBTIDA was flat.
• Given these results, we have taken actions exit declining/legacy business segments, and to align our business focus so that we can return to growth.
• Completed full business assessments around our products, technology, lines of business and regions
• In November, executed a 2nd restructure, which will add an addt’l $30M in OPEX savings. This will put our new OPEX run rate at $90M for 2018.
• We’ve re-aligned company focus on driving revenue growth on the AdColony platform in the areas where we believe we can win – Mobile Video, Performance and Programmatic.
Q3 2017

Q3 Results

Results: Performance Advertising
29
Summary: Q3 2017
Performance revenues = 41.0M (-28.3% vs. Q3’16; +3% vs. Q2’17 Run rate since end of Q3 has been stable into Q4 Key metrics: • Pricing increased 8% vs. Q3’16 and +6% QoQ (new ad units and excess demand) • Install Rate fell 11% vs. Q3’16 leading to fewer installs and lower CPMs • eCPMs fell only 4% vs. Q3’16, but impressions fell 24% (increased supply competition)
$2.67 $2.99
$3.22 $3.23
$4.00 $4.10 $3.70 $3.62 $3.64 $3.58
$3.34 $3.15 $3.11 $3.13 $3.19 $3.09 $2.90 $2.70 $2.81 $2.84 $2.77 $2.76 $3.00 $2.82
5/22 5/29 6/5 6/12 6/19 6/26 7/3 7/10 7/17 7/24 7/31 8/7 8/14 8/21 8/28 9/4 9/11 9/18 9/25 10/2 10/9 10/16 10/23 10/30
$M U
SD
Weekly Performance Revenues

Results: Performance Advertising
30
Summary: New ad formats continue to outperform and scale up
Vertical Video
• Grew 100% • Now >10% of all inventory • +15% higher install rates • +9% higher eCPMs
Playable Ads
• Continue to ramp up with adoption of 3.0 SDK • Now 2% of performance impressions but 4% of revenues • CPM is more than 2x that of video • Install Rate is +33% higher with playables • 100% growth in Playable revenues over last 30 days
10/9 10/16 10/23 10/30
Impr
essi
ons
Weekly Playable Impressions

Results: Performance Advertising
31
Appsflyer Index (1H 2017): AdColony ranks only behind Apple, Facebook and Google in ROI

Results: Brand Advertising
32
Summary: Q3 2017 Brand Revenues = $49.6M (-21.9% vs. Q3’16)
Revenue Source Q3 2016 Q3 2016 Mix % Q3 2017
Q3 2017
Mix %
YoY Change
Brand: Managed IO $41.4 65.1% $29.7 59.9% -28.2% Brand Performance $8.6 13.5% $6.5 13.0% -24.9% Programmatic – Open Market $8.4 13.1% $7.7 15.6% -7.5% Programmatic - PMP $0.9 1.4% $4.2 8.5% +369.2% SSP $4.2 6.8% $1.5 2.9% -64.2%
TOTAL $63.5 100% $49.6 100% -21.9% • As industry shift to programmatic continues, Managed IO declines further - amplified by the
decline in legacy businesses and inability to measure viewability with IAS and DoubleVerify
• With increased focus on PMP activation, over 3x growth in PMP revenue YoY
• Brand Performance impacted by decline in mobile web based direct response is continued to be brought in-house by agencies to be executed programmatically

Q3 Recap & Future plans
33
Performance: • Run rate is stable, but we need to get our Install Rates higher and drive more absolute installs
• New data science models to improve IR • Supply – continued expansion of high quality supply/1st waterfall position • SDK – increase penetration of 3.2 SDK
Brand: • IO business continues to shift to programmatic. Int’l markets (i.e. APAC) now 50% PMP
revenues • While we have over 100 DSP connections in our exchange, we need to make the AdColony SDK and
ad units more compatible w/Programmatic demand and Viewability standards
• Şekip Can Gölap promoted to run US Exchange & Brand; Brand sellers w/programmatic DNA.
• AdMarvel and legacy businesses/platforms declined and became unprofitable; These are very people intensive platforms which no longer make sense to maintain, so we plan to exit these businesses and “right size” our cost structure. We executed a 2nd restructure in November which will eliminate another $30M in OPEX savings for 2018.

Product Update

Product Updates/Tracking
35
Focus on SDK, tools for Supply/Demand & Cost Efficiencies
Product Updates & Tracking
SDK 3.X (Next gen AdColony SDK)
• 3.2.1 SDK launched on Sep. 11th, focuses on compatibility with iOS 11 and Android Oreo. • Stable launch with ~10% penetration across AdColony publishers thus far.
Publisher Tools • Completed and released Fixed Price Zones by geo and zone floors. Being widely used by global publishing teams with a few further enhancements to be added in Q4.
Fraud Detection • Live with Fraud Validation API, which has been released to 100% of the network. This technology automates fraud risk detection and filtering.
LTV Optimization • Launched 2nd phase of LTV User Score Targeting, including IAP spend and retention
models. Currently in live testing with over 7 clients, with positive signs, but needs further scale.
Granular Pricing • Launched the Granular Pricing MVP tool, currently live with over a dozen top-tier clients using the product in public beta. Very positive client feedback to-date.
Cost efficiencies • Implemented data storage efficiencies for event and attribution data in the DynamoDB cloud database service. This amounts to annualized cost savings of ~$1million.

New CTO & 7 Missions
36
Missions = Key to returning to growth
• New CTO, Andrzej Dzius, in mid September
• Identified 7 most critical problems we need to address. If we solve these, we will return to growth
The Key Missions: 1) Ad Readiness - Ensure we are ready to serve an ad whenever we get an ad call 2) Install Rate - Use the data science and ad server teams to improve install rate 3) Programmatic Auction Dynamics - Align our programmatic buying process to industry standards 4) China - Launch and scale China performance business 5) Ease of SDK integration - Improve the implementation process and stability of our SDK 6) MRAID / Viewability - Ensure our ad units are viewable and MRAID 3.0 compatible 7) PIE - Increase advertiser LTV via granular pricing and automated efforts that link to Post install events

What are We Doing Differently & How To Win?
37
• New strategic focus: AdColony Platform + Exchange, providing the largest in app marketplace of video outside of social. Maintaining legacy businesses no longer made sense.
• New executional priorities: Direct Supply, Exchange, Customer Orientation
• New leadership: CTO, Andrzej Dzius, was put in place in September, who we believe will have a positive impact in solving key technical challenges. Şekip Can Gölap promoted to run US Exchange & Brand and building talented team of brand sellers w/programmatic DNA.
• Developed a series of missions – each w/cross functional teams, KPIs, delivery dates, etc. • Making some changes to SDK to enable more compatibility with the rest of the market.
• Restructure: We decided to exit legacy business segments and platforms so that we double down our focus on Video, App Install and Programmatic. Three key areas where we believe we can win.
Focus & Changes

Closing
38
• Q3 was a challenging quarter. While we had small growth in Performance vs. Q2 and were EBITDA positive, we’ve seen our Brand business continue to shift to Programmatic buying and we saw an even more accellerated decline in legacy platforms.
• Legacy businesses and platforms decayed faster than expected in Q3; Became unprofitable • November we announced exiting mediation and ad serving; Migrating off older non-AdColony Int’l platforms
• Operationally in Q3, we made progress in driving adoption of the new 3.x SDK. • Our new ad units are working (+30% vs HTML playables) and we are driving exceptional results for Brands • Our 3.3 SDK is designed to add more robust viewability support (IAS, DV) to better align w/needs of programmatic
marketplace
• Restructured our OPEX in November so as to enter Q1’18 with a $90M annual OPEX – over $50M lower than our rate when we entered Q1’2017.
• Future focus will be on key growth segments : Mobile Video, Performance & Programmatic
• Strategically, we believe the steps we are taking will position us for revenue and profit growth in our core business segments in both the short and long term

Closing Comments
39

All our companies must be profitable and generate cash
Opera Software ASA
Continued international ramp
Expect continued ramp in revenue and profit in 4Q17
Cost program executed ($5m annualized impact)
Multi-million USD deal signed
Expect continued profitability
Delayed launch and ramp of products reduces revenue expectations for 2017
Cost program executed ($25m annualized impact)
Further $30m cost program initiated in 4Q17
Clearly profitable and ahead of plan for the year
Expect ramp in revenue and profit in 2H
40


