34
Quarterly Report Q2 2019

46,
Quarterly Report Q2 2019

2nd quarter, 2019 Arcus ASA 2
Contents Message from the CEO ....................................................................................... 3
Key figures Q2 2019............................................................................................ 4
Highlights Q2 2019 ............................................................................................. 5
Wine: Increased market share in Norway ........................................................... 6
Spirits: Strong growth in period and YTD ............................................................ 7
Distribution: Increased volume and revenue ...................................................... 8
Financial position and other information ........................................................... 9
Half-year review ............................................................................................... 10
Group consolidated accounts ........................................................................... 12
Notes ............................................................................................................... 17
Contact information ......................................................................................... 34

2nd quarter, 2019 Arcus ASA 3
Message from the CEO
We are pleased to see organic growth of 3.9 percent in the quarter, the sixth consecutive quarter of organic growth. Revenue increased for Spirits and Distribution, while there was a negative development for Wine, entirely due to the loss of wine producers announced earlier this year.
Wine
The positive sales trend for Wine in Norway continued during the quarter, increasing market shares. The increased revenue was driven by higher sales of own brand bestsellers and new products. In Sweden, the loss of wine producers announced earlier impacted the quarter to a large extent, with the full impact to be seen from Q3. However, new wine producers have been won during recent months, reflecting Arcus’ strong position in the market. Price increases in Sweden and Norway (1 March and 1 May respectively) did not fully compensate for the stronger EUR and USD.
Spirits
Sales were at a high level during the quarter, driven by a broader portfolio of own products, positive effects of the enlarged agency portfolio, and Easter in April this year. Gross profit increased thanks to the higher sales, though short term deviations in production reduced the gross margin. As both sales of high-margin aquavit and lower-margin agency products/innovations grew, mix effects were fairly insignificant.
Distribution
Higher levels of shipments increased the revenue growth for Distribution, continuing the positive trend from previous quarters. The margin was reduced with higher use of overtime and nightshifts, due to unexpected peaks in deliveries to Vinmonopolet.
Kenneth Hamnes
Group CEO

2nd quarter, 2019 Arcus ASA 4
Key figures Q2 2019
CONSOLIDATED GROUP FIGURES
1
1 Figures for Q2 2019 2 EBITDA adjusted is EBITDA adjusted for non-recurring effects, but is not corrected for foreign exchange effects. See separate chapter/note on APM for reconciliation. “Other” segment represents HQ and eliminations. *Segment elimination include a positive IFRS 16 adjustment of 23.2 MNOK
MNOK Full Year2019 2018 2019 2018 2018
Total operating revenue 698,0 673,2 1 250,1 1 230,2 2 723,2Gross profit1) 280,6 274,9 518,2 516,2 1 145,9EBITDA1) 2) 71,1 71,3 115,7 88,2 307,3EBITDA adjusted1) 2) 82,6 61,6 128,7 83,7 312,6Pre-tax profit2) 21,7 50,4 10,7 44,6 221,2Earnings per share, parentcompany shareholders (NOK) 0,23 0,57 0,09 0,46 2,33
Key figuresGross margin1) 40,2 % 40,8 % 41,5 % 42,0 % 42,1 %EBITDA margin1) 10,2 % 10,6 % 9,3 % 7,2 % 11,3 %EBITDA margin adjusted1) 11,8 % 9,1 % 10,3 % 6,8 % 11,5 %Equity ratio1) 30,5 % 35,9 % 30,5 % 35,9 % 37,3 %
Financial position Total equity 1 521,3 1 480,6 1 521,3 1 480,6 1 654,0Net interest bearing debt (cash)1) 1 835,5 952,4 1 835,5 952,4 615,1
Second quarter Year to date
1) Alternative Performance Measure (APM) – see separate chapter for definition and reconciliation.2) EBITDA and EBITDA adjusted include a positive IFRS 16 effect of 23.2 MNOK for Q2 and 46.6 YTD. Pre-tax profit includes a negative
IFRS 16 effect of -6.4 MNOK for Q2 and -12.9 MNOK YTD.
71
102
167
22
62 77
152
46
83
Q2 Q3 Q4 Q1 Q2 Q3 Q4 Q1 Q2
2017 2018 2019
MN
OK
EBITDA adjusted2

2nd quarter, 2019 Arcus ASA 5
Highlights Q2 2019 OVERALL PERFORMANCE
Operating revenue for Q2 2019 was 698.0 MNOK, compared to 673.2 MNOK in Q2 last year (+3.7 percent). Operating revenue increased for Spirits and Distribution, but was slightly down for Wine. Organic growth for Q2 was 3.9 percent (2.4 percent June YTD), with an estimated negative currency effect of approximately 1.3 MNOK.
Adjusted EBITDA for Q2 was 82.6 MNOK, but 59.4 MNOK when adjusted for positive effects from IFRS 16. This is a reduction of 3.5 percent compared to 61.6 MNOK Q2 last year. (IFRS 16 is implemented as of January 1 2019 on group level only, and the results for the segments are therefore comparable. Please see Note 1, page 18, for comparable figures.)
BUSINESS SEGMENTS
Wine revenues amounted to 430.6 MNOK, compared to 436.2 MNOK in Q2 last year (-1.3 percent). Organic growth was -0.9 percent. Adjusted EBITDA margin was 10.1 percent for Q2 2019, unchanged compared to Q2 last year.
Spirits revenues amounted to 214.4 MNOK, compared to 194.6 MNOK in Q2 last year (+10.2 percent). Organic revenue grew by 14.6 percent1. Adjusted EBITDA margin was 9.9 percent for Q2, compared to 9.1 percent in Q2 last year.
Distribution revenues amounted to 81.7 MNOK compared to 77.6 MNOK in Q2 last year (+5.4 percent). Adjusted EBITDA margin was 2.5 percent for Q2, compared to 5.5 percent in Q2 last year.
1Calculated on external spirits sales

2nd quarter, 2019 Arcus ASA 6
Wine: Increased market share in Norway
OPERATING REVENUE Total operating revenue for Wine was 430.6 MNOK for the second quarter, compared to 436.2 MNOK in Q2 last year. Organic growth was -0.9 percent, while reported growth was -1.3 percent because of the negative effect from weaker SEK vs. NOK. For the first half of the year, organic growth was 0.0 percent.
Easter was part of Q2 this year and boosted market growth when compared to last year.
In Sweden, Arcus’ sales at Systembolaget were slightly down in a growing market, entirely explained by the loss of producers in the company Vinunic. As communicated earlier, the annual effect on revenues of this loss was estimated to 138 MSEK. As we exhausted inventories of these products in the first half of the quarter, revenues from the lost agencies this year were about half of Q2 last year, with the remaining impact to be seen from Q3. Excluding the lost agencies, performance was good as Arcus grew sales faster than the market, andnew wine producers have been won, reflecting Arcus’ strong position in the market.
In Norway, Arcus’ sales continue to grow faster than the market, leading to further market share gains in the period. The positive momentum continued with increased volume from a range of new products and significant growth with own brands. Own brands
sales at Vinmonopolet grew more than twice the market growth with positive development for important best sellers.
In Finland, Arcus’ sales to Alko in the period decreased, despite a flat market. Arcus’ drop in sales is still mainly explained by the loss of producers late 2018. Efforts to renew the portfolio have yet to fully compensate for the decline.
EBITDA The adjusted EBITDA-margin for Wine was 10.1 percent in the second quarter, which is at the same level as last year.
Increased prices as of March 1 in Sweden and May 1 in Norway did not fully compensate for the stronger EUR and the significantly stronger USD compared to last year.
Lower indirect costs this year (especially lower A&P spending compared to above normal levels in Sweden last year) compensated for the effects from a slightly reduced gross margin in the period.
WINE Arcus is the largest importer of wine in Norway, the second largest in Sweden, and the third largest in Finland. Arcus imports and markets agency wines, as well as Arcus brands.
MNOK Full Year
2019 2018 2019 2018 2018
Total operating revenue 430.6 436.2 771.7 780.1 1 624.7Gross profit1) 97.1 100.3 175.7 181.1 380.4Gross margin 1)
22.6 % 23.0 % 22.8 % 23.2 % 23.4 %
EBITDA1) 36.8 43.3 63.6 64.6 169.7EBITDA adjusted1) 43.5 44.2 70.7 69.9 181.5EBITDA margin1)
8.5 % 9.9 % 8.2 % 8.3 % 10.4 %
EBITDA margin adjusted1)10.1 % 10.1 % 9.2 % 9.0 % 11.2 %
1) Alternative Performance Measure (APM) – see separate chapter for definition and reconciliation.
Year to dateSecond quarter

2nd quarter, 2019 Arcus ASA 7
Spirits: Strong growth in period and YTD
OPERATING REVENUE Total operating revenue for Spirits in Q2 2019 was 214.4 MNOK, compared to 194.6 MNOK for the same period last year, an increase of 10.2 percent. Organic growth was 14.6 percent1, in part driven by the late Easter. For the first half of the year, organic growth was 7.1 percent1.
Compared to Q2 last year, sales increased in all major markets, while sales to the US and other international markets declined.
In Norway and Sweden, Arcus’ sales at the monopolies grew less than the markets, resulting in somewhat reduced market shares. Arcus sales in Finland grew significantly in a relatively flat market, with Liviko as an important addition to the portfolio compared to last year.
In Denmark, sales growth was strong. Arcus sales of aquavit was even higher than the strong category performance. In addition, successful product launches in new categories contributed positively.
Sales to Germany and Duty Free Travel Retail increased in the quarter, while shipments to the US and other international markets decreased.
EBITDA The adjusted EBITDA margin for Spirits was 9.9 percent for Q2 2019, compared to 9.1 percent Q2 2018.
Contributions from the associated company Tiffon increased the margin in the period. Production deviations, which led to use of higher-value input factors, overtime and temporary workers decreased margins.
Mix effects were fairly insignificant this period: Sales of high-margin aquavit grew more than total sales, but so did relatively low-margin agency products.
SPIRITS Arcus is a global leader in aquavit with brands such as Gammel Opland, Linie, Løiten and Aalborg. Other important categories are bitter (Gammel Dansk), vodka (Vikingfjord, Kalinka, Amundsen and Dworek) and cognac (Braastad). Key markets are Norway, Denmark, Sweden, Finland, Germany and Duty Free Travel Retail (DFTR). Arcus brands are produced and bottled at Gjelleråsen, outside Oslo.
1 Calculated on external spirits sales
MNOK Full Year
2019 2018 2019 2018 2018
Sales 179.2 155.7 317.7 297.2 762.4
Other revenue 35.2 38.9 72.0 76.1 157.2
Total operating revenue 214.4 194.6 389.7 373.3 919.6
Gross profit1)
105.6 99.9 199.1 197.2 471.6
Gross margin1)
49.2 % 51.3 % 51.1 % 52.8 % 51.3 %
EBITDA1) 20.3 17.0 30.1 28.2 142.8
EBITDA adjusted1)
21.1 17.6 31.1 29.2 144.6EBITDA margin1)
9.5 % 8.7 % 7.7 % 7.6 % 15.5 %
EBITDA margin adjusted1)
9.9 % 9.1 % 8.0 % 7.8 % 15.7 %
1) Alternative Performance Measure (APM) – see separate chapter for definition and reconciliation.
Year to dateSecond quarter

2nd quarter, 2019 Arcus ASA 8
Distribution: Increased volume and revenue
VOLUME Distributed volume in the second quarter was 13.0 million liters, an increase of 0.7 million liters from the same quarter last year. This equals an increase of 5.2 percent, while Vinmonopolet’s total volume in the second quarter was up 4.3 percent compared to same quarter last year, with Easter in April this year. The volume growth was driven by increased activity for existing customers and increased customer base in the horeca-channel.
By the end of the second quarter, Distribution had a 49.4 percent share of volume delivered to Vinmonopolet, compared to 47.6 percent last year. Distributed volume in the horeca-channel grew by 2.5 percent, due to new customers. Shipments to wholesalers decreased by 7.9 percent compared to last year due to reduced demand in the horeca market, as weather was less favourable this period.
OPERATING REVENUE Operating revenue increased by 5.4 percent to 81.7 MNOK in the quarter, compared to 77.6 MNOK in the same period last year. Organic growth was 5.4
percent in Q2 and 5.0 percent first half of the year. The increase in Q2 is mainly volume-driven, as other income was at similar levels as last year.
EBITDA Adjusted EBITDA in the second quarter was 2.1 MNOK, a decrease of 2.2 MNOK compared to the same quarter last year.
Higher volumes, combined with very uneven distribution of the volumes from week to week, caused unexpected peaks in the period. This lead to less efficient production than expected and higher useage of overtime and nightshifts. Delivery costs also increased as short-term measures were taken to ensure on-time deliveries to Vinmonopolet and other customers.
DISTRIBUTION Vectura is the leading integrated logistics service provider for alcoholic beverages in Norway. Vectura serves both Arcus-Gruppen AS and external customers. Vectura is located next to Arcus’ production facility at Gjelleråsen, outside Oslo.
MNOK Full Year
2019 2018 2019 2018 2018
Total operating revenue 81.7 77.6 150.2 143.1 307.7Gross profit1) 81.7 77.6 150.2 143.1 307.7Gross margin 1)
100.0 % 100.0 % 100.0 % 100.0 % 100.0 %
EBITDA1) 0.8 4.2 -1.4 0.0 12.4EBITDA adjusted1) 2.1 4.3 -0.2 0.1 12.7EBITDA margin1)
0.9 % 5.5 % -0.9 % 0.0 % 4.0 %
EBITDA margin adjusted1)2.5 % 5.5 % -0.1 % 0.1 % 4.1 %
1) Alternative Performance Measure (APM) – see separate chapter for definition and reconciliation.
Second quarter Year to date

2nd quarter, 2019 Arcus ASA 9
Financial position and other information CASH FLOW AND FINANCIAL POSITION Reported net cash flow from operations before tax in Q2 2019 was 13.2 MNOK, compared to 35.1 MNOK in Q2 2018 (change of -21.9 MNOK), the change was -45.1 MNOK when adjusted for effects from IFRS 161.
The cash flow is negatively impacted by higher net working capital at the end of the quarter versus the level at the end of Q1, as is normal for the season.
This year, month-end fell on a Sunday, resulting in one extra day of invoices to be paid in the first banking day of July instead of in June, largely explaining the reduced cash flow this year.
1The total cashflow has not been affected by the implementation of IFRS 16, but has boosted cash flow from operations, with a corresponding decrease in the cash flow from financing activities
Net interest bearing debt was 1,835.5 MNOK, but 930.8 MNOK if adjusted for IFRS 16 effects, compared to 952.4 MNOK as at the end of Q2 2018. A higher opening cash position more than compensated the lower cash flow during the quarter, which reduced net debt compared to last year.
OTHER INFORMATION DIVIDEND
In Q2 2018, Arcus ASA paid a dividend of 113 MNOK to its shareholders, equal to 1.66 NOK per share. This corresponds to 69 percent of the profit for the year 2018, and is at the upper end of the 50-70 percent target range. For 2017, the dividend per share was also 1.66 NOK per share.
SEGMENT CHANGE NAME
From the next quarter onwards we will rename our “Distribution” segment to “Logistics”. This is more accurate as a description and avoids confusion as Arcus’ other subsidiaries are often referred to as distributors of international brands in the Nordics.

2nd quarter, 2019 Arcus ASA 10
Half-year reviewThis half-year review presents highlights only. Additional details are available in the Group’s interim report for Q1 and the review of Q2 results in this report. This interim report does not include all information that is normally prepared in a full annual financial statement, and should be read in conjunction with the Group’s annual financial statement as at 31.12.2018.
FINANCIAL RESULTS Operating revenue for the first half year was 1 250.1 MNOK vs. 1 230.2 MNOK (+1.6%) in the same period last year. Organic growth was 2.4 percent in the period with the Spirits and Distribution business seeing solid growth, while the Wine segment was flat. Reported operating revenue was hampered by the weakness of the SEK vs. the NOK.
Adjusted EBITDA for the first half year was 128.7 MNOK, but 82.1 MNOK when adjusted for positive effects from IFRS 16. This is a 1.9 percent decline compared to 83.7 MNOK for the same period last year. The decline is mainly explained by increased Parent/HQ costs related to property and facilities, as Spirits and Wine experienced growth and Distribution was relatively flat.
CASH FLOW AND FINANCIAL POSITION Reported net cash flow from operations before tax YTD was -111.8 MNOK vs. 16.8 last year. Cash flow
from operations last year was boosted by the receipt of an overdue receivable from Vinmonopolet that had a due date in the last weekend of 2017 and was paid on the first banking day in 2018.
OUTLOOK Arcus ASA operates in non-cyclical wine and spirits markets with moderate and steady growth, but with some variations between the different categories, countries and seasons. Tender wins, new products, operational efficiency improvements in Arcus’ three business segments and minor bolt-on acquisitions will contribute to profitable growth going forward. Over the next years, Arcus is still comitted to meet the financial targets outlined at the IPO.
LONG-TERM FINANCIAL TARGETS As communicated in connection with the IPO, Arcus targets organic revenue growth in the level of 3-5 percent p.a. (including minor bolt-on acquisitions), as well as EBITDA growth of 6-9 percent p.a. over the next three to five years. SEASONAL VARIATIONS The business of Arcus is seasonal. Sales of wine and spirits increase during national festivals and holidays, in particular Easter and Christmas. Q4 is normally the strongest quarter in terms of income as well as operating profit due to Christmas and New Year’s Eve.

2nd quarter, 2019 Arcus ASA 11
DECLARATION BY THE BOARD OF DIRECTORS The Board of Directors and Chief Executive Officer confirm, to the best of our knowledge, that the unaudited, condensed financial statements for the period 1 January to 30 June 2019 including notes, have been prepared in accordance with IAS 34 – Interim Financial Reporting, as determined by the EU and Norwegian Additional Requirements in the Securities Trading Act. It is also stated that the information in the condensed financial statement, provides a fair view of the business, and the Group's assets, liabilities, financial position and overall results.
Nittedal, 14 August 2019 The Board of Directors of Arcus ASA
Michael Holm Johansen Carl Erik Hagen Kirsten Ægidius Chaiman of the Board
Leena Maria Saarinen Ann-Beth Freuchen Nils Selte
Eilif Due Erik Hagen Therese Jacobsen
Konstanse Kjøle Kenneth Hamnes CEO

2nd quarter, 2019 Arcus ASA 12
Group consolidated accounts The interim financial statement has not been audited.
CONDENSED STATEMENT OF INCOME
MNOK Full Year
Note 2019 2018 2019 2018 2018
Sales 2,9 685.5 658.6 1 227.5 1 204.4 2 672.6
Other revenue 2 12.4 14.6 22.6 25.8 50.6
Total operating revenue 2,9 698.0 673.2 1 250.1 1 230.2 2 723.2
Cost of goods -417.4 -398.3 -731.9 -714.0 -1 577.3
Gross Profit 280.6 274.9 518.2 516.2 1 145.9
Gain on sale of fixed assets 0.0 0.2 0.0 0.2 0.4
Salaries and personnel cost -112.6 -106.3 -221.3 -216.4 -426.6
Advertising & Promotion expenses (A&P) -32.3 -33.7 -56.2 -64.8 -122.5
Other operating expenses -55.5 -73.3 -112.4 -149.3 -286.8
Share of profit from AC1)
and JCE2)
2.3 -0.2 0.4 -2.1 2.3
Other income and expenses 3 -11.5 9.7 -13.0 4.5 -5.3
EBITDA 71.1 71.3 115.7 88.2 307.3
Depreciation 5,6 -24.6 -10.5 -49.4 -20.8 -42.3
Amortisations 5,6 -1.9 -1.9 -3.8 -3.9 -7.7
Operating profit (EBIT) 44.7 58.9 62.4 63.5 257.3
Financial income 12 7.1 3.2 11.8 5.3 14.5
Financial expenses 7,10,12 -30.0 -11.7 -63.5 -24.2 -50.6
Pre-tax profit 21.7 50.4 10.7 44.6 221.2
Tax -4.7 -10.9 -2.8 -11.3 -56.8
Profit/loss for the year 16.9 39.6 7.9 33.3 164.4
Profit/loss for the year attributable to parent company
shareholders 15.6 38.4 5.9 31.3 158.5
Profit/loss for the year attributable to non-controlling interests 1.3 1.1 2.0 2.0 6.0
Earnings per share, continued operations 0.23 0.57 0.09 0.46 2.33
Diluted earnings per share, continued operations 0.22 0.55 0.08 0.45 2.25 1)Associated Companies, 2)Jointly Controlled Entities
Second quarter Year to date

2nd quarter, 2019 Arcus ASA 13
CONDENSED STATEMENT OF OTHER COMPREHENSIVE INCOME
MNOK Full Year
Note 2019 2018 2019 2018 2018
Profit/loss for the year 16.9 39.6 7.9 33.3 164.4
Items that will not be reclassified against the statement of
income
Change in actuarial gains and losses pensions 0.0 0.0 0.0 0.0 9.9
Tax on change in actuarial gains and losses pensions 0.0 0.0 0.0 0.0 -2.3
Total items that will not be reclassified against the statement
of income 0.0 0.0 0.0 0.0 7.6
Items that may be reclassified against the statement of
income
Translating differences in translation of foreign subsidiaries 0.1 -12.6 -23.5 -34.6 7.0
Tax on translating differences in translation of foreign
subsidiaries 0.0 0.0 0.0 0.0 0.0
Total items that may be reclassified against the statement of
income 0.1 -12.6 -23.5 -34.6 7.0
Total other comprehensive income 0.1 -12.6 -23.5 -34.6 14.6
Total comprehensive income for the year 17.0 27.0 -15.5 -1.2 179.0
Total comprehensive income for the year attributable to
parent company shareholders 15.8 26.4 -16.4 -1.7 173.8
Total comprehensive income for the year attributable to non-
controlling interests 1.2 0.6 0.9 0.5 5.2
Year to dateSecond quarter

2nd quarter, 2019 Arcus ASA 14
CONDENSED STATEMENT OF FINANCIAL POSITION
MNOK Full Year
Note 30.06.2019 30.06.2018 31.12.2018
Intangible assets 6 1 848.5 1 840.4 1 883.9
Tangible assets 5 1 195.6 321.9 315.8
Deferred tax asset 117.7 135.4 110.4
Financial assets 60.4 55.2 63.1
Total fixed assets 3 222.2 2 352.9 2 373.2
Inventories 496.1 474.6 441.1
Accounts receivables and other receivables 1 174.3 1 158.2 1 340.7
Cash and cash equivalents 98.5 134.7 282.6
Total current assets 1 768.9 1 767.5 2 064.4
Total assets 4 991.1 4 120.4 4 437.6
Paid-in equity 772.1 772.1 772.1
Retained earnings 746.2 706.7 879.0
Non-controlling interests 3.0 1.9 3.0
Total equity 1 521.3 1 480.6 1 654.0
Non-current liabilities to financial institutions 8 684.5 675.4 723.5
Non-current liabilities at fair value through profit or loss 7,10 68.0 67.9 74.2
Non-current finance lease liabilities 8 1 016.5 163.1 151.4
Pension obligations 21.3 30.6 21.1
Deferred tax liability 99.7 97.3 102.0
Other non-current liabilities 0.4 0.2 0.7
Total non-current liabilities 1 890.3 1 034.6 1 073.0
Bank Overdraft 8 180.4 231.1 0.0
Current finance lease liabilities 8 48.8 12.0 18.1
Accounts payable and other payables 1 350.3 1 362.0 1 692.5
Total current liabilities 1 579.5 1 605.2 1 710.6
Total equity and liabilities 4 991.1 4 120.4 4 437.6
Second quarter
2nd quarter, 2019 Arcus ASA 15
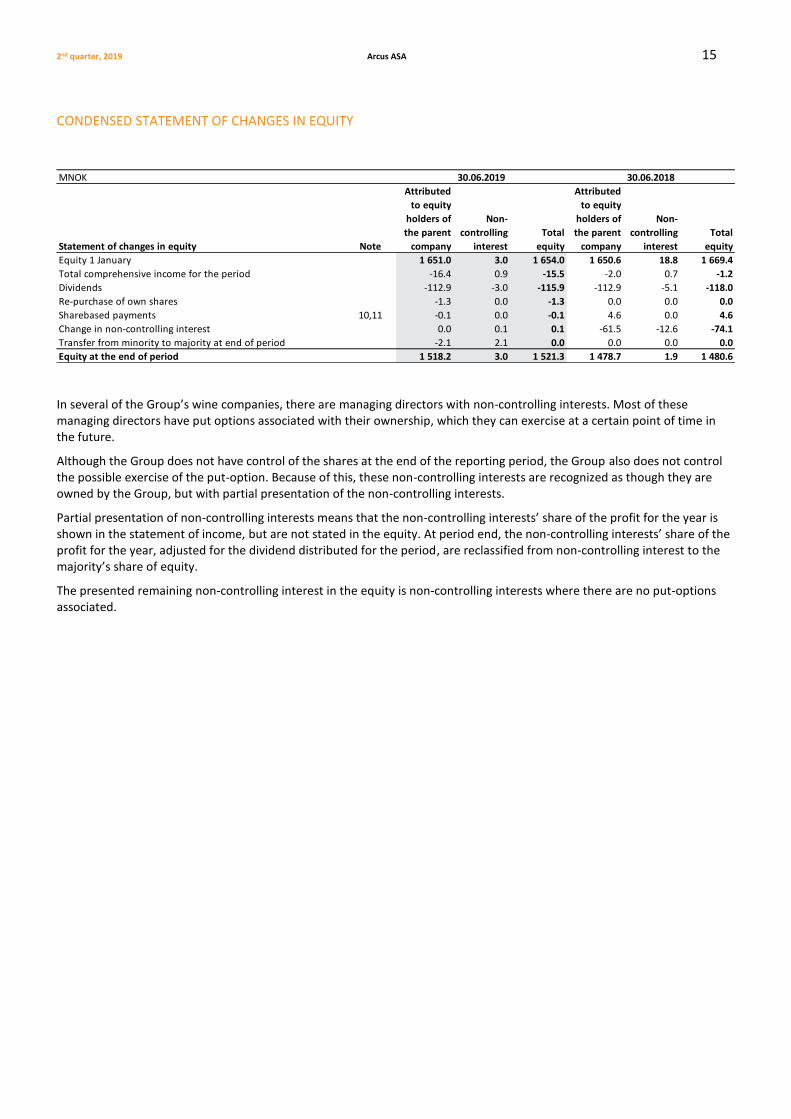
CONDENSED STATEMENT OF CHANGES IN EQUITY
In several of the Group’s wine companies, there are managing directors with non-controlling interests. Most of these managing directors have put options associated with their ownership, which they can exercise at a certain point of time in the future.
Although the Group does not have control of the shares at the end of the reporting period, the Group also does not control the possible exercise of the put-option. Because of this, these non-controlling interests are recognized as though they are owned by the Group, but with partial presentation of the non-controlling interests.
Partial presentation of non-controlling interests means that the non-controlling interests’ share of the profit for the year is shown in the statement of income, but are not stated in the equity. At period end, the non-controlling interests’ share of the profit for the year, adjusted for the dividend distributed for the period, are reclassified from non-controlling interest to the majority’s share of equity.
The presented remaining non-controlling interest in the equity is non-controlling interests where there are no put-options associated.
MNOK
Statement of changes in equity Note
Attributed
to equity
holders of
the parent
company
Non-
controlling
interest
Total
equity
Attributed
to equity
holders of
the parent
company
Non-
controlling
interest
Total
equity
Equity 1 January 1 651.0 3.0 1 654.0 1 650.6 18.8 1 669.4
Total comprehensive income for the period -16.4 0.9 -15.5 -2.0 0.7 -1.2
Dividends -112.9 -3.0 -115.9 -112.9 -5.1 -118.0
Re-purchase of own shares -1.3 0.0 -1.3 0.0 0.0 0.0
Sharebased payments 10,11 -0.1 0.0 -0.1 4.6 0.0 4.6
Change in non-controlling interest 0.0 0.1 0.1 -61.5 -12.6 -74.1
Transfer from minority to majority at end of period -2.1 2.1 0.0 0.0 0.0 0.0
Equity at the end of period 1 518.2 3.0 1 521.3 1 478.7 1.9 1 480.6
30.06.201830.06.2019
2nd quarter, 2019 Arcus ASA 16
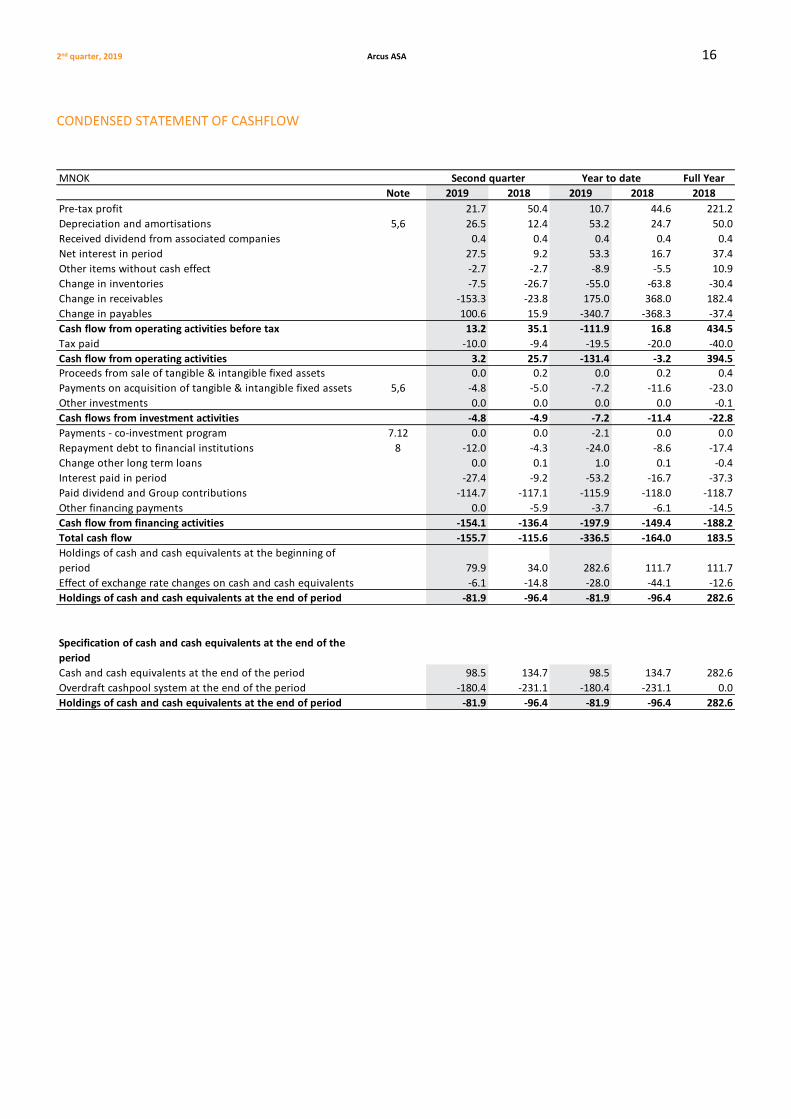
CONDENSED STATEMENT OF CASHFLOW
MNOK Full Year
Note 2019 2018 2019 2018 2018
Pre-tax profit 21.7 50.4 10.7 44.6 221.2
Depreciation and amortisations 5,6 26.5 12.4 53.2 24.7 50.0
Received dividend from associated companies 0.4 0.4 0.4 0.4 0.4
Net interest in period 27.5 9.2 53.3 16.7 37.4
Other items without cash effect -2.7 -2.7 -8.9 -5.5 10.9
Change in inventories -7.5 -26.7 -55.0 -63.8 -30.4
Change in receivables -153.3 -23.8 175.0 368.0 182.4
Change in payables 100.6 15.9 -340.7 -368.3 -37.4
Cash flow from operating activities before tax 13.2 35.1 -111.9 16.8 434.5
Tax paid -10.0 -9.4 -19.5 -20.0 -40.0
Cash flow from operating activities 3.2 25.7 -131.4 -3.2 394.5
Proceeds from sale of tangible & intangible fixed assets 0.0 0.2 0.0 0.2 0.4
Payments on acquisition of tangible & intangible fixed assets 5,6 -4.8 -5.0 -7.2 -11.6 -23.0
Other investments 0.0 0.0 0.0 0.0 -0.1
Cash flows from investment activities -4.8 -4.9 -7.2 -11.4 -22.8
Payments - co-investment program 7.12 0.0 0.0 -2.1 0.0 0.0
Repayment debt to financial institutions 8 -12.0 -4.3 -24.0 -8.6 -17.4
Change other long term loans 0.0 0.1 1.0 0.1 -0.4
Interest paid in period -27.4 -9.2 -53.2 -16.7 -37.3
Paid dividend and Group contributions -114.7 -117.1 -115.9 -118.0 -118.7
Other financing payments 0.0 -5.9 -3.7 -6.1 -14.5
Cash flow from financing activities -154.1 -136.4 -197.9 -149.4 -188.2
Total cash flow -155.7 -115.6 -336.5 -164.0 183.5
Holdings of cash and cash equivalents at the beginning of
period 79.9 34.0 282.6 111.7 111.7
Effect of exchange rate changes on cash and cash equivalents -6.1 -14.8 -28.0 -44.1 -12.6
Holdings of cash and cash equivalents at the end of period -81.9 -96.4 -81.9 -96.4 282.6
Specification of cash and cash equivalents at the end of the
period
Cash and cash equivalents at the end of the period 98.5 134.7 98.5 134.7 282.6
Overdraft cashpool system at the end of the period -180.4 -231.1 -180.4 -231.1 0.0
Holdings of cash and cash equivalents at the end of period -81.9 -96.4 -81.9 -96.4 282.6
Second quarter Year to date

2nd quarter, 2019 Arcus ASA 17
Notes NOTE 1 ACCOUNTING PRINCIPLES The Group’s condensed interim financial statements are prepared according to IAS 34 Interim Financial Reporting. The interim reporting does not include all information that is normally prepared in a full annual financial statement, and should be read in conjunction with the Group’s annual financial statement as at 31.12.2018.
The Board approved the consolidated financial statement for the year 2018 on March 20th 2019.
The accounting principles used in the Group’s interim reporting are consistent with the principles presented in the approved financial statement for 2018, except for the adoption of new standards effective as of 1 January 2019. The Group has not early adopted any other standard that has been issued but is not yet effective.
New accounting standards IFRS 16 Leases IFRS 16 Leases replaced the existing IFRS standards for leases from 1.1.2019. The new standard concerning leases has entailed a significant change in the accounting policy, as all significant leasing agreements now are capitalised. This has given an right-of-use asset on the asset side of the balance sheet, and an equivalent lease liability on the liability side. Right-of-use asset The Group recognises right-of-use assets at the commencement date of the lease (i.e., the date the underlying asset is available for use). Right-of-use assets are measured at cost, less any accumulated depreciation and impairment losses, and adjusted for any remeasurement of lease commitments. The cost of right-of-use assets includes the amount of lease liabilities recognized, and initial direct costs incurred. Unless the Group is reasonably certain to obtain ownership of the leased asset at the end of the lease term, the recognised right-of-use assets are depreciated on a straight-line basis over the shorter of its estimated useful life and the lease term. Right-of-use assets are subject to impairment. Lease Liabilities At the commencement date of the lease, the Group recognises lease liabilities measured at the present value of lease payments to be made over the lease term. The lease payments include fixed payments less any lease incentives receivable, variable lease payments that depend on an index or a rate that is known and measurable, and amounts expected to be paid under residual value guarantees. The lease payments also include the exercise price of a purchase option reasonably certain to be exercised by the Group and payments of penalties for terminating a lease, if the lease term reflects the Group exercising the option to terminate. The variable lease payments that do not depend on an index or a rate are recognised as expense in the period on which the event or condition that triggers the payment occurs. Lease Liabilities falling due within 12 months are classified as current liabilities and remaining liabilities are classified as non-current. On the implementation of IFRS 16, the Group had two implementation options: the full retrospective method or the modified retrospective method. The Group has chosen to implement IFRS 16 using the modified retrospective method, which means that the effects calculated on the implementation date were based on the remaining period of the lease as from 1.1.2019, and there was no adjustment to equity at the date of implementation. The Group, as lessee, had a number of options concerning the use of simplifications. The Group has chosen to use these simplification options, so that: • Software licences has not been included in the calculation basis. • Short-term lease agreements expected to be for shorter terms than 12 months has not been included in the calculation basis. • Insignificant lease agreements (annual charge under TEUR 5) has not been included in the calculation basis. • Any service elements in the lease charge has not been separated from the annual lease charge in the calculation basis. For further information about leasing agreements, please see the annual statement of 2018 note 16.

2nd quarter, 2019 Arcus ASA 18
The accounting effects for the Group is significant, and has effected in an increase of fixed assets of 921 MNOK in January, and reduced by depreciations during Q1 and Q2, the fixed asset balance is 891.8 MNOK higher at the of end Q2 2019 compared to end of Q2 2018. Correspondingly, the leasing liability increased by 921 MNOK in January, and reduced by leasing payments during Q1 and Q2, the leasing debt is 894.6 MNOK higher at end of Q2 2019 compared to end of Q2 2018. The effect on income statement has also been significant, and EBITDA has increased by 23.2 MNOK in Q2 2019, due to restate of leasing cost.
The Group adopted IFRS 16 using the modified retrospective method of adoption. Below is a reconciliation which show the changes in Q2 and year to date 2019;
MNOK
Note
2019 as
reported,
new IFRS 16
standard
2019 IFRS 16
restatement
2019
restated,
using old IAS
17 standard 2018
Sales 2,9 685.5 0.0 685.5 658.6
Other revenue 2 12.4 0.0 12.4 14.6
Total operating revenue 2,9 698.0 0.0 698.0 673.2
Cost of goods -417.4 0.0 -417.4 -398.3
Gross Profit 280.6 0.0 280.6 274.9
Gain on sale of fixed assets 0.0 0.0 0.0 0.2
Salaries and personnel cost -112.6 0.0 -112.6 -106.3
Advertising & Promotion expenses (A&P) -32.3 0.0 -32.3 -33.7
Other operating expenses -55.5 23.2 -78.6 -73.3
Share of profit from AC1) and JCE2) 2.3 0.0 2.3 -0.2
Other income and expenses 3 -11.5 0.0 -11.5 9.7
EBITDA 71.1 23.2 48.0 71.3
Depreciation 5,6 -24.6 -13.9 -10.6 -10.5
Amortisations 5,6 -1.9 0.0 -1.9 -1.9
Operating profit (EBIT) 44.7 9.2 35.4 58.9
Financial income 12 7.1 0.0 7.1 3.2
Financial expenses 7,10,12 -30.0 -15.6 -14.4 -11.7
Pre-tax profit 21.7 -6.4 28.1 50.4
Tax -4.7 1.4 -6.1 -10.9
Profit/loss for the year 16.9 -5.0 21.9 39.6
Second quarter

2nd quarter, 2019 Arcus ASA 19
The Group’s ability to fulfil the loan terms is not affected by the introduction of IFRS 16, as the loan agreement with SEB specifies that the loan terms must be calculated according to GAAP measures as of before introduction of IFRS 16. Further information on how the new standard will affect the Group is presented in note 15 in the Group’s annual statement for 2018. There are no other material changes with significant accounting effects since the annual statement of 2018. As of 30.06.2019, the following exchange rates have been used in translation of income and financial position figures from subsidiaries with functional currency other than NOK:
MNOK
Note
2019 as
reported,
new IFRS 16
standard
2019 IFRS 16
restatement
2019
restated,
using old IAS
17 standard 2018
Sales 2,9 1 227.5 0.0 1 227.5 1 204.4
Other revenue 2 22.6 0.0 22.6 25.8
Total operating revenue 2,9 1 250.1 0.0 1 250.1 1 230.2
Cost of goods -731.9 0.0 -731.9 -714.0
Gross Profit 518.2 0.0 518.2 516.2
Gain on sale of fixed assets 0.0 0.0 0.0 0.2
Salaries and personnel cost -221.3 0.0 -221.3 -216.4
Advertising & Promotion expenses (A&P) -56.2 0.0 -56.2 -64.8
Other operating expenses -112.4 46.6 -159.0 -149.3
Share of profit from AC1)
and JCE2)
0.4 0.0 0.4 -2.1
Other income and expenses 3 -13.0 0.0 -13.0 4.5
EBITDA 115.7 46.6 69.1 88.2
Depreciation 5,6 -49.4 -28.1 -21.3 -20.8
Amortisations 5,6 -3.8 0.0 -3.8 -3.9
Operating profit (EBIT) 62.4 18.5 43.9 63.5
Financial income 12 11.8 0.0 11.8 5.3
Financial expenses 7,10,12 -63.5 -31.4 -32.1 -24.2
Pre-tax profit 10.7 -12.9 23.6 44.6
Tax -2.8 2.8 -5.6 -11.3
Profit/loss for the year 7.9 -10.1 18.0 33.3
Year to date
Exchange rates Year end
2019 2018 2018
EUR average rate Income statement items 9.7332 9.5981 9.6033
EUR closing rate Balance sheet items 9.6842 9.4765 9.9448
SEK average rate Income statement items 0.9256 0.9460 0.9365
SEK closing rate Balance sheet items 0.9178 0.9078 0.9711
DKK average rate Income statement items 1.3038 1.2889 1.2885
DKK closing rate Balance sheet items 1.2973 1.2716 1.3319
Year to date

2nd quarter, 2019 Arcus ASA 20
NOTE 2 REVENUES The following table present the Group’s total external revenues by market:
The following tables present the segments’ total external and internal revenues by market:
1) DFTR; Duty Free Travel Retail
Group
MNOK Full Year
Total operating revenues 2019 2018 2019 2018 2018
Norway 269,7 256,9 489,9 476,4 1 076,4
Sweden 296,2 296,0 533,0 532,1 1 105,4
Denmark 32,4 23,0 60,5 54,5 145,0
Finland 58,8 60,4 99,6 104,9 225,5
Germany 8,9 7,6 13,2 10,8 55,7
USA 1,0 0,9 2,1 3,6 6,8
DFTR1) 30,3 27,7 50,7 46,4 104,3
Other 0,6 0,8 1,2 1,6 4,2
Total operating revenues 698,0 673,2 1 250,1 1 230,2 2 723,2
Second quarter Year to date
Spirits
MNOK Full Year
Total operating revenues 2019 2018 2019 2018 2018
Norway 97,7 98,2 183,1 187,4 451,3
Sweden 36,2 32,1 65,1 60,6 129,7
Denmark 32,0 22,9 59,7 53,8 143,1
Finland 10,1 7,2 18,8 13,4 34,3
Germany 8,9 7,6 13,2 10,8 55,7
USA 1,0 0,9 2,1 3,6 6,8
DFTR1) 27,9 25,0 46,6 42,2 94,6
Other 0,6 0,8 1,2 1,6 4,2
Total operating revenues 214,4 194,6 389,7 373,3 919,6
Wine
MNOK Full Year
Total operating revenues 2019 2018 2019 2018 2018
Norway 128,0 122,5 233,3 226,6 479,9
Sweden 252,1 259,1 453,9 460,0 948,2
Finland 48,0 52,0 80,1 89,3 186,9
DFTR1) 2,4 2,7 4,2 4,2 9,7
Total operating revenues 430,6 436,2 771,7 780,1 1 624,7
Distribution
MNOK Full Year
Total operating revenues 2019 2018 2019 2018 2018
Norway 81,7 77,6 150,2 143,1 307,7
Total operating revenues 81,7 77,6 150,2 143,1 307,7
Second quarter Year to date
Second quarter Year to date
Second quarter Year to date

2nd quarter, 2019 Arcus ASA 21
NOTE 3 OTHER INCOME AND EXPENSES Other income and expenses comprises significant positive and negative non-recurring items and restructuring costs. The main purpose of this item is to show these significant non-recurring and non-periodic items, so that the development and comparability of the ordinary items presented in the statement of income are more relevant for the activities.
Other income and expenses during Q2 are mainly related to termination payment agreements.
Group
MNOK Full Year
Other income and expenses 2019 2018 2019 2018 2018
Salary & personnel cost -7.0 -1.6 -8.5 -6.8 -14.5
Other operating expenses -4.5 11.3 -4.5 11.3 9.2
Other income and expenses -11.5 9.7 -13.0 4.5 -5.3
Spirits
MNOK Full Year
Other income and expenses 2019 2018 2019 2018 2018
Salary & personnel cost 0.0 -0.2 -0.1 -0.5 -1.7
Other operating expenses -0.8 -0.5 -0.8 -0.5 -0.1
Other income and expenses -0.8 -0.7 -1.0 -1.0 -1.8
Wine
MNOK Full Year
Other income and expenses 2019 2018 2019 2018 2018
Salary & personnel cost -5.7 -0.9 -6.1 -5.3 -10.6
Other operating expenses -1.0 0.0 -1.0 0.0 -1.2
Other income and expenses -6.7 -0.9 -7.2 -5.3 -11.8
Distribution
MNOK Full Year
Other income and expenses 2019 2018 2019 2018 2018
Salary & personnel cost -1.3 -0.1 -1.2 -0.1 -0.4
Other operating expenses 0.0 0.0 0.0 0.0 0.0
Other income and expenses -1.3 -0.1 -1.2 -0.1 -0.4
Other
MNOK Full Year
Other income and expenses 2019 2018 2019 2018 2018
Salary & personnel cost 0.0 -0.5 -1.1 -1.0 -1.9
Other operating expenses -2.6 11.8 -2.6 11.8 10.6
Other income and expenses -2.6 11.3 -3.7 10.9 8.7
Second quarter Year to date
Second quarter Year to date
Second quarter Year to date
Second quarter Year to date
Second quarter Year to date

2nd quarter, 2019 Arcus ASA 22
NOTE 4 SEGMENT INFORMATION
MNOK Full Year
External sales 2019 2018 2019 2018 2018
Spirits 179.2 156.6 318.5 299.1 766.8
Wine 424.7 429.5 761.1 768.7 1 603.3
Distribution 70.5 65.3 128.2 120.6 261.1
Other 11.2 7.2 19.7 16.0 41.5
Total external sales 685.5 658.6 1 227.5 1 204.4 2 672.6
MNOK Full Year
Sales between segments 2019 2018 2019 2018 2018
Spirits 0.0 -0.9 -0.8 -1.9 -4.3
Wine 0.4 0.6 0.7 1.1 1.5
Distribution 2.6 2.9 5.2 5.5 11.3
Eliminations -3.0 -2.5 -5.1 -4.8 -8.4
Total sales revenue between segments 0.0 0.0 0.0 0.0 0.0
MNOK Full Year
External other revenue 2019 2018 2019 2018 2018
Spirits 2.2 1.3 3.9 2.9 8.3
Wine 3.9 6.2 6.8 10.3 17.2
Distribution 5.6 6.7 10.7 12.0 23.6
Other 0.7 0.4 1.2 0.5 1.5
Total external other revenue 12.4 14.6 22.6 25.8 50.6
MNOK Full Year
Other revenue between segments 2019 2018 2019 2018 2018
Spirits 33.0 37.5 68.1 73.2 148.9
Wine 1.6 0.0 3.1 0.0 2.8
Distribution 3.1 2.7 6.1 4.9 11.8
Other 44.6 44.0 88.4 87.3 175.1
Eliminations -82.3 -84.2 -165.7 -165.4 -338.6
Total other revenue between segments 0.0 0.0 0.0 0.0 0.0
MNOK Full Year
EBITDA 2019 2018 2019 2018 2018
Spirits 20.3 17.0 30.1 28.2 142.8
Wine 36.8 43.3 63.6 64.6 169.7
Distribution 0.8 4.2 -1.4 0.0 12.4
Other -9.9 6.8 -23.2 -4.6 -17.5
Eliminations 23.1 0.0 46.5 0.0 0.0
Total EBITDA 71.1 71.3 115.7 88.2 307.3
MNOK Full Year
EBIT 2019 2018 2019 2018 2018
Spirits 14.0 10.8 17.6 16.0 118.1
Wine 36.1 42.7 62.1 63.4 167.1
Distribution -1.9 1.5 -6.9 -5.6 1.1
Other -11.4 5.2 -26.3 -7.7 -23.8
Eliminations 7.9 -1.3 15.9 -2.6 -5.2
Total EBIT 44.7 58.9 62.4 63.5 257.3
Second quarter Year to date
Second quarter Year to date
Second quarter Year to date
Year to date
Second quarter Year to date
Second quarter Year to date
Second quarter

2nd quarter, 2019 Arcus ASA 23
NOTE 5 FIXED ASSETS
Fixed assets are significantly influenced by the new IFRS 16 standard. The addition of tangible assets via financial lease, is all
due calculated leasing rights, based on the new accounting principles from the new standard.
The most significant lease agreement is the leasing of property at Gjelleråsen, which is depreciated over 19 years (until end
of 2037). The other right-of-use assets are depreciated over 1-33 years.
MNOK Full Year
Total profit for the year 2019 2018 2019 2018 2018
Spirits 8.7 -9.5 -22.7 -36.5 89.0
Wine 26.0 32.4 44.7 48.2 116.3
Distribution -1.5 1.5 -5.1 -4.0 -3.1
Other -10.9 3.5 -22.9 -6.0 -30.7
Eliminations -5.3 -1.0 -9.4 -2.9 7.5
Total profit for the year 17.0 27.0 -15.5 -1.2 179.0
Second quarter Year to date
MNOK Full Year
Fixed Assets 2019 2018 2019 2018 2018
Purchase cost at beginning of period 1 578.1 648.1 658.0 643.7 643.7
Additions tangible fixed assets 4.0 4.2 6.1 10.1 19.8
Additions tangible fixed assets via financial lease -0.4 0.0 920.1 0.0 3.1
Transferred from assets under construction -0.3 -0.7 -0.3 -0.7 -2.0
Reclassifications 0.0 0.0 -0.4 0.0 0.0
Purchase price, disposed assets -3.6 0.0 -4.8 -0.7 -6.1
Translation differences -0.1 -0.5 -1.0 -1.3 -0.4
Purchase cost at end of period 1 577.7 651.1 1 577.7 651.1 658.0
Accumulated depreciation at beginning of period -363.2 -321.0 -342.2 -313.8 -313.8
Accumulated depreciation, disposed assets 3.5 0.0 4.7 0.7 6.1
Ordinary depreciation in period -22.5 -8.6 -45.6 -17.2 -34.8
Reclassifications 0.0 0.0 0.4 0.0 0.0
Translation differences 0.2 0.5 0.6 1.1 0.4
Accumulated depreciation at end of period -382.1 -329.2 -382.1 -329.2 -342.2
Book Value at end of period 1 195.6 321.9 1 195.6 321.9 315.8
Specification of fixed assets
MNOK Full Year
Fixed Assets 2019 2018 2019 2018 2018
Land, buildings and other real estate 886.0 0.0 886.0 0.0 0.0
Machinery and equipment 285.6 299.6 285.6 299.6 293.3
Fixtures and fittings, tools, office equipment etc. 18.7 18.1 18.7 18.1 17.7
Assets under construction 5.4 4.1 5.4 4.1 4.9
Book Value at end of period 1 195.6 321.9 1 195.6 321.9 315.8
Second quarter Year to date
Second quarter Year to date

2nd quarter, 2019 Arcus ASA 24
NOTE 6 INTANGIBLE ASSETS
NOTE 7 LIABILITIES AT FAIR VALUE THROUGH PROFIT AND LOSS
Liabilities at fair value through profit and loss consist of put options regarding minority shares in companies included in the Wine business, held by non-controlling interests.
MNOK Full Year
Intangible assets 2019 2018 2019 2018 2018
Purchase cost at beginning of period 2 046.7 2 036.8 2 074.1 2 066.4 2 066.4
Addition of intangible assets 0.8 0.9 1.1 1.5 3.2
Transferred from assets under construction 0.3 0.7 0.3 0.7 2.0
Translation differences -1.7 -15.6 -29.3 -46.0 2.4
Purchase cost at end of period 2 046.2 2 022.7 2 046.2 2 022.7 2 074.1
Acc. depreciation and amortizations at beginning of period -193.9 -178.6 -190.2 -175.0 -175.0
Depreciation in period -1.8 -1.8 -3.7 -3.6 -7.5
Amortisations in period -1.9 -1.9 -3.9 -3.9 -7.7
Translation differences -0.1 0.1 0.1 0.2 0.0
Acc. depreciation and amortizations at end of period -197.7 -182.3 -197.7 -182.3 -190.2
Book Value at end of period 1 848.5 1 840.4 1 848.5 1 840.4 1 883.9
Specification of intangible assets
MNOK Full Year
Intangible assets 2019 2018 2019 2018 2018
Goodwill 1 025.3 1 015.4 1 025.3 1 015.4 1 042.1
Brands 798.9 797.6 798.9 797.6 815.0
Software 24.2 27.4 24.2 27.4 26.8
Book Value at end of period 1 848.5 1 840.4 1 848.5 1 840.4 1 883.9
Year to date
Second quarter Year to date
Second quarter
MNOK Full Year
Liabilities at fair value through profit and loss 2019 2018 2019 2018 2018
Book value at beginning of period 69.8 0.0 74.2 0.0 0.0
Additions in period 0.0 67.9 0.0 67.9 67.9
Changes in value during period -1.2 0.0 -3.2 0.0 2.6
Interest during period 0.0 0.0 0.1 0.0 0.1
Translation differences -0.7 0.0 -3.1 0.0 3.7
Book value at end of period 68.0 67.9 68.0 67.9 74.2
From this;
Current liability 0.0 0.0 0.0 0.0 0.0
Non-current liability 68.0 67.9 68.0 67.9 74.2
Total liabilities through profit and loss 68.0 67.9 68.0 67.9 74.2
Second quarter Year to date

2nd quarter, 2019 Arcus ASA 25
NOTE 8 DEBT TO FINANCIAL INSTITUTIONS
Liabilities to financial institutions, including financial leasing
New debt in the period is all due to calculated leasing liabilities, based on the new accounting principles from the new IFRS
16 standard.
MNOK Full Year
Debt to financial institutions 2019 2018 2019 2018 2018
Debt at beginning of period 1 774.7 883.3 897.8 933.2 933.2
New debt in period 0.0 0.0 920.3 0.0 3.1
Repayments in period -12.0 -4.3 -24.1 -8.6 -17.4
Translation differences -9.1 -23.0 -40.4 -68.6 -21.1
Debt to financial institutions at end of period 1 753.6 856.0 1 753.6 856.0 897.8
Capitalized borrowing costs at beginning of period -4.3 -5.9 -4.8 -6.5 -6.5
Amortized borrowing costs during period 0.4 0.4 0.8 0.8 1.6
Translation differences 0.0 0.1 0.1 0.3 0.1
Capitalized borrowing costs at end of period -3.9 -5.4 -3.9 -5.4 -4.8
Book value debt to financial institutions at end of period 1 749.7 850.6 1 749.7 850.6 893.0
Current liabilities to financial institutions, including financial leasing and bank overdraft
MNOK Full Year
Liabilities to financial institutions 2019 2018 2019 2018 2018
Current portion of non-current loans 0.0 0.0 0.0 0.0 0.0
Current portion of non-current financial leasing 48.8 12.0 48.8 12.0 18.1
Bank overdraft 180.4 231.1 180.4 231.1 0.0
Current liabilities to financial institutions at end of period 229.2 243.2 229.2 243.2 18.1
Second quarter
Second quarter Year to date
Year to date

2nd quarter, 2019 Arcus ASA 26
NOTE 9 TRANSACTIONS WITH RELATED PARTIES
In addition to subsidiaries and associated companies, the Group’s related parties are defined as the owners, all members of the Board of Directors and Group senior management, as well as companies in which any of these parties have either controlling interests, board appointments or are senior staff. All transactions with related parties that are not eliminated in the Group accounts are presented below:
Sale and purchase transactions with related parties
MNOK Full Year
Purchase of goods and services 2019 2018 2019 2018 2018
Tiffon SA 12.5 12.2 30.2 22.1 45.5
Hoff SA 6.0 7.3 11.9 13.5 21.2
Destil leriveien 11 AS 0.0 7.5 0.0 27.6 27.6
Total purchase transactions 18.6 27.1 42.1 63.2 94.2
MNOK Full Year
Sale of goods and services 2019 2018 2019 2018 2018
Tiffon SA 0.0 2.0 0.0 2.4 5.9
Total sale transactions 0.0 2.0 0.0 2.4 5.9
Receivables and debt at end of period
MNOK 30.06.2019 30.06.2018 31.12.2018Current receivables from related partiesTiffon SA 0.0 0.9 2.0
Total current receivables from related parties 0.0 0.9 2.0
MNOK 30.06.2019 30.06.2018 31.12.2018
Current debt to related parties
Tiffon SA 5.0 4.0 7.1
Hoff SA 1.4 2.2 0.5
Total current debt to related parties 6.3 6.2 7.6
Second quarter Year to date
Second quarter Year to date

2nd quarter, 2019 Arcus ASA 27
NOTE 10 FINANCIAL INSTRUMENTS
1) Prepayments are not defined as financial assets according to IFRS, and hence not included in the figures. 2) Accrued costs and public taxes are not defined as fincanial liabilities according to IFRS, and hence not included in the figures.
There has not been any transfers of financial assets or liabilities between levels during the period.
Categorisations of financial assets and liabilities
MNOK
Financial
instruments
at fair value
through
profit and
loss
Financial
instruments
at amortized
cost
Financial
instruments
at fair value
through OCI
Total book
value at end
of period
Assets
Other investments in shares 0.0 0.2 0.0 0.2
Other long term receivables 0.0 0.5 0.0 0.5
Accounts receivables 0.0 1 079.3 0.0 1 079.3
Other receivables1) 0.0 66.8 0.0 66.8
Cash and cash equivalents 0.0 98.5 0.0 98.5
Total financial assets as of Second quarter 2019 0.0 1 245.3 0.0 1 245.3
Total financial assets as of Second quarter 2018 0.0 1 251.9 0.0 1 251.9
Liabilities
Liabilities to financial institutions 0.0 1 749.7 0.0 1 749.7
Liabilities at fair value through profit and loss 68.0 0.0 0.0 68.0
Accounts payable 0.0 503.6 0.0 503.6
Other current debt2) 0.4 15.0 0.0 15.4
Total financial liabilities as of Second quarter 2019 68.4 2 268.3 0.0 2 336.7
Total financial liabilities as of Second quarter 2018 68.1 1 404.7 0.0 1 472.8
Fair value hierarchy
Assets
MNOK Level 1 Level 2 Level 3 Book Value
Currency derivatives 0.0 0.0 0.0 0.0
Total financial assets 0.0 0.0 0.0 0.0
Liabilities
MNOK Level 1 Level 2 Level 3 Book Value
Liabilities at fair value through profit and loss 0.0 0.0 68.0 68.0
Currency derivates 0.4 0.4 0.0 0.8
Total financial liabilities 0.4 0.4 68.0 68.8

2nd quarter, 2019 Arcus ASA 28
At the end of the period, liabilities measured at fair value, categorized at level 3 in the fair value hierarchy is related to put-options held by non-controlling interests in wine companies in Norway and Sweden. The liabilities for these put-options are estimated on the basis of pricing mechanisms that underlie the shareholder agreements, discounted to the balance sheet date. The main parameters of price mechanisms share value development measured by EBIT (earnings) until the estimated due date, multiplied by a marketbased multiple. As a basis for EBIT, the Group's budgets and long term plans towards expected maturity date is used.
NOTE 11 OPTIONS The General Meeting has granted options to the Group Executive Management and a few other key employees. The table below show outstanding options from 2017, 2018 and 2019. During Q2 2019, a total of 2,195,086 options has been issued. As of end of Q2 2019, the Group Excecutive Management holds 3,481,558 options. The share options has a vesting period of three years and the options can be exercised during the next two years. The options will expire after five years.
Changes in outstanding options are shown in the table below;
Changes financial liabilities, level 3
MNOK Full Year
2019 2018 2019 2018 2018
Financial l iabilities, level 3, at beginning of period 69.8 0.0 74.2 0.0 0.0
Fair value at the first time of recognition 0.0 67.9 0.0 67.9 67.9
Changes in value during the period -1.2 0.0 -3.2 0.0 2.6
Interest during period 0.0 0.0 0.1 0.0 0.1
Translation differences -0.7 0.0 -3.1 0.0 3.7
Financial liabilities, level 3 at end of period 68.0 67.9 68.0 67.9 74.2
Second quarter Year to date
Number of options Full Year
2019 2018 2019 2018 2018
Change in number of options:
Outstanding options beginning of period 2 050 660 1 229 304 2 417 500 1 229 304 1 229 304
Issued during period 2 195 086 1 484 923 2 195 086 1 484 923 1 484 923
Forfeited during the period 0 -41 260 -366 840 -41 260 -296 727
Outstanding options end of period 4 245 746 2 672 967 4 245 746 2 672 967 2 417 500
Second quarter Year to date
Option calculation assumptions:
Options
#2017
Options
#2018
Options
#2019
Grant date
May 4th
2017
April 11th
2018
April 11th
2019
Total outstanding options at end of period: 871 710 1 178 950 2 195 086
Vesting period - Start May 2017 April 2018 April 2019
Vesting period - End May 2020 April 2021 April 2022
Redemption period - Start May 2020 April 2021 April 2022
Redemption period - End May 2022 April 2023 April 2024
Share price on the allocation date NOK 40.05 43.70 38.80
Share price on the balance sheet date NOK 37.50 37.50 37.50
Redemption price - minimum NOK 51.53 45.22 40.52
Redemption price - maximum NOK 143.70 131.10 116.40
Risk-free interest rate % 1.25 % 1.25 % 1.25 %
Volatil ity % 20.0 % 20.0 % 20.0 %
Expected dividend % 3.6 % 3.6 % 3.6 %

2nd quarter, 2019 Arcus ASA 29
NOTE 12 FINANCIAL INCOME AND EXPENSES
The significant increase of interest costs during Q2 2019 is due to calculated interest cost from capitalized leasing rights according to the new leasing standard (IFRS 16).
Other financial expenses during Q2 is mainly consisting of amortized borrowing costs and agio effects.
NOTE 13 OTHER EVENTS Events after the close of Q2 2019
No significant other events have occurred between the close of Q2 and the date on which Arcus’s interim financial statements for Q2 2019 were approved. This applies to events that would have provided knowledge of factors present at the close of Q2 2019, or events concerning matters that have arisen since the close of Q2 2019.
MNOK Full Year
2019 2018 2019 2018 2018
Interest income 4.8 3.1 8.7 5.2 12.9
Other financial income 2.2 0.2 3.2 0.2 1.6
Total financial income 7.1 3.2 11.8 5.3 14.5
Interest cost -27.9 -9.2 -53.7 -16.7 -37.4
Other financial expenses -2.2 -2.6 -9.9 -7.5 -13.2
Total financial expenses -30.0 -11.7 -63.5 -24.2 -50.6
Net financial profit/loss -23.0 -8.5 -51.7 -18.8 -36.1
Second quarter Year to date

2nd quarter, 2019 Arcus ASA 30
Alternative Performance Measures (APM) In the discussion of the reported operating results, financial position, cash flows and notes, the Group refers to certain alternative performance measures (APM), which are not defined by generally accepted accounting principles (GAAP) such as IFRS.
Arcus ASA management makes regular use of these alternative performance measures and is of the opinion that this information, along with comparable GAAP measures, is useful to investors who wish to evaluate the company’s operating performance, ability to repay debt and capability to pursue new business opportunities. Such alternative performance measures should not be viewed in isolation or as an alternative to the equivalent GAAP measure.
Gross Profit
Gross profit is defined by Arcus ASA as total operating revenue minus the cost of goods sold.
Gross margin = Gross profit / Total revenue
Other income and expenses
To provide more information in the Group’s consolidated income statement, significant positive and negative non-recurring items and restructuring costs are separated out to a separate line in the statement of income called other income and expenses. Other income and expenses are presented net on this income statement line. See also detailed specifications of what these items include in note 3 relating to the individual line items.
Group
MNOK Full Year
2019 2018 2019 2018 2018
Total operating revenues 698.0 673.2 1 250.1 1 230.2 2 723.2
Cost of goods -417.4 -398.3 -731.9 -714.0 -1 577.3
Gross Profit 280.6 274.9 518.2 516.2 1 145.9
Spirits
MNOK Full Year
2019 2018 2019 2018 2018
Total operating revenues 214.4 194.6 389.7 373.3 919.6
Cost of goods -109.1 -94.7 -190.9 -176.2 -448.0
Gross Profit 105.3 99.9 198.8 197.2 471.6
Wine
MNOK Full Year
2019 2018 2019 2018 2018
Total operating revenues 430.6 436.2 771.7 780.1 1 624.7
Cost of goods -333.5 -335.9 -596.0 -599.0 -1 244.3
Gross Profit 97.1 100.3 175.7 181.1 380.4
Distribution
MNOK Full Year
2019 2018 2019 2018 2018
Total operating revenues 81.7 77.6 150.2 143.1 307.7
Cost of goods 0.0 0.0 0.0 0.0 0.0
Gross Profit 81.7 77.6 150.2 143.1 307.7
Second quarter Year to date
Second quarter Year to date
Second quarter Year to date
Second quarter Year to date

2nd quarter, 2019 Arcus ASA 31
EBITDA and EBITDA Adjusted
EBITDA is defined by Arcus ASA as operating profit before depreciation, write down and amortisation.
EBITDA adjusted is defined by Arcus ASA as operating profit before depreciation, amortisation and other income and expenses.
EBITDA-margin = EBITDA/Total operating revenue
EBITDA-margin adjusted = EBITDA adjusted /Total operating revenue
Below is a reconciliation from EBIT to EBITDA adjusted:
Other definitions alternative performance measures shown in key figures table:
Group
MNOK Full Year
EBITDA adjusted 2019 2018 2019 2018 2018
EBIT 44.7 58.9 62.4 63.5 257.3
Depreciation, amortisations and write downs 26.5 12.4 53.2 24.7 50.0
EBITDA 71.1 71.3 115.7 88.2 307.3
Other income and expenses 11.5 -9.7 13.0 -4.5 5.3
EBITDA adjusted 82.6 61.6 128.7 83.7 312.6
Spirits
MNOK Full Year
EBITDA adjusted 2019 2018 2019 2018 2018
EBIT 14.0 10.8 17.6 16.0 118.1
Depreciation, amortisations and write downs 6.3 6.1 12.5 12.2 24.7
EBITDA 20.3 17.0 30.1 28.2 142.8
Other income and expenses 0.8 0.7 1.0 1.0 1.8
EBITDA adjusted 21.1 17.6 31.1 29.2 144.6
Wine
MNOK Full Year
EBITDA adjusted 2019 2018 2019 2018 2018
EBIT 36.1 42.7 62.1 63.4 167.1
Depreciation, amortisations and write downs 0.7 0.6 1.5 1.2 2.6
EBITDA 36.8 43.3 63.6 64.6 169.7
Other income and expenses 6.7 0.9 7.2 5.3 11.8
EBITDA adjusted 43.5 44.2 70.7 69.9 181.5
Distribution
MNOK Full Year
EBITDA adjusted 2019 2018 2019 2018 2018
EBIT -1.9 1.5 -6.9 -5.6 1.1
Depreciation, amortisations and write downs 2.7 2.8 5.5 5.6 11.3
EBITDA 0.8 4.2 -1.4 0.0 12.4
Other income and expenses 1.3 0.1 1.2 0.1 0.4
EBITDA adjusted 2.1 4.3 -0.2 0.1 12.7
Parent Company
MNOK Full Year
EBITDA adjusted 2019 2018 2019 2018 2018
EBIT -11.4 5.2 -26.3 -7.7 -23.8
Depreciation, amortisations and write downs 1.6 1.5 3.1 3.1 6.2
EBITDA -9.9 6.8 -23.2 -4.6 -17.5
Other income and expenses 2.6 -11.3 3.7 -10.9 -8.7
EBITDA adjusted -7.3 -4.6 -19.5 -15.5 -26.2
Second quarter Year to date
Second quarter Year to date
Second quarter Year to date
Second quarter Year to date
Second quarter Year to date

2nd quarter, 2019 Arcus ASA 32
Equity ratio Equity ratio = Total equity/Total equity and liabilities Net interest bearing debt Net interest bearing debt = Liabilities to financial institutions + finance lease liabilities + bank overdraft - Cash and cash equivalents:
The increase of Net Interest Bearing Debt is due to calculated leasing liabilities according to the new leasing standard, IFRS 16.
MNOK Full Year
Net interest bearing debt 30.06.2019 30.06.2018 31.12.2018
Non-current liabilities to financial institutions 684.5 675.4 723.5
Book value of Capitalized arrangement fees 3.9 5.4 4.8
Non-current finance lease liabilities 1 016.5 163.1 151.4
Bank Overdraft 180.4 231.1 0.0
Current finance lease liabilities 48.8 12.0 18.1
Cash and cash equivalents -98.5 -134.7 -282.6
Net interest bearing debt 1 835.5 952.4 615.1
Second quarter

2nd quarter, 2019 Arcus ASA 33
Organic growth Organic revenue growth represent the Segment’s and the Group’s revenues, adjusted for currency effects and structural changes, such as acquisitions or divestitures.
Group
MNOK
Total revenues 2019 2018 2019 2018
Reported total operating revenues 698.0 673.2 1 250.1 1 230.2
Currency effects 0.0 -1.3 0.0 -9.1
Structural changes 0.0 0.0 0.0 0.0
Baseline organic growth 698.0 671.9 1 250.1 1 221.1
Spirits
MNOK
Total revenues 2019 2018 2019 2018
Reported total operating revenues 214.4 194.6 389.7 373.3
Currency effects 0.0 0.3 0.0 -0.2
Structural changes 0.0 0.0 0.0 0.0
Baseline organic growth 214.4 194.9 389.7 373.1
Wine
MNOK
Total revenues 2019 2018 2019 2018
Reported total operating revenues 430.6 436.2 771.7 780.1
Currency effects 0.0 -1.6 0.0 -8.6
Structural changes 0.0 0.0 0.0 0.0
Baseline organic growth 430.6 434.6 771.7 771.5
Distribution
MNOK
Total revenues 2019 2018 2019 2018
Reported total operating revenues 81.7 77.6 150.2 143.1
Currency effects 0.0 0.0 0.0 0.0
Structural changes 0.0 0.0 0.0 0.0
Baseline organic growth 81.7 77.6 150.2 143.1
Second quarter Year to date
Second quarter Year to date
Second quarter Year to date
Second quarter Year to date

2nd quarter, 2019 Arcus ASA 34
Contact information CONTACT PERSON Per Bjørkum, Group Director Communications and IR
Mobile: +47 922 55 777
E-mail: [email protected]
VISITING ADDRESS: Destilleriveien 11, Hagan, Norway
MAIL ADDRESS: Postboks 64, N-1483 Hagan, Norway
TELEPHONE: +47 67 06 50 00
WEB https://www.arcus.no/en/investor
ANNUAL REPORT
ANNUAL REPORT 2018
Arcus ASA
FACEBOOK: ArcusGruppen


