45
Entry Level Curriculum 4 th -6 th July 2011 Week 15
| Date post: | 28-Dec-2015 |
| Category: |
Documents |
| Upload: | ethan-kelly |
| View: | 214 times |
| Download: | 0 times |

Entry Level Curriculum
4th -6th July 2011Week 15

Agenda - Week 1510:00-10:10 Welcome
10:10-10:20 Starter activity
10:20-11:10 part 2 (scientific enquiry standards)
Standard 2: Process and communicate information
11:10-11:45 Standard 3:Handle equipment and make measurements
11:45– 12:00 Break
12:00– 1:30
Micro-teaching

Tea bag rocket
Starter Activity H.O. (1)
http://www.youtube.com/watch?v=UfRBjDBd11w&feature=related

Scientific Enquiry Standards
(1)- Use methods of Scientific investigation
العلمي االستقصاء أساليب يستخدم
(2)- Process and communicate informationوايصالها المعلومات بمعالجة يقوم
(3)- Handle equipment and make measurementsقياسها وينفذ االجهزة يستعمل

Do you remember the Scientific Enquiry Standards ?

(2)

Information Processing is the change (processing) of information in
any manner.المعلومات .معالجة طريقة: بأي المعلومات تغيير هو
Information Communicating - using words or graphic symbols to
describe an action, object or event.
Example: Describing the change in height of a plant over time in writing or
through a graph.
المعلومات لوصف: إيصال تصويرية رموز أو كلمات استخدام هو
. الحدث أو الكائن ، العمل
الوقت : مرور مع نبات ارتفاع في التغيير وصف المثال سبيل على
البياني الرسم أو الكتابة خالل من

Scientists collect data in the course of their work and record and represent this data in many ways—in formats such as tables, graphs, or diagrams. Data can be recorded in different ways depending on the nature of the investigation and what the scientist is trying to learn. The way in which data are organized plays a significant role in interpreting and drawing conclusions from the data. Reorganizing data in a new way can often lead to new findings.The ability to interpret data is particularly important in science, where information is often communicated and summarized visually in tables, graphs, and diagrams.
وتمثيل بتسجيل ويقوموا عملهم سياق في البيانات العلماء يجمع
وتبعا العلمي التحقيق لطبيعة تبعا مختلفة بطرق البيانات هذه
. معرفته العلماء يحاول لما
،الجداول مثل متنوعة صيغ في البيانات تسجيل يمكن
. البيانية الرسوم أو والمخططات،
تفسير في كبيرا دورا تلعب البيانات تنظيم بها يتم التي الطريقة
. البيانات من النتائج واستخالص
نتائج إلى يؤدي ما غالبا جديدة بطريقة البيانات تنظيم إعادة
جديدة.
،العلم مجال في خاصة أهمية له البيانات تفسير على القدرة
صورة في بصريا وتلخيصها المعلومات إيصال يتم ما غالبا حيث
. ومخططات بيانية ورسومات جداول

Tables, graphs, charts, and diagrams are designed to help share data and
information in quick and easy to understand ways. They used to present
large amounts of information in a concise manner. Visual representations
organize information, draw attention to relationships, and explain
information that is difficult to describe in words. They can be used to make
assignments for school such as science fair projects interesting and clear.
والمخططات البيانية والرسوم الجداول صممت وقد
في : لتساعد
وسريعة 1. سهلة بطريقة والمعلومات البيانات تبادل
الفهم.
بطريقة 2. المعلومات من كبيرة كميات تقديم
مختصرة.
.3 ، العالقات إلى االنتباه ولفت ، المعلومات تنظيم
. بكلمات وصفها يصعب التي المعلومات وتشرح
وواضحة 4. ممتعة مدرسية كواجبات استخدامها يمكن
. العادلة العلمية المشاريع مثل
Why tables, graphs and diagrams?

Charts: البيانية الرسوم
In science, charts normally show lists of numbers or other information that can be compared. They are a great tool for keeping track of information while you are working on your project. Charts are usually used to represent simple two variable data, such as Bar charts or pie charts.
غيرها أو أرقام قوائم شكل على تظهر المخططات عادة ، العلوم مجال في
. أثناء المعلومات لتتبع جيدة أداة فهي مقارنتها يمكن التي المعلومات من
. المشروع على العمل
مثل اثنين، متغيرين من بيانات لتمثيل البيانية الرسوم تستخدم ما وعادة
. دائري شريط المخططات أو الخرائط
Interpreting data for communicating results:

Graphs : البيانية الرسومIn science, graphs normally show comparisons of two or more things. Graphs usually contain X and Y -axis. One example of graphs that are often used in science fair projects is line graphs.
أو اثنين بين مقارنة شكل على عادة تظهر البيانية الرسوم ، العلوم مجال في
. األشياء من أكثر
المحورين تتضمن ما عادة البيانية ، Xالرسوم Y.
: هو عادلة علمية مشاريع في تستخدم ما غالبا التي البيانية الرسوم على مثالLine graph: Normally used to show how things change over time, a line graph
may work better with your project. Use a line graph if you measured something each minute, hour, day or week.
مرور : مع تتغير األمور أن كيف إلظهار عادة تستخدم الخطي البياني الرسم
. البياني الرسم استخدام يمكن المشروع مع أفضل بشكل ويعمل ، الوقت
. أسبوع كل أو يوم كل ، ساعة كل دقيقة، كل ما شيء قياس عند الخطي
Interpreting data for communicating results:

Tables : الجداول Table is:An organizer for an investigation A way of presenting data in a report An organizer to assist comprehension and thinking. For investigations with no numerical data it is usually better to use a table to present the data.Help organize information so it is easier to see patterns and relationships.
علمي تحقيق إلجراء منظم هو
تقرير في البيانات لعرض طريقة
. والتفكير الفهم على للمساعدة منظم هو
من فإنه رقمية، بيانات لها يوجد ال التي العلمية التحقيقات حالة في
األفضل
البيانات لعرض جدول استخدام
األنماط نرى أن السهل من أنه بحيث المعلومات تنظيم في مساعدة
والعالقات.
Interpreting data for communicating results:

Diagrams : البيانية المخططات
A drawing intended to explain how something works; a drawing showing the relation between the parts Diagrams are important specially in arranging relationships of ideas.
Help students understand concepts much better.
توضح بحيث ؛ الشيء يعمل كيف شرح إلى تهدف رسومات هي
األجزاء بين العالقة
. األفكار بين العالقات ترتيب في مهمة البيانية المخططات
بشكل المفاهيم فهم على الطالب تساعد البيانية المخططات
أفضل.
Interpreting data for communicating results:

Do you remember the names of the following diagrams?
هل تستطيع تذكر أسماء المخططات التالية
Try حاول

Appointment clock

Classification: التصنيف
Sorting objects or phenomena into groups based on students observations.
Grouping objects or events is a way of imposing order based on similarities, differences, and interrelationships.
بناء مجموعات إلى الظواهر أو األشياء فرز هو. الطلبة مالحظات على
هي مجموعات إلى األحداث أو الكائنات تقسيمالتشابه أوجه أساس على النظام لفرض وسيلة
. المتبادلة والعالقات واالختالف،
There are several different methods of classification.
: للتصنيف مختلفة أساليب عدة هناك

Classification: التصنيف
Serial ordering : is the simplest method , objects are placed into rank order based on some property.For example, students can be serial ordered according to height.
التسلسلي في: الترتيب الكائنات وضع يتم حيث للتصنيف طريقة أبسط هي
. الخصائص بعض على بناء مرتب نظام
. االرتفاع / المسلسل ألمر وفقا تكون أن للطالب يمكن مثال
Binary classification : a set of objects is simply divided into two subsets.For example, animals can be classified into two groups: those with backbones and those without backbones.
الثنائي فرعييتين : التصنيف مجموعتين الى تنقسم الكائنات من مجموعة
فقرى / : عمود لها حيوانات مجموعتين إلى الحيوانات تصنيف يمكن مثال
فقرى . عمود لها ليس وحيوانات

Classification: التصنيف
Multi-stage classification : is constructed by performing consecutive binary classifications on a set of objects and then on each of the ensuing subsets. For example: some local animals using physical and/or behavioral similarities and differences.
المتعددة المراحل ذو التصنيفات: التصنيف تنفيذ طريق عن شيدت التي هي
الفرعية المجموعات كل على ثم الكائنات، من مجموعة على المتتالية الثنائية
. ذلك تلت التي
التشابه : باستخدام المحلية الحيوانات بعض تصنيف المثال سبيل على
السلوكي / أو و الجسدي واالختالف

The Virginia Science SOL match the different classification
skills to the different grade levels:
للعلوم فيرجينيا بالمراحل SOLقامت للتصنيف المختلفة المهارات بتطابق
: المختلفة الدراسيةstudents should classify and arrange both objects and events according to various attributes or properties
وفقا واألحداث الكائنات وترتيب تصنيف الطلبة على يجبالمختلفة الخصائص أو للسمات
In first grade
students should classify items using two or more attributes
اثنين سمتين باستخدام العناصر تصنيف الطلبة على يجبأكثر أو
In second grade
students should classify objects with similar characteristics into at least two sets and two subsets, and they should also sequence natural events chronologically
المماثلة الخصائص ذات الكائنات تصنيف الطلبة على يجب
ومجموعتين أساسيتين مجموعتين في األقل على
األحداث تسلسل ترتيب أيضا عليهم ويجب ، فرعيتين
زمنيا الطبيعية
In third grade

The Virginia Science SOL match the different classification
skills to the different grade levels:
للعلوم فيرجينيا بالمراحل SOLقامت للتصنيف المختلفة المهارات بتطابق
: المختلفة الدراسيةstudents should classify data to create frequency distributions
توزيعات إلنشاء البيانات تصنيف الطلبة على يجبمتكررة
In fourth grade
students should identify rocks, minerals, and organisms using a classification key
والمعادن، الصخور على التعرف الطلبة على يجبالتصنيف مفتاح باستخدام الحية والكائنات
in fifth grade
students should develop a classification system based on multiple attributes
على بناء التصنيف نظام تطوير الطلبة على يجبمتعددة سمات
In sixth grade

Each teachers’ level set together and choose one standard of the
Process and communicate information
in scientific enquiry.
Design a worksheet or activity
Activity H.O. (1)

(3)

A- handle equipment
Science tools

SCIENCE TOOLS To become a successful scientists, we
must be able to identify and use scientific instruments or tools. لنصبح
ناجحين تحديد علماء على قادرين نكون أن يجباألدوات أو العلمية األدوات واستخدام
These tools are for collecting data, taking measurements, and recording observations. ، البيانات لجمع هي األدوات هذه
المالحظات وتسجيل القياسات، وأخذ Scientists use a variety of tools to do
investigations. متنوعة مجموعة العلماء يستخدمبالتحقيقات للقيام االدوات من

Calculators الحاسبة االالت
An electronic device for solving mathematics problems
أجل من الكتروني جهازالرياضيات مشاكل حل

Hand Lens المكبرة العدسة
A tool that magnifies objects or makes objects look larger than they are.
تكبر التي األدوات منيجعل األجسام أو األشياء
عليه هي مما أكبر تبدو

Microscope المجهر A tool that magnifies
at a much higher power than a hand lens. في التي األدوات ومن
من بكثير أعلى قوة تضخيمالمكبرةعدسة ال
It magnifies smaller objects or makes smaller objects larger.
او الصغيرة االشياء يكبرتبدو الصغيرة االشياء يجعلاكبر

Meter Stick المترية العصا A meter tool that is used
to measure distance and the length of objects. اداة
تستخدم مترية االشياء وطول المسافة لقياس It tells how long an object
is. االشياء طول عن تعبر In science, we use the
metric system for measuring.
المتري النظام نستخدم العلوم فياالطوال لقياس

Compassالبوصلة
A tool for telling directions. اداة
االتجاهات تحدد It is used to find
Earth’s magnetic north pole. يتم
على للعثور استخدامهالشمالي القطب
لألرض المغناطيسي

Stopwatch االيقاف ساعة
A tool used to measure time.
لقياس تستخدم اداة الوقت

Balance الميزان
A tool used to measure the mass of an object. اداة
كتلة لقياس تستخدم االجسام
A balance tells the amount of matter an object contains.
عن الميزان يعبريحتويه ما مقدار
المادة من الجسم

Magnet المغناطيس A magnet attracts
and repels substances.
يجذب المغناطيسالمواد مع ويتنافر
It is attracted or pulled to items with iron, nickel, or steel.
االشياء ) ( يسحب او يجذباو الحديد من المصنوعة الستيل

Safety Goggles النظارات الواقية
Eyewear that protects the eyes during a science experiment or investigation from hazardous or dangerous materials.
لحماية توضع النظاراتاجراء اثناء العين
المواد من التجاربالخطرة

Test Tube االختبار انابيب
A test tube is smaller than a beaker.
من اصغر االختبار انابيبالدوارق
It is open at one end and closed at the other.
واحدة جهه من مفتوحةاالخرى الجهه من ومغلقة

Beaker الدورق
It measures volume or the amount of liquids
لقياس يستخدمكمية او حجم
السوائل

Graduated Cylinderالمدرج المخبار

Petri Dish
A container used for samples or specimens.
A tool to culture microorganisms.

Hot Plate
A tool used to heat objects.

Computer
An electronic tool that performs tasks by processing and storing information.
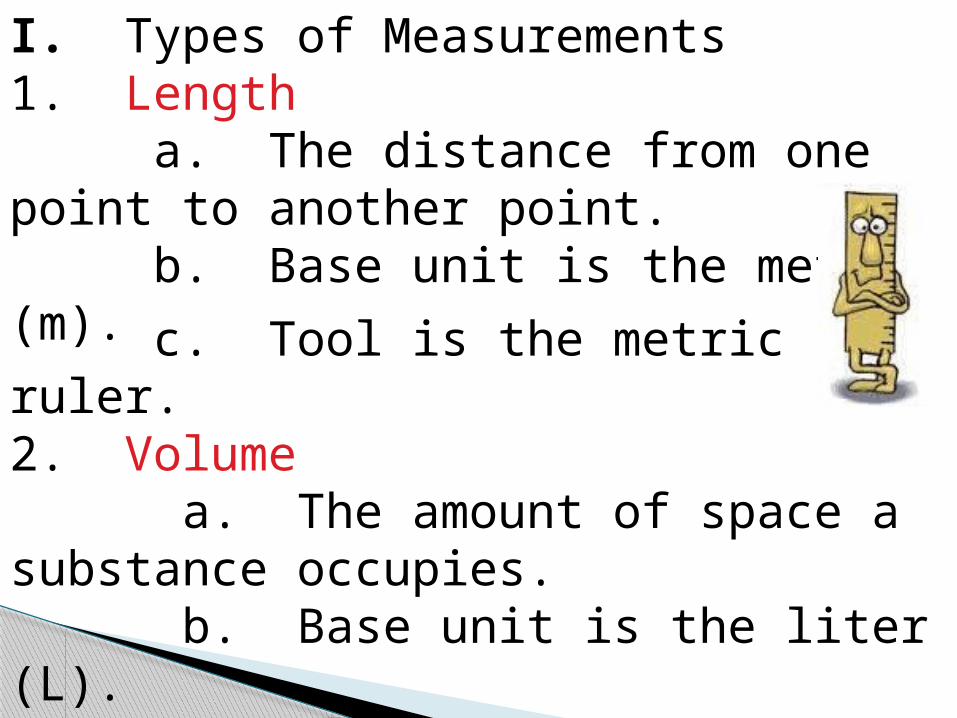
I. Types of Measurements1. Length a. The distance from one point to another point. b. Base unit is the meter (m).
c. Tool is the metric ruler.2. Volume a. The amount of space a substance occupies. b. Base unit is the liter (L). c. Tools: metric ruler for regular solids or graduated cylinder for liquids.

Each teachers’ level set together and design a worksheet or activity
that contains multiple scientific enquiry standards:
1) Use methods of scientific investigation
2) Process and communicate information
3) Handle equipment and make measurements
Activity H.O. (2)

Prayer Time

MICROTEACHING

SURVEY


