• The UK’s economic expansion finally became entrenched in 2014, with GDP growth of 2.6% placing it at the top of the G7 league table. Though the expansion appeared to be losing momentum towards the end of last year, the slump in the oil price should offer renewed impetus by boosting consumer spending power. We expect this to propel UK GDP growth to 3% in 2015 and 2.8% in 2016. Business investment should continue to make a disproportionate contribution to driving growth, with robust confidence encouraging firms to spend their accumulated cash piles. But the expansion is likely to remain a largely domestic affair, with net trade expected to make only modest contributions to growth over the next five years.
• With rapid expansion of the labour supply and robust business investment likely to have underpinned strong growth in potential output last year, we estimate that the output gap only narrowed very slightly in 2014, ending the year at 4% of potential output. The prospects for potential output growth are favourable, with the labour supply set to be boosted by sustained strength in inward migration and the staged increase in the state pension age, and robust growth in business investment boosting the capital stock. This will provide the conditions for relatively strong growth and low inflation over the medium term, with GDP growth expected to average 2.6% a year from 2015 to 2019. Our forecasts are a little stronger than those of the OBR and the market consensus.
• The risks around our forecast are skewed to the downside. Domestically, the upcoming general election provides the most immediate source of uncertainty, with a wide range of results possible. A decisive result could mean changes to fiscal policy, while an inconclusive result and failure to establish a government with a workable majority could undermine business confidence. But external events have the greatest potential to alter the UK outlook. The most likely upside scenario would involve stronger recoveries in the US and eurozone, which would boost UK export growth. On the downside, the biggest threat would be a widespread retreat from risk, which could push the UK back into recession in late 2015.
4.1 Introduction
The combination of substantial upward revisions to the historical data and a period of sustained growth at, or above, the long-run trend means that the UK economy looks in a much better state now than at the time of last year’s Green Budget. GDP growth of 2.6% in 2014 was the strongest since the financial crisis and, as in previous years, we think there is a good chance that the out-turn will eventually come in even stronger, once the data have been through the Blue Book balancing process.
In this chapter, we discuss the outlook for the UK economy, beginning in Section 4.2 with short-term prospects, where we assess whether we should be concerned about the recent run of weaker data and look at the implications for the UK economy of the slump in the price of oil.
Moving our focus beyond the short term, we consider prospects for the 2015–19 period as a whole. As part of this, we look at how our estimates of the output gap have evolved over the past year, before moving on to discuss the prospects for potential output growth over the next five years (Section 4.3). Having set out our baseline forecast, we then assess how this compares with the most recent forecast from the Office for Budget Responsibility (OBR) and those of other independent forecasters (Section 4.4).
Section 4.5 analyses the risks around the baseline forecast and looks in detail at the potential impact of alternative global scenarios on the UK economy, including an upside scenario ‘US and eurozone upside surprise’ and a downside scenario ‘risk-off – turmoil in financial markets’, which involves a widespread retreat from risk. Section 4.6 concludes.
4.2 The UK economy may be headed back to a period of NICEness
2014 – the economy’s expansion becomes entrenched
For much of the period since the financial crisis struck in 2008, the prospect of a return to the period of non-inflationary consistent expansion (a term famously coined by former Governor of the Bank of England Mervyn (now Baron) King) enjoyed in the decade or so from the mid-1990s has seemed a forlorn hope. But that prospect is now looking ever more plausible. 2014 was a year of steady growth for the UK economy, with quarterly growth averaging 0.7% through the year and 2.6% for the year as a whole. This was the strongest out-turn since 2006 and placed the UK’s growth performance at first place among G7 countries (although this in part reflects greater scope for catch-up growth following a weaker performance in earlier years).
Meanwhile, sizeable revisions to the UK’s National Accounts in September 2014 resulted in the recession of 2008–09 being presented in a less severe light, with output estimated to have fallen by 6.4% peak-to-trough compared with the previous estimate of a 7.2% decline. Moreover, the subsequent recovery was judged to have been stronger, resulting in GDP surpassing its pre-financial peak in the third quarter of 2013 compared with the previous estimate of 2014Q2.
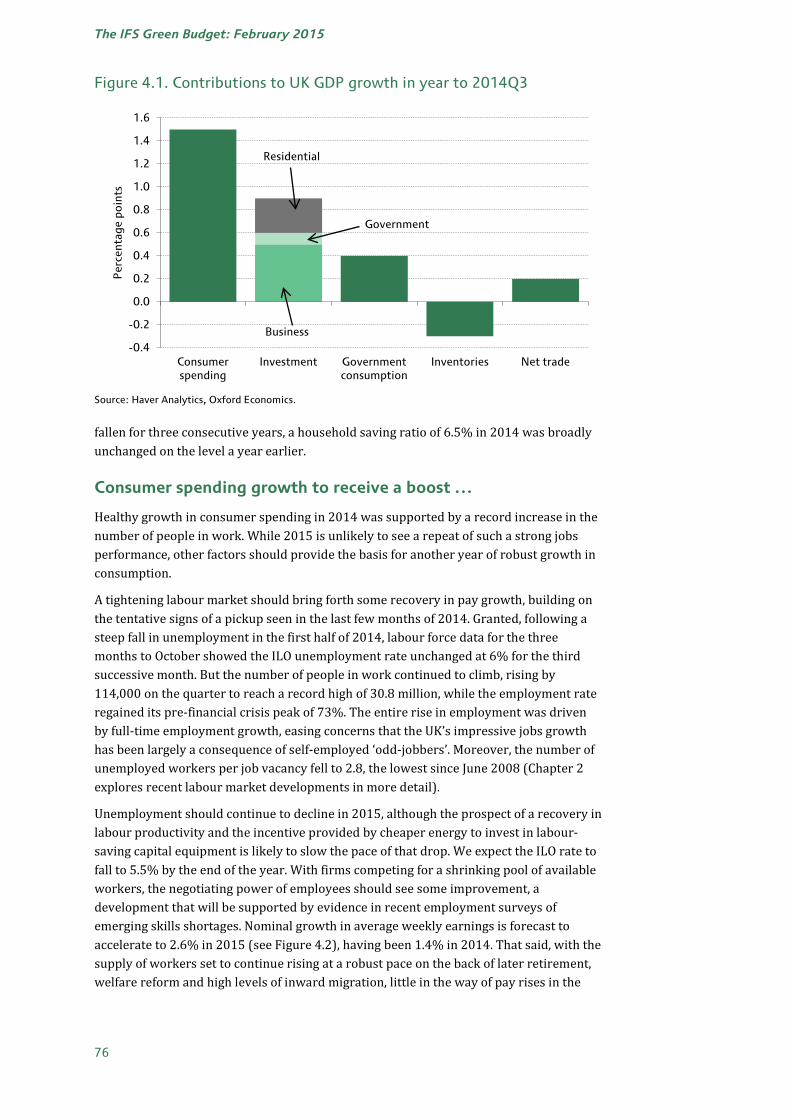
The ONS’s revisions also illustrated a better-balanced recovery. Admittedly, net trade has made a negligible contribution to growth in recent years, an observation likely to have been repeated in 2014. But the inclusion of R&D spending (which fell less sharply during the recession) in the ONS estimate of investment in order to comply with new European accounting standards, improvements to the method of calculating investment and large revisions arising from the Blue Book balancing process resulted in capital spending, particularly business investment, being revised up significantly. For 2014 as a whole, business investment is forecast to have accounted for a quarter of overall GDP growth, despite this component of expenditure representing only a tenth of GDP.
That said, consumer spending was still the biggest source of GDP growth in 2014, as Figure 4.1 illustrates. Indeed, while growth in consumer spending slowed towards the end of 2014 and consumer confidence dropped back a touch, an annual rise of 2.3% in consumption was the strongest since 2007, with households’ appetite to spend spurred by falling unemployment and high levels of consumer confidence. Household resources grew by around 2.5% in 2014, with continued weakness in pay settlements being compensated for by a record rise in the number of people in work. Consequently, having
75
The IFS Green Budget: February 2015
Figure 4.1. Contributions to UK GDP growth in year to 2014Q3
Source: Haver Analytics, Oxford Economics.
fallen for three consecutive years, a household saving ratio of 6.5% in 2014 was broadly unchanged on the level a year earlier.
Consumer spending growth to receive a boost …
Healthy growth in consumer spending in 2014 was supported by a record increase in the number of people in work. While 2015 is unlikely to see a repeat of such a strong jobs performance, other factors should provide the basis for another year of robust growth in consumption.
A tightening labour market should bring forth some recovery in pay growth, building on the tentative signs of a pickup seen in the last few months of 2014. Granted, following a steep fall in unemployment in the first half of 2014, labour force data for the three months to October showed the ILO unemployment rate unchanged at 6% for the third successive month. But the number of people in work continued to climb, rising by 114,000 on the quarter to reach a record high of 30.8 million, while the employment rate regained its pre-financial crisis peak of 73%. The entire rise in employment was driven by full-time employment growth, easing concerns that the UK’s impressive jobs growth has been largely a consequence of self-employed ‘odd-jobbers’. Moreover, the number of unemployed workers per job vacancy fell to 2.8, the lowest since June 2008 (Chapter 2 explores recent labour market developments in more detail).
Unemployment should continue to decline in 2015, although the prospect of a recovery in labour productivity and the incentive provided by cheaper energy to invest in labour-saving capital equipment is likely to slow the pace of that drop. We expect the ILO rate to fall to 5.5% by the end of the year. With firms competing for a shrinking pool of available workers, the negotiating power of employees should see some improvement, a development that will be supported by evidence in recent employment surveys of emerging skills shortages. Nominal growth in average weekly earnings is forecast to accelerate to 2.6% in 2015 (see Figure 4.2), having been 1.4% in 2014. That said, with the supply of workers set to continue rising at a robust pace on the back of later retirement, welfare reform and high levels of inward migration, little in the way of pay rises in the
-0.4
-0.2
0.0
0.2
0.4
0.6
0.8
1.0
1.2
1.4
1.6
Consumer spending
Investment Government consumption
Inventories Net trade
Per
cent
age
poin
ts
Business
Residential
Government
76
The UK economic outlook
Figure 4.2. Inflation and earnings growth
Source: Haver Analytics, Oxford Economics.
public sector, and the ‘scarring’ effect on workers of the recent prolonged period of economic weakness and uncertainty, annual nominal pay growth is set to remain well below the pre-crisis norm of 4–5%.
Alongside a pickup in pay rises, we are due to see another above-inflation increase in the income tax personal allowance in April from £10,000 to £10,600, which will provide an additional boost to net incomes. However, the aggregate gain will be relatively small at around £2 billion, less than 0.2% of disposable income.
… with ‘lowflation’ boosting purchasing power …
The dismal performance of real earnings since 2008 (down around 10% at the mean relative to the CPI) has reflected both very subdued growth in cash pay and elevated inflation. But alongside the prospect of faster growth in the former, households’ purchasing power will gain from a striking fall in the latter, driven by the recent collapse in the price of oil. Having been trading at US$115 per barrel in June 2014, Brent Crude fell below US$50 per barrel in January this year, a fall of almost 60%. The size of the tax wedge present in the retail price of petrol means that UK pump prices have dropped by a more modest 20% or so (around 25 pence per litre) since last summer. However, this still contributed to annual CPI inflation falling to only 0.5% in December 2014, well below the Monetary Policy Committee’s 2% target and the joint lowest rate since records began in 1989.
Moreover, underlying price pressures have also receded, with December’s CPI excluding food, energy, alcohol and tobacco running at only 1.3%, down from 2% six months earlier. A large output gap, which continues to put pressure on profit margins and keep wage growth constrained, and a modest appreciation in sterling over the second half of 2014, which has reduced the price of imported commodities, have both contributed to the core measure’s weakness.
The IMF and others have pointed to the dangers of such ‘lowflation’, with concerns centred around raising the real burden of debt and impeding the adjustment of real wages in response to labour market shocks. But from UK consumers’ perspective, an
-2
-1
0
1
2
3
4
5
6
20
02
20
03
20
04
20
05
20
06
20
07
20
08
20
09
20
10
20
11
20
12
20
13
20
14
20
15
20
16
20
17
20
18
% y
ear
Earnings
CPI
Forecast
77
The IFS Green Budget: February 2015
Figure 4.3. Personal debt and saving ratio
Source: Haver Analytics, Oxford Economics.
environment of very low inflation appears unambiguously positive, reflecting ‘good’ disinflation arising from cheaper oil and commodity prices, rather than ‘bad’ disinflation flowing from a weak economy and high unemployment. We forecast CPI inflation to average 0% in 2015 compared with 1.5% in 2014 and the recent peak of close to 5% in 2011.
The near-absence of price pressures this year should deliver a significant shot in the arm to household incomes, which are forecast to grow by 2.5% in real terms in 2015, the fastest pace since 2003. And with consumer confidence having recovered strongly and expectations for a hike in interest rates receding over the horizon, we think households will be inclined to spend these real income gains, as they have with compensation from mis-sold payment protection insurance and other windfalls, especially those households that remain credit-constrained. Indeed, growth in consumer spending of 3.2% in 2015 is set to outpace rises in incomes, implying a slight drop in the household saving ratio (see Figure 4.3).
… but the housing market acting as less of a spur
That said, one prop to growth in consumer sentiment and spending in 2014 – the resurgent housing market – looks set to play a more limited role in bolstering the consumer going forward. A combination of policy interventions and market forces appears to have calmed the housing market over the latter part of 2014. Having peaked at over 10% on both the Nationwide and Halifax measures, annual growth in property prices slowed to around 7% by the end of the year. Meanwhile, mortgage approvals of 59,029 in November were 22% below their level at the beginning of 2014.
The very high level of house prices is probably playing a role in this slowdown. The Nationwide measure showed the price of the average house in the UK ending 2014 7.2% higher than a year earlier and slightly above the pre-financial crisis peak reached in early 2008. Alongside this, the latest survey data from the Royal Institution of Chartered Surveyors (RICS) showed new buyer enquiries continuing a decline that began in the middle of 2014. And the Bank of England’s Credit Conditions Survey for Q4 reported the sharpest fall in household demand for mortgages since the third quarter of 2008. Lending
100
110
120
130
140
150
160
170
0
2
4
6
8
10
12
14
16
18
20 1
99
0
19
91
1
99
2
19
93
1
99
4
19
95
1
99
6
19
97
1
99
8
19
99
2
00
0
20
01
2
00
2
20
03
2
00
4
20
05
2
00
6
20
07
2
00
8
20
09
2
01
0
20
11
2
01
2
20
13
2
01
4
20
15
2
01
6
20
17
2
01
8
% o
f in
com
e
% o
f in
com
e
Saving (LH axis)
Debt (RH axis)
Forecast
78
The UK economic outlook
Figure 4.4. House prices and transactions
Source: Haver Analytics, Oxford Economics.
conditions may also restrict the number of would-be purchasers, with the supply of mortgages constrained by the long-lasting effect of 2014’s policy interventions, including April 2014’s Mortgage Market Review and action taken by the Financial Policy Committee last June to restrict the availability of high loan-to-value mortgages.
That said, there are factors that will support a decent level of momentum in housing activity this year. Our forecast for a recovery in real earnings should spur demand for homes by supporting households’ ability to bear a mortgage. And recent declines in market interest rates and the diminishing prospect of 2015 seeing the Monetary Policy Committee (MPC) raise Bank Rate will reassure those thinking of taking out a home loan, as well as keeping household debt interest payments as a share of income close to record lows. Moreover, the outcome of stamp duty reforms announced in the December 2014 Autumn Statement, abolishing the oft-criticised ‘slab’ element, will reduce the extent to which the tax system discourages residential transactions on properties worth less than £1 million.
As Figure 4.4 shows, our forecast sees house price growth decelerating from 10% in 2014 to 5.1% in 2015. This easing will, in the main, reflect weaker demand, although an uptick in housing supply should contribute to constraining price growth, continuing a development evident in 2014. In the first three quarters of 2014, residential investment was 12% up on the level in the same period a year earlier, while housing starts in England averaged just over 35,000 per quarter in the same period, a 15% year-on-year jump. We forecast total UK housing starts to reach 168,000 in 2015, the highest since 2007 but still a long way short of the 203,000 reached in that pre-crisis year. As expectations of house price gains soften, the supply of existing properties available for sale should also be boosted as sellers previously holding back for a higher price bring homes to the market.
2015 should see interest rates remain at record lows
Against the current backdrop of sharp disinflation, the middle of last year, when many commentators expected that the MPC would raise Bank Rate before 2014 was out, now looks like a very long time ago. Admittedly, the prospect that 2015 will deliver some
-20
-15
-10
-5
0
5
10
15
20
25
30
150
200
250
300
350
400
450
500
19
90
1
99
1
19
92
1
99
3
19
94
1
99
5
19
96
1
99
7
19
98
1
99
9
20
00
2
00
1
20
02
2
00
3
20
04
2
00
5
20
06
2
00
7
20
08
2
00
9
20
10
2
01
1
20
12
2
01
3
20
14
2
01
5
20
16
2
01
7
20
18
% y
ear
Tho
usan
ds
Housing transactions (LH axis)
House prices (RH axis)
Forecast
79
The IFS Green Budget: February 2015
robust numbers around consumer spending and broader economic growth offers a source of ammunition to the hawkish members of the Committee. And stronger wages growth and further declines in unemployment could create a dilemma for the dovish majority. After all, such developments have frequently been cited by the Governor of the Bank of England, Mark Carney, and other MPC members as being important criteria in paving the way for a decision to raise interest rates.
But our forecast that CPI inflation will average close to zero over the course of this year would appear to rule out the Bank Rate rising from its current record low of 0.5% in 2015. Mark Carney will probably have to write a succession of letters to the Chancellor of the Exchequer throughout 2015 explaining why inflation has deviated more than 1 percentage point below the MPC’s 2% target. Communicating the case for a rise in Bank Rate alongside this would be extremely challenging. And the economic argument for ‘looking through’ a period of below-target inflation resulting from temporary factors (such as a collapse in the oil price) carries less weight when there is little or no room to cut interest rates. Were a rise in Bank Rate to combine with very low inflation to cause inflation expectations to become anchored to a level below the target, the MPC would have to rely on the uncertain approach of more quantitative easing or other unconventional methods to try to reverse the situation. So 2015 should see the sixth successive full year with Bank Rate at 0.5%.
Business should continue to punch above its weight
The publication by the ONS last September of sizeable revisions to the National Accounts transformed the narrative around business investment in recent years. Under the previous vintage of data, capital spending by firms in the first quarter of 2014 was estimated to be almost 16% below the level recorded in 2008Q1. But the inclusion of R&D spending (which fell less sharply during the recession) in order to comply with new European accounting standards, improvements to the method for calculating investment and large revisions arising from the Blue Book balancing process turned spending by firms from the laggard to the star performer among GDP components. Business investment in 2014Q1 is now estimated to have been 5% above the level six years earlier. And while the remainder of last year saw a mixed performance, business investment for 2014 as a whole looks to have grown by almost 7% on an annual basis.
On another positive note, the UK corporate sector ran a financial deficit for a second consecutive quarter in 2014Q3, following nearly 12 years of sustained surpluses. So companies’ appetite to invest is becoming increasingly evident. Moreover, corporate profitability has recovered strongly. Excluding the North Sea sector, UK companies’ net rate of return reached 11.6% in 2014Q2, the highest rate since the last quarter of 1998.
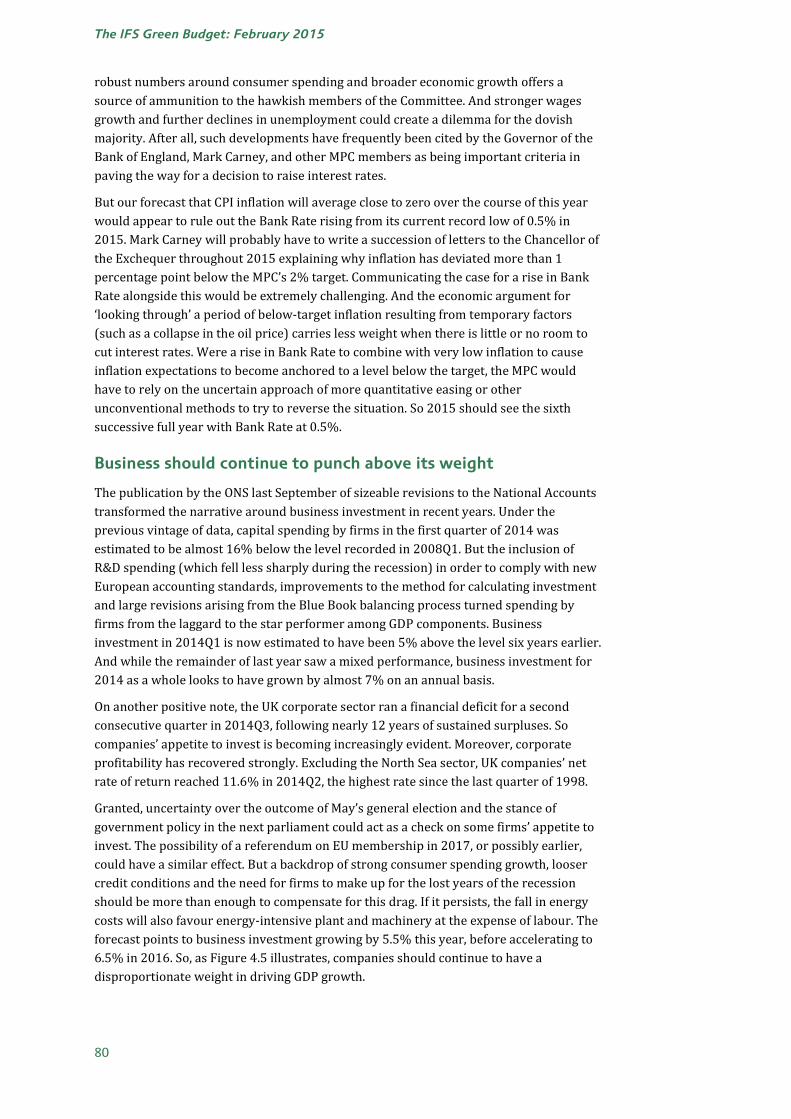
Granted, uncertainty over the outcome of May’s general election and the stance of government policy in the next parliament could act as a check on some firms’ appetite to invest. The possibility of a referendum on EU membership in 2017, or possibly earlier, could have a similar effect. But a backdrop of strong consumer spending growth, looser credit conditions and the need for firms to make up for the lost years of the recession should be more than enough to compensate for this drag. If it persists, the fall in energy costs will also favour energy-intensive plant and machinery at the expense of labour. The forecast points to business investment growing by 5.5% this year, before accelerating to 6.5% in 2016. So, as Figure 4.5 illustrates, companies should continue to have a disproportionate weight in driving GDP growth.
80
The UK economic outlook
Figure 4.5. Business investment and GDP growth
Source: Haver Analytics.
Economic expansion set to remain a largely domestic affair
The other side of the economic rebalancing coin – net exports – has continued to disappoint those hoping for growth driven by overseas demand. Net trade looks to have had a neutral effect on GDP in 2014, although this was an improvement on the drag seen in the previous year. Weakness in the eurozone economy, the UK’s largest single export market, has continued to be the culprit, with GDP growth in the currency bloc running at only 0.8% in 2014.
The outlook for exports is mixed. Business surveys reported a softening in export demand over the second half of 2014. However, while 2014 looks likely to have seen export volumes drop by more than 1% on their level in 2013, there were signs of an improving picture as the year went on. Export volumes in the three months to November were 2.6% up on their level a year earlier. Surprisingly, against a background of fairly strong growth in consumer spending, import volumes rose by a more modest 0.8% over the same period.
The international environment for UK exporters offers some cause for hope in 2015 and beyond. Both the US and eurozone economies are forecast to strengthen over the coming two years, with more promising domestic signs augmented by the boost from lower oil prices. As such, growth in world trade (weighted by UK export shares) is forecast to accelerate from 4.3% in 2014 to 4.9% this year and 5.6% in 2016 (see Figure 4.6). With sterling also expected to weaken a little on a trade-weighted basis, this should provide the platform for a solid pickup in export growth. A healthier global economy and rising incomes in emerging economies such as China should particularly benefit UK services exports, which generated a sizeable surplus in 2014 and continued to close the gap with the historically much more important export of goods. In 2014, the value of UK services exports was equivalent to 72% of goods exports, up from 60% in 2008 and just over 40% in the late 1990s. Meanwhile, as a net importer of oil, the UK’s trade balance should be supported by the collapse in the oil price and a consequent cut in the import bill.
-20
-15
-10
-5
0
5
10
15
20
02
20
03
20
04
20
05
20
06
20
07
20
08
20
09
20
10
20
11
20
12
20
13
20
14
20
15
20
16
20
17
20
18
% y
ear
GDP growth
Business investment
Forecast
81
The IFS Green Budget: February 2015
Figure 4.6. Exports and world trade growth
Source: Haver Analytics, Oxford Economics.
That said, headwinds to export-led growth will persist. After all, the weakness of oil and commodity prices is partly a symptom of weak global demand. Sterling is likely to continue strengthening against the euro, particularly now that the European Central Bank has decided to undertake quantitative easing on a significant scale. Meanwhile, political turmoil in Greece has once again raised the prospect of a disruptive break-up of the eurozone, although this is not an eventuality we are expecting in our central forecast. On the import side, stronger growth in domestic consumer spending will underpin firm demand for imports, which will keep the UK’s current account deficit, which reached a record high of 6% of GDP in 2014Q3, at an elevated level. Overall, net trade is forecast to make a negligible contribution to GDP growth over the next year or two.
Economy should hit the sweet spot
With plenty of lost ground to make up, it would be disappointing if the UK economy did not attain a reasonable rate of growth in 2015. But the collapse in the oil price should up the tempo of the expansion – indeed, simulations presented in Chapter 3 suggest that the decline in oil prices since mid-2014 could add around 0.5% to GDP in 2015. Our forecast points to quarterly growth rates averaging 0.7–0.8% through 2015. With households set to be the biggest beneficiary of a low-inflation environment, consumer spending will be the dominant driver of growth. But we are by no means anticipating a consumer boom, and business investment should continue to punch above its weight in supporting further rises in output. Exports are unlikely to make much of a contribution to the economy’s expansion, but even here prospects are looking relatively upbeat compared with the post-2008 experience. Our forecast shows GDP growing by 3% in 2015, a rate last seen in 2006, with a modest easing to 2.8% in 2016 (see Figure 4.7). And with inflation at a record low, the UK’s ‘misery index’, which sums unemployment and inflation to arrive at a measure of the economic ‘misery’ of a country, should fall to levels not seen since the long boom of the 1950s and early 1960s.
-16
-12
-8
-4
0
4
8
12
16
1990 1993 1996 1999 2002 2005 2008 2011 2014 2017
% y
ear
World trade
Exports (non-fuel goods)
Forecast
82
The UK economic outlook
Figure 4.7. Contributions to GDP growth
Source: Haver Analytics, Oxford Economics.
4.3 Medium-term outlook – steady but unspectacular growth
Over the medium term, we expect a steady, but unspectacular, pace of economic growth to continue. The combination of estimates of the current output gap and of potential growth going forwards drives our forecast for medium-term GDP growth.
How large is the output gap?
The question of the size of the output gap and forecasts for growth in potential output are crucially important to both fiscal and monetary policy. In terms of fiscal policy, these estimates have taken on added importance since the Chancellor adopted a cyclically-adjusted target for the public finances. With regards to monetary policy, the MPC has been content to leave interest rates at their current level partly because of its belief that there is still some ‘slack’ in the economy, which can be used up before there is a risk of inflationary pressures building.
However, the size of the output gap and the strength of potential output growth cannot be measured. As such, most commentators agree that the best approach is to use a range of different indicators to try to proxy the level of spare capacity, although with these indicators not always corroborating one another, a high degree of judgement is often required on behalf of the forecaster. Furthermore, economic data can often be subject to revision for many years after the event, which makes ‘real-time’ estimates of the output gap particularly difficult. Indeed, a working paper from the External MPC Unit of the Bank of England1 found that estimates of the output gap have become progressively more prone to revision and ‘unreliable’ over time, with the authors citing the difficulty of
1 A. Chiu and T. Wieladek, ‘Did output gap measurement improve over time?’, Bank of England, External MPC Unit, Discussion Paper 36, 2012, http://www.bankofengland.co.uk/research/Pages/externalmpcpapers/discussionpaper36.aspx.
Figure 4.8. Quarterly GDP relative to potential output estimated by extrapolating the pre-crisis trend in output
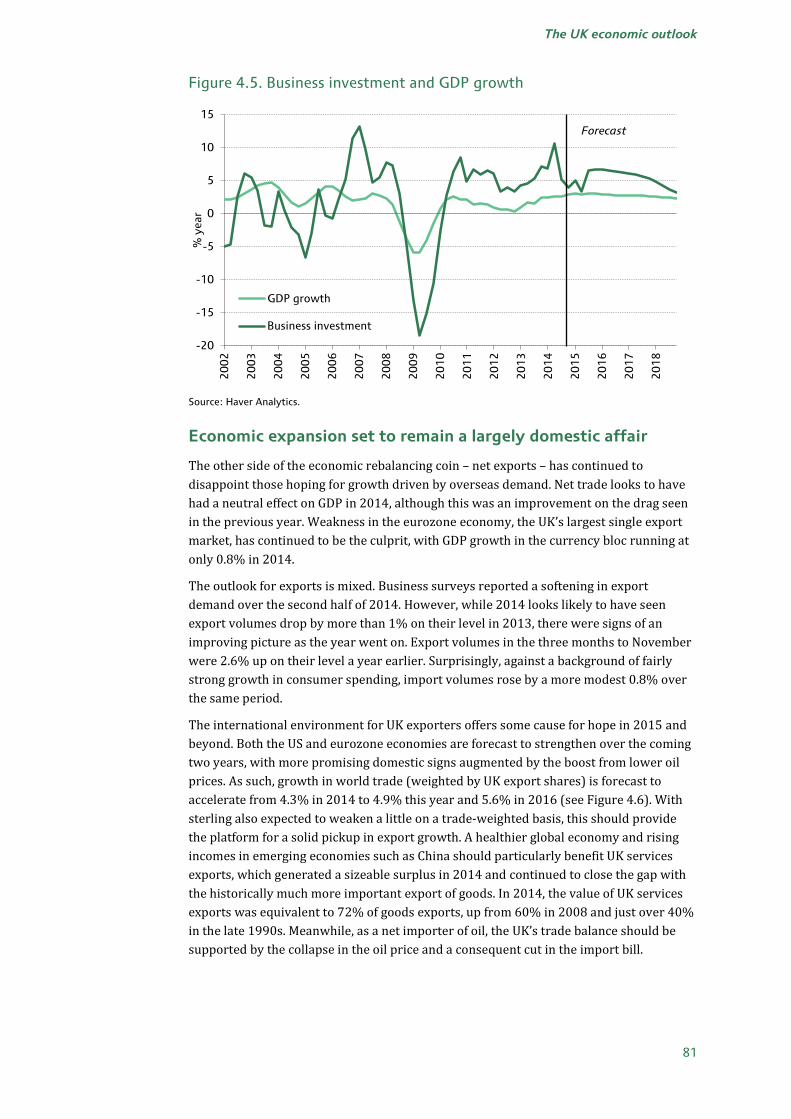
Note: Potential output series shows Oxford Economics estimates from 1970 to 2006. Potential output is then grown in line with the long-term average (2.5% a year) from 2007 to 2014. Source: Haver Analytics, Oxford Economics.
separating the trend from the cycle in economic data as being the main cause of this. This presents a significant challenge for policymakers.
The depth of the recession and the slow pace of the subsequent recovery make estimating the size of the output gap even harder at the current time. GDP fell by 6% from peak to trough during the recession and, seven years on, it is only 3½% above the early-2008 level. Were we to assume that potential output has continued to grow at historic rates since 2007, it would suggest an output gap of around 11% (see Figure 4.8). Such a divergence between actual output and the level of output implied by long-run trends is by no means uncommon – a number of advanced economies are estimated to have double-digit output gaps if this approach is applied.
However, as commentators analyse the causes of the financial crisis and its implications, the general conclusion has been that it has inflicted structural damage to potential output which will never be reversed, implying much smaller output gaps.
In last year’s Green Budget, we studied this subject in detail2 and concluded that of the gap between actual GDP and the pre-crisis trend in 2013 – then 15% – around two-fifths was caused by factors that had weakened demand, i.e. the output gap. A similar amount of the shortfall was attributed to permanent damage to potential output caused by the financial crisis. The remainder we attributed to under-reporting of GDP, with a range of evidence suggesting the health of the economy had been somewhat better since the financial crisis than the GDP data had reported.
Since last year’s report, the ONS has overhauled the UK National Accounts with the implementation of European System of Accounts 2010 (ESA10). These changes have caused substantial revisions both to the level of GDP and to year-to-year growth rates. In
2 See pages 72–81 of A. Goodwin and O. Salmon, ‘The UK economic outlook’, in C. Emmerson, P. Johnson and H. Miller (eds), The IFS Green Budget: February 2014, http://www.ifs.org.uk/budgets/gb2014/gb2014_ch4.pdf.
particular, the ONS now reports that GDP growth was around 0.5 percentage points per annum stronger over the period from 2007 to 2012 than had previously been estimated. This means that, relative to the pre-financial crisis peak, GDP is now estimated to have ended 2013 2% higher than previously thought (see Figure 4.9).
Notably, these revisions were mostly due to substantial upward revisions to the estimates of business investment, the bulk of which were caused by the annual Blue Book balancing – including the benchmarking to the Annual Business Survey and the supply and use balancing – rather than the changes in methodology. As far as we are concerned, these revisions vindicate our earlier view that GDP had been under-reported. Therefore, though the level of GDP in 2013 is now estimated to be somewhat higher than before, we assert that the bulk of this revision merely represents a correction of the earlier erroneous data and remain of the opinion that the output gap was very large, finishing 2013 at around 4.3% of potential output.
We use a production function approach to estimating potential output,3 which provides a framework that relates the level of potential output to contributions from factor inputs – labour and capital – and the efficiency with which those inputs are used (so-called ‘total factor productivity’). It also provides a consistent method for forecasting future growth in potential output, taking into account important changes such as demographic trends.
This approach suggests that 2014 saw strong growth in potential output. The labour supply has been boosted by very high levels of inward migration. The latest data reported that net inward migration totalled 260,000 over the year to June 2014, which was the highest figure for three years and only just short of 2007’s record high of 273,000. The pickup in migration levels was largely due to stronger inflows from the European Union and, with unemployment rates remaining high across Europe, net inflows are likely to have remained similarly strong across the second half of 2014.
3 In the Oxford Economics UK Model, we use a Cobb–Douglas production function, Y* = A + Lα + K(1–α), where: Y* is potential output; L is potential labour supply, which is equal to the labour supply at the NAIRU (non-accelerating inflation rate of unemployment); K is the capital stock; and A is total factor productivity (TFP). This is rewritten in natural logs, with α equal to 0.65: ln(Y*) = ln(A) + 0.65ln(L) + 0.35ln(K).
92
94
96
98
100
102
104
2007 2008 2009 2010 2011 2012 2013 2014
20
08
Q1
= 1
00
Current At time of 2014 Green Budget
85
The IFS Green Budget: February 2015
Figure 4.10. Working-age population growth
Source: Haver Analytics, Oxford Economics.
The labour supply was also boosted by the latest increase in the female state pension age (SPA), which increased by six months through the year to just under 62½ by the end of 2014.
As a result of these two factors, we estimate that the population of working age rose by 0.9% in 2014; since 1990, it has risen this rapidly on an annual basis only twice before (see Figure 4.10). With the participation rate also having nudged upwards in 2014, we estimate that growth in the labour supply contributed more than 1 percentage point (ppt) to potential output growth last year.
Robust growth in business investment will have made a strong contribution to potential output. We estimate that business investment is likely to have risen by 6.6% in 2014, which would represent the strongest growth in seven years. This would mean that the contribution of the capital stock to potential output growth rose in 2014.
Even making a fairly conservative assumption for total factor productivity leads us to conclude that potential output grew by around 2.5% over the year to the end of 2014. Based upon the ONS’s current estimate of actual GDP, this would suggest that the output gap narrowed from 4.3% of potential output at the end of 2013 to 4% in 2014Q4. However, as in previous years, we expect the ONS to revise up its estimate for GDP growth once the data have been through the Blue Book balancing process. Other evidence on the health of the economy suggests that it will finish at 3%, or perhaps slightly higher, which would suggest that the output gap narrowed to around 3¾% of potential output.
Potential output growth to remain firm over the next five years
Having estimated how much spare capacity we believe there is in the UK economy at present, we must make a judgement on how potential output will evolve, in order to determine the scope for actual GDP growth to recover. To do this, we again use the production function approach to consider how the contributions of the various factor inputs are likely to evolve.
0.0
0.2
0.4
0.6
0.8
1.0
1.2
19
90
19
91
19
92
19
93
19
94
19
95
19
96
19
97
19
98
19
99
20
00
20
01
20
02
20
03
20
04
20
05
20
06
20
07
20
08
20
09
20
10
20
11
20
12
20
13
20
14
% y
ear
86
The UK economic outlook
Capital stock
Our forecast shows continued strong growth in business investment, as corporate confidence remains firm and encourages companies to continue to invest their accumulated cash surpluses. Furthermore, the relatively low levels of investment since the financial crisis suggest that there will still be a degree of pent-up demand, with firms that have patched up old machinery coming under pressure to replace it with new equipment. Strong rates of economic growth will mean that firms also increasingly need to invest to expand capacity. This means that the contribution of the capital stock to potential output growth is expected to accelerate through the forecast period, from 0.8ppts in 2014 to average 1ppt a year from 2015 to 2019.
Labour supply
The OBR’s forecast adopts the low migration variant of the ONS population projections, which assumes a steady reduction in net inward migration to 105,000 in the year to mid-2019. These projections are only published on a biennial basis and are now looking very dated, with the outturn for mid-2014 of 260,000 well above the low-variant projection of just 149,600.
As economic conditions in the eurozone continue to improve, unemployment there should fall back, which will reduce the motivation for potential migrants to move to the UK. Alongside this, income differentials are steadily closing between countries in Western Europe, such as the UK, and economies in Central and Eastern Europe, such as Poland. This will not only lessen the incentives for workers in these economies to move to the UK, but it will also make it more attractive for those who have migrated from those countries over the past decade to return home. Political considerations also point to a reduction in the levels of inward migration into the UK over the next five years, with all of the main UK political parties having indicated a desire to reduce migration levels to varying degrees. However, given that the bulk of migrants come from EU countries – of net inward migration of 260,000 in the year to June 2014, 142,000 came from the EU – the government’s ability to reduce migration levels (while remaining in the EU) is somewhat limited. As such, we do not expect it to fall below 150,000 a year before 2019 and expect it to be substantially higher in the short term (see Figure 4.11).
Figure 4.11. Net inward migration assumptions
Source: ONS, Oxford Economics.
-50
0
50
100
150
200
250
300
1990 1994 1998 2002 2006 2010 2014 2018
Tho
usan
ds
ONS low migration
Oxford Economics
87
The IFS Green Budget: February 2015
The population of working age will also be boosted by further increases in the SPA. By the end of 2019, the SPA will have reached almost 65½ for both men and women, compared with the current levels of 65 for males and 62½ for females. Overall, we expect the population of working age to grow by 0.9% a year from 2015 to 2019.
However, while we expect the population of working age to continue to grow strongly, a decline in the participation rate is likely to mean that the size of the workforce grows a little more slowly. We expect the participation rate to fall slightly because the population is ageing and labour market participation is still substantially lower amongst those close to the SPA than amongst younger individuals.
The other factor to affect the contribution of the labour supply to potential output growth is the level of the NAIRU.4 Our forecasts assume that the NAIRU increased from 5% to 5¾% in the aftermath of the financial crisis, which is based upon empirical evidence – notably Blanchard and Summers (1986)5 and Ball (2009)6 – which suggests that significant shifts in aggregate demand can lead to changes in the NAIRU through hysteresis. This is because those out of work for a prolonged period see the value of their skills eroded and become detached from the labour market, so the pool of available and suitably-skilled workers is reduced.
On one hand, the shift in employment from the public to the private sector suggests that the NAIRU could remain high. This is because it could lead to a mismatch between skills and opportunities as the likelihood is that the regional pattern of public sector job losses – and private sector opportunities – will be uneven. On the other hand, the fact that increases in unemployment were more highly concentrated on the young than in past cycles might be reason to expect the NAIRU to fall back. This is because we would expect that the younger unemployed would be better placed to retrain and re-enter the workforce than those from older age groups.
On balance, the recent evidence from the labour market leads us to lean towards the latter argument. Not only has the very strong employment growth of the past couple of years reduced the overall unemployment rate, but the number of those unemployed for lengthy periods has also fallen significantly (see Figure 4.12). Compared with 2011, which was the peak year of unemployment, the number of people unemployed for 12–24 months has fallen by 31%, while the number unemployed for more than 24 months has declined by 9%. These figures give us greater confidence in the ability of the economy to reabsorb the long-term unemployed back into the workforce, so we think it reasonable to assume that the NAIRU steadily declines from its current level of 5¾% back to its original level of 5% by the end of the forecast horizon.
Bringing together our forecasts for population growth, participation and the NAIRU, we find that the contribution of the labour supply to potential output growth should pick up slightly from 0.4ppts a year over the period 2007–14 to 0.5ppts a year for 2015–19. However, this is down on the average contribution of 0.7ppts a year over 1996–2006, which reflects lower levels of inward migration and the impact of an ageing population.
4 NAIRU – non-accelerating inflation rate of unemployment. Even when the economy is operating at its long-run potential, there will still be some level of frictional unemployment – this is known as the NAIRU.
5 O.J. Blanchard and L.H. Summers, ‘Hysteresis and the European unemployment problem’, in S. Fischer (ed.), NBER Macroeconomics Annual, volume 1, 1986, http://www.nber.org/chapters/c4245.pdf. 6 L.M. Ball, ‘Hysteresis in unemployment: old and new evidence’, National Bureau of Economic Research (NBER), Working Paper 14818, 2009, http://www.nber.org/papers/w14818.
As we established in last year’s Green Budget,7 the literature on the impact of financial crises on potential output suggests that we have already seen the bulk of any permanent damage to total factor productivity. As such, we assume that the contribution of total factor productivity to potential output growth continues to move steadily back towards historical norms through the forecast horizon. Over the 2015–19 period as a whole, we assume that total factor productivity contributes 0.8ppts per year to potential output growth.
A forecast of potential output and the output gap
Bringing these factors together, we expect growth in potential output to average 2.3% a year between 2015 and 2019 (Table 4.1). This is some way below the average of the decade prior to the financial crisis (2.9%) but it represents a clear step up on the average growth rate of 1.6% a year that we estimate was achieved between 2007 and 2014.
Table 4.1. Contributions to potential output growth (percentage points per annum)
1996–2006 2007–14 2015–19
Labour supply 0.7 0.4 0.5
Capital stock 0.8 0.6 1.0
Total factor productivity 1.4 0.7 0.8
Potential output 2.9 1.6 2.3
Actual GDP 3.1 0.8 2.6
Note: Columns may not sum exactly due to rounding. Source: Oxford Economics.
7 See pages 77–78 of A. Goodwin and O. Salmon, ‘The UK economic outlook’, in C. Emmerson, P. Johnson and H. Miller (eds), The IFS Green Budget: February 2014, http://www.ifs.org.uk/budgets/gb2014/gb2014_ch4.pdf.
Note: Forecasts for OBR taken from Economic and Fiscal Outlook: December 2014, http://cdn.budgetresponsibility.independent.gov.uk/December_2014_EFO-web513.pdf. Source: Oxford Economics, OBR.
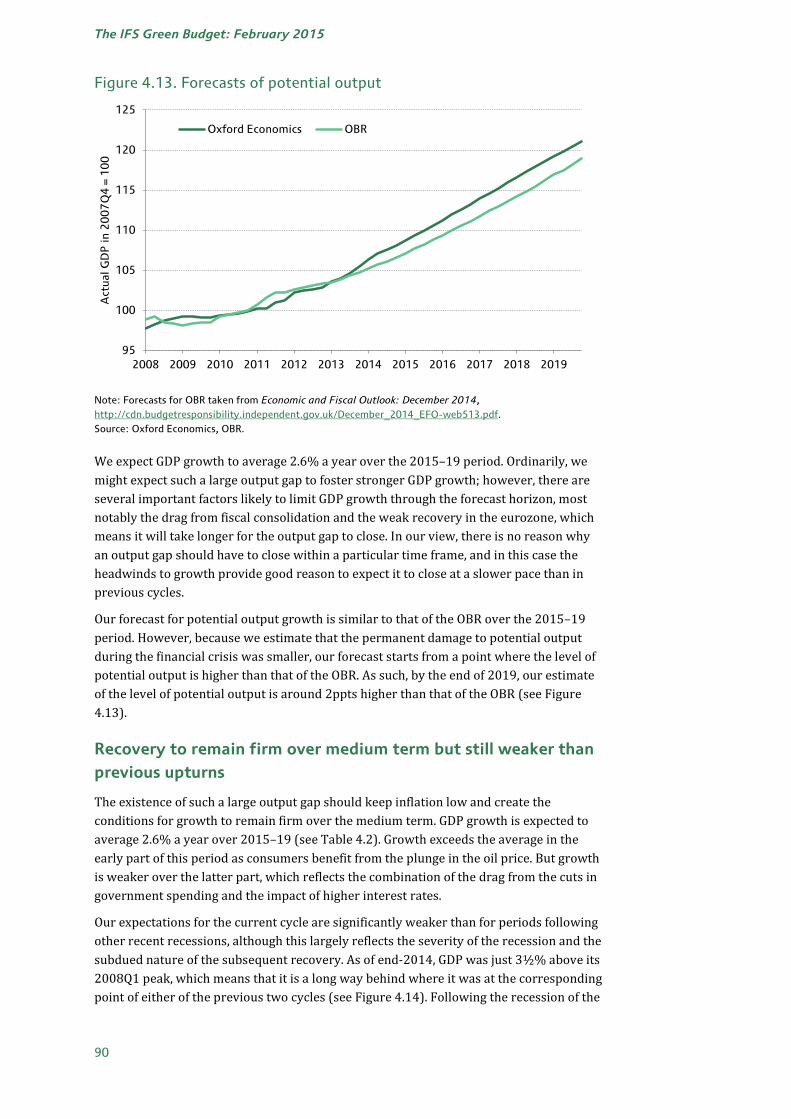
We expect GDP growth to average 2.6% a year over the 2015–19 period. Ordinarily, we might expect such a large output gap to foster stronger GDP growth; however, there are several important factors likely to limit GDP growth through the forecast horizon, most notably the drag from fiscal consolidation and the weak recovery in the eurozone, which means it will take longer for the output gap to close. In our view, there is no reason why an output gap should have to close within a particular time frame, and in this case the headwinds to growth provide good reason to expect it to close at a slower pace than in previous cycles.
Our forecast for potential output growth is similar to that of the OBR over the 2015–19 period. However, because we estimate that the permanent damage to potential output during the financial crisis was smaller, our forecast starts from a point where the level of potential output is higher than that of the OBR. As such, by the end of 2019, our estimate of the level of potential output is around 2ppts higher than that of the OBR (see Figure 4.13).
Recovery to remain firm over medium term but still weaker than previous upturns
The existence of such a large output gap should keep inflation low and create the conditions for growth to remain firm over the medium term. GDP growth is expected to average 2.6% a year over 2015–19 (see Table 4.2). Growth exceeds the average in the early part of this period as consumers benefit from the plunge in the oil price. But growth is weaker over the latter part, which reflects the combination of the drag from the cuts in government spending and the impact of higher interest rates.
Our expectations for the current cycle are significantly weaker than for periods following other recent recessions, although this largely reflects the severity of the recession and the subdued nature of the subsequent recovery. As of end-2014, GDP was just 3½% above its 2008Q1 peak, which means that it is a long way behind where it was at the corresponding point of either of the previous two cycles (see Figure 4.14). Following the recession of the
early 1990s, GDP was 12% above its previous peak by this stage, while the recovery of the early 1980s saw GDP around 9% above its previous peak by the same point.
As we have already established, the output gap was estimated to have narrowed from 4.3% of potential output at the end of 2013 to 4% in 2014Q4. With growth set to accelerate further this year, the output gap should start to narrow more rapidly and by the end of 2019 we expect it to have fallen to around 2½% of potential GDP (see Figure 4.15). This forecast points to subdued inflationary pressures over the next few years, meaning that the Bank of England will have scope to keep Bank Rate at 0.5% until early next year and will subsequently be able to tighten policy at a very measured pace.
Figure 4.14. Comparison of UK economic cycles
Source: Haver Analytics, Oxford Economics.
90
95
100
105
110
115
120
125
130
135
140
0 1 2 3 4 5 6 7 8 9 10 11
Cyc
lical
pea
k =
10
0
Years from cyclical peak
2008Q1 – 2019Q4
1990Q2 – 2002Q1
1979Q2 – 1991Q1
91
The IFS Green Budget: February 2015
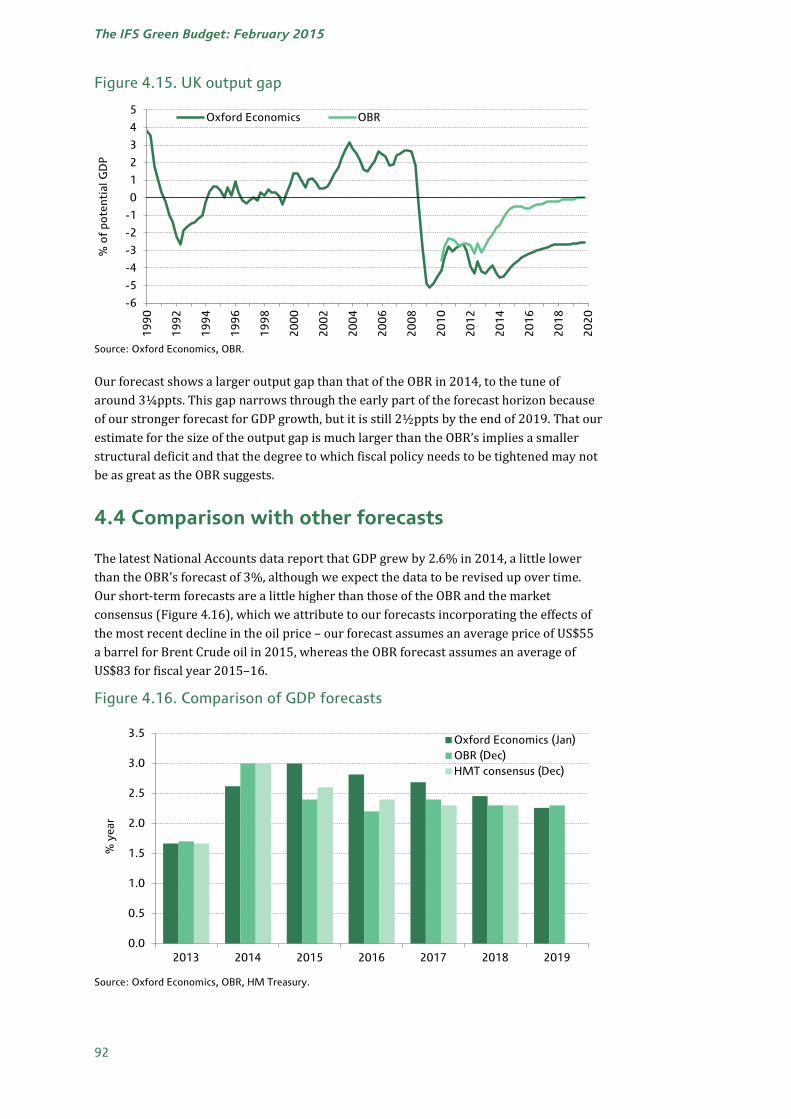
Figure 4.15. UK output gap
Source: Oxford Economics, OBR.
Our forecast shows a larger output gap than that of the OBR in 2014, to the tune of around 3¼ppts. This gap narrows through the early part of the forecast horizon because of our stronger forecast for GDP growth, but it is still 2½ppts by the end of 2019. That our estimate for the size of the output gap is much larger than the OBR’s implies a smaller structural deficit and that the degree to which fiscal policy needs to be tightened may not be as great as the OBR suggests.
4.4 Comparison with other forecasts
The latest National Accounts data report that GDP grew by 2.6% in 2014, a little lower than the OBR’s forecast of 3%, although we expect the data to be revised up over time. Our short-term forecasts are a little higher than those of the OBR and the market consensus (Figure 4.16), which we attribute to our forecasts incorporating the effects of the most recent decline in the oil price – our forecast assumes an average price of US$55 a barrel for Brent Crude oil in 2015, whereas the OBR forecast assumes an average of US$83 for fiscal year 2015–16.
Over the latter years of the forecast horizon, our forecast is also a little stronger than that of the OBR. This reflects a wider output gap, which allows the economy to grow more strongly without causing inflationary pressures to build. It also reflects our assumption that the current plans for government spending cuts will be reined in, regardless of which party wins May’s general election.
4.5 Risks balanced: alternative scenarios for the UK economy
For much of the period since the financial crisis, the risks to our central forecast have been skewed heavily to the downside. For the early part of this period, we typically identified a small number of important international ‘event risks’, such as the threat of a eurozone break-up or the US going over the ‘fiscal cliff’. More recently, those risks have been replaced by a wider spread of risks, which have usually been focused on regional themes around the globe. Nevertheless, we still consider the risks to be skewed to the downside. We attach a probability of around 50% to an outcome similar to our baseline scenario and identify several areas of risk to the upside and downside.
Domestic risks
Domestically, there are risks in either direction. The upcoming general election provides the most pressing source of uncertainty. An indecisive result and failure to establish a government with a workable majority could lead to political paralysis and undermine business confidence. And the election could result in a change of tack with regards to fiscal policy, with a large gap opening up between the degree of borrowing allowed by the main parties’ fiscal rules.8 We do not seek to predict the result of May’s election. However, we think it unlikely that the Autumn Statement projections, which imply extremely deep cuts on public spending (described in Chapter 7) in order to bring about a budget surplus of 1% of GDP in 2019–20, will be fully implemented. As a central estimate, Oxford Economics assumes that the appetite of both the government and the population for such deep cuts in public spending will wane, to the extent that public sector current expenditure rises by 7½% over the 2015–16 to 2019–20 period, in contrast to the OBR’s assumption that it rises by just under 4%. The possibility of the spending cuts being watered down further, or a switch in the focus of the cuts away from departmental spending to the benefits bill, could yield very different outcomes for the economy.
There remains a high degree of uncertainty surrounding the household sector. Households have been repairing their balance sheets since the beginning of the financial crisis, but recently the pace of deleveraging has eased and the level of household debt remains high by historical standards. Our forecast assumes that households do deleverage further, particularly as the prospect of interest rate rises begins to focus minds, but this outcome is far from certain. Indeed, the OBR’s forecast assumes that consumers releverage to the extent that the debt-to-income ratio rises well above its pre-crisis level (see Figure 4.17). In contrast, it is equally plausible that consumers opt to use the anticipated acceleration in income growth to make more rapid inroads into their debts. Which path consumers take will have significant implications for the forecast; a
8 For more information, see R. Crawford, C. Emmerson, S. Keynes and G. Tetlow, ‘Fiscal aims and austerity: the parties’ plans compared’, IFS Briefing Note BN158, http://election2015.ifs.org.uk/article/fiscal-aims-and-austerity-the-parties-plans-compared.
debt build-up like the one forecast by the OBR could generate faster growth in the short term, followed by an abrupt slowdown as households struggle to manage the higher debt levels. Meanwhile, more aggressive deleveraging could result in weaker growth in the short term, but leave consumers better placed to support growth further out.
There is also considerable uncertainty surrounding future trends in productivity and, by extension, employment. Productivity has slumped in recent years and is now around 16% below where it would have been had the pre-recession trend continued, although the latest data provided tentative signs that the situation might be starting to improve. We assume that the bulk of the shortfall can be written off as being permanent, but that the economy will achieve similar rates of productivity growth to those seen prior to the crisis. However, some economists believe that both the level of, and the potential for growth in, productivity have been permanently damaged. If this is the case, then the scope for job creation in the short term may be higher as the economy enjoys a period of rapid growth, providing some upside for consumer spending. But on the flip side, if the level of productivity has shifted downwards and productivity continues to grow at slower rates, this would imply weaker potential output growth and, as such, poorer medium-term growth prospects.
External risks
As we established in Chapter 3, the risks to the global outlook are skewed to the downside. In the rest of this section, we look at the two alternative scenarios for the global economy set out in Chapter 3 and consider how they might affect the UK.
US and eurozone upside surprise
Our upside scenario focuses on the US and eurozone economies. In the US, underlying momentum could be stronger than we think, with private sector activity flourishing on the back of stronger labour compensation, more optimistic consumers and looser credit conditions. This would create something of a virtuous circle, with firms reacting to stronger sales by investing more in capital and labour. At the same time, looser credit
100
110
120
130
140
150
160
170
180
190
19
90
1
99
1
19
92
1
99
3
19
94
1
99
5
19
96
1
99
7
19
98
1
99
9
20
00
2
00
1
20
02
2
00
3
20
04
2
00
5
20
06
2
00
7
20
08
2
00
9
20
10
2
01
1
20
12
2
01
3
20
14
2
01
5
20
16
2
01
7
20
18
2
01
9
% o
f ho
useh
old
disp
osab
le in
com
e
OBR
Oxford Economics
Forecast
94
The UK economic outlook
conditions, additional investment spending by Germany and rising private sector confidence could support a faster upturn than expected in eurozone activity.
This scenario would generate stronger growth in world trade and, given the relative importance of the US and eurozone to UK exports, the UK would be ideally placed to take advantage. Similarly, a growing risk appetite would be expected to bolster corporate confidence and convince firms to implement capital spending plans more aggressively.
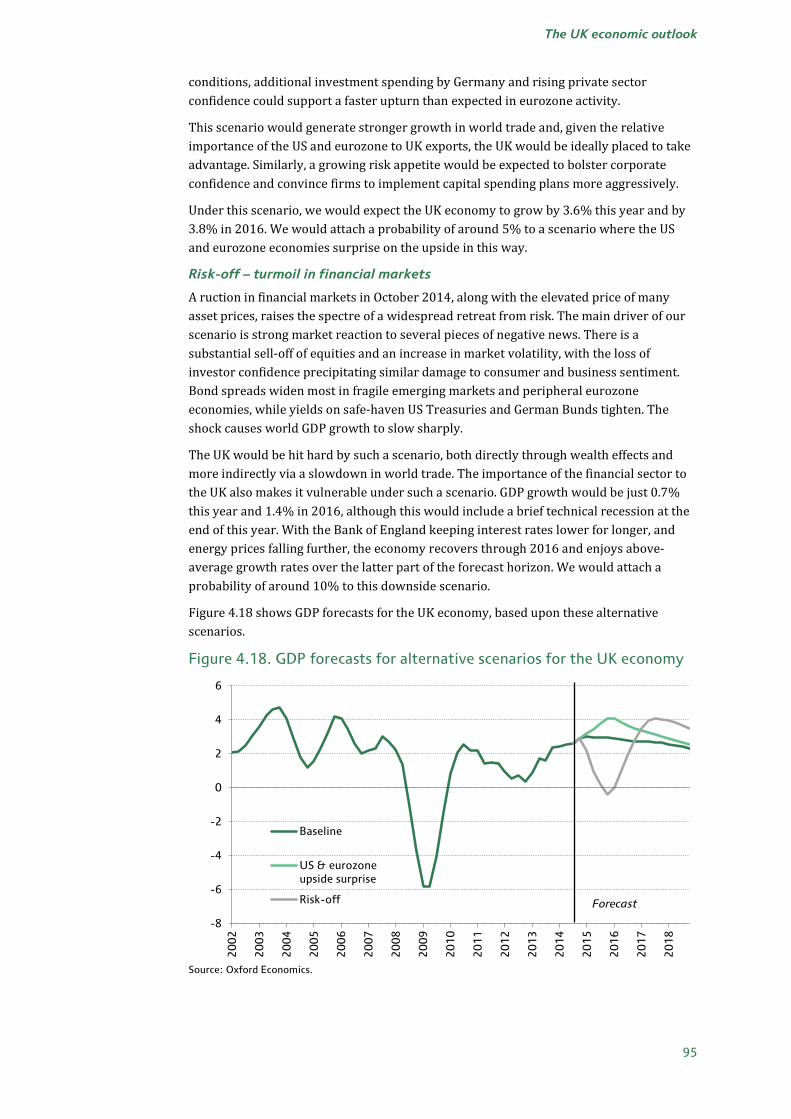
Under this scenario, we would expect the UK economy to grow by 3.6% this year and by 3.8% in 2016. We would attach a probability of around 5% to a scenario where the US and eurozone economies surprise on the upside in this way.
Risk-off – turmoil in financial markets
A ruction in financial markets in October 2014, along with the elevated price of many asset prices, raises the spectre of a widespread retreat from risk. The main driver of our scenario is strong market reaction to several pieces of negative news. There is a substantial sell-off of equities and an increase in market volatility, with the loss of investor confidence precipitating similar damage to consumer and business sentiment. Bond spreads widen most in fragile emerging markets and peripheral eurozone economies, while yields on safe-haven US Treasuries and German Bunds tighten. The shock causes world GDP growth to slow sharply.
The UK would be hit hard by such a scenario, both directly through wealth effects and more indirectly via a slowdown in world trade. The importance of the financial sector to the UK also makes it vulnerable under such a scenario. GDP growth would be just 0.7% this year and 1.4% in 2016, although this would include a brief technical recession at the end of this year. With the Bank of England keeping interest rates lower for longer, and energy prices falling further, the economy recovers through 2016 and enjoys above-average growth rates over the latter part of the forecast horizon. We would attach a probability of around 10% to this downside scenario.
Figure 4.18 shows GDP forecasts for the UK economy, based upon these alternative scenarios.
Figure 4.18. GDP forecasts for alternative scenarios for the UK economy
Source: Oxford Economics.
-8
-6
-4
-2
0
2
4
6
20
02
20
03
20
04
20
05
20
06
20
07
20
08
20
09
20
10
20
11
20
12
20
13
20
14
20
15
20
16
20
17
20
18
Baseline
US & eurozone upside surprise
Risk-off Forecast
95
The IFS Green Budget: February 2015
4.6 Conclusion
After several false starts following the financial crisis, the UK economy has finally put together a period of sustained strong growth. And though the pace of the expansion has slowed a little of late, the plunge in the price of oil offers the promise of renewed momentum in 2015.
We think that there is currently a significant amount of spare capacity in the economy, with the output gap estimated to have been around 4% of potential output at the end of 2014. Our forecast shows potential output growth averaging 2.3% a year over the period from 2015 to 2019, underpinned by further strong growth in the labour supply and robust levels of business investment. This will provide the conditions for strong growth over the medium term, with GDP growth expected to average 2.6% a year from 2015 to 2019, as well as low inflation.
The risks around our forecast are skewed to the downside. Domestically, the upcoming general election provides the most immediate source of uncertainty, with a wide range of results possible. A decisive result could mean changes to fiscal policy, while an inconclusive result and failure to establish a government with a workable majority could undermine business confidence. Future developments around household balance sheets and the potential for productivity to recover are also key sources of uncertainty. But external risks have the greatest potential to alter the outlook. Stronger recoveries in the US and eurozone are a plausible alternative, a scenario which would be particularly beneficial to the UK given its strong trading links with those areas. The biggest downside risk is a widespread retreat from risk. A substantial equity sell-off and associated confidence shock would cause world GDP growth to slow sharply and would see the UK endure a short recession in late 2015.