30 UK Economic Outlook March 2017 4 – Will robots steal our jobs? The potential impact of automation on the UK and other major economies 1 Key points • Our analysis suggests that up to 30% of UK jobs could potentially be at high risk of automation by the early 2030s, lower than the US (38%) or Germany (35%), but higher than Japan (21%). • The risks appear highest in sectors such as transportation and storage (56%), manufacturing (46%) and wholesale and retail (44%), but lower in sectors like health and social work (17%). • For individual workers, the key differentiating factor is education. For those with just GCSE-level education or lower, the estimated potential risk of automation is as high as 46% in the UK, but this falls to only around 12% for those with undergraduate degrees or higher. • However, in practice, not all of these jobs may actually be automated for a variety of economic, legal and regulatory reasons. Introduction The potential for job losses due to advances in technology is not a new phenomenon. Most famously, the Luddite protest movement of the early 19th century was a backlash by skilled handloom weavers against the mechanisation of the British textile industry that emerged as part of the Industrial Revolution (including the Jacquard loom, which with its punch card system was in some respects a forerunner of the modern computer). But, in the long run, not only were there still many (if, on average, less skilled) jobs in the new textile factories but, more importantly, the productivity gains from mechanisation created huge new wealth. This in turn generated many more jobs across the UK economy in the long run than were initially lost in the traditional handloom weaving industry. The standard economic view for most of the last two centuries has therefore been that the Luddites were wrong about the long-term benefits of the new technologies, even if they were right about the short-term impact on their personal livelihoods. Anyone putting such arguments against new technologies has generally been dismissed as believing in the ‘Luddite fallacy’. • Furthermore new automation technologies in areas like AI and robotics will both create some totally new jobs in the digital technology area and, through productivity gains, generate additional wealth and spending that will support additional jobs of existing kinds, primarily in services sectors that are less easy to automate. • The net impact of automation on total employment is therefore unclear. Average pre-tax incomes should rise due to the productivity gains, but these benefits may not be evenly spread across income groups. • There is therefore a case for some form of government intervention to ensure that the potential gains from automation are shared more widely across society through policies like increased investment in vocational education and training. Universal basic income schemes may also be considered, though these suffer from potential problems in terms of affordability and adverse effects on the incentives to work and generate wealth. 1 This article was written by Richard Berriman, a machine learning specialist and senior consultant in PwC’s Data Analytics practice, and John Hawksworth, chief economist at PwC. Additional research assistance was provided by Christopher Kelly and Robyn Foyster.
Transcript
30 UK Economic Outlook March 2017
4 – Will robots steal our jobs? The potential impact of automation on the UK and other major economies1
Key points• Our analysis suggests that up to 30%
of UK jobs could potentially be at high risk of automation by the early 2030s, lower than the US (38%) or Germany (35%), but higher than Japan (21%).
• The risks appear highest in sectors such as transportation and storage (56%), manufacturing (46%) and wholesale and retail (44%), but lower in sectors like health and social work (17%).
• For individual workers, the key differentiating factor is education. For those with just GCSE-level education or lower, the estimated potential risk of automation is as high as 46% in the UK, but this falls to only around 12% for those with undergraduate degrees or higher.
• However, in practice, not all of these jobs may actually be automated for a variety of economic, legal and regulatory reasons.
IntroductionThe potential for job losses due to advances in technology is not a new phenomenon. Most famously, the Luddite protest movement of the early 19th century was a backlash by skilled handloom weavers against the mechanisation of the British textile industry that emerged as part of the Industrial Revolution (including the Jacquardloom,whichwithitspunchcard system was in some respects a forerunner of the modern computer). But, in the long run, not only were there still many (if, on average, less skilled) jobs in the new textile factories but, more importantly, the productivity gains from mechanisation created huge new wealth. This in turn generated many more jobs across the UK economy in the long run than were initially lost in the traditional handloom weaving industry.
The standard economic view for most of the last two centuries has therefore been that the Luddites were wrong aboutthelong-termbenefitsofthe new technologies, even if they were right about the short-term impact on their personal livelihoods. Anyone putting such arguments against new technologies has generally been dismissed as believing in the ‘Luddite fallacy’.
• Furthermore new automation technologies in areas like AI and robotics will both create some totally new jobs in the digital technology area and, through productivity gains, generate additional wealth and spending that will support additional jobs of existing kinds, primarily in services sectors that are less easy to automate.
• The net impact of automation on total employment is therefore unclear. Average pre-tax incomes should rise due to the productivity gains,butthesebenefitsmaynotbeevenly spread across income groups.
• There is therefore a case for some form of government intervention to ensure that the potential gains from automation are shared more widely across society through policies like increased investment in vocational education and training. Universal basic income schemes may also be considered, though these suffer from potential problems in terms of affordability and adverse effects on the incentives to work and generate wealth.
1 This article was written by Richard Berriman, a machine learning specialist and senior consultant in PwC’s Data Analytics practice, and John Hawksworth, chief economist at PwC. Additional research assistance was provided by Christopher Kelly and Robyn Foyster.
31UK Economic Outlook March 2017
However, over the past few years, fears of technology-driven job losses have re-emerged with advances in ‘smart automation’ – the combination of AI, robotics and other digital technologies that is already producing innovations like driverless cars and trucks, intelligent virtual assistants like Siri, Alexa and Cortana, and Japanese healthcare robots.
While traditional machines, including fixedlocationindustrialrobots,replacedour muscles (and those of other animals like horses and oxen), these new smart machines have the potential to replace our minds and to move around freely in the world driven by a combination of advanced sensors, GPS tracking systems and deep learning, if not now then probably within the next decade or two. Will this just have the same effects as past technological leaps – short term disruption more than offset by long term economic gains – or is this something more fundamental in terms of taking humans out of the loop not just in manufacturing and routine service sector jobs, but more broadly across the economy? What exactly will humans have to offer employers if smart machines can perform all or most of their essential tasks better in the future2? In short, has the Luddite fallacyfinallycometrue?
2 Martin Ford, The Rise of the Robots(OneworldPublications,2015)isoneparticularlyinfluentialexampleofanauthorsettingoutthisargumentindetail.3 Inbothstudies,thisisdefinedasanestimatedprobabilityof70%ormore.Forcomparability,weadoptthesamedefinitionof‘highrisk’inthisarticle.
This debate was given added urgency in 2013 when researchers at Oxford University (Frey and Osborne, 2013) estimated that around 47% of total US employment had a “high risk of computerisation” over the next couple of decades – i.e. by the early 2030s.
However, there are also dissenting voices. Notably,Arntz,GregoryandZierahn(OECD, 2016) last year re-examined the research by Frey and Osborne and, using an extensive new OECD data set, came up with a much lower estimate that only around 10% of jobs were under a “high risk3 of computerisation”. This is based on the reasoning that any predictions of job automationshouldconsiderthespecifictasks that are involved in each job rather than the occupation as a whole.
Inthisarticlewepresentthefindingsfrom our own analysis of this topic, which builds on the research of both Frey and Osborne (hereafter ‘FO’) andArntz,GregoryandZierahn(hereafter‘AGZ’).Wethengoontodiscuss caveats to these results in terms of non-technological constraints on automation and potential offsetting job creation elsewhere in the economy (thoughthisismuchhardertoquantify).
The discussion is structured as follows:
Section 4.1 What proportion of jobs are potentially at high risk of automation?
Section 4.2 Which industry sectors and types of workers could be at the greatest risk of automation in the UK?
Section 4.3 Why does the potential risk of job automation vary by industry sector?
Section 4.4 How does the UK compare to other major economies?
Section 4.5 What economic, legal and regulatory constraints might reduce automation in practice?
Section 4.6 What offsetting job and income gains might automation generate?
Section 4.7 What implications might these trends have for public policy?
Section 4.8 Summary and conclusions.
Further details of the methodology behind our analysis in Sections 4.1-4.4 are contained in a technical annex at the end of this article, together with references to the other books and studies cited.
32 UK Economic Outlook March 2017
4.1 – What proportion of jobs are potentially at high risk of automation?
In the present article, we start by revisiting the sharply contrasting results ofFOandAGZ,whoestimaterespectivelythat around 47% and 9% of jobs in the US, and around 35%4 and 10% of jobs in the UK are at high risk of automation by, broadly speaking, the early 2030s (see Figure 4.1).
TheAGZstudyexplainsthedifferenceas the result of a shift from the occupation-based approach of FO to the task-based approach adopted in their own study. In the original study by FO, a sample of occupations taken from O*NET, an online service developed for the US Department of Labour, were hand-labelled by machine learning experts as strictly automatable or not automatable. Using a standardised set of features of an occupation, FO were then able to use a machine learning algorithm to generate a ‘probability of computerisation’ across US jobs, but crucially they generated only one prediction per occupation. By assuming the same risk in matching occupations, FO were also able to obtain estimates for the UK (other authors have also applied this approach to derive estimates for other countries).
AGZargue,drawingonearlierresearchby labour market economists such as David Autor5, that it is not whole occupations that will be replaced by computers and algorithms, but only particular tasks that are conducted as part of that occupation.
Figure 4.1 – What proportion of jobs are potentially at high risk of automation?
0
10
20
30
40
50
USUK
PwC FO AGZ
% o
f pot
entia
l job
s at
hig
h ris
kof
aut
omat
ion 30
35
10
38
47
9
Sources: PwC analysis; FO; AGZ
4 Haldane (2015) cites a Bank of England estimate of around this level for the UK based on their version of the FO analysis. This is also in line with other estimates by FO themselves for the UK.
5 For example, Autor (2015).6 See Annex for technical details of the methodology used.
Furthermore, the same occupation may be more or less susceptible to automation in different workplaces. Using the same outputs from the FO study,AGZconductedtheiranalyses on the recently compiled OECD PIAAC database that surveys task structures for individuals across more than 20 OECD countries. This includes much more detailed data on the characteristics of both particular jobs and the individuals doing them than was available to FO.
While recognising the differences in approach,itisstillsurprisingthatAGZobtain results which differ so much from those of FO, bearing in mind that they started from a similar assessment of occupation-level automatability. We therefore conducted our own analyses of the same OECD PIAAC datasetasusedintheAGZstudy.
WefirstreplicatedtheAGZstudyfindings,butthensubsequentlyenhancedtheapproach through using additional data and developing our own machine learning algorithm for identifying automation risk6. OurfindingsoffersomesupportforAGZ’sconclusion that taking into account the tasksrequiredtobecarriedoutwithineach worker’s occupation diminishes the proposed impact of job automation somewhat relative to the FO results. Nevertheless, we conclude that the particularmethodologyusedbyAGZover-exaggerated this mitigating effectsignificantly.
33UK Economic Outlook March 2017
Specifically,basedonourownpreferredmethodology, we found that around 30% of jobs in the UK are at potential high risk of automation and around 38% in the US. These estimates are based on an algorithm linking automatability to the characteristics of the tasks involved in different jobs as well as those of the workers doing them (e.g. the education and training levels required).Ourestimatesaresomewhatlower than the original estimates by FO, but still much closer to those than to the 9-10%estimatesofAGZ(seeFigure4.1).
Figure 4.2 – Potential jobs at high risk of automation by country
0
10
20
30
40
50
JapanGermanyUSUK
% o
f pot
entia
l job
s at
hig
h ris
kof
aut
omat
ion 30
3835
21
Sources: ONS; PIAAC data; PwC analysis
7 We also produced estimates for South Korea, but the results – both in aggregate and for particular industry sectors – were very similar to those for Japan, so we do notreportthemhereforreasonofspace.AGZalsoestimatedverysimilarrisksforJapanandSouthKorea,albeitwithlowerrisklevelsthanourestimatesdueto the different methodology they applied to essentially the same data set.
Before exploring our results in more detail, we want to stress one important caveat that applies both to our results andthoseofFOandAGZ.Thisisthatthese are estimates of the potential impact of job automation based on anticipated technological capabilities of AI/robotics by the early 2030s. Not only is the pace of technological advance, and so the timing of these effects uncertain, but more importantly:
• not all of these technologically feasible job automations may occur in practice for the economic, legal and regulatory reasons discussed in Section 4.5 below; and
• even if these potential job losses do materialise, they are likely to be offset by job gains elsewhere as discussed in Section 4.6 below – the net long-term effect on total human employment could be either positive or negative.
Unfortunately,itismuchmoredifficulttoquantifytheeffectsofthesecaveats,particularly at the industry level, in part because the second one involves new types of jobs being created that do not even exist now. In contrast, we can try toquantifyandanalysethenumberofjobs at potential high risk of automation by country, industry sector and type of worker as discussed below. But, in interpreting these results, we should never lose sight of these two key caveats.
Intuitively, the main reason for this isbecausethespecificapproachused byAGZbiasedtheirresultstowards jobs having only a moderate risk of automation, but we found that this was more an artefact of their methodology than a true representation of the data (see Annex for more technical details of why we reach this conclusion).
Our algorithm could also be applied to other OECD countries in the PIAAC database. For the purpose of the current article, we focus on the results for the UK, US, Germany and Japan7. We found that both the US and Germany have an increased potential risk of job automation compared to the UK, whilst Japan has a decreased potential risk of job automation (see Figure 4.2). These reasons for these differences are explore further in Section 4.4 below.
34 UK Economic Outlook March 2017
4.2 – Which industry sectors and types of workers could be at the greatest potential risk of automation in the UK?
If, for the sake of illustration, we apply our 30% estimate from the previous section to the current number of jobs in the UK8, then we might conclude (subject to the caveats noted above) that several million jobs could potentially be at high risk of automation in the UK. Broken down by industry, over half of these potential job losses are in four key industry sectors: wholesale and retail trade, manufacturing, administrative and support services, and transport and storage (see Table 4.1 and Figure 4.3 for details).
Figure 4.3 – Potential jobs at high risk of automation by UK industry sector
0 2 4 6 8 10 12
Total UK job automation
Wholesale and retail trade
Manufacturing
Administrative and support service
Transportation and stoage
Professional, scientific and technical
Human health and social work
Accomodation and food service
Construction
Public administration and defence
Information and communication
Financial and insurance
Education
Other
UK jobs at high risk of automation (millions)
10.43
2.25
1.22
1.09
0.95
0.78
0.73
0.59
0.52
0.47
0.39
0.35
0.26
0.83
Sources: ONS; PIAAC data; PwC analysis
8 Inpractice,thetotalnumberofjobsintheUKislikelytobehigherbytheearly2030s,whichistheapproximatedatebywhichwe(andFO/AGZ)assumethesepotentialjob losses from automation might occur. But, since we do not have detailed job projections that far ahead, we present some illustrative estimates using current data (for 2016) instead.
35UK Economic Outlook March 2017
The magnitude of potential job losses by sector is driven by two main components: the proportion of jobs in a sector we estimate to have potential high risk of automation, and the employment share of that sector (see Figure 4.4 and Table 4.1). The industry sector that we estimate could face the highest potential impact of job automation is the transportation and storage sector, with around 56% of jobs at potential high risk of automation. However, this sector only accounts for around 5% of total UK jobs, so the estimated number of jobs at potential high risk is around 1 million, or around 9% of all potential job losses across the UK.
Instead the highest potential impact on UK jobs is in the wholesale and retail trade sector, with around 2.3 million jobs at potential high risk of automation (22% of all UK jobs estimated to be at high risk) given that this is the largest single sector in terms of numbers of employees. Manufacturing has a similar proportion of current jobs at potential high risk (46%), but lower total numbers at high risk of around 1.2 million due to it being a smaller employer. A further 0.7 million jobs could be at potential high risk of automation in human health and social work, but this is a much lower proportion of all jobs in that sector (around 17%).
Figure 4.4 – Potential impact of job automation by UK industry sector
0 5 10 15 200
10
20
30
40
50
60
70
% o
f pot
entia
l job
s at
hig
h ris
kof
aut
omat
ion
by s
ecto
r
Employment share by sector (%)Employment share by sector (%)
Wholesaleand retail trade
Human healthand social work
Professional,scientificand technical
Education
Administrativeand support service
Manufacturing
Accomm-odationand foodservice
Construction
Public administrationand defence
Information andcommunication
Financialand insurance
Transportationand storage
Sources: ONS; PIAAC data; PwC analysis
Table 4.1 – Employment shares, estimated proportion and total number of employees at potential high risk of automation for all UK industry sectors
Industry Employment share (%)
Job automation (% at potential
high risk)
Jobs at high risk of automation
(millions)
Wholesale and retail trade 14.8% 44.0% 2.25
Manufacturing 7.6% 46.4% 1.22
Administrative and support services 8.4% 37.4% 1.09
Transportation and storage 4.9% 56.4% 0.95
Professional, scientific and technical 8.8% 25.6% 0.78
Human health and social work 12.4% 17.0% 0.73
Accommodation and food service 6.7% 25.5% 0.59
Construction 6.4% 23.7% 0.52
Public administration and defence 4.3% 32.1% 0.47
Information and communication 4.1% 27.3% 0.39
Financial and insurance 3.2% 32.2% 0.35
Education 8.7% 8.5% 0.26
Arts and entertainment 2.9% 22.3% 0.22
Other services 2.7% 18.6% 0.17
Real estate 1.7% 28.2% 0.16
Water, sewage and waste management 0.6% 62.6% 0.13
Agriculture, forestry and fishing 1.1% 18.7% 0.07
Electricity and gas supply 0.4% 31.8% 0.05
Mining and quarrying 0.2% 23.1% 0.01
Domestic personnel and self-subsistence 0.3% 8.1% 0.01
Total for all sectors 100% 30% 10.4
Sources: ONS for employment shares (2016); PwC estimates for last two columns using PIAAC data
36 UK Economic Outlook March 2017
Which types of UK workers may be most affected by automation?
The potential impact of job automation also varies according to the characteristics oftheworkers.Onaverage,wefindthatmen and, in particular, those with lower levels of education (GCSE-level and equivalentonlyorlower)areatgreaterriskof job automation. This is characteristic of the sectors that are at highest estimated risk. For example, the transportation and storage, manufacturing, and wholesale and retail trade sectors have a relatively high proportion of low education employees (34%, 22%, and 28% respectively). Men also make up the great majorityoftheworkforceinthefirsttwoof these sectors (85% and 73%).
We also estimate that private sector employees and particularly those in SMEs are most at risk, which is linked to variations in job and employee characteristics (e.g. education and traininglevelsrequired).
Table 4.2 – Employment shares, estimated proportion and total number of employees at potential high risk of automation by UK worker characteristics
Worker characteristics Employment share (%)
Job automation (% at potential
high risk)
Jobs at potential high risk of automation
(millions)
Gender:
Female 46% 26% 4.1
Male 54% 35% 6.3
Education:
Low education (GCSE level or lower) 19% 46% 3.0
Medium education 51% 36% 6.2
High education (graduates) 30% 12% 1.2
Sources: PwC estimates using PIAAC data
Table 4.3 – Estimated proportion of employees at potential high risk of automation by UK employer characteristics
Employer characteristics
Job automation (% at potential
high risk)
Public sector 22%
Private sector 34%
Employees:
<11 30%
11-1000 32%
1000+ 24%
Sources: PwC estimates using PIAAC data
37UK Economic Outlook March 2017
9 Although the considerable growth of e-learning shows that there is scope for automation in education, this may widen access to courses rather than replacing human teachers altogether. For a discussion of how UK universities can prosper in a digital age, see this report: https://www.pwc.co.uk/assets/pdf/the-2018-digital-university-staying-relevant-in-the-digital-age.pdf
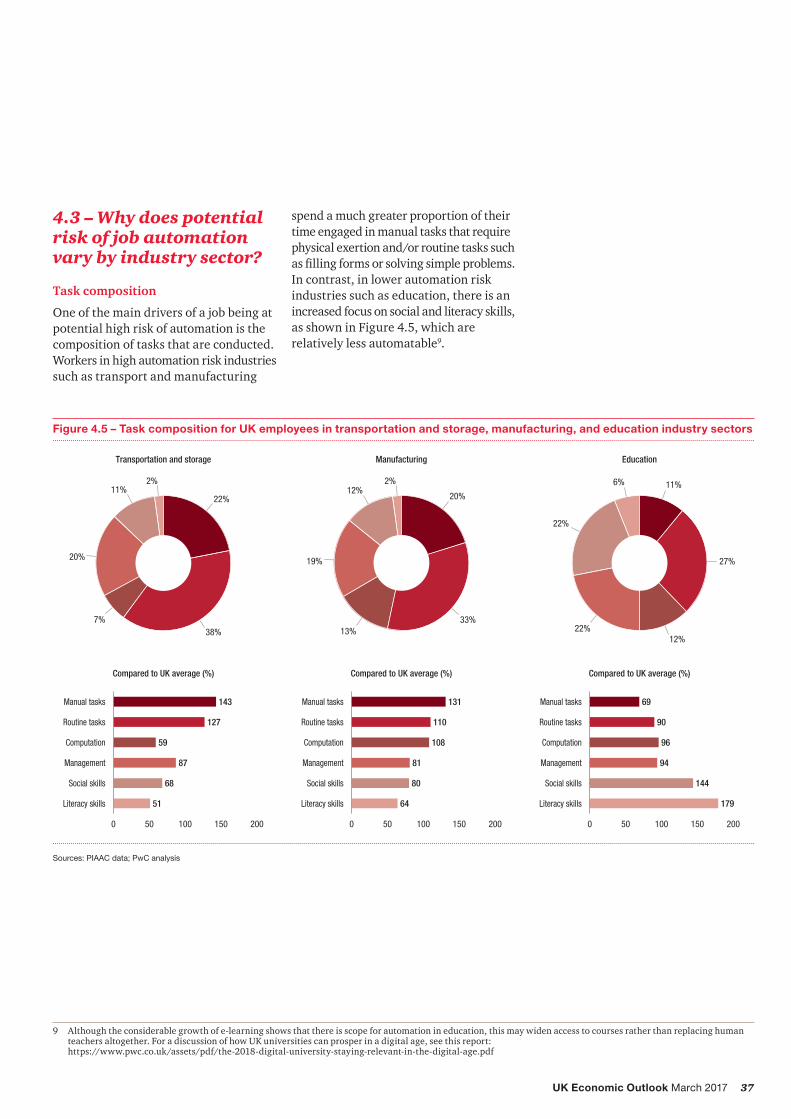
4.3 – Why does potential risk of job automation vary by industry sector?
Task composition
One of the main drivers of a job being at potential high risk of automation is the composition of tasks that are conducted. Workers in high automation risk industries such as transport and manufacturing
Figure 4.5 – Task composition for UK employees in transportation and storage, manufacturing, and education industry sectors
Sources: PIAAC data; PwC analysis
0 50 100 150 200
Manual tasks
Routine tasks
Computation
Management
Social skills
Literacy skills
0 50 100 150 200
Transportation and storage Manufacturing Education
22%
38%7%
20%
11%2% 2%
12%
19%
13%
20%
33%
11%
27%
12%22%
22%
6%
Compared to UK average (%) Compared to UK average (%) Compared to UK average (%)
Manual tasks
Routine tasks
Computation
Management
Social skills
Literacy skills
0 50 100 150 200
143
51
68
87
59
127
131
64
80
81
108
110
69
179
144
94
96
90
Manual tasks
Routine tasks
Computation
Management
Social skills
Literacy skills
spend a much greater proportion of their timeengagedinmanualtasksthatrequirephysical exertion and/or routine tasks such asfillingformsorsolvingsimpleproblems.In contrast, in lower automation risk industries such as education, there is an increased focus on social and literacy skills, as shown in Figure 4.5, which are relatively less automatable9.
38 UK Economic Outlook March 2017
Figure 4.6 – Task composition comparison for UK employees in wholesale and retail trade, and human health and social work industry sectors
Sources: PIAAC data; PwC analysis
-10 -5 0 5 10
Wholesale and retail trade Increased task share in humanhealth vs wholesale
Human health and social work
18%
31%
10%
26%
14%2%
14%
31%
10%
22%
18%
4%
-3
3
4
-4
0
0
Manual tasks
Routine tasks
Computation
Management
Social skills
Literacy skills
Worker and job characteristics
Task composition of jobs is not, however, the only driver of high automation risk. In the two largest sectors by employment share - wholesale and retail trade and human health and social work - there are broadly comparable task compositions (see Figure 4.6). However, the proportion of jobs at potential high risk of automation is over 2.5x greater in the wholesale and retail trade (44%) than for health and social work (17%).
Insteaddifferencesinjobrequirementsare the main factors that cause the risk of automation to differ between these twosectors,mostlysignificantlyasregards education.
Onthewhole,educationrequirementsare higher in the human health and social work sector, with more than twice the proportion of employees having high education levels (i.e. degree level or higher): 33% compared with 15% in wholesale and retail. Health and social work also has much lower proportions of low education workers (i.e. GCSE level or lower): 11% compared with 28% in wholesale and retail (see Figure 4.7).
Figure 4.7 – Potential impact of job automation by education level for UK employees in wholesale and retail trade, and human health and social work industry sectors
0
10
20
30
40
50
60
High education(graduates)
Medium EducationLow education(GCSE level or lower)
Wholesale and retail trade Human health and social work
% o
f pot
entia
l job
s at
high
risk
of a
utom
atio
n
28
11
57 56
15
33
Sources: PIAAC data; PwC analysis
39UK Economic Outlook March 2017
Table 4.4 – Job characteristics for UK employees in wholesale and retail trade, and human health and social work industry sectors
Wholesale and retail trade
Human health and social work
National average
Required >1 year work experience 32% 48% 47%
High educational job requirements 14% 44% 33%
More training required at work 14% 29% 21%
Moderate/complex computer use at work 51% 61% 68%
Feel challenged at work 11% 15% 12%
Responsible for staff 30% 41% 35%
Co-operate with others > 25% of the time 73% 77% 70%
Sources: PIAAC data; PwC analysis
4.4 – How does the UK compare to other major economies?
As shown in Figure 4.2 earlier in this article, we estimate that there is a greater potential impact of job automation in the US (38%) and Germany (35%) compared to the UK (30%), but a decreased potential impact in Japan (21%). As with the UK, the potential impact of job automation in other countries is driven by the industry composition of the country (i.e. the employment shares across sectors) and the relative proportion of jobs at high risk of automation in each of those sectors. However, a greater proportion of the variation between countries is explained by differences in the automatability of jobs within sectors.
The difference in education levels is also reflectedinthejobcharacteristicsforemployees in the health and social work sector. There is a much higher proportion of employees that need work experience prior to employment, have higher educationalrequirementsintheircurrent role, and are engaged in more training at work (see Table 4.4).
A more detailed examination of the occupations in both sectors also reveals that a higher proportion of occupations in health and social work are jobs that are far less automatable than in wholesale and retail trade. In particular, sales workers that comprise the majority of employment share in the wholesale and retail trade sector have twice the job automation potential (38%) compared with personal care workers in the human health and social work sector (18%).
The human health and social work sector also has a high proportion of employees (23%) in health professional or health associate professional occupations, which have particularly low automation potential according to our methodology. Advances we have seen in recent years in Japan in healthcare robots might suggest some of these model estimates could prove too low as this technology develops further and spreads to the UK, although some of these may be working with rather than replacing human workers. Similarly surgeons may be able to conduct operations remotely now using digitally-controlled robotics, but (at least for the moment) we are some way from robot surgeons carrying out operations unaided.
40 UK Economic Outlook March 2017
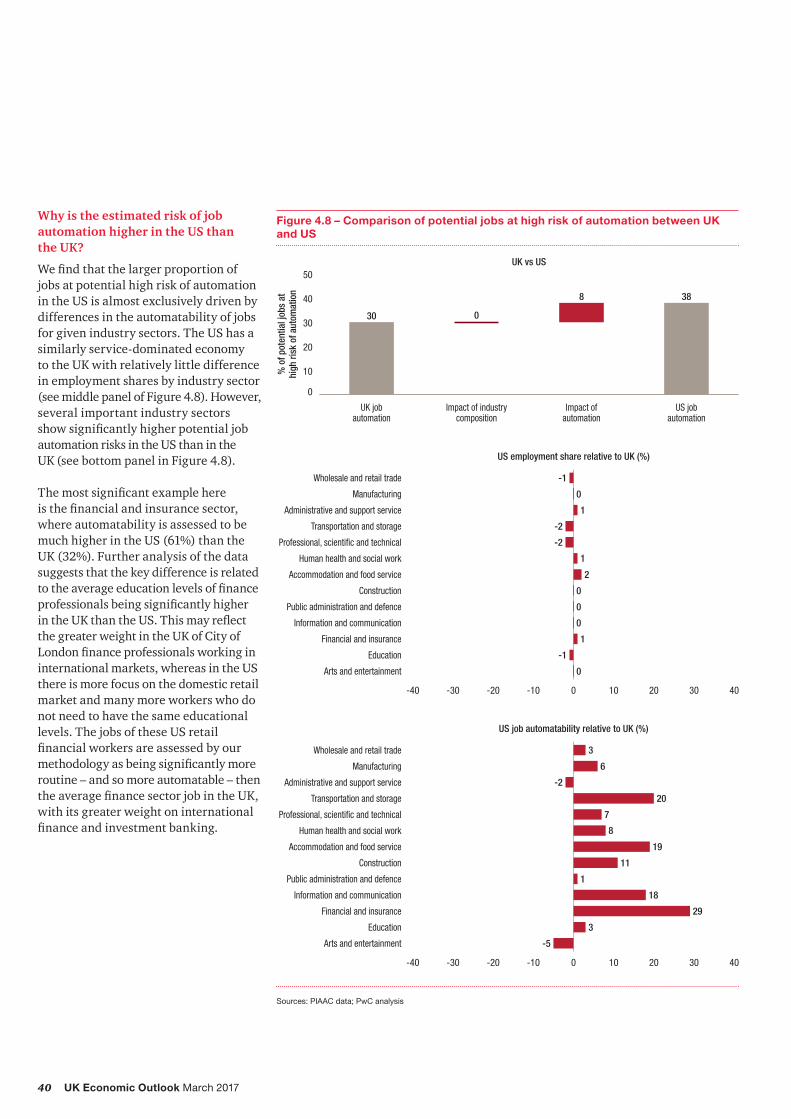
Why is the estimated risk of job automation higher in the US than the UK?
Wefindthatthelargerproportionofjobs at potential high risk of automation in the US is almost exclusively driven by differences in the automatability of jobs for given industry sectors. The US has a similarly service-dominated economy to the UK with relatively little difference in employment shares by industry sector (see middle panel of Figure 4.8). However, several important industry sectors showsignificantlyhigherpotentialjobautomation risks in the US than in the UK (see bottom panel in Figure 4.8).
Themostsignificantexamplehere isthefinancialandinsurancesector,where automatability is assessed to be much higher in the US (61%) than the UK (32%). Further analysis of the data suggests that the key difference is related totheaverageeducationlevelsoffinanceprofessionalsbeingsignificantlyhigherintheUKthantheUS.Thismayreflectthe greater weight in the UK of City of Londonfinanceprofessionalsworkingininternational markets, whereas in the US there is more focus on the domestic retail market and many more workers who do not need to have the same educational levels. The jobs of these US retail financialworkersareassessedbyourmethodologyasbeingsignificantlymoreroutine – and so more automatable – then theaveragefinancesectorjobintheUK,with its greater weight on international financeandinvestmentbanking.
Figure 4.8 – Comparison of potential jobs at high risk of automation between UK and US
Sources: PIAAC data; PwC analysis
% o
f pot
entia
l job
s at
high
risk
of a
utom
atio
n
0
10
20
30
40
50
US jobautomation
Impact ofautomation
Impact of industrycomposition
UK jobautomation
30 0
8 38
UK vs US
Wholesale and retail trade
Manufacturing
Administrative and support service
Professional, scientific and technical
Human health and social work
Accommodation and food service
Construction
Public administration and defence
Transportation and storage
Information and communication
Financial and insurance
Education
Arts and entertainment
-40 -30 -20 -10 0 10 20 30 40
US employment share relative to UK (%)
-1
0
1
-2
-2
1
2
0
0
0
1
-1
0
Wholesale and retail trade
Manufacturing
Administrative and support service
Professional, scientific and technical
Human health and social work
Accommodation and food service
Construction
Public administration and defence
Transportation and storage
Information and communication
Financial and insurance
Education
Arts and entertainment
-40 -30 -20 -10 0 10 20 30 40
US job automatability relative to UK (%)
3
6
-2
20
7
8
19
11
1
18
29
3
-5
41UK Economic Outlook March 2017
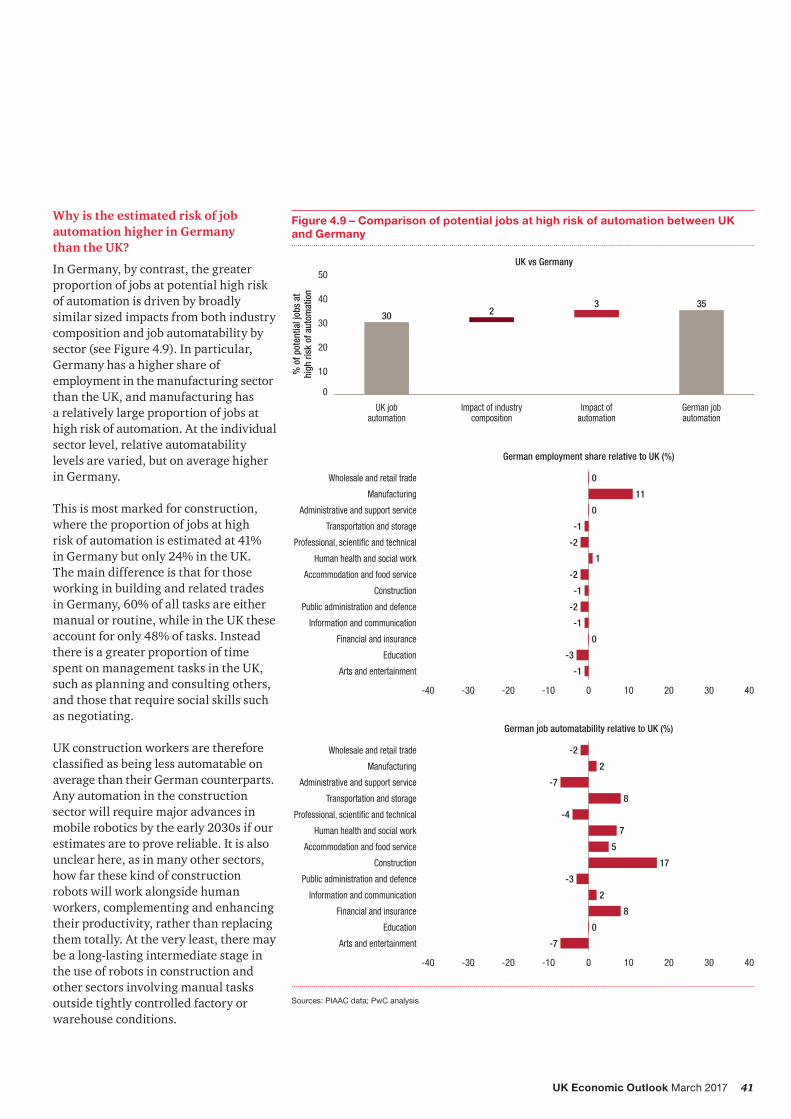
Why is the estimated risk of job automation higher in Germany than the UK?
In Germany, by contrast, the greater proportion of jobs at potential high risk of automation is driven by broadly similarsizedimpactsfrombothindustrycomposition and job automatability by sector (see Figure 4.9). In particular, Germany has a higher share of employment in the manufacturing sector than the UK, and manufacturing has a relatively large proportion of jobs at high risk of automation. At the individual sector level, relative automatability levels are varied, but on average higher in Germany.
This is most marked for construction, where the proportion of jobs at high risk of automation is estimated at 41% in Germany but only 24% in the UK. The main difference is that for those working in building and related trades in Germany, 60% of all tasks are either manual or routine, while in the UK these account for only 48% of tasks. Instead there is a greater proportion of time spent on management tasks in the UK, such as planning and consulting others, andthosethatrequiresocialskillssuchas negotiating.
UK construction workers are therefore classifiedasbeinglessautomatableonaverage than their German counterparts. Any automation in the construction sectorwillrequiremajoradvancesinmobile robotics by the early 2030s if our estimates are to prove reliable. It is also unclear here, as in many other sectors, how far these kind of construction robots will work alongside human workers, complementing and enhancing their productivity, rather than replacing them totally. At the very least, there may be a long-lasting intermediate stage in the use of robots in construction and other sectors involving manual tasks outside tightly controlled factory or warehouse conditions.
Figure 4.9 – Comparison of potential jobs at high risk of automation between UK and Germany
Sources: PIAAC data; PwC analysis
% o
f pot
entia
l job
s at
high
risk
of a
utom
atio
n
0
10
20
30
40
50
German jobautomation
Impact ofautomation
Impact of industrycomposition
UK jobautomation
30 23 35
UK vs Germany
Wholesale and retail trade
Manufacturing
Administrative and support service
Professional, scientific and technical
Human health and social work
Accommodation and food service
Construction
Public administration and defence
Transportation and storage
Information and communication
Financial and insurance
Education
Arts and entertainment
-40 -30 -20 -10 0 10 20 30 40
German employment share relative to UK (%)
0
11
0
-1
-2
1
-2
-1
-2
-1
0
-3
-1
Wholesale and retail trade
Manufacturing
Administrative and support service
Professional, scientific and technical
Human health and social work
Accommodation and food service
Construction
Public administration and defence
Transportation and storage
Information and communication
Financial and insurance
Education
Arts and entertainment
-40 -30 -20 -10 0 10 20 30 40
German job automatability relative to UK (%)
-2
2
-7
8
-4
7
5
17
-3
2
8
0
-7
42 UK Economic Outlook March 2017
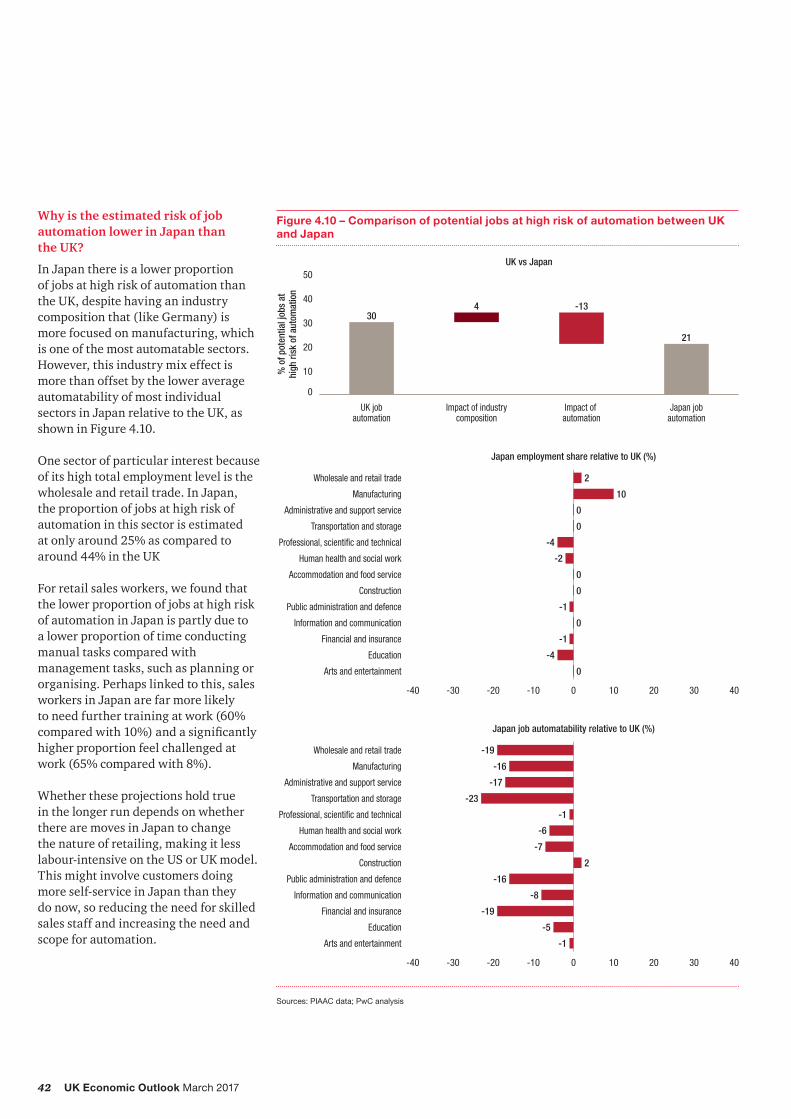
Why is the estimated risk of job automation lower in Japan than the UK?
In Japan there is a lower proportion of jobs at high risk of automation than the UK, despite having an industry composition that (like Germany) is more focused on manufacturing, which is one of the most automatable sectors. However, this industry mix effect is more than offset by the lower average automatability of most individual sectors in Japan relative to the UK, as shown in Figure 4.10.
One sector of particular interest because of its high total employment level is the wholesale and retail trade. In Japan, the proportion of jobs at high risk of automation in this sector is estimated at only around 25% as compared to around 44% in the UK
For retail sales workers, we found that the lower proportion of jobs at high risk of automation in Japan is partly due to a lower proportion of time conducting manual tasks compared with management tasks, such as planning or organising. Perhaps linked to this, sales workers in Japan are far more likely to need further training at work (60% comparedwith10%)andasignificantlyhigher proportion feel challenged at work (65% compared with 8%).
Whether these projections hold true in the longer run depends on whether there are moves in Japan to change the nature of retailing, making it less labour-intensive on the US or UK model. This might involve customers doing more self-service in Japan than they do now, so reducing the need for skilled sales staff and increasing the need and scope for automation.
Figure 4.10 – Comparison of potential jobs at high risk of automation between UK and Japan
Sources: PIAAC data; PwC analysis
% o
f pot
entia
l job
s at
high
risk
of a
utom
atio
n
0
10
20
30
40
50
Japan jobautomation
Impact of automation
Impact of industrycomposition
UK jobautomation
304 -13
21
UK vs Japan
Wholesale and retail trade
Manufacturing
Administrative and support service
Professional, scientific and technical
Human health and social work
Accommodation and food service
Construction
Public administration and defence
Transportation and storage
Information and communication
Financial and insurance
Education
Arts and entertainment
-40 -30 -20 -10 0 10 20 30 40
Japan employment share relative to UK (%)
2
10
0
0
-4
-2
0
0
-1
0
-1
-4
0
Wholesale and retail trade
Manufacturing
Administrative and support service
Professional, scientific and technical
Human health and social work
Accommodation and food service
Construction
Public administration and defence
Transportation and storage
Information and communication
Financial and insurance
Education
Arts and entertainment
-40 -30 -20 -10 0 10 20 30 40
Japan job automatability relative to UK (%)
-19
-16
-17
-23
-1
-6
-7
2
-16
-8
-19
-5
-1
43UK Economic Outlook March 2017
4.5 – What economic, legal and regulatory constraints might restrict automation in practice?
So far the analysis has focused on the technical feasibility of automation based on the characteristics of the jobs (e.g.thetasksrequiredtobedone)andtheir typical workers (e.g. education levels). But, in practice, we recognise that actual future levels of job automation may fall below these levels – or at least take longer to reach them than we might expect on purely technological grounds.
Economic constraints
Thefirstimportantconstrainthereiseconomic – just because it is technically feasible to replace a human worker with a robot, for example, does not mean that it would be economically attractive to do so. This will depend on the relative costs of robots (including energy inputs, maintenance and repairs) relative to human workers, as well as their relative productivity.
In recent years, we have seen rapid total employment growth in the UK, driven in part by relatively subdued (or negative) real wage growth.
Furthermore,arelativelyflexibleUKlabour market that has been open to migration from the EU in particular has made it a comparatively attractive option for companies in many sectors to expand by hiring more people, rather than incurring potentially large up-front costs by investing in new technologies such as AI and mobile robots, which will also seem relatively risky as they may not have been widely tested in practice.
Why take the risk of such investments when there is a low risk, low cost human alternative? Such considerations would apply in sectors like transport, retail and wholesale, hotels and restaurants, and food processing.
Over time, however, we would expect these economic factors to become less significantasthecostofthenewdigitaltechnologiesfalls(quitepossiblyveryrapidly if a robotic version of Moore’s Law turns out to apply) and they become more widely adopted, leading them to seem less risky and untested by companies that were not early adopters. But it remains highly uncertain in many sectors with low current adoption of robots when the ‘tipping point’ to much higher adoption will be reached. Organisational inertia and legacy systems may push back the timing of any such shifts towards automation even if they become technically and economically feasible.
Legal and regulatory constraints
Even if economic barriers to adopting automation can eventually be overcome, however,therecouldalsobesignificantlegal and regulatory hurdles to negotiate.
In the case of driverless vehicles10, for example, the issue of who bears the liabilityforaccidentsisadifficultone to resolve – is it the car manufacturer, the manufacturer of the sensors on the car, the provider of the computer software that makes driving decisions, or some combination of these and other suppliers? What about the liability of the human passenger if he or she is expected to take manual control of the vehicle when signalled to do so by the vehicle’s computer but failed to do so? And should driverless cars be expected to satisfy higher safety standards then human drivers if that is one of their key selling points?
In the long run, we would expect these kind of legal and regulatory barriers to be overcome in those industries where automation makes economic sense and is technically feasible. But there may often be powerful vested interests arguing against too rapid an advance in automation, so it may well be that realisation of the full potential automation mayoccursignificantlylaterthantheearly 2030s timescale we assume in this report (in line with the original FO study).
10 For a more detailed discussion of these issues, see PwC Strategy&’s 2016 Connected Car report here: http://www.strategyand.pwc.com/reports/connected-car-2016-study
44 UK Economic Outlook March 2017
4.6 – What offsetting job and income gains might automation generate?
Another key caveat noted earlier in this article is that we have focused so far on estimating the potential job losses from automation. In practice, however, there shouldalsobesignificantgainsfromthese technologies in terms of:
• completely new types of jobs being created related to these new digital technologies; and
• moresignificantlyinquantitativeterms, the wealth from these innovations being recycled into additional spending, so generating demand for extra jobs in less automatable sectors where humans retain a comparative advantage over smart machines.
These offsetting gains are not easy to quantify,butinanearlierPwCstudy11 with Carl Frey, we estimated that around 6% of all UK jobs in 2013 were of a kind that did not exist at all in 1990. Moreover, in London, this proportion rose to around 10% of all jobs. These were mostly related to new digital technologies such as computing and communications. Similarly, by the 2030s, 5% or more of UK jobs may be in areas related to new robotics/AI of a kind that do not even existnow.Itisverydifficulttoknow what these new types of jobs will be in advance, but past experience suggests that there will be some job gains from thissource,albeitprobablysignificantlyless than the around 30% potential job losses from automation discussed above.
Themoresignificantoffsettingfactoristhat these new automated technologies will boost productivity considerably over time12 (if not, they will not be adopted on economic grounds). This will generate extra incomes, initially for the owners oftheintellectualandfinancialcapitalbehind the new technologies, but feeding into the wider economy as this income is spent or invested in other areas. This additional demand will generate increased jobs and incomes in sectors that are less automatable, including healthcare and other personal services where robots may not be able to totally replace, as opposed to complement and enhance, workers with the human touch for the foreseeable future13.
The historical evidence suggests that this will eventually lead to:
• broadly similar overall rates of employment for human workers, although with different distributions across industry sectors and types of jobs than now;
• higher average real income levels across the country as a whole due to higher overall productivity;
• butquitepossiblyalsoamoreskewedincome distribution with a greater proportion going to those with the skills to thrive in an ever more digital economy – this would put a premium not just on education levels when entering the workforce, but also the ability to adapt over time and reskill throughout a working life.
11 C. Frey and J. Hawksworth (PwC, 2015): http://www.pwc.co.uk/assets/pdf/ukeo-regional-march-2015.pdf12 See,forexample,this2015PwCreportonthepotentialproductivitybenefitsofservicerobots:
14 An area where the UK lags well behind countries like Germany as highlighted in our 2016 Young Workers Index report here: http://www.pwc.co.uk/services/economics-policy/insights/young-workers-index.html
4.7 – What implications might these trends have for public policy?
The latter point raises important public policy issues. The less controversial one is that the government, working with employers and education providers, should invest more in the types of education and training that will be most useful to people in this increasingly automated world. Exactly how to identify theskillsthatwillberequiredanddevelopthe training is much more complex of course – for many people, this will involve an increased focus on vocational training14 that is constantly updated to stay one stepaheadoftherobots.Italsorequiresbetter matching of workers to the new opportunities that will arise in an increasingly digital economy. But the principle of investing more in education, skills and retraining seems widely accepted.
Central and local government bodies also needs to support digital sectors that can generate new jobs, for example through place-based strategies centred around university research centres, science parks and other enablers of business growth. This place-based approach is one of the key themes in the government’s new industrial strategy and its wider devolution agenda. It also involves extending the latest digital infrastructure beyond the major urban centres to facilitate small digital start-ups in other parts of the country.
45UK Economic Outlook March 2017
More controversial is whether governments should intervene more directly to redistribute income15. In particular, the idea of a universal basic income (UBI) has gained traction in Silicon Valley and elsewhere as a potential way to maintain the incomes of those who lose out from automation and (to be hard headed about it) whose consumption is important to keep the economy going. The problem with UBI schemes, however, is that they involve paying a lot of public money to many people who do not need it, as well as those that do. As such the danger is that such schemes are either unaffordable or destroy incentives to work and generate wealth, or they need to be set too low to provide an effective safety net.
Nonetheless, we are now seeing practical trials of UBI schemes in a number of countries around the world including Finland, the Netherlands, some US andCanadianstates,IndiaandBrazil.The details of these schemes vary considerably, and it is beyond the scope of this article to review them in depth, but it seems likely that more pilot schemes of this kind will emerge around the world and that they will come on to the policy agenda in the UK as well. For the moment, theneedtoreducetheUKbudgetdeficitmaybeasignificantbarriertoanysuchscheme on a national level, as well as concerns about the social acceptability of giving people ‘money for nothing’. Butthewiderquestionofhowtodealwith possible widening income gaps arising from increased automation seems unlikely to go away.
15 AnotherideahereistherecentsuggestionofBillGatestotaxrobotswherethesedisplacehumanlabour.However,itisnotclearthatsuchaspecifictaxoninvestmentinrobotswouldbeeconomicallyefficient.Otherlabour-savingtechnologiesdonotfacesuchspecifictaxes,sowhysinglerobotsoutforsuchtreatmentandpotentiallyloseproductivity gains from such innovation and investment?
4.8 – Summary and conclusions
Our analysis suggests that around 30% of UK jobs could potentially be at high risk of automation by the early 2030s, lower than the US (38%) or Germany (35%), but higher than Japan (21%).
The risks appear highest in sectors such as transportation and storage (56%), manufacturing (46%) and wholesale and retail (44%), but lower in sectors like health and social work (17%).
For individual workers, the key differentiating factor is education. For those with just GCSE-level education or lower, the estimated potential risk of automation is as high as 46% in the UK, but this falls to only around 12% for those with undergraduate degrees or higher.
However, in practice, not all of these jobs may actually be automated for a variety of economic, legal and regulatory reasons.
Furthermore new technologies in areas like AI and robotics will both create some totally new jobs in the digital technology area and, through productivity gains, generate additional wealth and spending that will support additional jobs of existing kinds, primarily in services sectors that are less easy to automate.
The net impact of automation on total employment is therefore unclear. Average pre-tax incomes should rise due to the productivitygains,butthesebenefitswillprobably not be evenly spread across income groups. The pay premium for higher education and non-automatable skills will also probably rise ever higher.
There is therefore a case for some form of government intervention to ensure that the potential gains from automation are shared more widely across society through policies in areas like education, vocational training and job matching. Some form of universal basic income scheme might also be considered though this does face problems relating to affordability and potential adverse incentive effects that would need to be addressed.
46 UK Economic Outlook March 2017
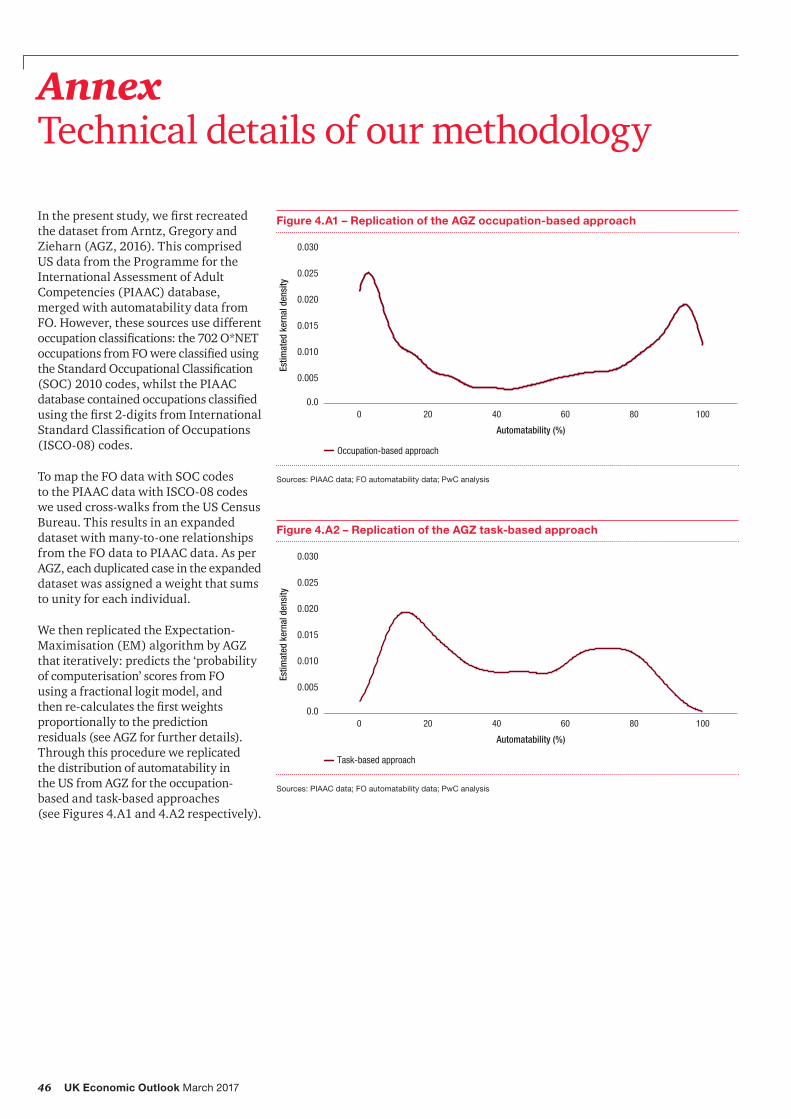
Inthepresentstudy,wefirstrecreatedthedatasetfromArntz,GregoryandZieharn(AGZ,2016).Thiscomprised US data from the Programme for the International Assessment of Adult Competencies (PIAAC) database, merged with automatability data from FO. However, these sources use different occupationclassifications:the702O*NEToccupationsfromFOwereclassifiedusingtheStandardOccupationalClassification(SOC) 2010 codes, whilst the PIAAC databasecontainedoccupationsclassifiedusingthefirst2-digitsfromInternationalStandardClassificationofOccupations(ISCO-08) codes.
To map the FO data with SOC codes to the PIAAC data with ISCO-08 codes we used cross-walks from the US Census Bureau. This results in an expanded dataset with many-to-one relationships from the FO data to PIAAC data. As per AGZ,eachduplicatedcaseintheexpandeddataset was assigned a weight that sums to unity for each individual.
We then replicated the Expectation-Maximisation(EM)algorithmbyAGZthat iteratively: predicts the ‘probability of computerisation’ scores from FO using a fractional logit model, and thenre-calculatesthefirstweightsproportionally to the prediction residuals(seeAGZforfurtherdetails).Through this procedure we replicated the distribution of automatability in theUSfromAGZfortheoccupation- based and task-based approaches (see Figures 4.A1 and 4.A2 respectively).
Annex Technical details of our methodology
Figure 4.A2 – Replication of the AGZ task-based approach
However, we consider that the low proportion of jobs with ‘high automatability’ (i.e.>70%riskofautomation)inAGZ’stask-based approach is an artefact of their predictive model. To illustrate this we re-simulatedtheEMalgorithmfromAGZusing different sets of predictive features (see Figure 4.A3).
As the feature set increases from ‘feature set 1’ to ‘feature set 3’ and performance metricsoftheclassifierimprove,thetask-based approach curve shifts from the centre to more closely match the occupation-based approach distribution. Accordingly, the proportion of jobs estimated to have high automatability also increases. In other words, the more predictive the model the higher the estimation of high automatability jobs.
To improve the methodology we split the analytics into two parts: an initial application of the EM algorithm to only re-weight the cross-walked dataset, and a second phase of building an enhanced classifieralgorithm.Are-simulation of the task-based approach with the EM method for weights only is shown in Figure 4.A4.
The algorithm developed using the US extended dataset was then applied to the original US dataset and recalibrated accordingly. This enhanced and recalibrated model could then be applied to each of the other OECD countries. The present report contains results for the US, UK, Germany and Japan.
Figure 4.A3 – Re-simulated task-based approach
0.0
0.005
0.010
0.015
0.020
0.025
0.030
100806040200
Occupation-based approach Feature set 1 Feature set 2 Feature set 3
Arntz,M.,T.GregoryandU.Zierahn(2016),‘TheriskofautomationforjobsinOECDcountries:acomparativeanalysis’,OECDSocial,EmploymentandMigrationWorkingPapersNo189Autor, D. H. (2015), “Why are there still so many jobs? The history and future of workplace automation”, Journal of Economic Perspectives, 29(3), pp.3-30.Ford, M. (2015), The Rise of the Robots, Oneworld Publications.Frey, C.B. and M.A. Osborne (2013), The Future of Employment: How Susceptible are Jobs to Computerization?, University of Oxford.Frey, C.B. and J. Hawksworth (2015), ‘New job creation in the UK: which regions will gain the most from the digital revolution?’, PwC UK Economic Outlook, March 2015. Available from: http://www.pwc.co.uk/assets/pdf/ukeo-regional-march-2015.pdf Haldane, A. (2015) ‘Labour’s share’, speech to the TUC, London, 15 November 2015. Available from: http://www.bankofengland.co.uk/publications/Pages/speeches/2015/864.aspx PwC Strategy& Connected Car Report (2016). Available from: http://www.strategyand.pwc.com/reports/connected-car-2016-study PwC Technology Forecast (2015), ‘Service robots: the next big productivity platform’. Available from: http://www.pwc.com/us/en/technology-forecast/2015/robotics/features/service-robots-big-productivity-platform.html PwC (2016), The 2018 digital university: staying relevant in a digital age. Available here: https://www.pwc.co.uk/assets/pdf/the-2018-digital-university-staying-relevant-in-the-digital-age.pdf PwC (2016), Young Workers Index: Empowering a new generation. Available here: http://www.pwc.co.uk/services/economics-policy/insights/young-workers-index.html
www.pwc.co.uk/economics
At PwC, our purpose is to build trust in society and solve important problems. PwC is a network of firms in 157 countries with more than 223,000 people who are committed to delivering quality in assurance, advisory and tax services. Find out more and tell us what matters to you by visiting us at www.pwc.com/UK.
This publication has been prepared for general guidance on matters of interest only, and does not constitute professional advice. You should not act upon the information contained in this publication without obtaining specific professional advice. No representation or warranty (express or implied) is given as to the accuracy or completeness of the information contained in this publication, and, to the extent permitted by law, PricewaterhouseCoopers LLP, its members, employees and agents do not accept or assume any liability, responsibility or duty of care for any consequences of you or anyone else acting, or refraining to act, in reliance on the information contained in this publication or for any decision based on it.