BUFFALO NIAGARA INTERNATIONAL AIRPORT PB Aviation October 26, 2004 PART 150 NOISE COMPATIBILITY STUDY - VOLUME I PAGE 4-1 4.0 EXISTING NOISE EXPOSURE MAP The FAR Part 150 process requires a thorough examination of current airport activity and depiction of existing aircraft noise levels on a map that represents the area exposed to aircraft noise. This chapter examines those characteristics of the BNIA’s airfield use that are reflected in the 2003 noise contours. This analysis establishes a base case which means that the noise contours reflect existing patterns of aircraft activity without noise abatement measures beyond those currently in place. The Existing Noise Exposure Map (NEM) is provided at the end of this chapter and graphically depicts the results of the evaluation. The noise impacts are measured through the use of the FAA’s Integrated Noise Model (INM) version 6.1. The INM, which is described in Chapter 2.0, contains an extensive database on the noise and operational characteristics of various aircraft types currently in use. When input with airport-specific data such as runway layout, runway utilization, flight tracks, flight track utilization, fleet mix, and aircraft activity levels, the model calculates noise levels and produces contours illustrating average daily noise impacts to areas around an airport. Input factors used in evaluating aircraft noise impacts and developing the 2003 noise contours for the BNIA included aircraft activity levels and specific operational characteristics. Noise monitoring data were used to validate the assumptions for the modeling effort. A summary of the noise monitoring effort is provided in Appendix A. Noise abatement procedures currently in use at the Airport are also reflected in the input data assumptions that were developed for the INM. 4.1 EXISTING NOISE ABATEMENT PROCEDURES The BNIA has a number of existing procedures designed to reduce aircraft noise levels in the noise-sensitive areas around the Airport. These procedures generally pertain to the path taken by aircraft on arrival to or departure from the Airport, irrespective of the time of day.
Transcript
BUFFALO NIAGARA INTERNATIONAL AIRPORT PB Aviation October 26, 2004 PART 150 NOISE COMPATIBILITY STUDY - VOLUME I PAGE 4-1
4.0 EXISTING NOISE EXPOSURE MAP
The FAR Part 150 process requires a thorough examination of current airport activity and
depiction of existing aircraft noise levels on a map that represents the area exposed to aircraft
noise. This chapter examines those characteristics of the BNIA’s airfield use that are reflected in
the 2003 noise contours. This analysis establishes a base case which means that the noise
contours reflect existing patterns of aircraft activity without noise abatement measures beyond
those currently in place. The Existing Noise Exposure Map (NEM) is provided at the end of this
chapter and graphically depicts the results of the evaluation.
The noise impacts are measured through the use of the FAA’s Integrated Noise Model
(INM) version 6.1. The INM, which is described in Chapter 2.0, contains an extensive database
on the noise and operational characteristics of various aircraft types currently in use. When input
with airport-specific data such as runway layout, runway utilization, flight tracks, flight track
utilization, fleet mix, and aircraft activity levels, the model calculates noise levels and produces
contours illustrating average daily noise impacts to areas around an airport.
Input factors used in evaluating aircraft noise impacts and developing the 2003 noise
contours for the BNIA included aircraft activity levels and specific operational characteristics.
Noise monitoring data were used to validate the assumptions for the modeling effort. A
summary of the noise monitoring effort is provided in Appendix A. Noise abatement procedures
currently in use at the Airport are also reflected in the input data assumptions that were
developed for the INM.
4.1 EXISTING NOISE ABATEMENT PROCEDURES
The BNIA has a number of existing procedures designed to reduce aircraft noise levels in
the noise-sensitive areas around the Airport. These procedures generally pertain to the path
taken by aircraft on arrival to or departure from the Airport, irrespective of the time of day.
4.0 EXISTING NOISE EXPOSURE MAP
BUFFALO NIAGARA INTERNATIONAL AIRPORT PB Aviation October 26, 2004 PART 150 NOISE COMPATIBILITY STUDY - VOLUME I PAGE 4-2
Additional measures are employed during quiet nighttime hours. The Airport’s existing noise
abatement procedures are listed as follows:
• Visual flight rules (VFR) arrivals and instrument flight rules (IFR) aircraft cleared for visual approaches on Runway 5 are requested to proceed to a point 5 miles southwest of the Airport before turning inbound on final approach. VFR arrivals and IFR aircraft cleared for visual approaches on Runway 23 are requested to proceed to a point 5 miles northeast of the Airport before turning inbound on final approach.
• VFR arrivals and IFR aircraft cleared for visual approaches on Runway 14 and 32 are
requested to maintain 2,300 feet mean sea level (MSL) as long as practicable before descending to land.
• Departing aircraft should remain on runway heading to an elevation of 3,000 feet MSL
before proceeding on course. • Quiet Time is designated as between 11:00 p.m. and 6:00 a.m. • All multi-engine aircraft regardless of weight are requested to refrain from using Runway
14/32 for arrivals and departures during Quiet Time, unless runway or wind conditions dictate no alternative.
• Aircraft operating on Taxiway M and/or the cargo ramp are requested to refrain from
high speed, high power taxiing and/or run-up. No engine run-ups are approved during Quiet Time.
All of the noise abatement measures listed above are informal and are used when wind,
weather and capacity conditions permit.
4.2 AIRCRAFT ACTIVITY
The number and type of aircraft operations and the manner in which aircraft arrive to and
depart from an airport are the principal determinants of the size of the aircraft noise contours.
and day/night operational split were obtained from a variety of sources including: the FAA’s Air
Traffic Operations Network (OPSNET), flight strips from Air Traffic Control (ATC) personnel,
Data Access Planning Module by the Airline Planning Group, LLC (a computerized data base
4.0 EXISTING NOISE EXPOSURE MAP
BUFFALO NIAGARA INTERNATIONAL AIRPORT PB Aviation October 26, 2004 PART 150 NOISE COMPATIBILITY STUDY - VOLUME I PAGE 4-3
used by the BNIA staff to monitor airline activity), interviews with ATC personnel, and on-site
observations.
4.2.1 Operational Levels
Average day operations are derived by dividing total annual operations by 365
days. The 2003 base case number of annual aircraft operations at the Airport is based on
the BNIA Statistics Reporting Forms and the computer data base of scheduled airline
activity.
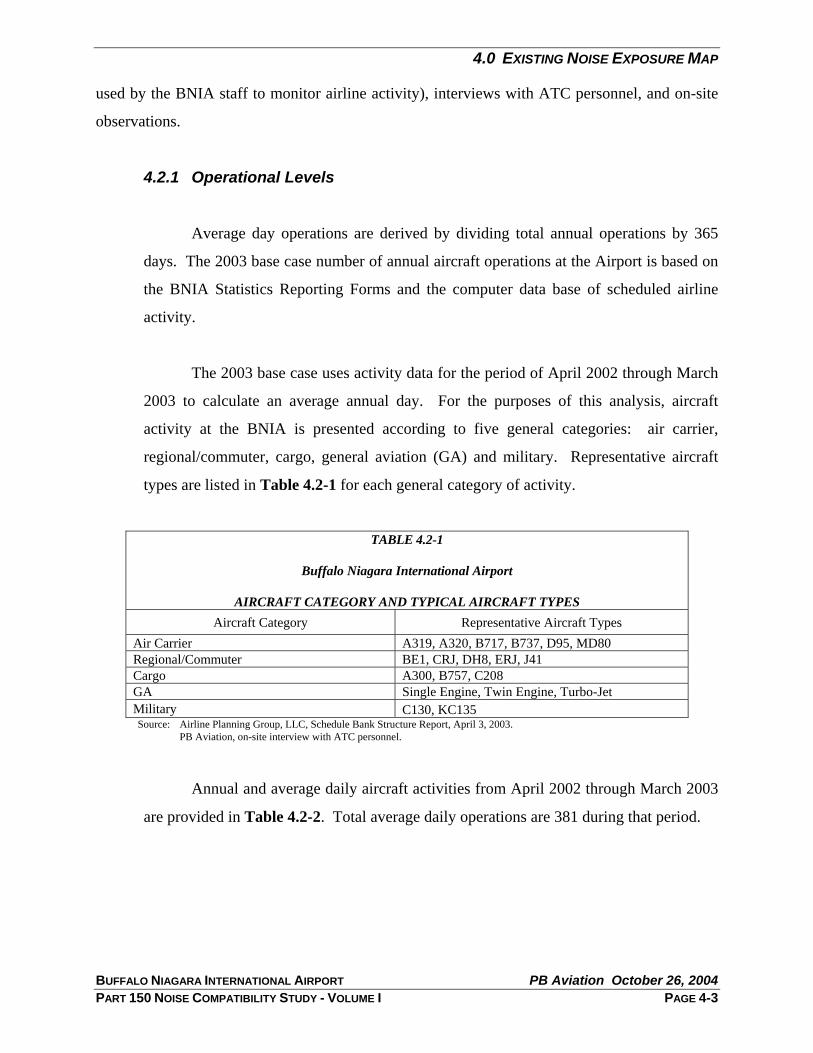
The 2003 base case uses activity data for the period of April 2002 through March
2003 to calculate an average annual day. For the purposes of this analysis, aircraft
activity at the BNIA is presented according to five general categories: air carrier,
regional/commuter, cargo, general aviation (GA) and military. Representative aircraft
types are listed in Table 4.2-1 for each general category of activity.
TABLE 4.2-1
Buffalo Niagara International Airport
AIRCRAFT CATEGORY AND TYPICAL AIRCRAFT TYPES
Aircraft Category Representative Aircraft Types Air Carrier A319, A320, B717, B737, D95, MD80 Regional/Commuter BE1, CRJ, DH8, ERJ, J41 Cargo A300, B757, C208 GA Single Engine, Twin Engine, Turbo-Jet Military C130, KC135 Source: Airline Planning Group, LLC, Schedule Bank Structure Report, April 3, 2003.
PB Aviation, on-site interview with ATC personnel.
Annual and average daily aircraft activities from April 2002 through March 2003
are provided in Table 4.2-2. Total average daily operations are 381 during that period.
4.0 EXISTING NOISE EXPOSURE MAP
BUFFALO NIAGARA INTERNATIONAL AIRPORT PB Aviation October 26, 2004 PART 150 NOISE COMPATIBILITY STUDY - VOLUME I PAGE 4-4
TABLE 4.2-2
Buffalo Niagara International Airport
ANNUAL AND DAILY AIRCRAFT OPERATIONS
Aircraft Categories Annual Average Annual Day
Air Carrier 43,070 118 Regional/Commuter 31,450 86 Cargo 9,155 25 GA 48,928 134 Military 6,504 18 Total 139,107 381
Source: Airline Planning Group, LLC, Schedule Bank Structure Report, April 3, 2003 the BNIA Statistics Reporting Forms, April 2002 to February 2003. OPSNET Buffalo Tower Traffic Density Index and Statistical Data, April 2002 to March 2003.
4.2.2 Fleet Mix
Fleet mix refers to the various categories of aircraft operating at an airport.
Information on the BNIA’s exiting fleet mix was obtained from NFTA’s database of
scheduled activity, the Official Airline Guide (April 2003), and discussions with ATC
personnel.
Table 4.2-3 lists the aircraft fleet mix assumed in developing the BNIA’s Existing
NEM.
Aircraft noise monitoring activities, conducted during the period of May 19
through May 31, enabled a comparison of measured sound levels to the output from the
INM for the larger, air carrier aircraft using the BNIA. The monitoring information was
used to check the appropriateness of the INM designation, i.e., database identifier, for
individual aircraft types. Specifically, noise monitoring was used to select the best match
substitutions for B727 (B727EM1), EMB145 (E14L) and MD 80 (MD83) aircraft.
4.0 EXISTING NOISE EXPOSURE MAP
BUFFALO NIAGARA INTERNATIONAL AIRPORT PB Aviation October 26, 2004 PART 150 NOISE COMPATIBILITY STUDY - VOLUME I PAGE 4-5
TABLE 4.2-3
Buffalo Niagara International Airport
AIRCRAFT FLEET MIX
Category/ Aircraft Types
Noise Level Designator1
INM Designation2
Percent of Fleet
Air Carrier Airbus 320 3 A320 3.09% Boeing 717-200 3 717200 0.73% Boeing 727-200 3 727EM2 1.72% Boeing 737-300 3 737300 7.82% Boeing 737-400 3 737400 2.81% Boeing 737-500 3 737500 3.18% Boeing 737-700 3 737700 4.67% McDonnell Douglas DC9-50 3 DC95HW 1.74% McDonnell Douglas DC9-30 3 DC93LW 3.54% McDonnell Douglas MD-80 3 MD83 1.60% Sub-total 30.91% Regional/Commuter Beechcraft N/A DHC6 3.18% Canadair Regional Jet 3 CL601 3.09% de Havilland DHC8 3 DHC8 5.12% Embraer Regional Jet 3 E14L 10.01% Jet Stream 41 3 SF340 0.87% Saab 340 3 SF340 0.37% Sub-total 22.64% Cargo Airbus 300 3 A300 0.31% Boeing 727-100 3 727EM1 0.52% Boeing 727-200 3 727EM2 0.39% Boeing 737 3 737N9 0.05% Boeing 757 3 757RR 0.66% Cessna 208 3 GASEPF 1.84% McDonnell Douglas DC-9 3 DC95HW 0.26% Embraer 110 N/A DHC6 1.31% Piper 31 N/A BEC58P 1.31% Sub-total 6.67% GA Single-Engine N/A GASEPV 3.50% Twin-Engine N/A BEC58P 22.72% Turbo-Jet 3 LEAR35 8.85% Sub-total 35.07% Military C130 3 C130 3.78%
KC-135 N/A KC-135 0.94% Sub-total 4.72%
Source: PB Aviation, on-site observations and interviews with the BNIA ATC personnel. Airline Planning Group, LLC, Schedule Bank Structure Report, April 3, 2003 1. For purposes of showing compliance with federal aircraft noise guidelines, FAR 36 assigns a "noise designator"(Stage 1, Stage 2, and Stage 3) for all transport category large airplanes and turbojet powered aircraft. 2. This column identifies the aircraft noise database identifier for the INM. For aircraft not included in the INM database, an FAA approved substitute aircraft is identified.
4.0 EXISTING NOISE EXPOSURE MAP
BUFFALO NIAGARA INTERNATIONAL AIRPORT PB Aviation October 26, 2004 PART 150 NOISE COMPATIBILITY STUDY - VOLUME I PAGE 4-6
All civilian jet aircraft weighing more than 75,000 pounds comply with Stage 3.
As of the writing of this document, more stringent Stage 4 requirements were in
discussion at the federal level. Should Stage 4 be implemented, it is anticipated that
aircraft with engines that have been “hush-kitted” to comply with Stage 3 requirements
will be regulated out of the fleet (i.e. B737-200 and DC9-30).
4.2.3 Stage Length
Stage length refers to the distance an aircraft travels. Each stage is associated
with a takeoff weight that represents the typical fuel load required for that travel distance.
The INM accounts for these various load factors based upon the initial distance traveled.
Departure stage lengths indicate the range in nautical miles that an aircraft travels
(non-stop) to reach its destination. For example, a departure stage length of 1 indicates a
destination range of 0 to 500 nautical miles while a departure stage length of 2 refers to a
destination distance of 500 to 1,000 nautical miles. This is an important consideration in
the noise analysis because longer stage lengths require more fuel which increases aircraft
weight and takeoff roll and decreases climb performance. This in turn affects aircraft
noise on the ground.
Stage lengths for air carrier/cargo jet and regional/commuter aircraft were initially
determined by the BNIA’s database of scheduled activity at the BNIA. Conversations
with ATC personnel confirmed that all GA, cargo non-jet, and military aircraft stage
lengths were 500 nautical miles or less. The percentage distribution among the stage
length categories for departing flights is summarized in Table 4.2-4.
4.0 EXISTING NOISE EXPOSURE MAP
BUFFALO NIAGARA INTERNATIONAL AIRPORT PB Aviation October 26, 2004 PART 150 NOISE COMPATIBILITY STUDY - VOLUME I PAGE 4-7
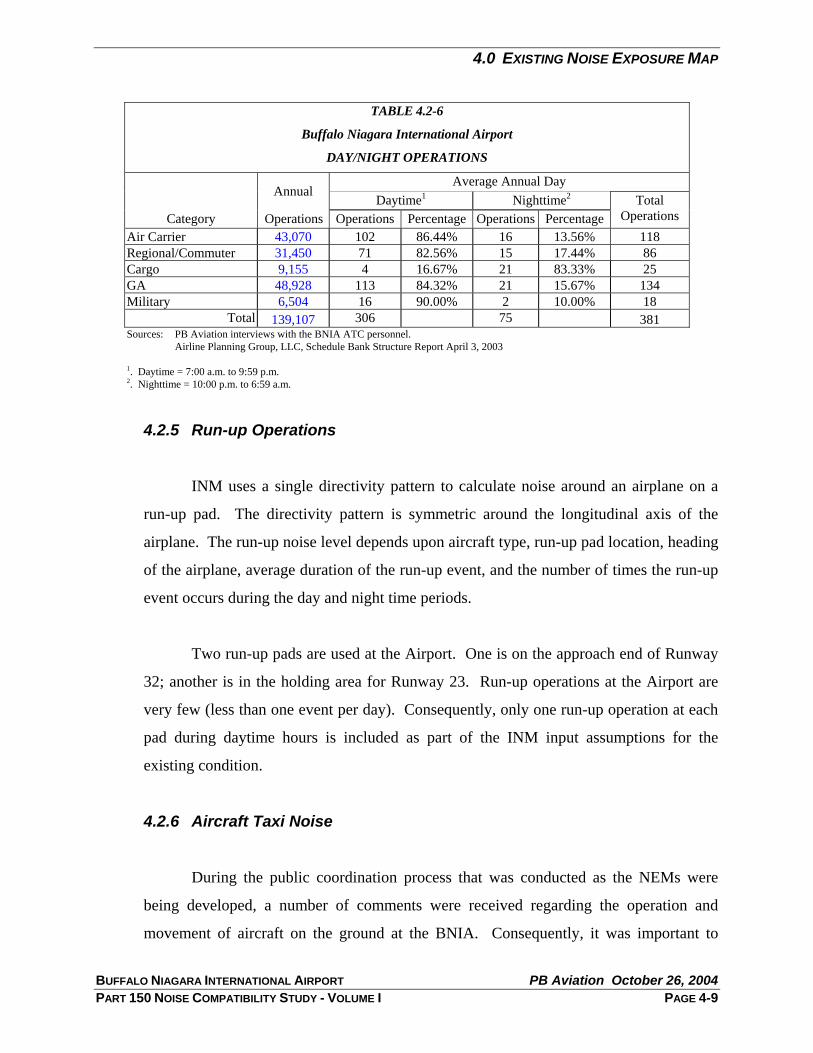
Total 139,107 306 75 381 Sources: PB Aviation interviews with the BNIA ATC personnel. Airline Planning Group, LLC, Schedule Bank Structure Report April 3, 2003 1. Daytime = 7:00 a.m. to 9:59 p.m. 2. Nighttime = 10:00 p.m. to 6:59 a.m.
4.2.5 Run-up Operations
INM uses a single directivity pattern to calculate noise around an airplane on a
run-up pad. The directivity pattern is symmetric around the longitudinal axis of the
airplane. The run-up noise level depends upon aircraft type, run-up pad location, heading
of the airplane, average duration of the run-up event, and the number of times the run-up
event occurs during the day and night time periods.
Two run-up pads are used at the Airport. One is on the approach end of Runway
32; another is in the holding area for Runway 23. Run-up operations at the Airport are
very few (less than one event per day). Consequently, only one run-up operation at each
pad during daytime hours is included as part of the INM input assumptions for the
existing condition.
4.2.6 Aircraft Taxi Noise
During the public coordination process that was conducted as the NEMs were
being developed, a number of comments were received regarding the operation and
movement of aircraft on the ground at the BNIA. Consequently, it was important to
4.0 EXISTING NOISE EXPOSURE MAP
BUFFALO NIAGARA INTERNATIONAL AIRPORT PB Aviation October 26, 2004 PART 150 NOISE COMPATIBILITY STUDY - VOLUME I PAGE 4-10
consider taxiway movements in the noise modeling process and in the estimation of noise
impacts.
Because the INM does not explicitly support taxi noise modeling, taxiway
movements were modeled as low altitude overflights along fixed points established for
the taxiways and access taxiways leading to the cargo and general aviation areas at the
BNIA. The following assumptions were made to model taxiway noise at the BNIA:
• The altitude of the overflight track is 10 feet which is the average engine height • Aircraft speed is the average taxi speed of 25 miles per hour • Average taxi thrust is 10 percent of static thrust
Taxiway use was based on the runway use and apron locations and reflects
information obtained from ATC personnel.
Because of the linear configuration of the passenger terminal and the proximity of
the terminal area ramp to taxiway A2, a single access point onto the terminal ramp was
not modeled. Rather, multiple entry points were assumed.
4.3 OPERATIONAL PROCEDURES
Operations data, including runway and flight track utilization, were obtained from
discussions with ATC personnel, analysis of ARTS data and airspace routing procedures and on-
site observations.
4.3.1 Runway Utilization
To estimate annual average day noise exposure as required by FAR Part 150,
annual average runway use must be determined. Existing runway-use patterns were
identified through interviews with ATC staff.
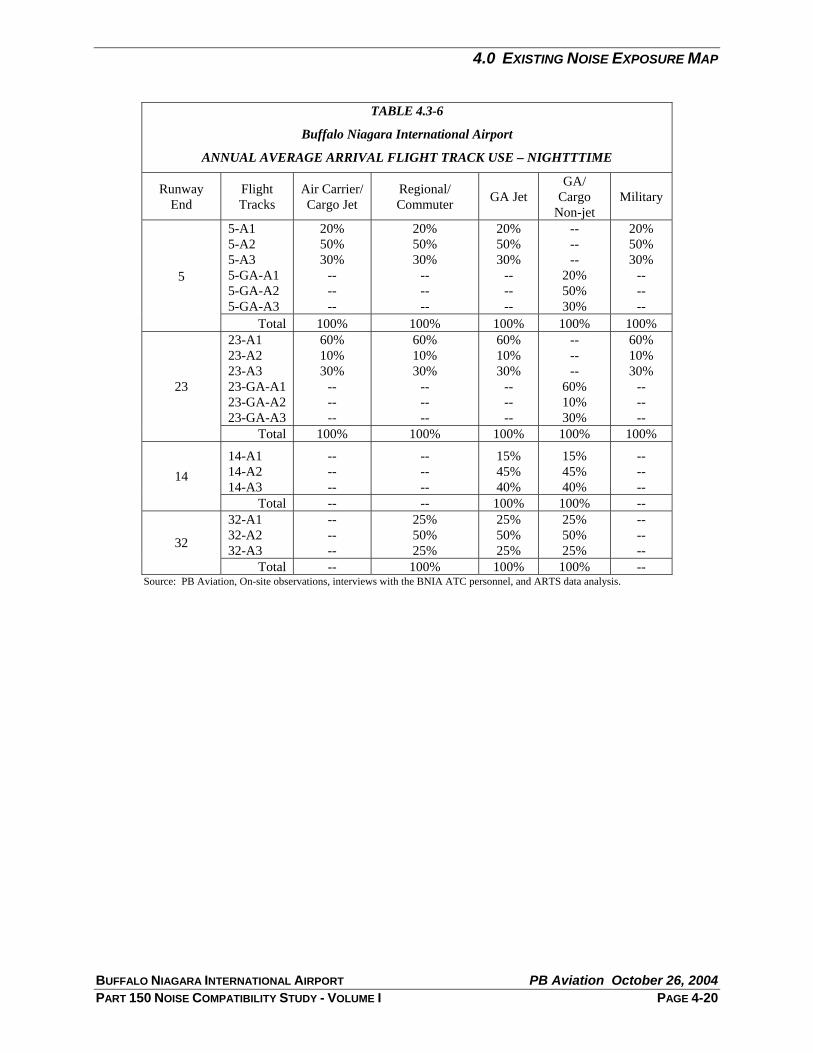
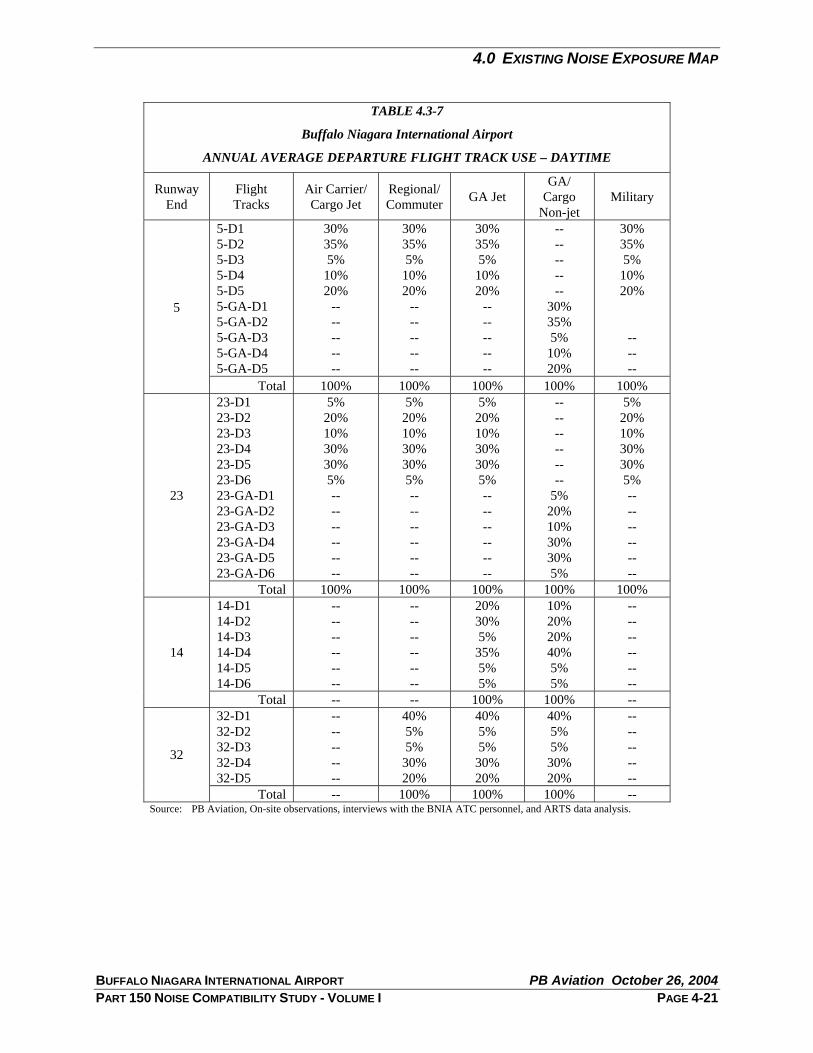
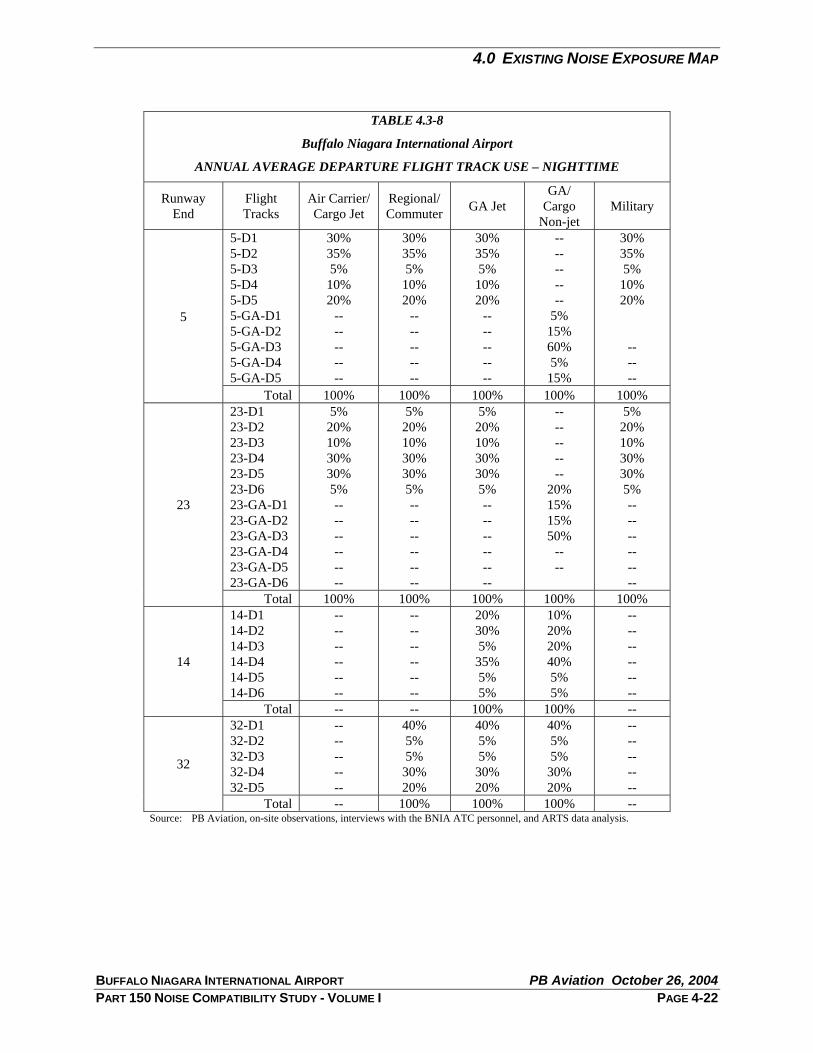
The daytime and nighttime annual arrival and departure runway use is shown
from Table 4.3-1 to Table 4.3-4.
4.0 EXISTING NOISE EXPOSURE MAP
BUFFALO NIAGARA INTERNATIONAL AIRPORT PB Aviation October 26, 2004 PART 150 NOISE COMPATIBILITY STUDY - VOLUME I PAGE 4-11
TABLE 4.3-1
Buffalo Niagara International Airport
ANNUAL AVERAGE ARRIVAL RUNWAY UTILIZATION – DAYTIME
BUFFALO NIAGARA INTERNATIONAL AIRPORT PB Aviation October 26, 2004 PART 150 NOISE COMPATIBILITY STUDY - VOLUME I PAGE 4-25
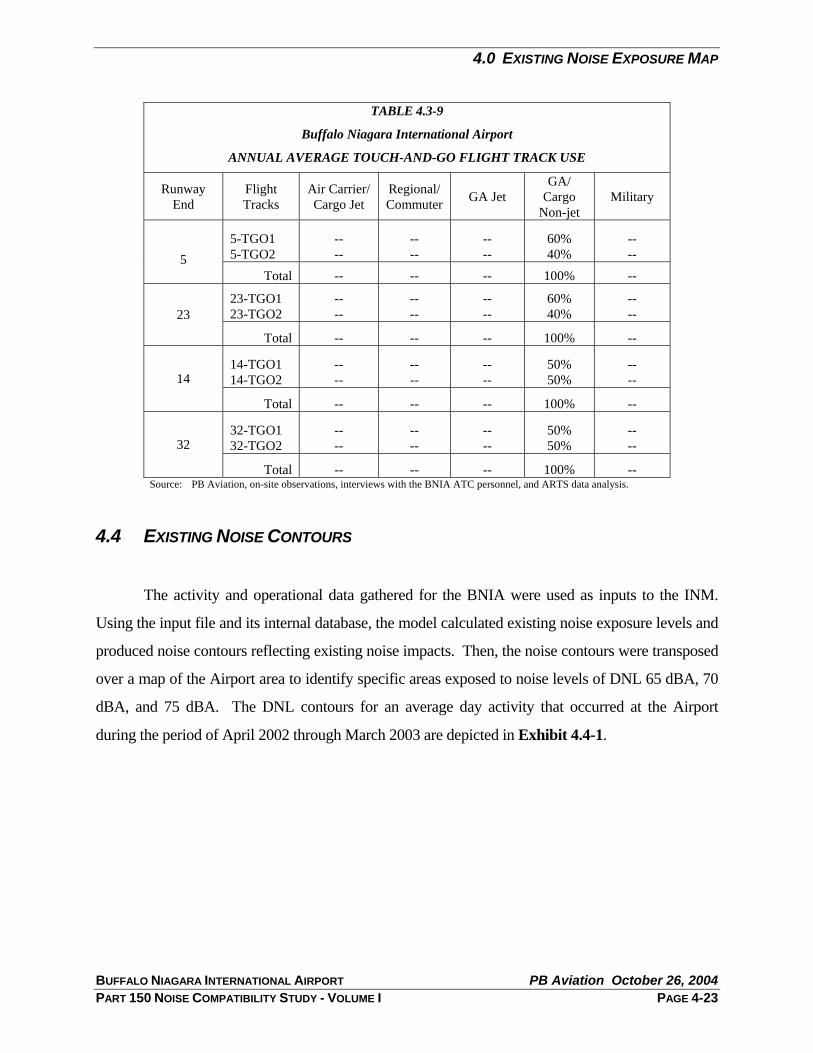
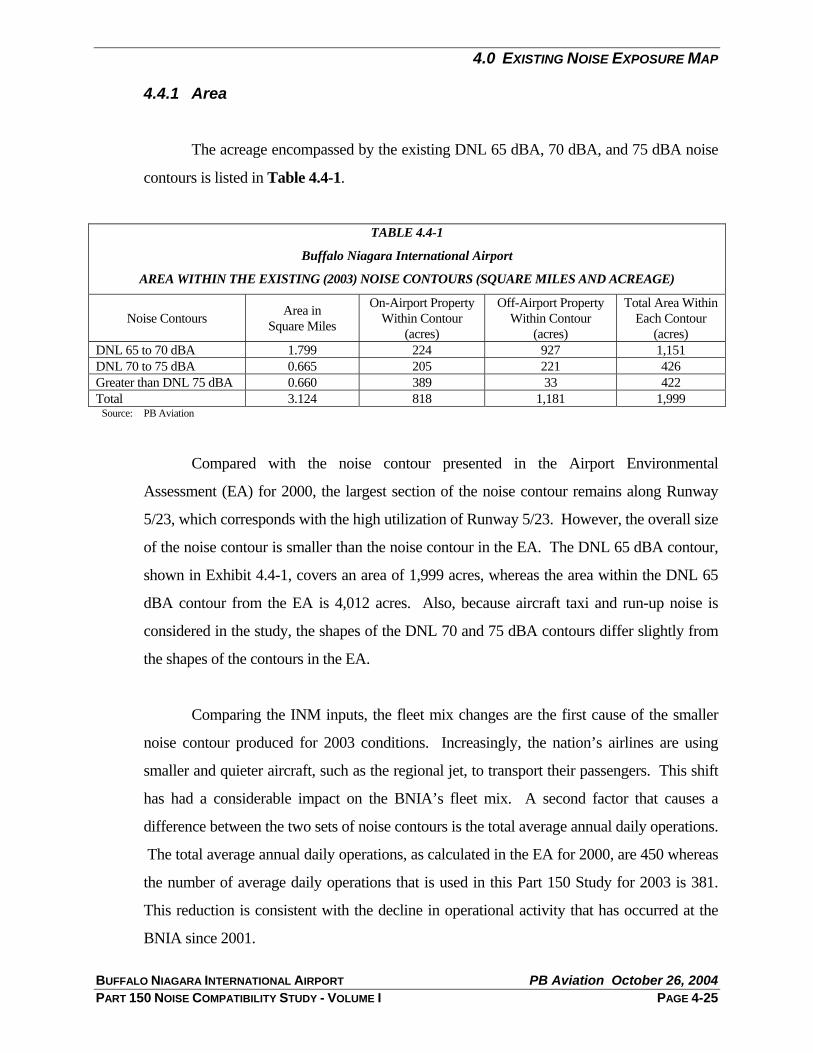
4.4.1 Area
The acreage encompassed by the existing DNL 65 dBA, 70 dBA, and 75 dBA noise
contours is listed in Table 4.4-1.
TABLE 4.4-1
Buffalo Niagara International Airport
AREA WITHIN THE EXISTING (2003) NOISE CONTOURS (SQUARE MILES AND ACREAGE)
Noise Contours Area in Square Miles
On-Airport Property Within Contour
(acres)
Off-Airport Property Within Contour
(acres)
Total Area Within Each Contour
(acres) DNL 65 to 70 dBA 1.799 224 927 1,151 DNL 70 to 75 dBA 0.665 205 221 426 Greater than DNL 75 dBA 0.660 389 33 422 Total 3.124 818 1,181 1,999
Source: PB Aviation
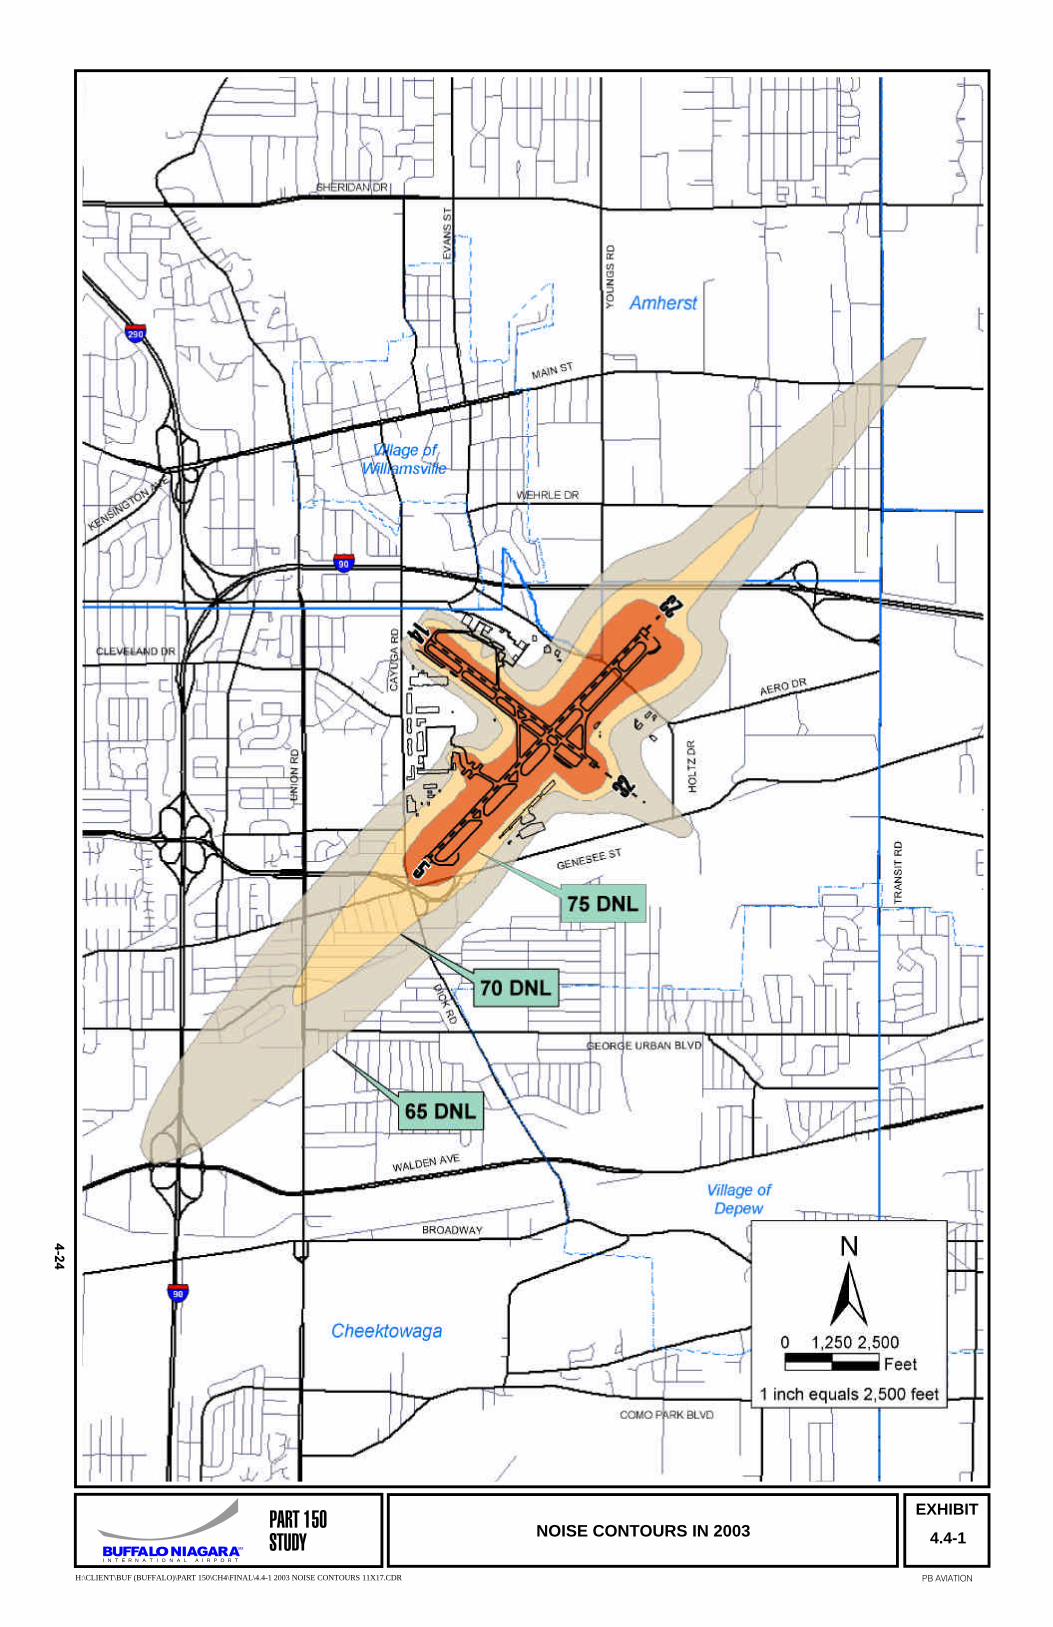
Compared with the noise contour presented in the Airport Environmental
Assessment (EA) for 2000, the largest section of the noise contour remains along Runway
5/23, which corresponds with the high utilization of Runway 5/23. However, the overall size
of the noise contour is smaller than the noise contour in the EA. The DNL 65 dBA contour,
shown in Exhibit 4.4-1, covers an area of 1,999 acres, whereas the area within the DNL 65
dBA contour from the EA is 4,012 acres. Also, because aircraft taxi and run-up noise is
considered in the study, the shapes of the DNL 70 and 75 dBA contours differ slightly from
the shapes of the contours in the EA.
Comparing the INM inputs, the fleet mix changes are the first cause of the smaller
noise contour produced for 2003 conditions. Increasingly, the nation’s airlines are using
smaller and quieter aircraft, such as the regional jet, to transport their passengers. This shift
has had a considerable impact on the BNIA’s fleet mix. A second factor that causes a
difference between the two sets of noise contours is the total average annual daily operations.
The total average annual daily operations, as calculated in the EA for 2000, are 450 whereas
the number of average daily operations that is used in this Part 150 Study for 2003 is 381.
This reduction is consistent with the decline in operational activity that has occurred at the
BNIA since 2001.
4.0 EXISTING NOISE EXPOSURE MAP
BUFFALO NIAGARA INTERNATIONAL AIRPORT PB Aviation October 26, 2004 PART 150 NOISE COMPATIBILITY STUDY - VOLUME I PAGE 4-26
4.4.2 Housing and Population Impacts
The 2003 noise exposure contours were examined to determine the number of
housing units and population affected by each. To determine the number of housing
units, an Erie County Department of Environment and Planning parcel database was
brought into ArcView GIS (Geographic Information System). Parcels within the
respective contour levels were selected and housing units were determined based upon
the number of dwelling units contained on each parcel. For parcels where housing units
were not indicated in the database, phone call verification and field checks were made.
Estimates of the affected population within each contour level, were based on
average household size. Average household size was obtained from the U.S. Census
Bureau statistics for the affected tracts that were within levels of DNL 65 dBA or greater.
For affected census tracts in the Town of Amherst, the average household size was 2.23
persons. For affected census tracts in the Town of Cheektowaga, the average household
size was 2.25 persons.
Impacts to residents of the Town of Cheektowaga are primarily southwest of the
BNIA and are caused by southwest flow departures on Runway 23 and northeast flow
arrivals on Runway 5. The Towns of Amherst and Clarence are impacted to the northeast
of the BNIA primarily by northeast flow departures on Runway 5 and southwest flow
arrivals on Runway 23. While a small portion of the Town of Clarence is located within
the DNL 65 dBA contour, the affected area contains no residential land uses.
A summary of the population affected by noise levels exceeding DNL 65 dBA is
provided in Table 4.4-2.
4.0 EXISTING NOISE EXPOSURE MAP
BUFFALO NIAGARA INTERNATIONAL AIRPORT PB Aviation October 26, 2004 PART 150 NOISE COMPATIBILITY STUDY - VOLUME I PAGE 4-27
4.4.3 Potentially Incompatible Land Uses
The Federal Aviation Administration (FAA) has developed land use compatibility
guidelines that relate to sound levels generated by airport activity to various types of land
use. These guidelines, presented in FAR Part 150 and reproduced in Table 3.1-1 of
Chapter 3.0, establish compatibility guidelines for residential, public, commercial,
manufacturing and production, and recreational uses. As determined by these guidelines,
all land uses are generally compatible with airport operations if they are exposed to noise
levels below DNL 65 dBA. Exhibit 4.4-2 depicts the relationship between the 2003
noise contours and existing land use patterns in the vicinity of the BNIA.
Potentially incompatible land uses surrounding the Airport, including
schools/daycare facilities, churches, libraries/museums, group care facilities, hospitals,
recreation facilities, archaeological sites, and historic sites were identified in Chapter 3.0,
Land Use Assessment. The 2003 noise exposure contours were examined to determine
whether these specific noise-sensitive land uses were experiencing aircraft noise levels of
DNL 65 dB or greater. An estimated 2,123 residences are located within the DNL 65
dBA or greater noise contour. The Chapel of Our Lady Help of Christians, which is
listed
TABLE 4.4-2
Buffalo Niagara International Airport
EXISTING 2003 NOISE IMPACTS TO HOUSING AND POPULATIONDNL 75 + dBA Contour DNL 70 to 75 dBA Contour DNL 65 to 70 dBA Contour Totals
MunicipalityHousing
Units PopulationHousing
Units PopulationHousing
Units PopulationHousing
Units Population
Amherst 0 0 2 4 221 493 223 497Cheektowaga 2 5 413 929 1,485 3,344 1,900 4,275Clarence 0 0 0 0 0 0 0 0Lancaster 0 0 0 0 0 0 0 0Village of Williamsville 0 0 0 0 0 0 0 0Village of Depew 0 0 0 0 0 0 0 0Village of Lancaster 0 0 0 0 0 0 0 0Village of Sloan 0 0 0 0 0 0 0 0Total 2 5 415 933 1,706 3,834 2,123 4,772 Sources: Erie County Department of Environment and Planning U.S. Census Bueau PB Aviation Analysis
EXHIBIT
4.4-2
PB AVIATION
I N T E R N A T I O N A L A I R P O R TBUFFAL NIAGARAO SM
PART 150STUDY
H:\CLIENT\BUF (BUFFALO)\PART 150\CH4\FINAL\4.4-2 2003 CONTOURS & LAND USE.CDR
2003 NOISE CONTOURS AND LAND USE
4.0 EXISTING NOISE EXPOSURE MAP
BUFFALO NIAGARA INTERNATIONAL AIRPORT PB Aviation October 26, 2004 PART 150 NOISE COMPATIBILITY STUDY - VOLUME I PAGE 4-30
on the National Register of Historic Places, is located within the DNL 65 dBA noise
contour.
Also, three noise sensitive community facilities are found within the DNL 65
dBA noise contour. They are:
• Maryvale Primary School • Our Lady Help of Christians Church and School • The NCAAA Baseball Fields
These three facilities are all located in the Town of Cheektowaga.
No additional noise sensitive facilities, archaeological sites or structures
registered with the National Register of Historic Places were found to be located within
the DNL 65 dBA or greater noise contours.
4.5 SUPPLEMENTAL NOISE ANALYSIS
In 1992, the Federal Interagency Committee on Noise (FICON) recommended continuing
the use of the DNL Noise metric as the principal means for describing airport noise exposure.
FICON further recommended the use of supplemental noise analysis to augment DNL, such as
SEL, Lmax, and Time Above (TA) etc. During meetings with the TAC and the CAC, committee
members expressed concern that the DNL metric was difficult to understand and conveyed an
“average” noise level that could not be readily experienced. Rather, committee members asked
that peak noise and single events be considered.
TA was selected to as one of the supplemental metrics for further describing the noise
environment pertaining to the BNIA. TA is the total time that noise exceeds a specified level
during a period of time. Also, TA is a cumulative metric that is easier to understand by the
average citizen than is DNL, and it very clearly and visually communicates the moderate levels
of noise impacts beyond the DNL 65 dBA contour.
4.0 EXISTING NOISE EXPOSURE MAP
BUFFALO NIAGARA INTERNATIONAL AIRPORT PB Aviation October 26, 2004 PART 150 NOISE COMPATIBILITY STUDY - VOLUME I PAGE 4-31
Exhibit 4.5-1 shows TA 65 dBA contours at 10, 20, and 30 minutes and also the DNL
contours. At 65 dBA, normal speech communication can continue with individuals that are
approximately five feet apart in an outdoor environment. At that level of noise interference,
speech communication becomes increasingly difficult as the talker and listener move farther
apart. (Refer to Exhibit 2.4-3, previously depicted in Chapter 2.0, for a more complete
discussion of speech interference levels.) In other words, the contours depict the number of
minutes that outdoor speech interference may be experienced 10, 20 or 30 minutes per day, on an
average annual day. The TA contours illustrate the fact that residents living beyond the DNL 65
dBA contour still experience some interference from aircraft noise overflights, although not at
the levels considered to be “significant” for the purposes of receiving federal funds for noise
mitigation projects. The size of the TA contour of 10 minutes above levels of 65 dB is similar to
the DNL 55 dBA contour.
Sound Exposure Level (SEL) information may be considered for the purposes of
conveying the noise level of individual aircraft events. However, the use of the SEL can be
misleading if not properly understood. SEL measures the total sound energy of a single event,
but normalizes the energy to a reference duration of one second so that noise events of different
durations can be compared. (Refer to Exhibit 2.2-1, previously depicted in Chapter 2.0.) In
reality, an overflight takes several seconds. Exhibit 4.5-2 shows aircraft noise footprints and
their relative size for a variety of airplanes currently in use at the BNIA.
* * * * * *
Chapter 5.0 details the BNIA’s future (2008) baseline conditions and presents the Future
Baseline NEM.
COMPARISON OF TIME ABOVE AND DNL CONTOURS2003 CONDITIONS
EXHIBIT
4.5-1
PB AVIATION
I N T E R N A T I O N A L A I R P O R TBUFFAL NIAGARAO SM
PART 150STUDY
H:\CLIENT\BUF (BUFFALO)\PART 150\CH4\FINAL\4.5-1 TIME ABOVE AND NOISE CONTOURS IN 2003 11X17.CDR
COMPARATIVE AIRCRAFTNOISE FOOTPRINTS
EXHIBIT
4.5-2I N T E R N A T I O N A L A I R P O R TBUFFAL NIAGARAO SM
PB AVIATION
PART 150STUDY
4-32H:\CLIENT\BUF (BUFFALO)\PART 150\CH4\FINAL\4.5-2 C A FOOTPRINTS.CDR
55
23233232
1414
Amherst
Cheektowaga
Clarence
Lancaster
90
5-D5
23-D1
5-GA-D5
23-GA
-D1
32-D3
90
32-D4
5-GA-D
45-D
4
5-D3
5-D2
14-D
5
23-D
6
14-D4
14-D3
23-D5
5-D
1
23-GA-D5
5-G
A-D
1
14-D
2
23-D
3
23-D2
23-GA-D2
West Seneca
23-G
A-D
4
32-D
2
5 /2
3- T
GO1
14/32-TGO2
Niagara County
23-A
2
23-GA-D
6
23-A3
23-A1
5-GA-D2
32-A2
32-A15-GA-A3
5-A3
5-A
1
5-GA
-A1
14-A
3
Buffalo
14-A214-A1
23-GA-A3
5-A2
Tonawanda
Elma
14-D1
23-D
4
14-D6
32-D
5
32-D1
23-G
A-D3
5 /2
3- T
GO2
14/32-TGO1 23-GA
-A1
5-GA-D
3
32-A
3
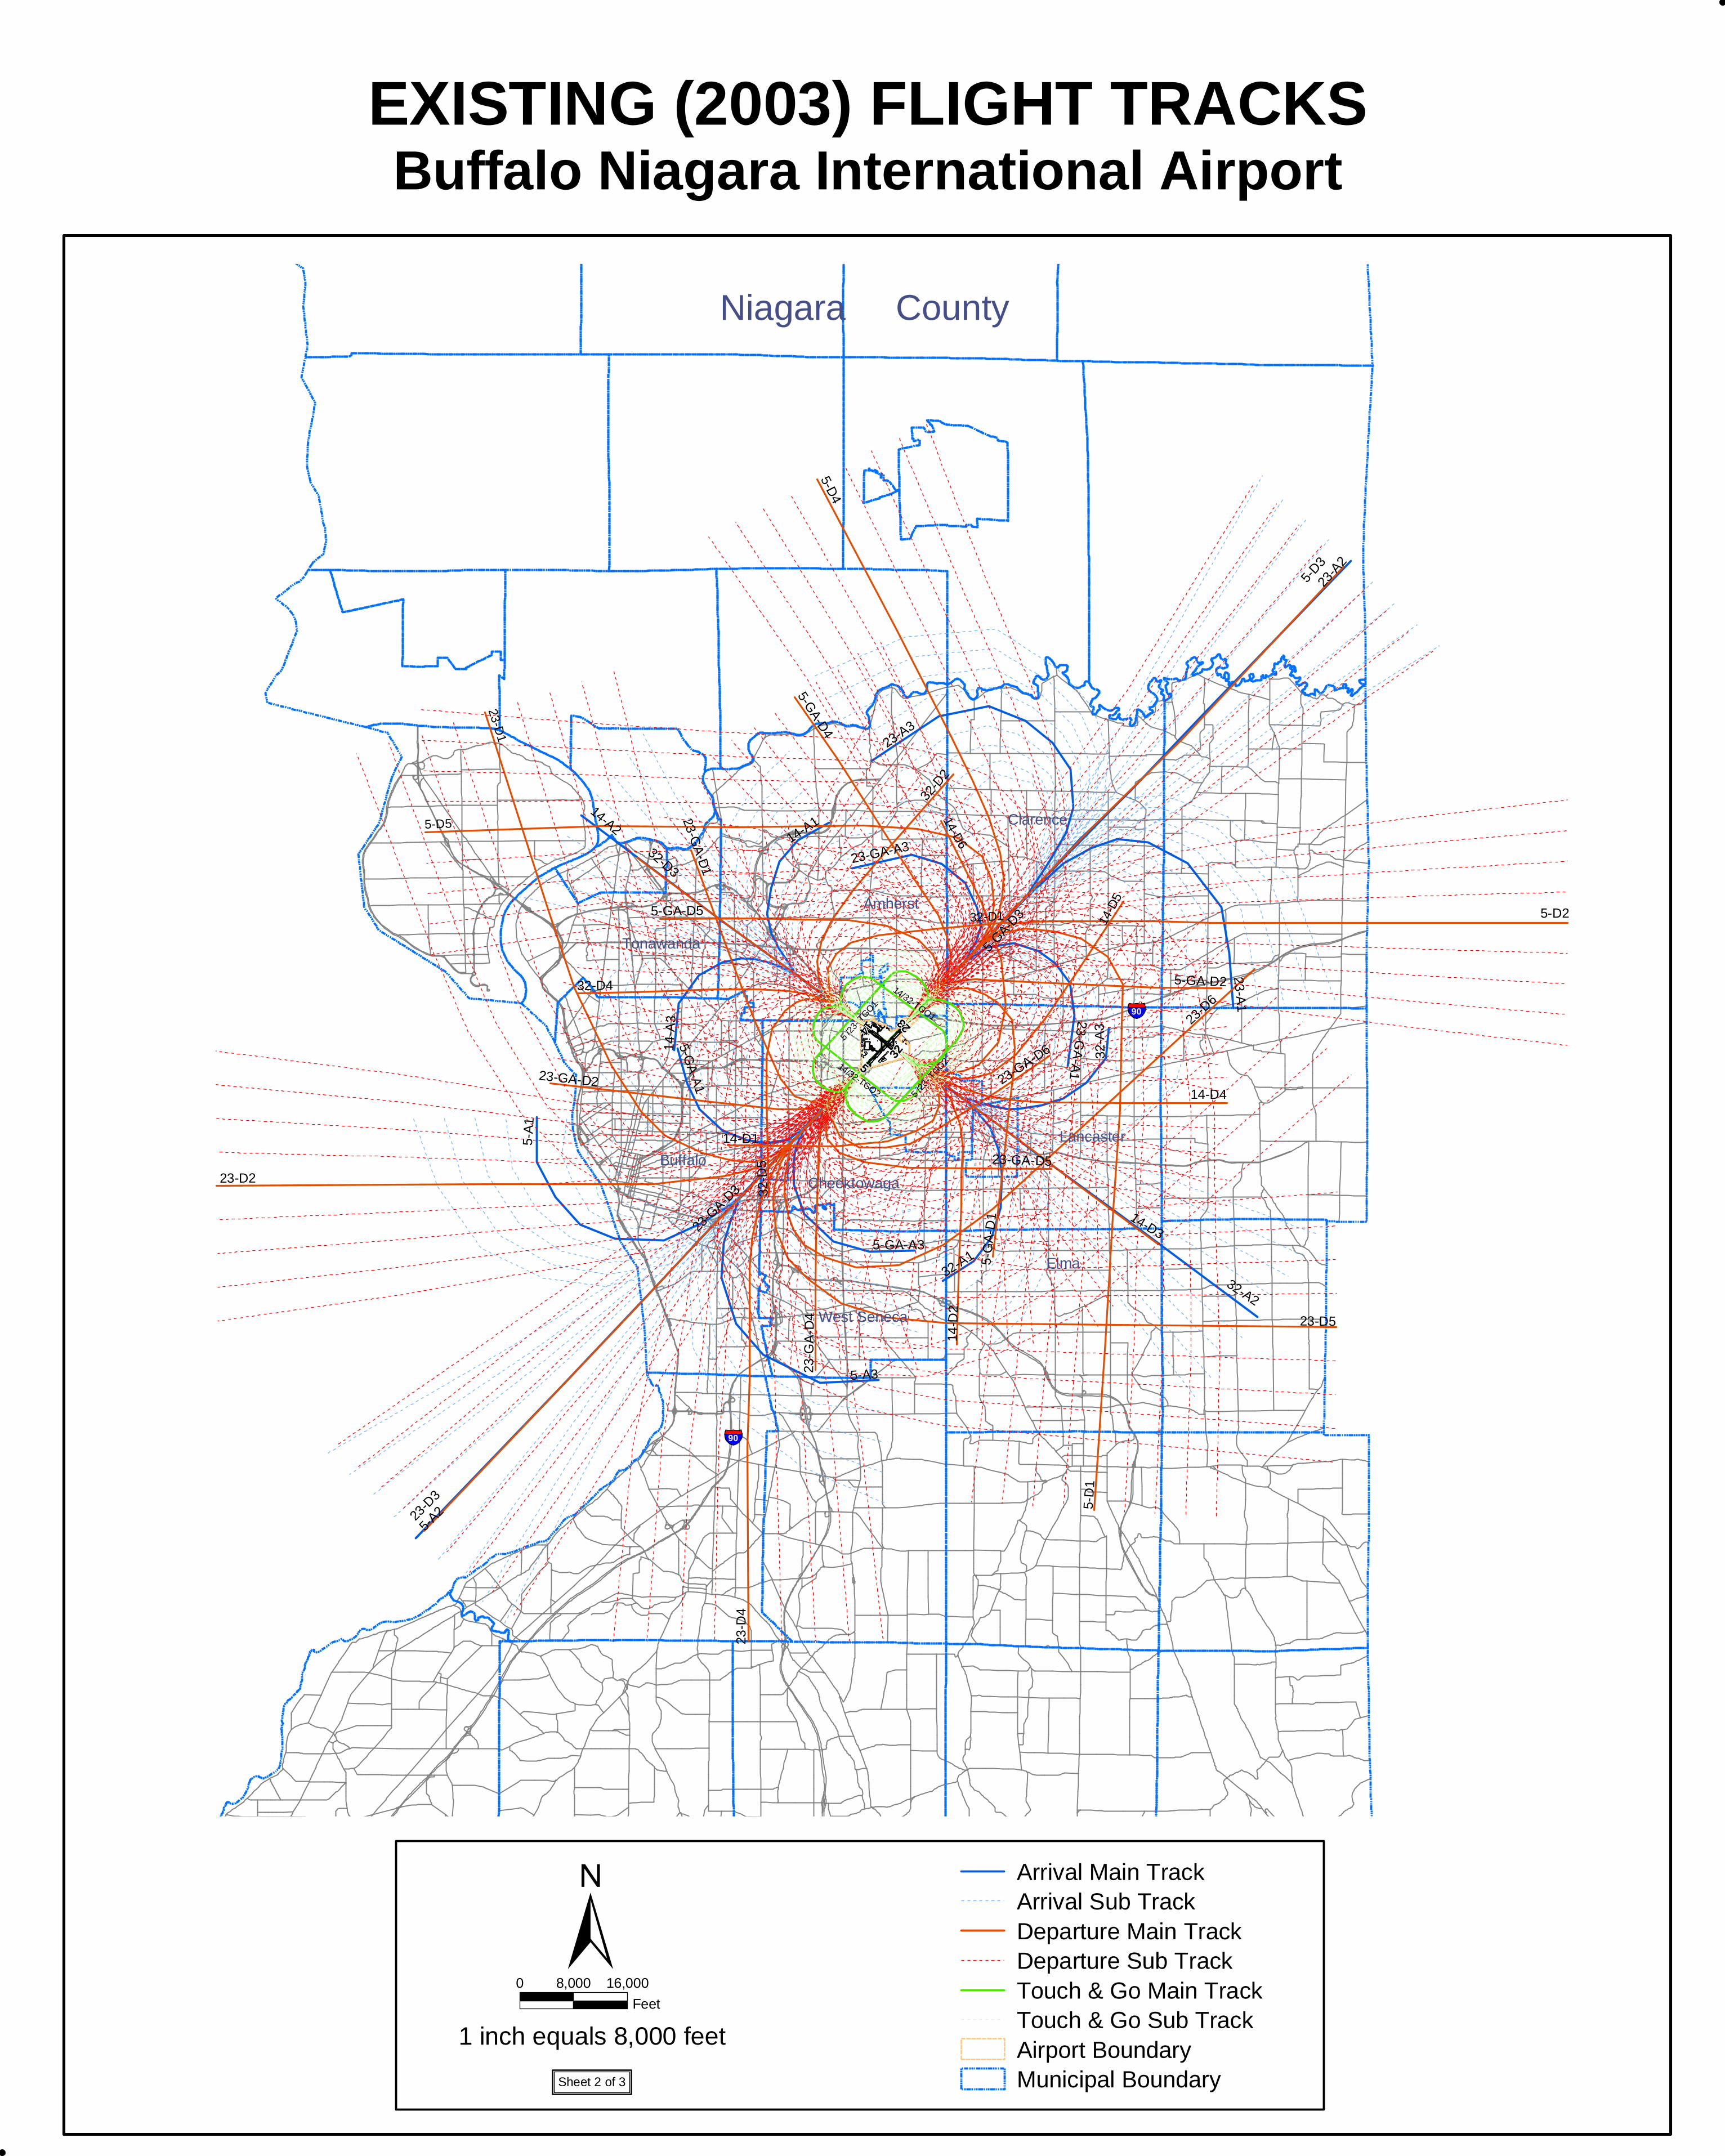
Buffalo Niagara International AirportEXISTING (2003) FLIGHT TRACKS
Sheet 2 of 3
0 8,000 16,000
Feet
1 inch equals 8,000 feet Airport BoundaryMunicipal Boundary
Arrival Main TrackArrival Sub TrackDeparture Main TrackDeparture Sub TrackTouch & Go Main TrackTouch & Go Sub Track
55
2323
32321414
14-D2
23-G
A-D
4
5 /2
3- T
GO1
14/32-TGO2
14-D1
32-D
1
23-G
A-D3/
23-D
1/23
-D2/
23-D
3/23
-D4/
23-D
5/23
-D6
5 /2
3- T
GO2
14/32-TGO1
SHERIDAN DR
290
KENSINGTON AVE
CLEVELAND DR
WEHRLE DR
GA
RR
ISO
N R
D
YO
UN
GS
RD
MAIN ST
WEHRLE DR
AERO DR
TR
AN
SIT
RD
90
HO
LTZ
RD
GENESEE ST
GEORGE URBAN BLVD
WALDEN AVE
GEORGE URBAN BLVD
BROADWAY
Amherst
Village ofWilliamsville
Clarence
Lancaster
Village ofDepew
Cheektowaga
23-G
A-D
6
23-G
A-D
5
32-D
2
5-GA
-D5
5-GA
-D4
5-GA-D1
5-GA-D2
5-D1/
5-D2/
5-D3/
5-D4/
5-D5
14-D3
14-D4
14-D5
14-D6
5-G
A-A
3
5-GA-A
1
23-G
A-A1/
23-G
A-A3/
23-A
1/23
-A3
32-A1/32-A2/32-A3
33
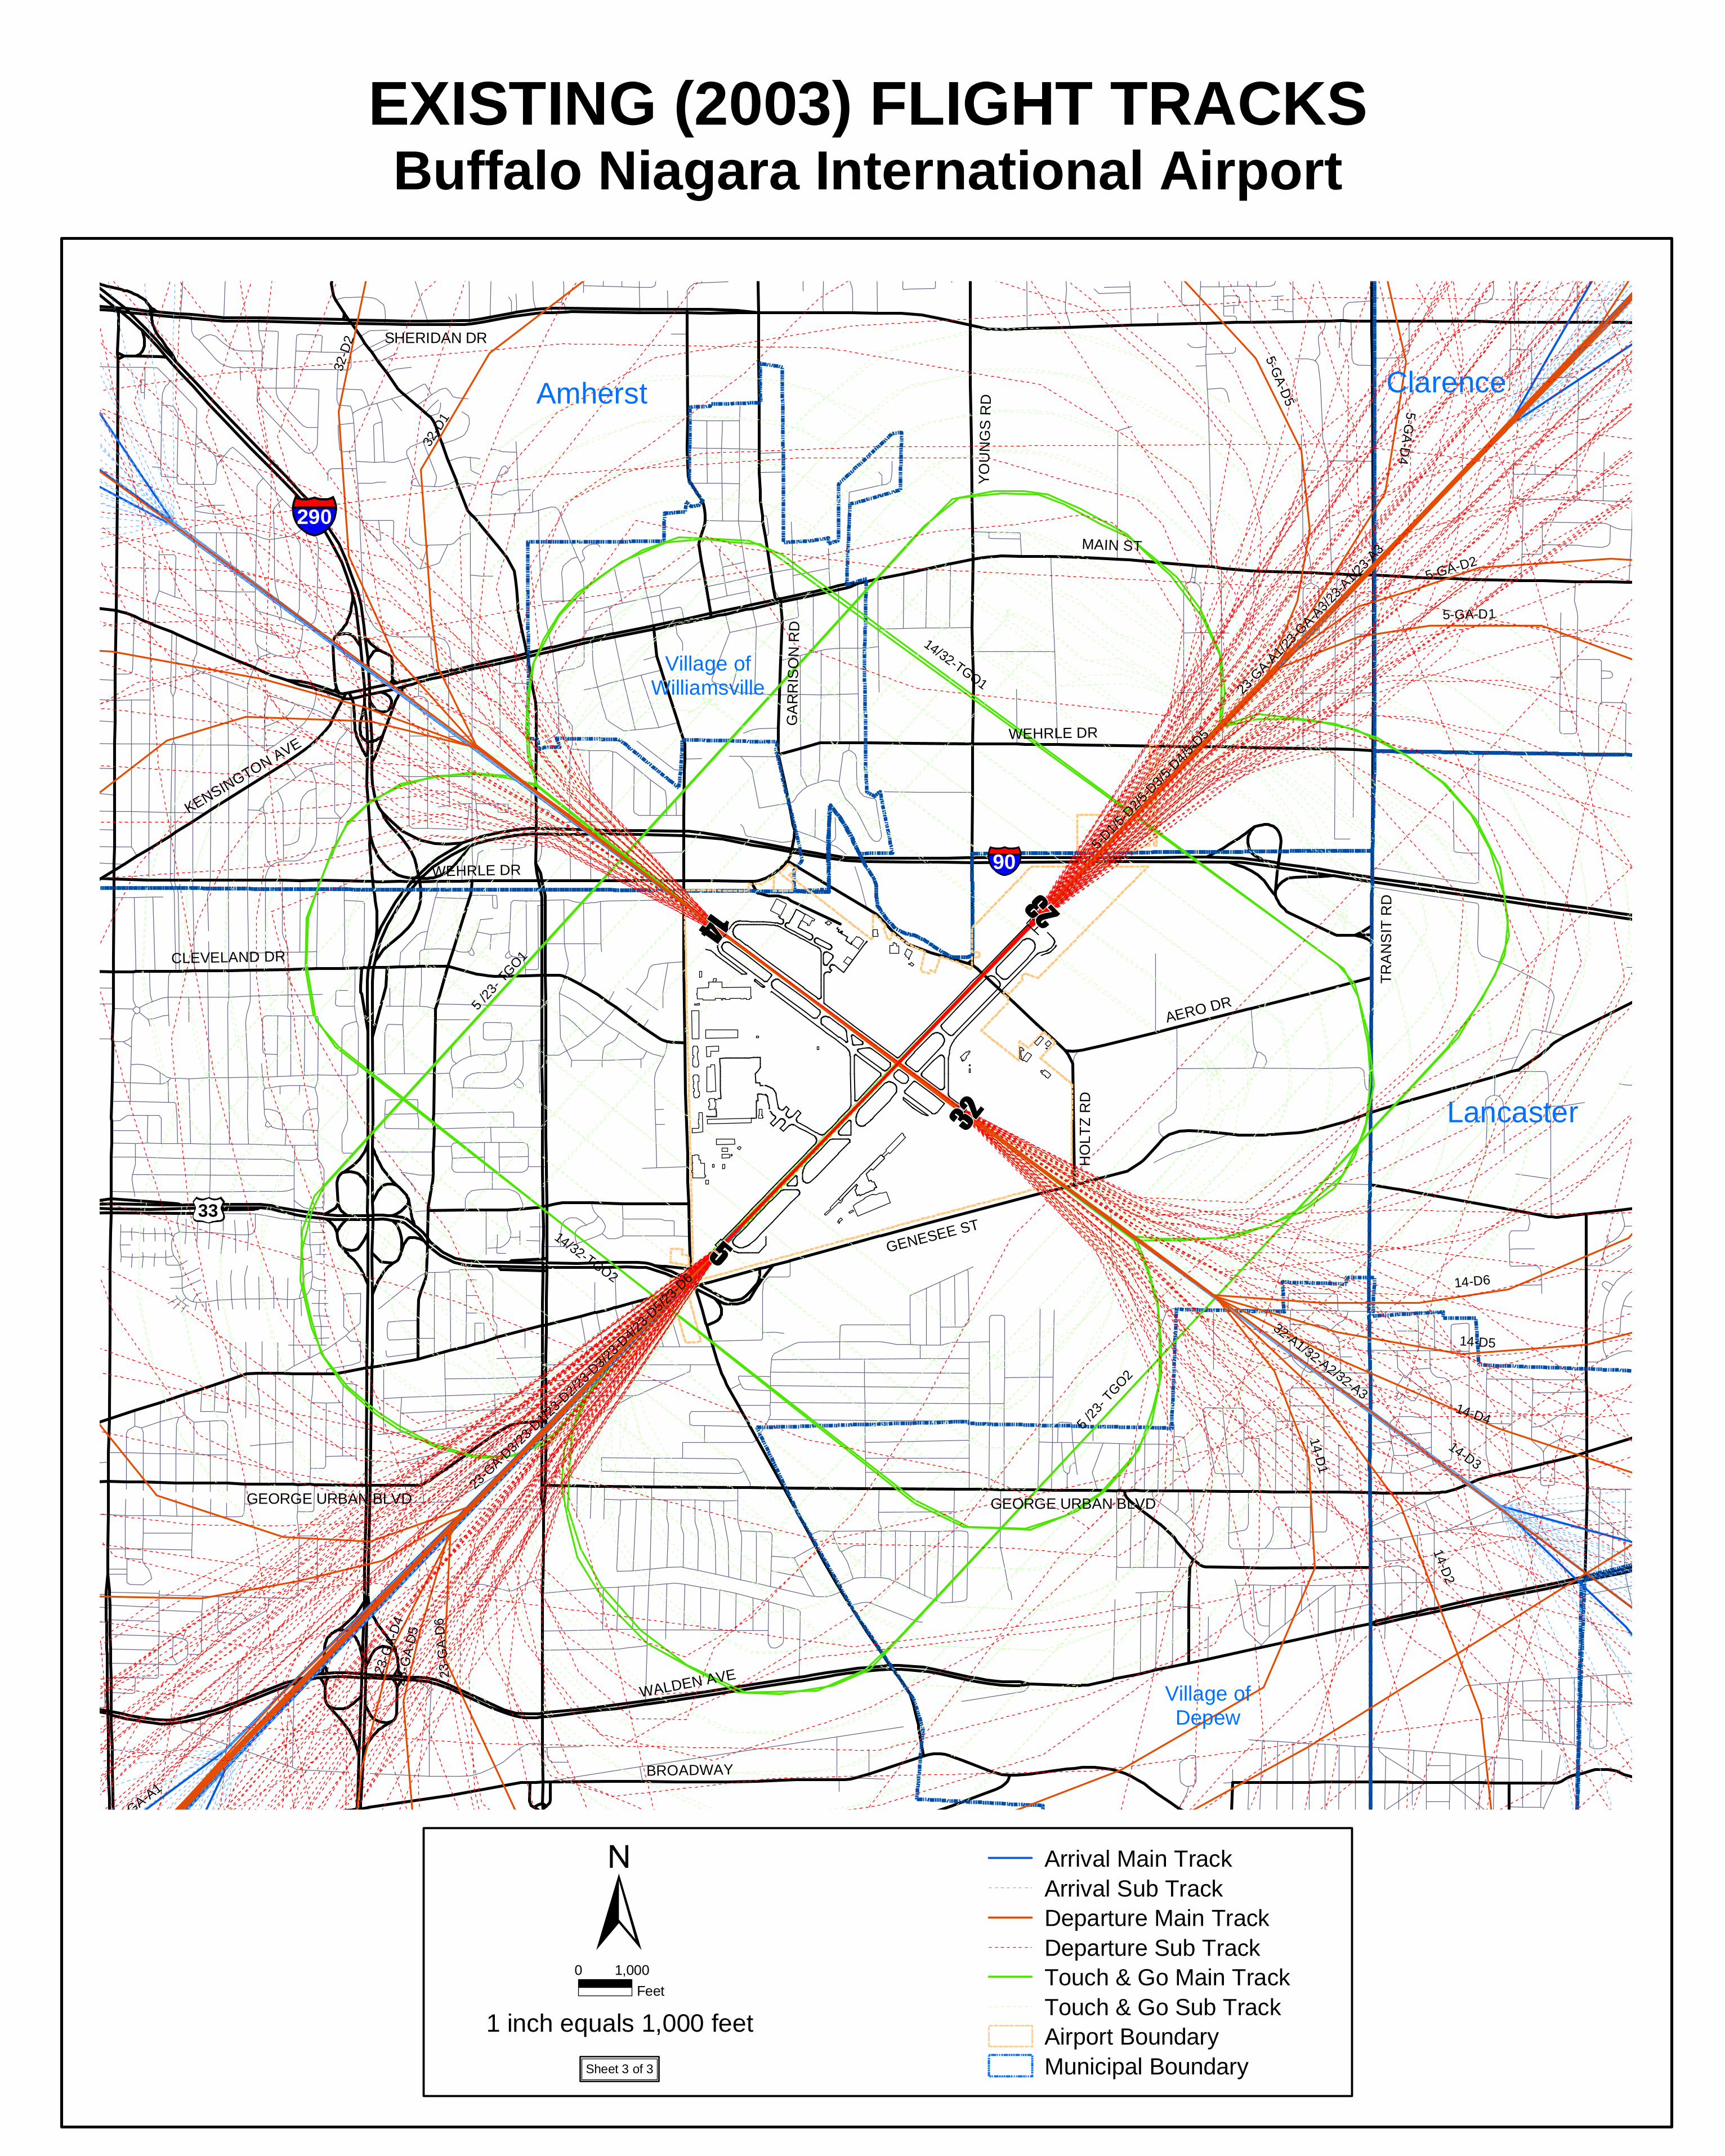
Buffalo Niagara International AirportEXISTING (2003) FLIGHT TRACKS
Sheet 3 of 3
0 1,000
Feet
1 inch equals 1,000 feet Airport BoundaryMunicipal Boundary
Arrival Main TrackArrival Sub TrackDeparture Main TrackDeparture Sub TrackTouch & Go Main TrackTouch & Go Sub Track
290
GENESEE ST
TR
AN
SIT
RD
WEHRLE DR
AERO DR
HO
LTZ
DR
CLEVELAND DR
MAIN ST
KENSINGTON AVE
YO
UN
GS
RD
GEORGE URBAN BLVD
U
NIO
N R
D
HA
RR
IS H
ILL
RD
SHERIDAN DR
COMO PARK BLVD
WALDEN AVE
75 DNL
70 DNL
65 DNL
55
2323
3232
1414
Amherst
Village ofWilliamsville
Village ofDepew
Cheektowaga
CA
YU
GA
RD
BROADWAY
EV
AN
S S
T
DIC
K R
D
Village ofLancaster
Clarence
Lancaster
90
90
33
GEORGE URBAN BLVD
WEHRLE DR
GA
RR
ISO
N R
D
FATH RDNOKOMIS PKWY
SEMINOLE PKW
YMIAMI PKWY
ZE
NT
RD
MA
RIO
N C
T
AR
TH
UR
PK
WY
EVERGREEN PL
CLOVER PL
ORCHARD PL
NORTHCREST AVE
WELLWORTH PL
FLORAL PL
SM
ITH
ST
PLE
AS
AN
T S
T
LOU
IS S
TA
BE
RD
EE
N S
TA
RT
HU
R S
T
RO
XB
OR
OU
GH
ST
SM
ALLW
OO
D S
T
W SOBIESKI AVE
AN
TH
ON
Y A
VE
BU
ELL
AV
E
ROGERS DR
SANDRA DR
MARILYN DR
PR
INC
ET
ON
AV
E
RID
GE
CT
S
AM
HE
RS
TO
N D
R
BE
LLIN
GH
AM
DR
OA
KLA
ND
DR
BE
RK
LEY
RD
LYNDHURST RD
FE
RN
DA
LE R
D HA
RD
ING
RD
MC
KIN
LEY
AV
E
TE
NN
YS
ON
TE
RR
CE
AS
AR
BLV
D
HARRIS CT
BARONE CIR
CHAPEL AVE
BROAD ST
SOUTHCREST AVE
ME
AD
OW
PL
CHEROKEE DR
SANTIN LA
NADINE DR
MARYVALE DR
GARFIELD RD
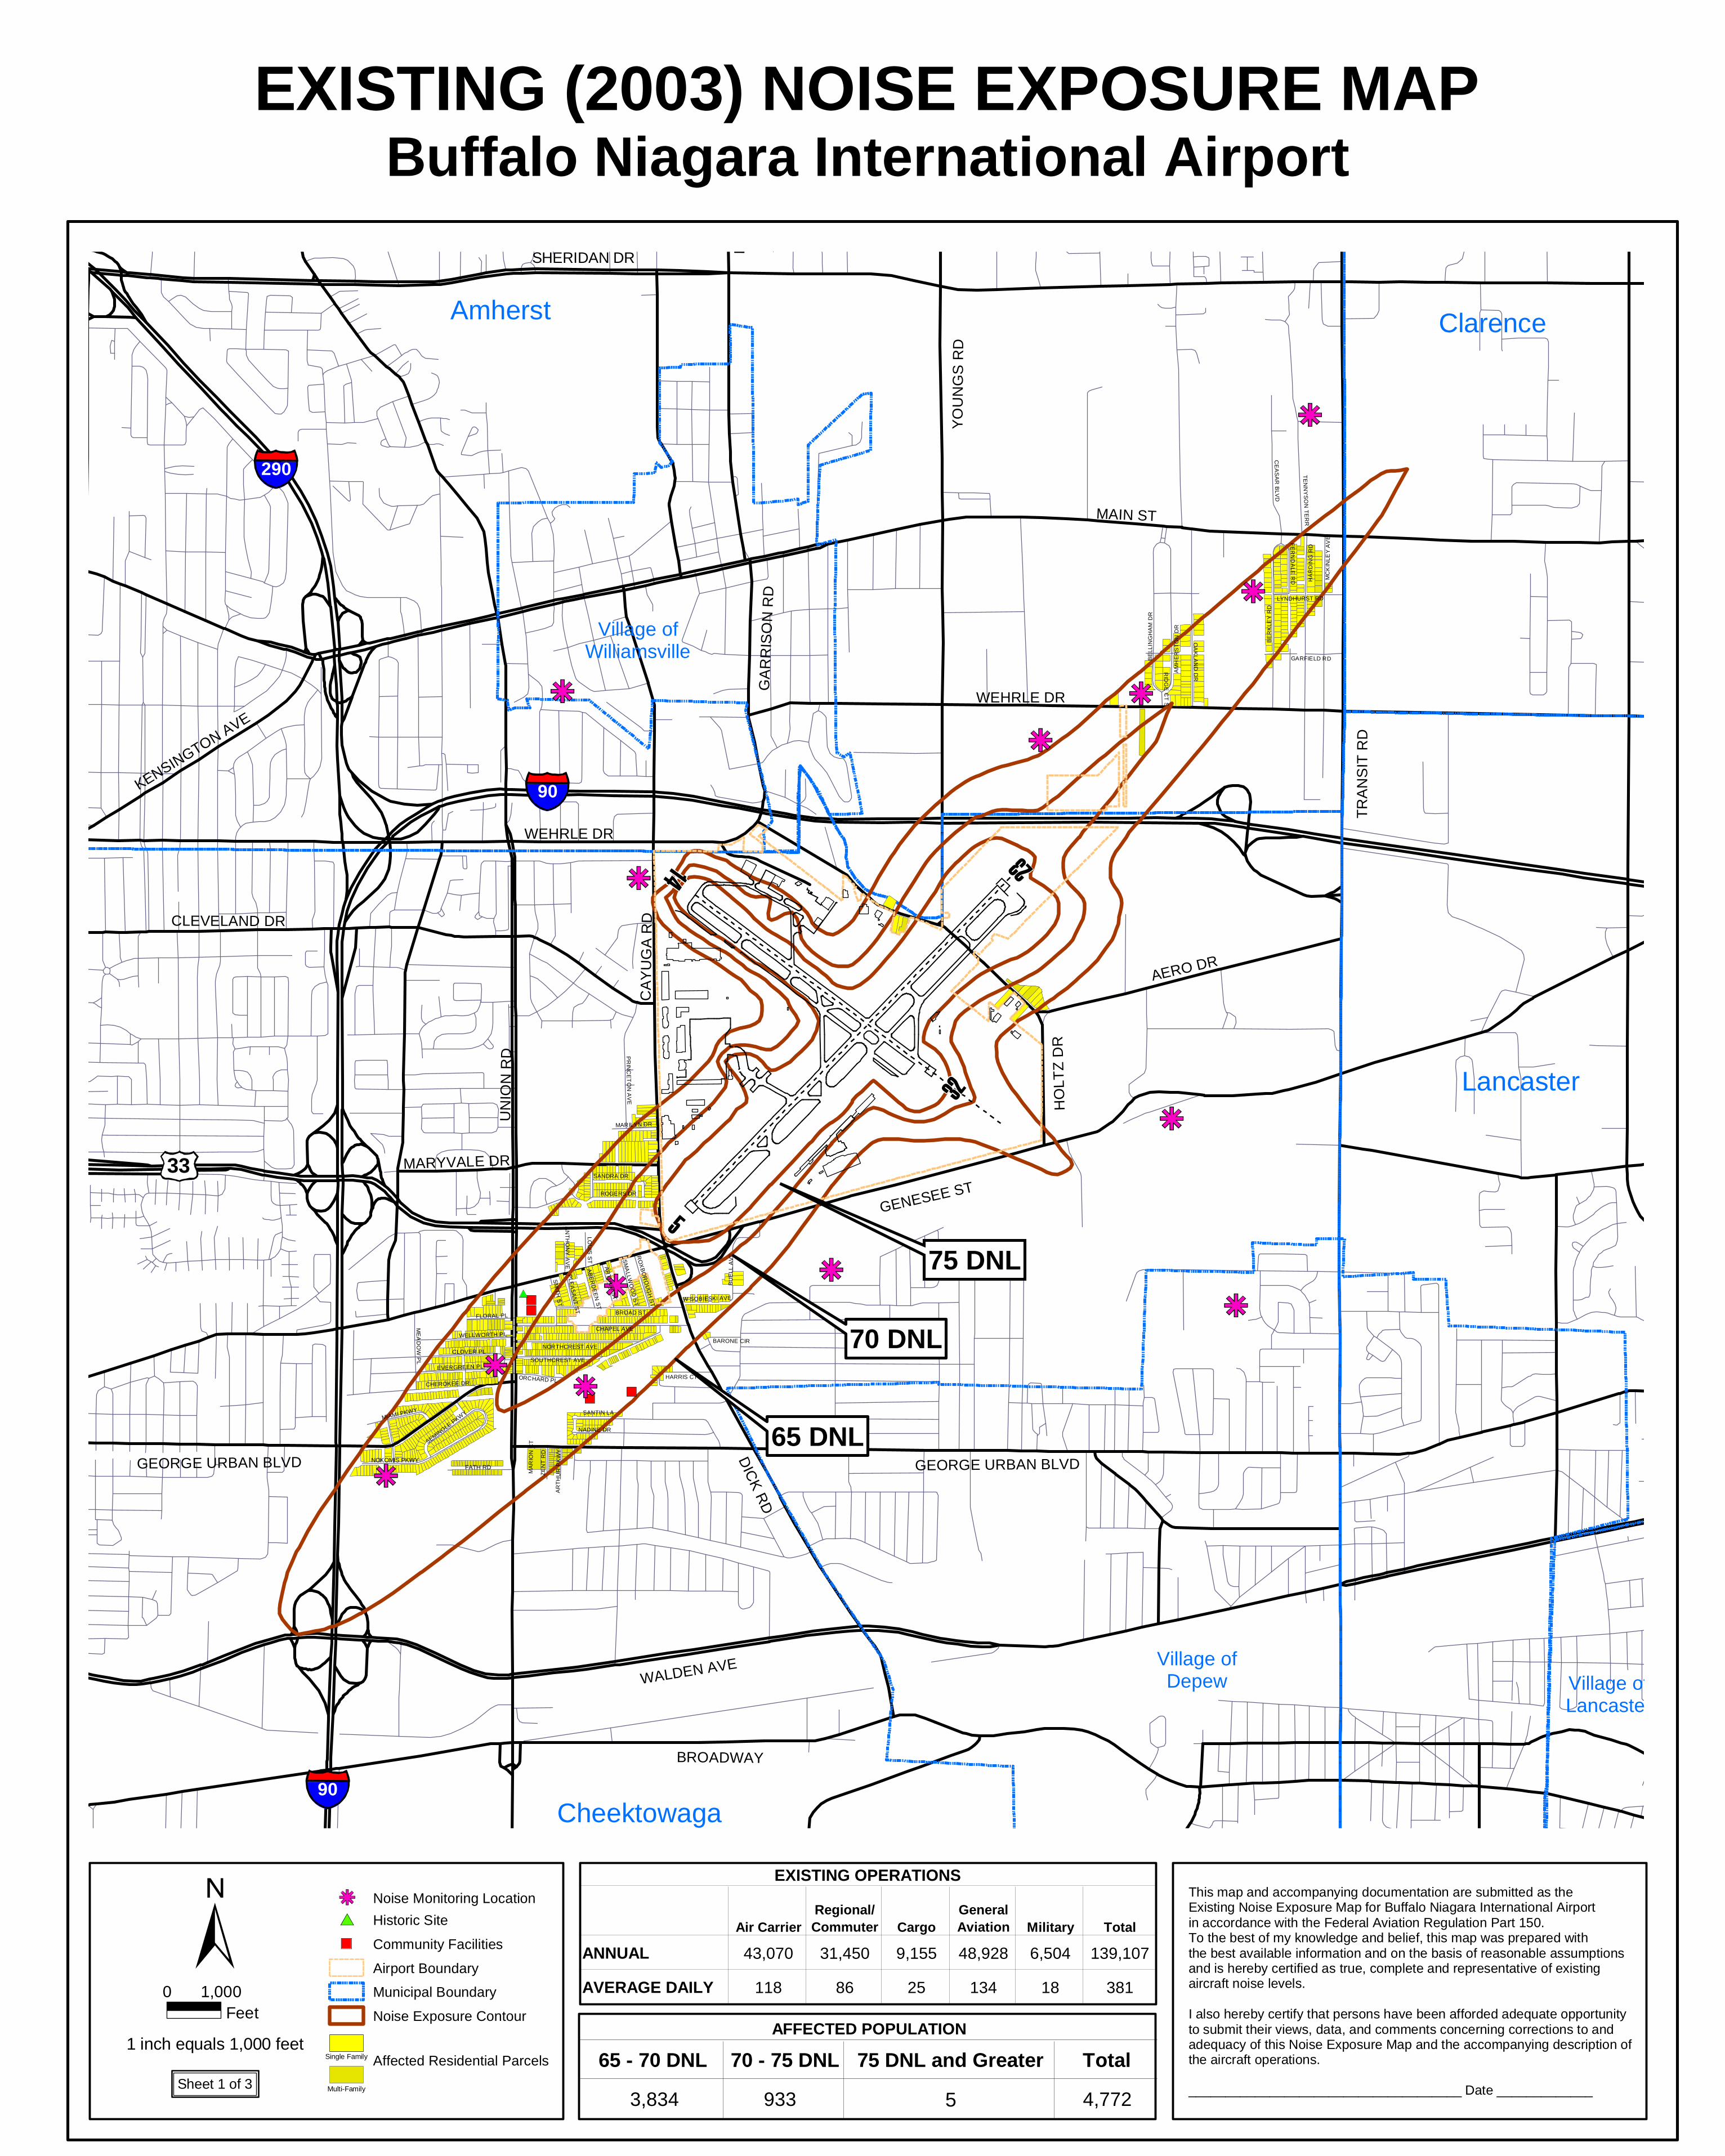
This map and accompanying documentation are submitted as the Existing Noise Exposure Map for Buffalo Niagara International Airport in accordance with the Federal Aviation Regulation Part 150. To the best of my knowledge and belief, this map was prepared with the best available information and on the basis of reasonable assumptionsand is hereby certified as true, complete and representative of existing aircraft noise levels.
I also hereby certify that persons have been afforded adequate opportunityto submit their views, data, and comments concerning corrections to andadequacy of this Noise Exposure Map and the accompanying description ofthe aircraft operations.
_____________________________________ Date _____________
Community Facilities
Airport Boundary
Municipal Boundary
Noise Exposure Contour
Affected Residential Parcels
Historic Site
Single Family
Multi-Family
1 inch equals 1,000 feet
EXISTING OPERATIONS
Air CarrierRegional/ Commuter Cargo
General Aviation Military Total
ANNUAL 43,070 31,450 9,155 48,928 6,504 139,107
AVERAGE DAILY 118 86 25 134 18 381
AFFECTED POPULATION
65 - 70 DNL 70 - 75 DNL 75 DNL and Greater Total
3,733 931 5 4,669
0 1,000Feet
Buffalo Niagara International AirportEXISTING (2003) NOISE EXPOSURE MAP