34
4.0 Fuel Usage (Combustibles) Frank R. Leslie, B. S. E. E., M. S. Space Technology 1/25/2010, Rev. 2.0.1 fleslie @fit.edu; (321) 674-7377 www.fit.edu/~fleslie
| Date post: | 29-Dec-2015 |
| Category: |
Documents |
| Upload: | lorin-short |
| View: | 217 times |
| Download: | 2 times |

4.0 Fuel Usage (Combustibles)
Frank R. Leslie, B. S. E. E., M. S. Space Technology
1/25/2010, Rev. 2.0.1
fleslie @fit.edu; (321) 674-7377
www.fit.edu/~fleslie

4.0 Overview
Currently, energy comes primarily from combustion of fossil fuels or nuclear energy
Electricity and hydrogen are energy carriers, not sources!
In some areas of the World, wind energy is being significantly developed: Europe, United States, Denmark, Sweden, Germany, India, China are a few
Energy sources are so critical to civilizations that many wars have been fought over the supplies
Lack of common local energy sources can hold back the development of a nation
100119

4.0.1 About This Presentation
4.1 Energy Consumption4.2 Energy Flows4.3 State Fuel Consumption4.4 Fuel Declines4.5 Degree-days4.6 CAISO, an ISO4.7 Energy Diversity4.8 What’s a Fuel?4.9 Energy Selection and Countries4.10 Predictions for 20504.11 Conclusion
060118

Figure 1. Energy Consumption by Source, 1635 -2000 (Quadrillion Btu)
http://www.eia.doe.gov/aer/eh/frame.html
050116

4.1 Energy Demand Trends
The US Energy Information Administration (EIA) provides extensive graphs and tables about energyVisit them at www.eia.doe.gov
Oil predominates, NG is gaining, coal climbs steadily, renewables continue to gain slowly, nuclear leveling off (might change)
060116
http://www.eia.doe.gov/neic/press/00-05-1.gif

4.1.1 EIA Figure 33. US Energy Consumption History and Outlook
http://www.eia.doe.gov/aer/eh/frame.html060115
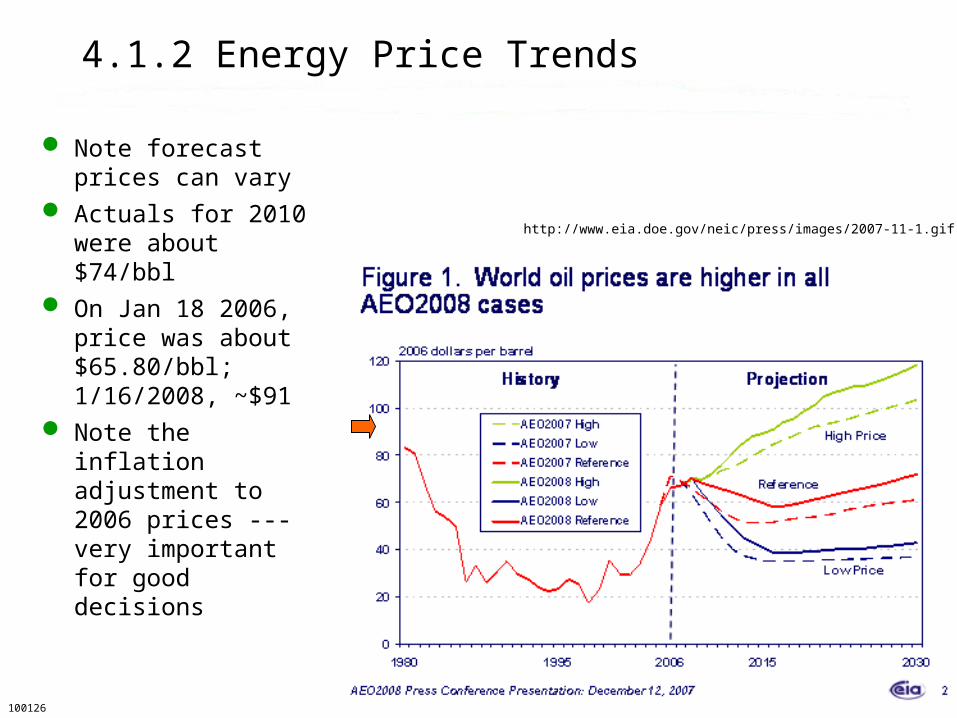
4.1.2 Energy Price Trends
Note forecast prices can vary
Actuals for 2010 were about $74/bbl
On Jan 18 2006, price was about $65.80/bbl; 1/16/2008, ~$91
Note the inflation adjustment to 2006 prices --- very important for good decisions
100126
http://www.eia.doe.gov/neic/press/images/2007-11-1.gif

4.2 2008 US Energy Flows from EIA
060115 http://www.eia.doe.gov/emeu/aer/pdf/pages/sec1_3.pdf
Quadrillion Btu, or “Quads”

4.3 US States Fuel Consumption
060115 http://www.eia.doe.gov/emeu/aer/pdf/pages/sec1_14.pdf

4.4 The Hubbert Curve Predicts Fossil Fuel Decline
Dr. M. King Hubbert, geophysicist, published his prediction that the US oil peak would be reached in 1970. Later, others predicted the World oil peak would occur in the first decade of the 21st Century.
Past the production peak, oil prices will increase as extraction becomes more difficult and the price is bid up.
www.hubbertpeak.com/midpoint.htm050111
From Wikipedia

Millions of years of incoming solar energy were captured in the form of coal, oil, and natural gas; current usage thus exceeds the rate of original production (0.02%)
Coal may last 200-400 years; estimates vary greatly; not as useful for transportation due to thermal losses in converting to convenient liquid “synfuel”
We can conserve energy by reducing loads power or time used and through increased efficiency in generating, transmitting, and using energy
Efficiency and conservation will delay an energy crisis, leaving more for later but will not prevent it
100126
4.4.1 The Eventual Decline of Fossil Fuels

4.5 Degree-Days
The January map from ClimateSource below shows degree-days of heating required.
Degree-days are computed as the temperature difference from 65 degrees F (I’d prefer 75F)
When the temperature changes, increased heating or air conditioning increases the electrical power demand
Oil dealers use computed degree-days to deliver to home tanks before the oil runs out
080116
Ref.: ClimateSource

4.6 CAISO, the California System Operator
This power curve is from Tuesday, 1/26/2010
CAISO, the California Independent System Operator, buys and sells power
Low consumption at 3 a.m., a modest peak at 9 a.m., and a sharp rise at 6 p.m. Why?
The top green line is the maximum power (32 GW) that the system can generate
100126
http://www.caiso.com/outlook/SystemStatus.html
1/11/2003

4.7 Energy Diversity
Next Era Energy (was FPL Energy) has resources across the US that are heavily invested in wind and solar energy
Large energy companies like BP and Shell are pursuing renewable energy development
Utilities often obtain energy from unconventional sources
100126
Conlon, Oregon (photo by F. Leslie)

4.7.1 Energy Diversity for US
The US uses a greater average % of coal (52%) versus 6% in Florida
100125
http://www.eia.doe.gov/aer/eh/frame.html
Florida

Bolivia Inti - France has also been very active in training personnel from several African NGOs about the benefits of solar ovens and other alternative cooking devices such as wood efficient stoves and retained heat cookers.
Bolivia Inti's President Robert Chiron and others during a public demonstration in Nantes, France
040120 http://solarcooking.org/celebrate-solarcooking.htm
4.8 Is Solar Energy a Fuel? “Not Exactly”

4.8.1 Fuel Specific Heat Energy
Fuels are burned in direct combustion with airVarious fuels have differing values of heat when
burnedThe energy density of these fuels is important in
determining how they will be usedWind and solar energies are diffuse or less dense than
burning the top surface of a fuel in a shallow panWind power density varies from zero to kilowatts of
power/m2 by cube of wind speedSolar module power output varies from zero to
~300 watts/m2, while typically it is 150 W/m2 (at 15% efficiency)
Wave power varies from zero to ~90 kW/meter of wave front around the World
100126

4.8.1 Fuel Heat Capacity
Zerban, 1964
100125
Douglas fir 9050 Btu/lb
Fuel Oil 140 000 Btu/gal
Coal 15 000 Btu/lb
Natural Gas 1000 Btu/cu ft
Propane, C3H8
21 690 Btu/cu ft
Butane, C4H10
21 340 Btu/cu ft
Bagasse 7985 Btu/cu ft
Gasoline 20 200 Btu/cu ft
Kerosene 19 900 Btu/cu ft
One Btu

4.8.2 Fuel for Transportation
Transportation of fuels is determined by economicsIf a closer fuel cost plus the transportation cost
is less, that closer fuel is likely to be usedCoal is usually transported by train or ship,
although locally, it is sometimes carried by dump trucks for home heating
While oil flows through pipelines or is brought by double-hulled tankers, the military hauls jet fuel by tanker aircraft to refuel other aircraft in flightThe cost of air transport exceeds that of the
raw fuel on the ground!
080116

4.8.3 Iraqi military burns wells in Kuwait
http://www.users.cloud9.net/~bradmcc/cgi-bin/vuImag3.pl?i=167Copyright © 2001-2002 Brad McCormick, Ed.D.
050111

4.8.4 An Iranian View of the Iraq Situation
September 18, 2002The Iranian
If and when it happens, an invasion of Iraq will be the seventh oil war in some 50 years. Wars are largely violent struggles for material and symbolic resources. They also demonstrate the failure of human imagination to find peaceful solutions to their problems. Resorting to war is easy. Peace building is difficult.
050111

4.8.5 Fuel Availability and Military Action
President Roosevelt imposed an oil embargo on Japan that led to the Pearl Harbor attack of Dec. 7, 1941For three previous years, the US supplied 50% of
Japan’s oil while she conquered much of China Iraq invaded Kuwait in 1991, and the US Coalition
responded to protect oil interests (and World peace)The late Saddam Hussein ordered the burning of oil
wells as his forces retreated and the spilling of oil into the Gulf: two environmental disasters
The US military is in Iraq again in 2005-10; the US buys little oil from Iraq, but it’s a global market with worldwide interaction
100121

4.9 Optimal energy selection and use
Energy source selection is based primarily on pricePrice varies with availability and World commodity
markets, but psychology is a strong factorA common petroleum indicator is “Light Sweet
Crude” on the NYMEX commodity exchange; was ~$38 on 1/14/2009 (Sweet means it is low in sulfur; the old-time geologists actually tasted it!)
Energy trading is how utilities find additional energy to buy if they run short
In some states, consumers can choose the source of energy they prefer; there may be a premium
There may be a market for energy brokering services
090114

4.9.1 Bolivian Energy
Most energy is from hydroelectric plants
Oil use exceeds production; imports half the diesel oil needed
There is an active solar energy market developing
Proposed natural gas exports led to President’s replacement
Chile wouldn’t allow pipelines to cross anyway (war of 1879)
100125
http://www.eia.doe.gov/emeu/cabs/bolivia.html
Oct 2003 EIA report
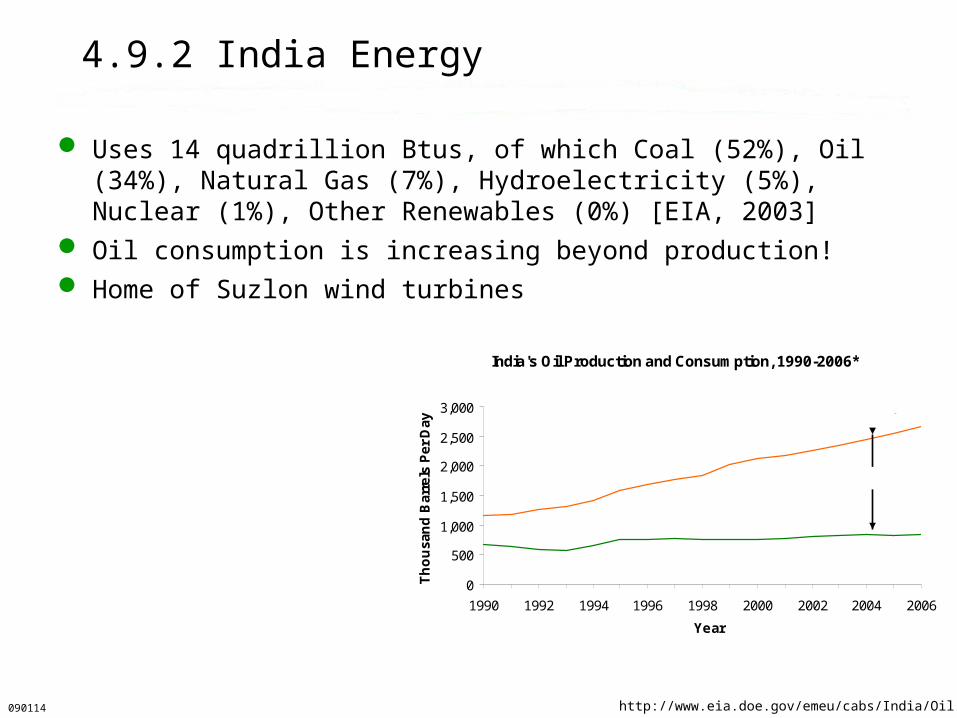
4.9.2 India Energy
Uses 14 quadrillion Btus, of which Coal (52%), Oil (34%), Natural Gas (7%), Hydroelectricity (5%), Nuclear (1%), Other Renewables (0%) [EIA, 2003]
Oil consumption is increasing beyond production! Home of Suzlon wind turbines
090114 http://www.eia.doe.gov/emeu/cabs/India/Oil.html
India's Oil Production and Consumption, 1990-2006*
0
500
1,000
1,500
2,000
2,500
3,000
1990 1992 1994 1996 1998 2000 2002 2004 2006
Year
Th
ou
san
d B
arre
ls P
er D
ayConsumption
Production
Net Imports
Source: EIA International Energy Annual 2004 ; Short-Term Energy Outlook (Jan. 2007)
*2006 is estimate

4.9.4 South Africa
South Africa has a highly developed synthetic fuels industry supported by abundant coal resources, offshore natural gas and condensate production in Mossel Bay, and natural gas imports from Mozambique. Sasol, with a capacity of 160,000 barrels per day (bbl/d) from coal-to-liquids (CTL), and PetroSA, with a capacity of 45,000 bbl/d from gas to liquids (GTL), are the major producers of synthetic fuel in South Africa. Together, the two firms supply approximately 40 percent of the South African fuels market.
080116
http://www.eia.doe.gov/emeu/cabs/South_Africa/Oil.html

4.10 Energy Considerations for 2050
Fossil-fuel energy will deplete in the future; being used faster than made and price rises
US oil production peaked about 1974; world energy will likely peak about 2004-9
Renewable energy will eventually become mandatory, and our lifestyles may change
Transition to renewable energy (or nonfossil hydrogen) must occur well before a fuel crisis occurs
100126

4.10.1 My Predictions for 2050
I predict that energy prices will be much higher in 2050, as energy becomes more costly to extract and increased antipollution costs are passed on to the consumer
In some states, more nuclear plants will be placed in operation while in others, nuclear plants will be closedThese changes will be primarily politically driven
Coal will continue to be a primary source in coal mining states, while wind energy will be greatly developed where winds are strong enough for economic use
Overseas, offshore wind farms will provide much of the power, while fossil fuels will fall in use due to their price
Fossil fuel lifetimes will increase because it’s so expensive that use will decline; it then lasts longer
Cars and trucks may be plug-in hybrids for most of us
100121

4.11 Fuels Conclusion
Fuel usage is determined by cost and convenience
High fuel density is critical for transportation
Low costs of fossil fuels and nuclear energy will keep these in predominance for several decades, but wind energy is close to coal cost
Renewable energy provides small contributions to total now, but will increase as transition is made
090114

Olin Engineering Complex 4.7 kW Solar PV Roof Array
080116
Questions?

References: Books
Zerban, Alexander and Edwin Nye. Power Plants. Scranton: International Textbook Co., 655 pp., 1964.
Brower, Michael. Cool Energy. Cambridge MA: The MIT Press, 1992. 0-262-02349-0, TJ807.9.U6B76, 333.79’4’0973.
Duffie, John and William A. Beckman. Solar Engineering of Thermal Processes. NY: John Wiley & Sons, Inc., 920 pp., 1991
Gipe, Paul. Wind Energy for Home & Business. White River Junction, VT: Chelsea Green Pub. Co., 1993. 0-930031-64-4, TJ820.G57, 621.4’5
Patel, Mukund R. Wind and Solar Power Systems. Boca Raton: CRC Press, 1999, 351 pp. ISBN 0-8493-1605-7, TK1541.P38 1999, 621.31’2136
Sørensen, Bent. Renewable Energy, Second Edition. San Diego: Academic Press, 2000, 911 pp. ISBN 0-12-656152-4.
050116

References: Websites, etc.
050111
www.eia.doe.gov Comprehensive statistical site on energy usagehttp://www.eia.doe.gov/emeu/world/country/cntry_PM.htmlhttp://hnn.us/articles/89.html History News Networkhttp://www.soton.ac.uk/~engenvir/environment/water/oil.gulf.war.htmlhttp://www.users.cloud9.net/~bradmcc/cgi-bin/vuImag3.pl?i=167http://www.iranian.com/MajidTehranian/2002/September/Oil/ Iranian webpagehttp://www.hubbertpeak.com/debate/energy50.htmhttp://www.eia.doe.gov/emeu/security/esar/esar.htmlhttp://www.eia.doe.gov/emeu/plugs/plhotsp.html EIA World Energy Watch (great reference)
____________________________________________________________awea-windnet@yahoogroups.com. Wind Energy [email protected]. Wind energy home powersite elistgeothermal.marin.org/ on geothermal energymailto:[email protected] rredc.nrel.gov/wind/pubs/atlas/maps/chap2/2-01m.html PNNL wind energy map of CONUS [email protected]. Elist for wind energy experimenterswww.dieoff.org. Site devoted to the decline of energy and effects upon populationwww.ferc.gov/ Federal Energy Regulatory Commissionwww.hawaii.gov/dbedt/ert/otec_hi.html#anchor349152 on OTEC systemstelosnet.com/wind/20th.htmlwww.google.com/search?q=%22renewable+energy+course%22solstice.crest.org/dataweb.usbr.gov/html/powerplant_selection.html

Slide stockpile follows!
Older slides follow this one. Look at these if you have interest or time. It’s difficult to decide what to leave out of the lecture to save time!

Outtakes follow
Some slides may be placed past this point as they became somewhat older or situations have changed


