21
March 2014 4Q13 Fixed Income Presentation
March 2014
4Q13 Fixed Income Presentation
PERU’S ECONOMY AND BANKING
SYSTEM
2
Highlights
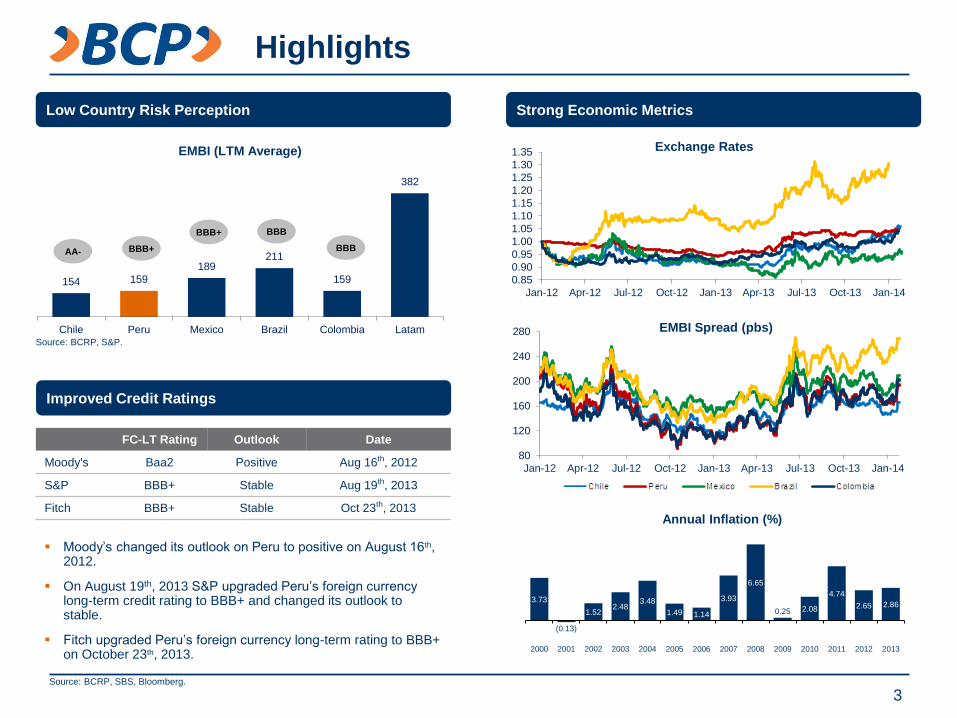
Strong Economic Metrics Low Country Risk Perception
Improved Credit Ratings
BBB BBB+
BBB+ BBB
AA-
Source: BCRP, S&P.
FC-LT Rating Outlook Date
Moody's Baa2 Positive Aug 16th, 2012
S&P BBB+ Stable Aug 19th, 2013
Fitch BBB+ Stable Oct 23th, 2013
3 Source: BCRP, SBS, Bloomberg.
Moody’s changed its outlook on Peru to positive on August 16th, 2012.
On August 19th, 2013 S&P upgraded Peru’s foreign currency long-term credit rating to BBB+ and changed its outlook to stable.
Fitch upgraded Peru’s foreign currency long-term rating to BBB+ on October 23th, 2013.
0.85
0.90
0.95
1.00
1.05
1.10
1.15
1.20
1.25
1.30
1.35
Jan-12 Apr-12 Jul-12 Oct-12 Jan-13 Apr-13 Jul-13 Oct-13 Jan-14
Exchange Rates
154 159
189211
159
382
Chile Peru Mexico Brazil Colombia Latam
EMBI (LTM Average)
3.73
(0.13)
1.522.48
3.48
1.49 1.14
3.93
6.65
0.25 2.08
4.74
2.65 2.86
2000 2001 2002 2003 2004 2005 2006 2007 2008 2009 2010 2011 2012 2013
Annual Inflation (%)
80
120
160
200
240
280
Jan-12 Apr-12 Jul-12 Oct-12 Jan-13 Apr-13 Jul-13 Oct-13 Jan-14
EMBI Spread (pbs)
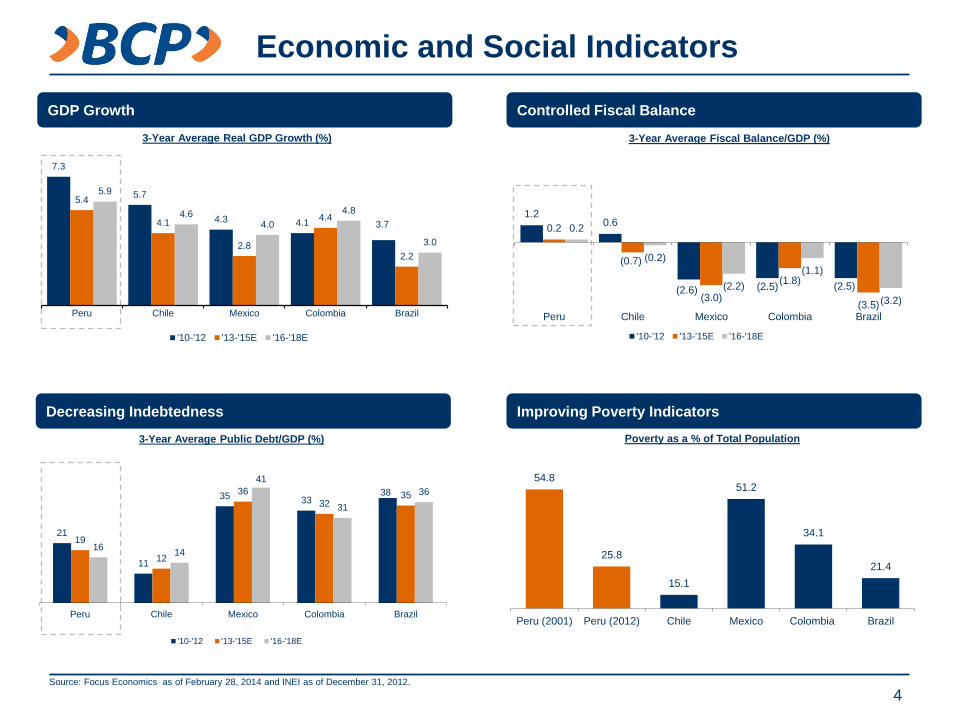
Economic and Social Indicators
3-Year Average Public Debt/GDP (%)
3-Year Average Fiscal Balance/GDP (%)
Poverty as a % of Total Population
3-Year Average Real GDP Growth (%)
Improving Poverty Indicators
Controlled Fiscal Balance GDP Growth
Decreasing Indebtedness
4 Source: Focus Economics as of February 28, 2014 and INEI as of December 31, 2012.
54.8
25.8
15.1
51.2
34.1
21.4
Peru (2001) Peru (2012) Chile Mexico Colombia Brazil
7.3
5.7
4.3 4.1 3.7
5.4
4.1
2.8
4.4
2.2
5.9
4.6 4.0
4.8
3.0
Peru Chile Mexico Colombia Brazil
'10-'12 '13-'15E '16-'18E
1.2 0.6
(2.6) (2.5) (2.5)
0.2
(0.7)
(3.0)
(1.8)
(3.5)
0.2
(0.2)
(2.2)
(1.1)
(3.2)
Peru Chile Mexico Colombia Brazil
'10-'12 '13-'15E '16-'18E
21
11
35 33 38
19
12
36
32 35
16 14
41
31
36
Peru Chile Mexico Colombia Brazil
'10-'12 '13-'15E '16-'18E
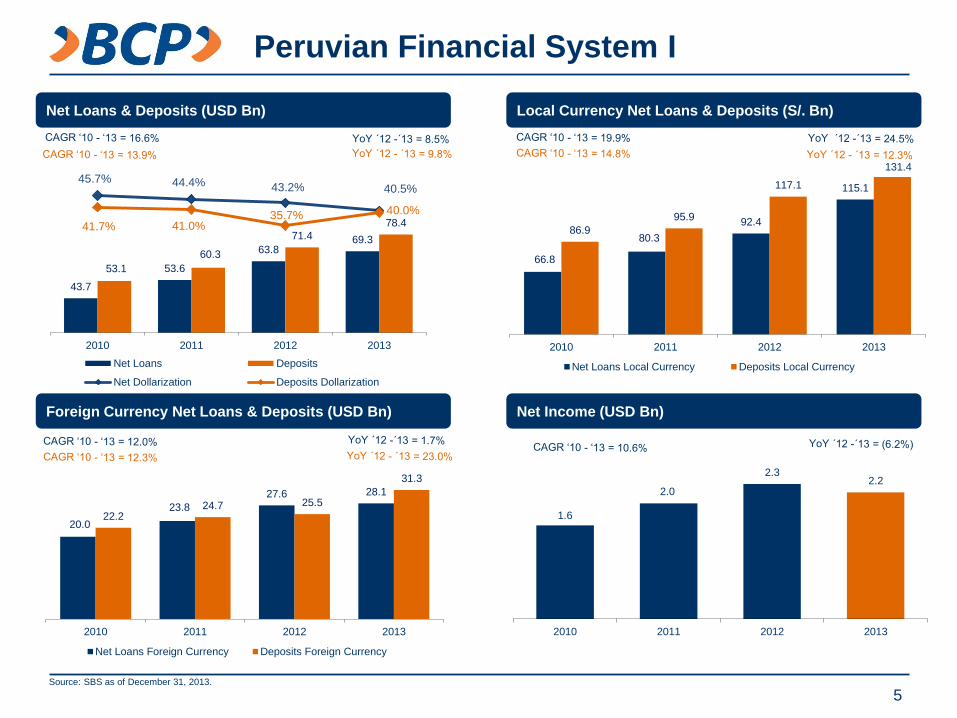
1.6
2.0
2.3 2.2
2010 2011 2012 2013
20.0
23.8
27.6 28.1
22.224.7 25.5
31.3
2010 2011 2012 2013
Net Loans Foreign Currency Deposits Foreign Currency
66.8
80.3
92.4
115.1
86.9
95.9
117.1
2010 2011 2012 2013
Net Loans Local Currency Deposits Local Currency
Peruvian Financial System I
Net Income (USD Bn)
Local Currency Net Loans & Deposits (S/. Bn) Net Loans & Deposits (USD Bn)
Foreign Currency Net Loans & Deposits (USD Bn)
5 Source: SBS as of December 31, 2013.
131.4
43.7
53.6
63.869.3
53.1
60.3
71.4
78.4
45.7% 44.4% 43.2% 40.5%
41.7% 41.0%35.7% 40.0%
2010 2011 2012 2013
Net Loans Deposits
Net Dollarization Deposits Dollarization
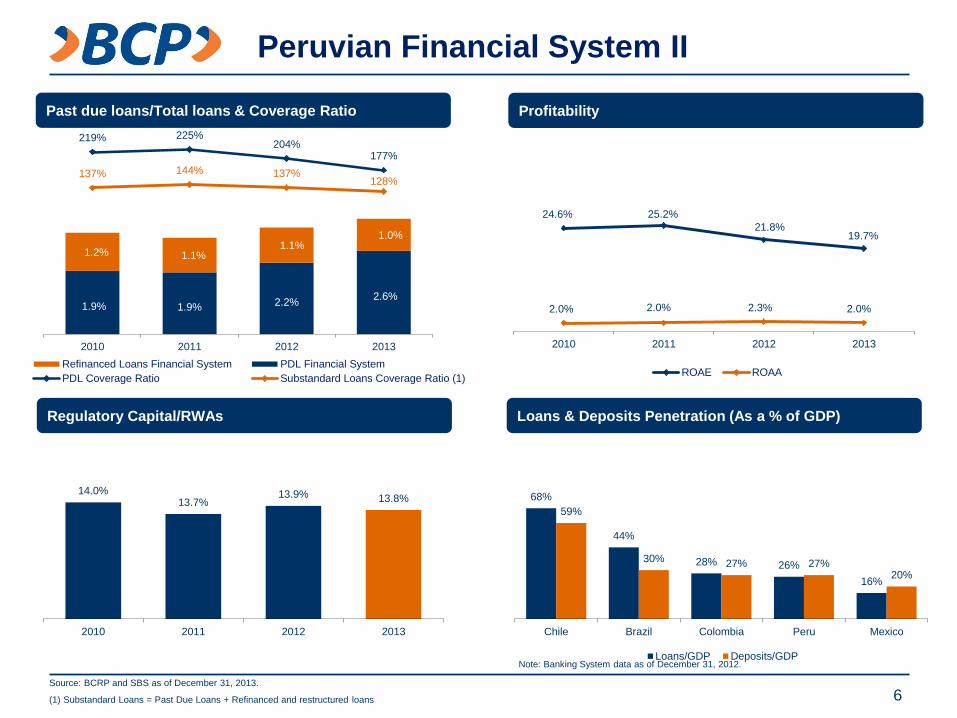
Peruvian Financial System II
Regulatory Capital/RWAs Loans & Deposits Penetration (As a % of GDP)
Past due loans/Total loans & Coverage Ratio Profitability
6 Source: BCRP and SBS as of December 31, 2013.
(1) Substandard Loans = Past Due Loans + Refinanced and restructured loans
Note: Banking System data as of December 31, 2012.
68%
44%
28% 26%
16%
59%
30% 27% 27%20%
Chile Brazil Colombia Peru Mexico
Loans/GDP Deposits/GDP
1.9% 1.9% 2.2%2.6%
1.2% 1.1%1.1%
1.0%
219% 225%204%
177%
137% 144% 137%128%
-200%
-150%
-100%
-50%
0%
50%
100%
150%
200%
250%
2010 2011 2012 2013
Refinanced Loans Financial System PDL Financial System
PDL Coverage Ratio Substandard Loans Coverage Ratio (1)
14.0%13.7%
13.9% 13.8%
2010 2011 2012 2013
24.6% 25.2%
21.8%19.7%
2.0% 2.0% 2.3% 2.0%
2010 2011 2012 2013
ROAE ROAA
BANCO DE CRÉDITO DEL PERÚ - BCP
7
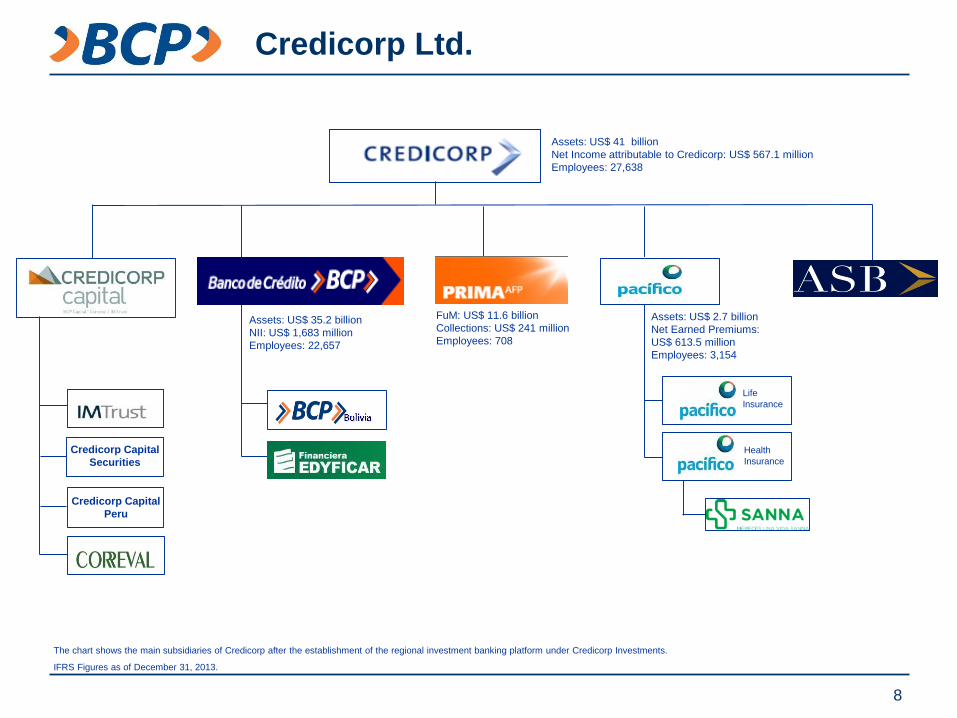
Credicorp Ltd.
8
The chart shows the main subsidiaries of Credicorp after the establishment of the regional investment banking platform under Credicorp Investments.
IFRS Figures as of December 31, 2013.
Life
Insurance
Health
Insurance
Assets: US$ 35.2 billion
NII: US$ 1,683 million
Employees: 22,657
FuM: US$ 11.6 billion
Collections: US$ 241 million
Employees: 708
Assets: US$ 2.7 billion
Net Earned Premiums:
US$ 613.5 million
Employees: 3,154
Assets: US$ 41 billion
Net Income attributable to Credicorp: US$ 567.1 million
Employees: 27,638
Credicorp Capital
Securities
Credicorp Capital
Peru
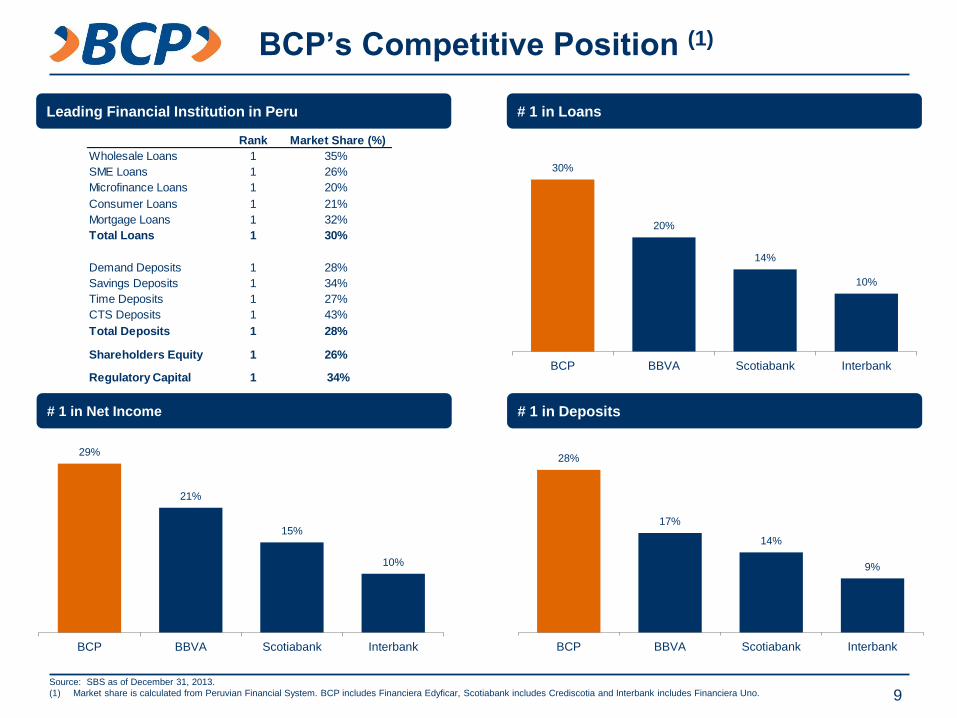
BCP’s Competitive Position (1)
# 1 in Deposits
# 1 in Loans Leading Financial Institution in Peru
# 1 in Net Income
9 Source: SBS as of December 31, 2013.
(1) Market share is calculated from Peruvian Financial System. BCP includes Financiera Edyficar, Scotiabank includes Crediscotia and Interbank includes Financiera Uno.
Rank Market Share (%)
Wholesale Loans 1 35%
SME Loans 1 26%
Microfinance Loans 1 20%
Consumer Loans 1 21%
Mortgage Loans 1 32%
Total Loans 1 30%
Demand Deposits 1 28%
Savings Deposits 1 34%
Time Deposits 1 27%
CTS Deposits 1 43%
Total Deposits 1 28%
Shareholders Equity 1 26%
Regulatory Capital 1 34%
29%
21%
15%
10%
BCP BBVA Scotiabank Interbank
30%
20%
14%
10%
BCP BBVA Scotiabank Interbank
28%
17%
14%
9%
BCP BBVA Scotiabank Interbank
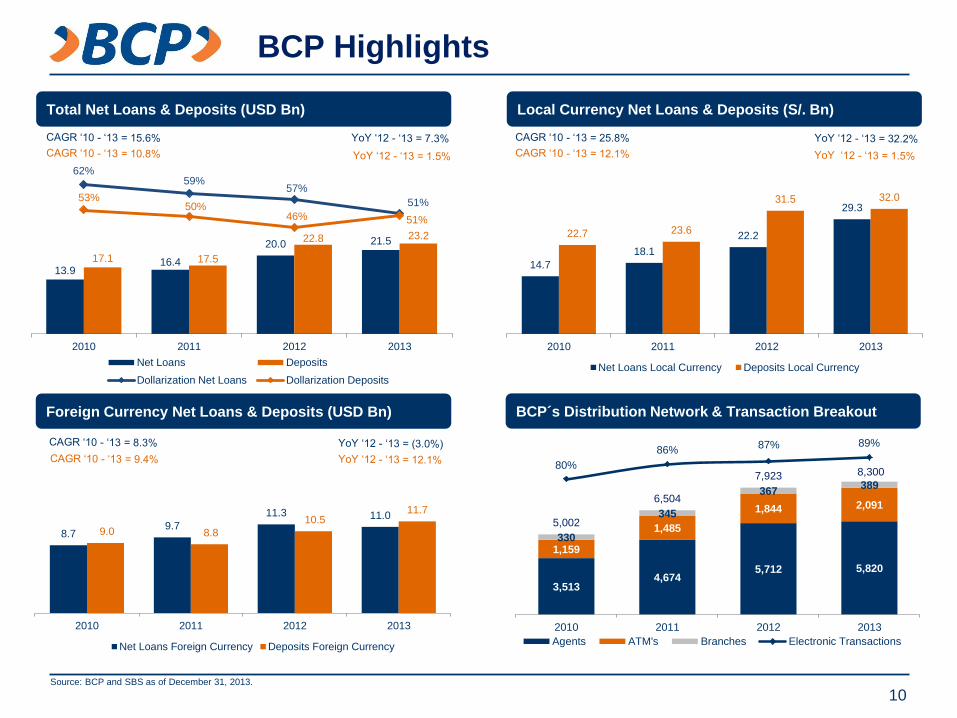
14.7
18.1
22.2
29.3
22.7 23.6
31.5 32.0
2010 2011 2012 2013
Net Loans Local Currency Deposits Local Currency
8.79.7
11.3 11.0
9.0 8.8
10.5 11.7
2010 2011 2012 2013
Net Loans Foreign Currency Deposits Foreign Currency
Source: BCP and SBS as of December 31, 2013.
BCP´s Distribution Network & Transaction Breakout
Local Currency Net Loans & Deposits (S/. Bn) Total Net Loans & Deposits (USD Bn)
Foreign Currency Net Loans & Deposits (USD Bn)
BCP Highlights
10
3,5134,674
5,712 5,820
1,159
1,485
1,844 2,091
330
345
367389
5,002
6,504
7,923 8,30080%
86%87% 89%
2010 2011 2012 2013
Agents ATM's Branches Electronic Transactions
13.916.4
20.0 21.5
17.1 17.5
22.8 23.2
62%59%
57%
51%53%50%
46% 51%
2010 2011 2012 2013
Net Loans Deposits
Dollarization Net Loans Dollarization Deposits
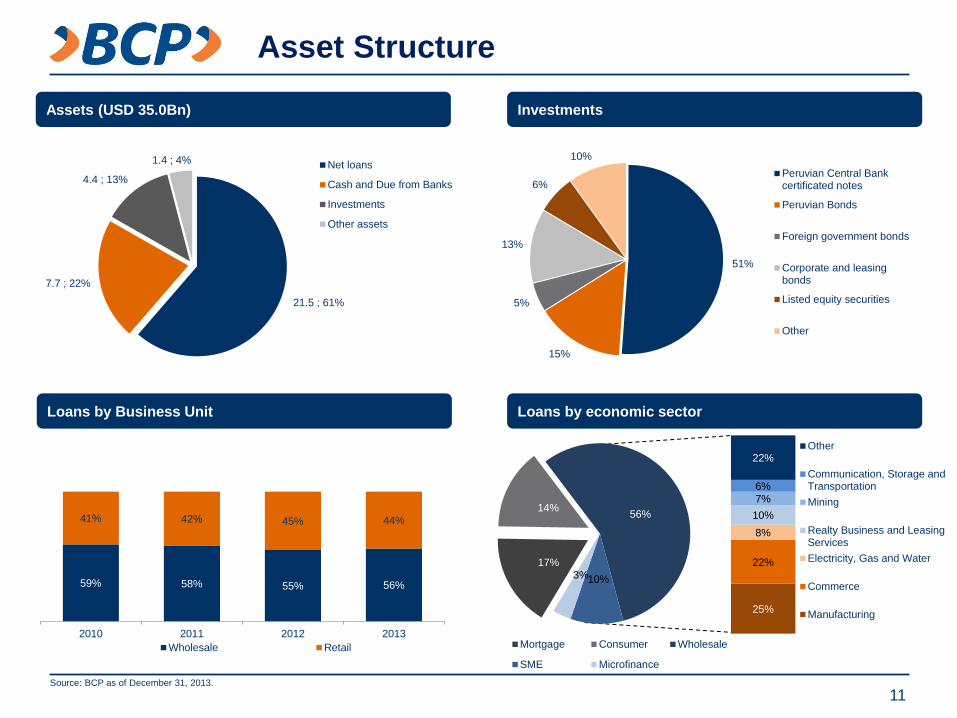
17%
14%56%
10%3%
Mortgage Consumer Wholesale
SME Microfinance
25%
22%
8%
10%
7%
6%
22%Other
Communication, Storage andTransportation
Mining
Realty Business and LeasingServices
Electricity, Gas and Water
Commerce
Manufacturing
Loans by economic sector
Investments Assets (USD 35.0Bn)
Loans by Business Unit
Asset Structure
11 Source: BCP as of December 31, 2013.
51%
15%
5%
13%
6%
10%
Peruvian Central Bankcertificated notes
Peruvian Bonds
Foreign government bonds
Corporate and leasingbonds
Listed equity securities
Other
21.5 ; 61%
7.7 ; 22%
4.4 ; 13%
1.4 ; 4% Net loans
Cash and Due from Banks
Investments
Other assets
59% 58% 55% 56%
41% 42% 45% 44%
2010 2011 2012 2013
Wholesale Retail
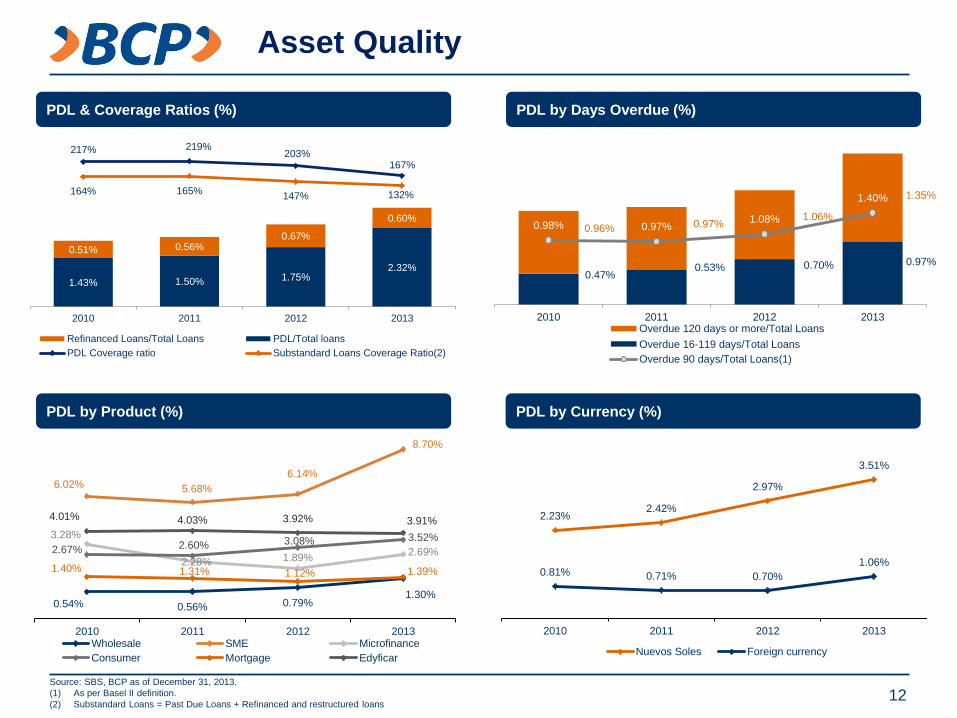
PDL by Currency (%)
PDL by Days Overdue (%) PDL & Coverage Ratios (%)
PDL by Product (%)
Asset Quality
12 Source: SBS, BCP as of December 31, 2013.
(1) As per Basel II definition.
(2) Substandard Loans = Past Due Loans + Refinanced and restructured loans
2.23%2.42%
2.97%
3.51%
0.81% 0.71% 0.70%
1.06%
2010 2011 2012 2013
Nuevos Soles Foreign currency
1.43% 1.50% 1.75%2.32%
0.51% 0.56%0.67%
0.60%
217% 219%203%
167%
164% 165%147% 132%
2010 2011 2012 2013
Refinanced Loans/Total Loans PDL/Total loans
PDL Coverage ratio Substandard Loans Coverage Ratio(2)
0.47%0.53% 0.70% 0.97%
0.96% 0.97%1.06%
1.35%
0.98% 0.97%1.08%
1.40%
2010 2011 2012 2013Overdue 120 days or more/Total Loans
Overdue 16-119 days/Total Loans
Overdue 90 days/Total Loans(1)
0.54% 0.56% 0.79%1.30%
6.02% 5.68%
6.14%
8.70%
3.28%
2.28% 1.89%2.69%2.67% 2.60% 3.08% 3.52%
1.40% 1.31% 1.12% 1.39%
4.01% 4.03% 3.92% 3.91%
2010 2011 2012 2013Wholesale SME Microfinance
Consumer Mortgage Edyficar
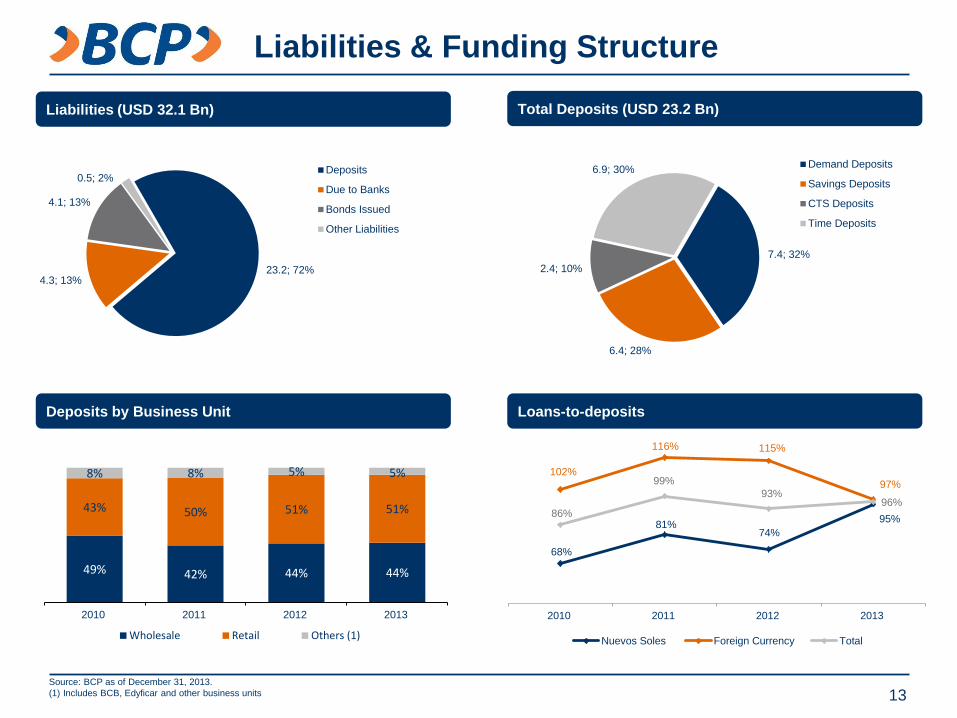
Liabilities & Funding Structure
Others $1bn Equity $2bn
Total Deposits (USD 23.2 Bn) Liabilities (USD 32.1 Bn)
Deposits by Business Unit Loans-to-deposits
13 Source: BCP as of December 31, 2013.
(1) Includes BCB, Edyficar and other business units
23.2; 72%4.3; 13%
4.1; 13%
0.5; 2%Deposits
Due to Banks
Bonds Issued
Other Liabilities
7.4; 32%
6.4; 28%
2.4; 10%
6.9; 30%Demand Deposits
Savings Deposits
CTS Deposits
Time Deposits
68%
81%74%
95%
102%
116% 115%
97%
86%
99%
93%96%
2010 2011 2012 2013
Nuevos Soles Foreign Currency Total
49% 42% 44% 44%
43% 50% 51% 51%
8% 8% 5% 5%
2010 2011 2012 2013
Wholesale Retail Others (1)
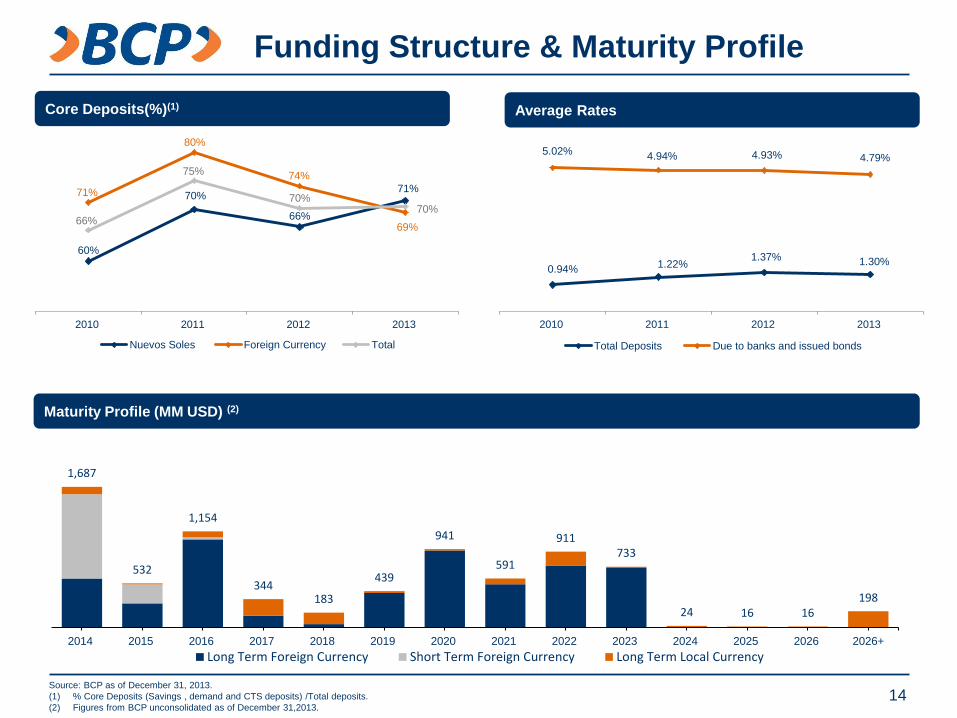
Funding Structure & Maturity Profile
Equity $2bn
Average Rates Core Deposits(%)(1)
Maturity Profile (MM USD) (2)
Source: BCP as of December 31, 2013.
(1) % Core Deposits (Savings , demand and CTS deposits) /Total deposits.
(2) Figures from BCP unconsolidated as of December 31,2013. 14
60%
70%
66%
71%71%
80%
74%
69%66%
75%
70%70%
2010 2011 2012 2013
Nuevos Soles Foreign Currency Total
0.94% 1.22%1.37% 1.30%
5.02% 4.94% 4.93% 4.79%
2010 2011 2012 2013
Total Deposits Due to banks and issued bonds
1,687
532
1,154
344183
439
941
591
911733
24 16 16198
2014 2015 2016 2017 2018 2019 2020 2021 2022 2023 2024 2025 2026 2026+
Long Term Foreign Currency Short Term Foreign Currency Long Term Local Currency
1,5591,907
2,405 2,574
405
765
1,0971,274
1,964
2,671
3,502
3,848
2010 2011 2012 2013
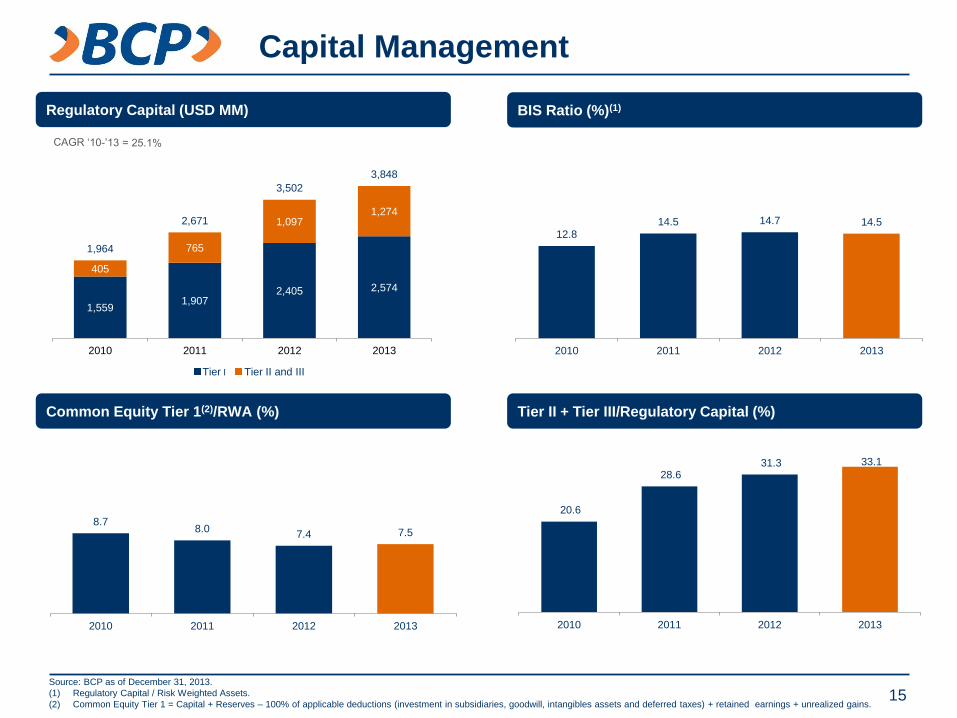
Capital Management
Tier I Tier II and III
Tier II + Tier III/Regulatory Capital (%)
BIS Ratio (%)(1) Regulatory Capital (USD MM)
15 Source: BCP as of December 31, 2013.
(1) Regulatory Capital / Risk Weighted Assets.
(2) Common Equity Tier 1 = Capital + Reserves – 100% of applicable deductions (investment in subsidiaries, goodwill, intangibles assets and deferred taxes) + retained earnings + unrealized gains.
Common Equity Tier 1(2)/RWA (%)
20.6
28.6 31.3 33.1
2010 2011 2012 2013
8.78.0
7.4 7.5
2010 2011 2012 2013
12.814.5 14.7 14.5
2010 2011 2012 2013
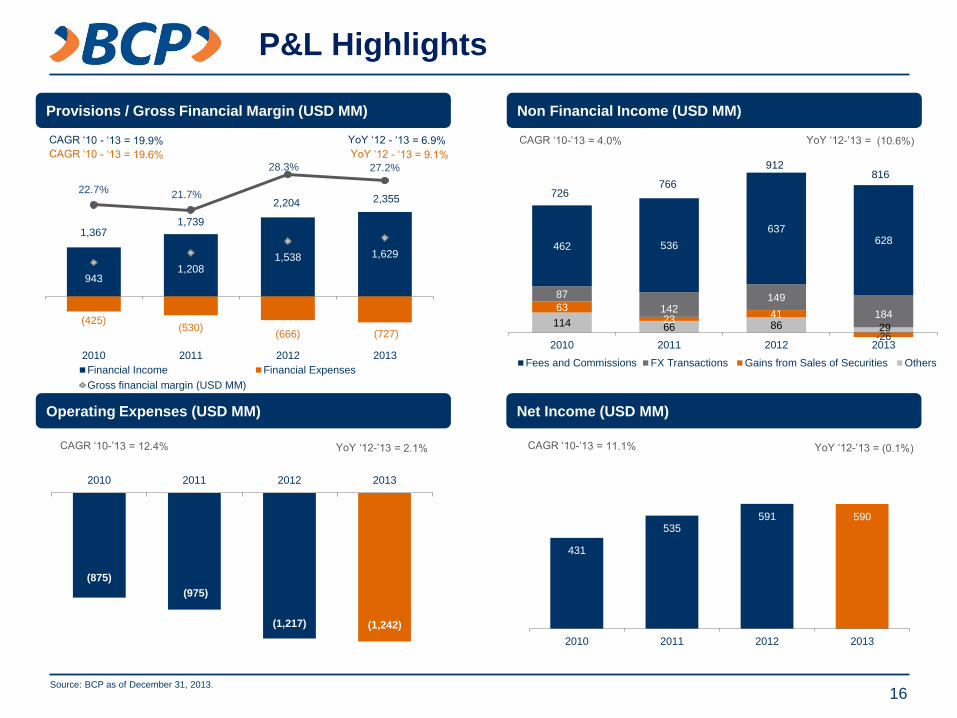
114 66 86 29
6323
41
-26
87
142149
184
462 536
637628
2010 2011 2012 2013
Fees and Commissions FX Transactions Gains from Sales of Securities Others
(875)
(975)
(1,217) (1,242)
2010 2011 2012 2013
Net Income (USD MM)
Non Financial Income (USD MM) Provisions / Gross Financial Margin (USD MM)
Operating Expenses (USD MM)
P&L Highlights
16 Source: BCP as of December 31, 2013.
521
431
535591 590
2010 2011 2012 2013
726 766
912 816
1,3671,739
2,204 2,355
(425)(530)
(666) (727)
9431,208
1,538 1,629
22.7% 21.7%
28.3% 27.2%
2010 2011 2012 2013
Financial Income Financial Expenses
Gross financial margin (USD MM)
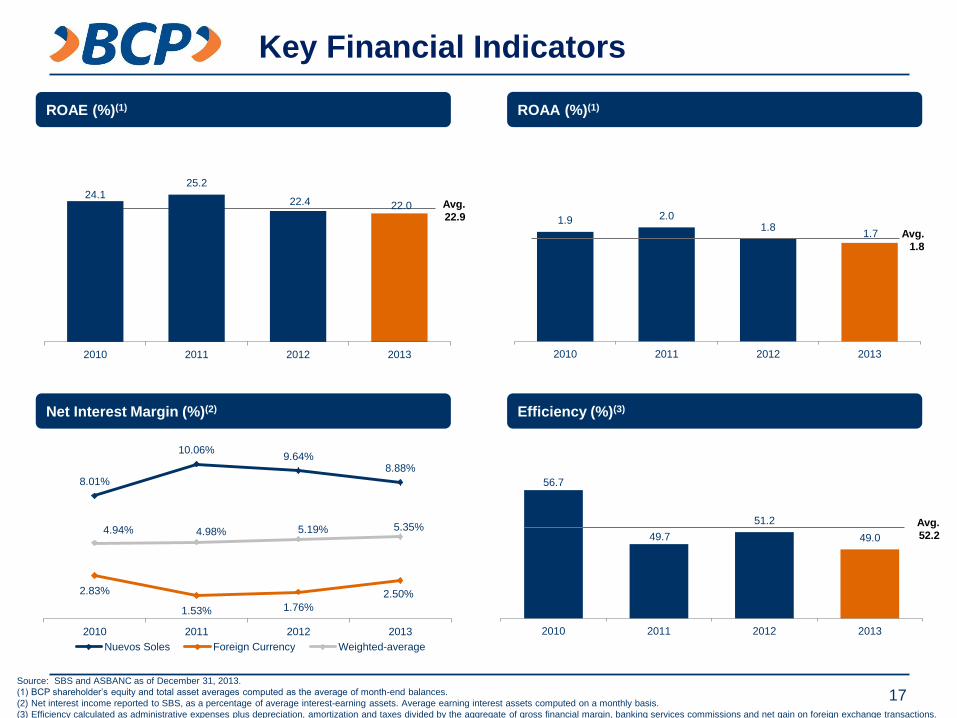
56.7
49.7
51.2
49.0
2010 2011 2012 2013
1.9 2.01.8
1.7
2010 2011 2012 2013
Avg.
22.9
Avg.
52.2
Avg.
1.8
Efficiency (%)(3)
ROAA (%)(1) ROAE (%)(1)
Net Interest Margin (%)(2)
Key Financial Indicators
17 Source: SBS and ASBANC as of December 31, 2013.
(1) BCP shareholder’s equity and total asset averages computed as the average of month-end balances.
(2) Net interest income reported to SBS, as a percentage of average interest-earning assets. Average earning interest assets computed on a monthly basis.
(3) Efficiency calculated as administrative expenses plus depreciation, amortization and taxes divided by the aggregate of gross financial margin, banking services commissions and net gain on foreign exchange transactions.
24.125.2
22.4 22.0
2010 2011 2012 2013
8.01%
10.06%9.64%
8.88%
2.83%
1.53% 1.76%
2.50%
4.94% 4.98% 5.19% 5.35%
2010 2011 2012 2013
Nuevos Soles Foreign Currency Weighted-average
APPENDIX
18
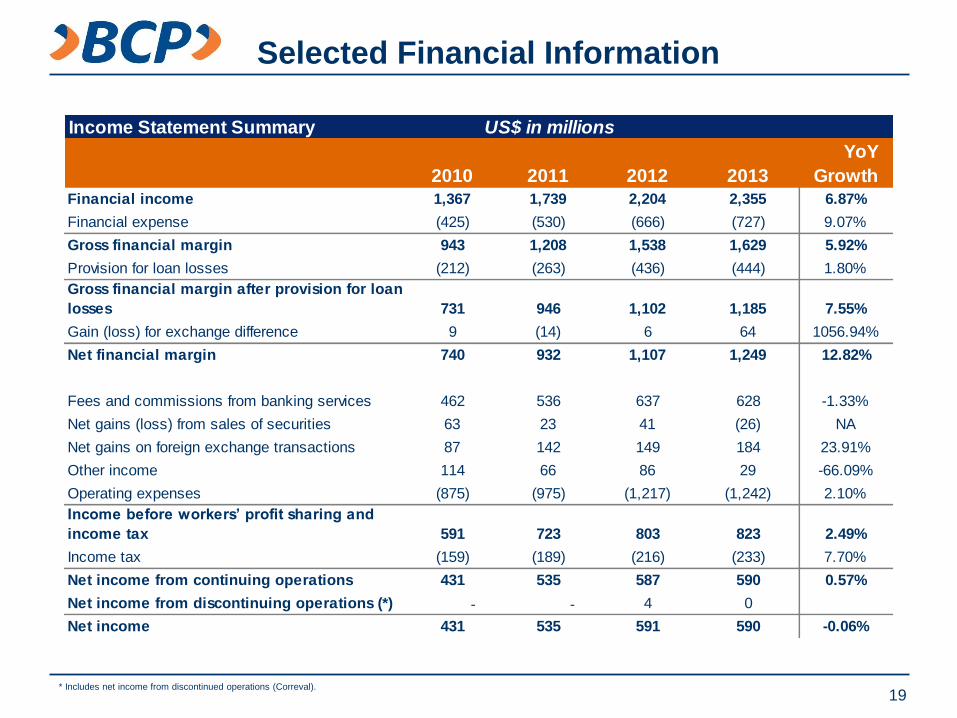
Selected Financial Information
19 * Includes net income from discontinued operations (Correval).
Income Statement Summary
2010 2011 2012 2013
YoY
Growth
Financial income 1,367 1,739 2,204 2,355 6.87%
Financial expense (425) (530) (666) (727) 9.07%
Gross financial margin 943 1,208 1,538 1,629 5.92%
Provision for loan losses (212) (263) (436) (444) 1.80%
Gross financial margin after provision for loan
losses 731 946 1,102 1,185 7.55%
Gain (loss) for exchange difference 9 (14) 6 64 1056.94%
Net financial margin 740 932 1,107 1,249 12.82%
Fees and commissions from banking services 462 536 637 628 -1.33%
Net gains (loss) from sales of securities 63 23 41 (26) NA
Net gains on foreign exchange transactions 87 142 149 184 23.91%
Other income 114 66 86 29 -66.09%
Operating expenses (875) (975) (1,217) (1,242) 2.10%
Income before workers’ profit sharing and
income tax 591 723 803 823 2.49%
Income tax (159) (189) (216) (233) 7.70%
Net income from continuing operations 431 535 587 590 0.57%
Net income from discontinuing operations (*) - - 4 0
Net income 431 535 591 590 -0.06%
US$ in millions
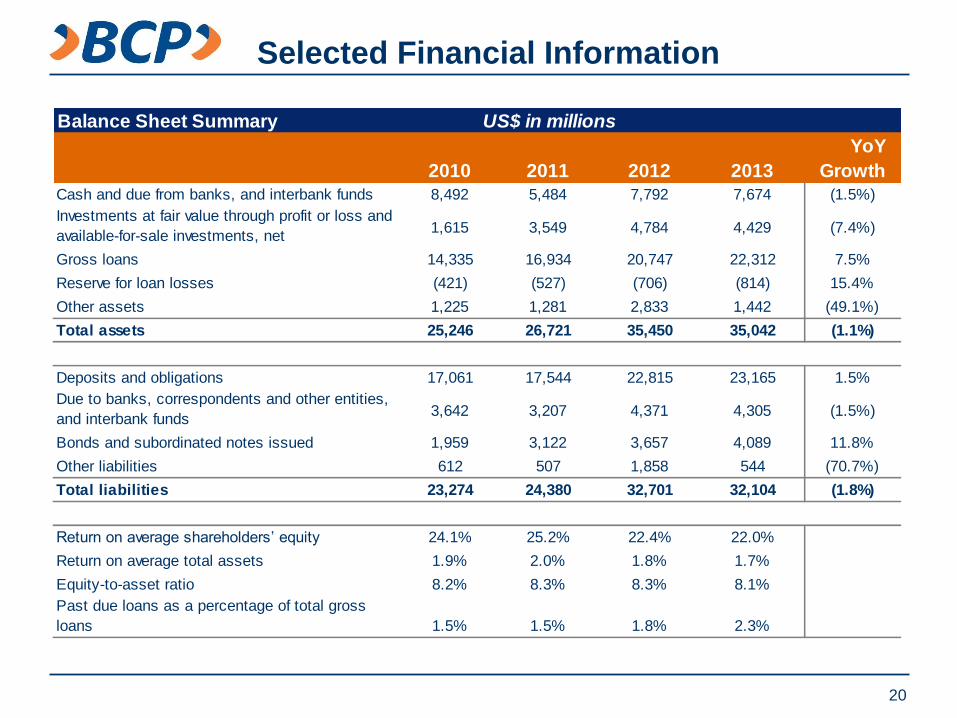
Selected Financial Information
20
Balance Sheet Summary
2010 2011 2012 2013
YoY
Growth
Cash and due from banks, and interbank funds 8,492 5,484 7,792 7,674 (1.5%)
Investments at fair value through profit or loss and
available-for-sale investments, net 1,615 3,549 4,784 4,429 (7.4%)
Gross loans 14,335 16,934 20,747 22,312 7.5%
Reserve for loan losses (421) (527) (706) (814) 15.4%
Other assets 1,225 1,281 2,833 1,442 (49.1%)
Total assets 25,246 26,721 35,450 35,042 (1.1%)
Deposits and obligations 17,061 17,544 22,815 23,165 1.5%
Due to banks, correspondents and other entities,
and interbank funds 3,642 3,207 4,371 4,305 (1.5%)
Bonds and subordinated notes issued 1,959 3,122 3,657 4,089 11.8%
Other liabilities 612 507 1,858 544 (70.7%)
Total liabilities 23,274 24,380 32,701 32,104 (1.8%)
Return on average shareholders’ equity 24.1% 25.2% 22.4% 22.0%
Return on average total assets 1.9% 2.0% 1.8% 1.7%
Equity-to-asset ratio 8.2% 8.3% 8.3% 8.1%
Past due loans as a percentage of total gross
loans 1.5% 1.5% 1.8% 2.3%
US$ in millions
21
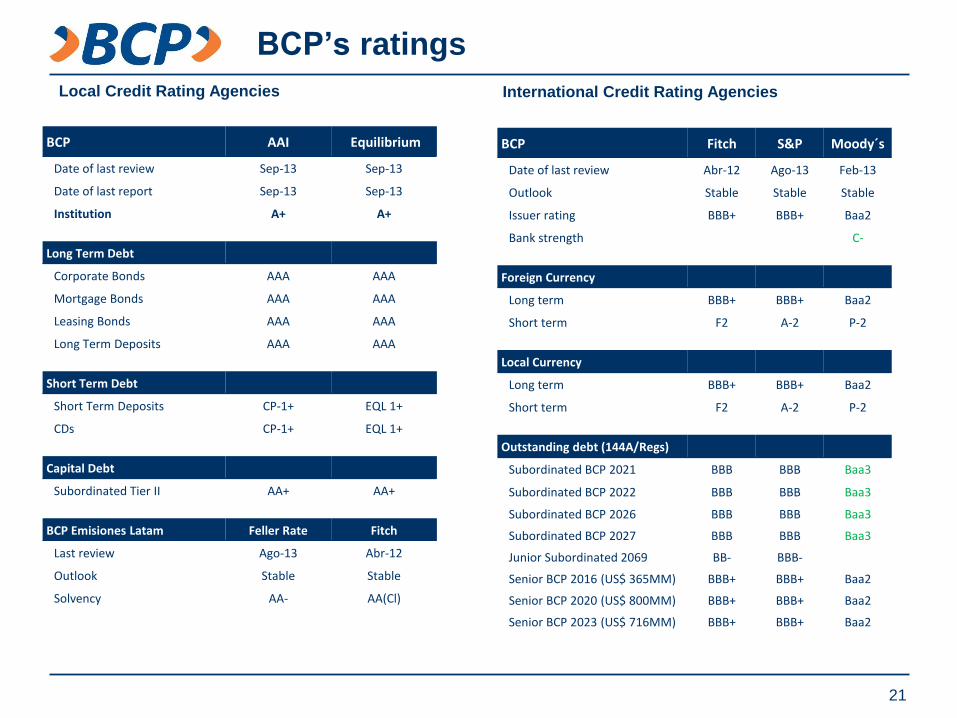
BCP’s ratings
International Credit Rating Agencies Local Credit Rating Agencies
BCP AAI Equilibrium
Date of last review Sep-13 Sep-13
Date of last report Sep-13 Sep-13
Institution A+ A+
Long Term Debt
Corporate Bonds AAA AAA
Mortgage Bonds AAA AAA
Leasing Bonds AAA AAA
Long Term Deposits AAA AAA
Short Term Debt
Short Term Deposits CP-1+ EQL 1+
CDs CP-1+ EQL 1+
Capital Debt
Subordinated Tier II AA+ AA+
BCP Emisiones Latam Feller Rate Fitch
Last review Ago-13 Abr-12
Outlook Stable Stable
Solvency AA- AA(Cl)
BCP Fitch S&P Moody´s
Date of last review Abr-12 Ago-13 Feb-13
Outlook Stable Stable Stable
Issuer rating BBB+ BBB+ Baa2
Bank strength C-
Foreign Currency
Long term BBB+ BBB+ Baa2
Short term F2 A-2 P-2
Local Currency
Long term BBB+ BBB+ Baa2
Short term F2 A-2 P-2
Outstanding debt (144A/Regs)
Subordinated BCP 2021 BBB BBB Baa3
Subordinated BCP 2022 BBB BBB Baa3
Subordinated BCP 2026 BBB BBB Baa3
Subordinated BCP 2027 BBB BBB Baa3
Junior Subordinated 2069 BB- BBB-
Senior BCP 2016 (US$ 365MM) BBB+ BBB+ Baa2
Senior BCP 2020 (US$ 800MM) BBB+ BBB+ Baa2
Senior BCP 2023 (US$ 716MM) BBB+ BBB+ Baa2


