Page 1
A STUDY TOWARDS THE IMPLEMENTATION OF A FIRE SERVICE OPERATIONAL STRUCTURE IN THE EDEN DISTRICT MUNICIPAL AREA
By
Zanda van Rooyen
Submitted in partial fulfilment of the requirements for the degree of
Magister in Business Administration
at the NMMU Business School
Research supervisor: Prof JJ Pieterse
November 2005
Page 2
ii
DECLARATION
“I, Zanda van Rooyen, ID No 6503190043080 hereby declare that:
- the work in this research paper is my own original work;
- all sources used or referred to have been documented and recognised;
- and this research paper has not been previously submitted in full or
partial fulfilment of the requirements for an equivalent of higher
qualification at any other recognised education institution.”
Signed ………………………
Date:………………………
Page 3
iii
ABSTRACT
The Eden District Municipality (EDM) is a local authority whose area of
responsibility covers the Garden Route and also includes the Klein Karoo. The
boundaries are from Storms River in the east, to Swellendam in the west and
the Swartberg Mountains in the north. The EDM covers a very big area with
seven big municipalities to consider and work with. Five of the municipalities,
Langeberg, Mossel Bay, Knysna, George and Oudtshoorn have their own fire
fighting services.
The EDM fire fighting serves mainly the rural area. This is very costly due to the
large distance required to travel to a fire, whereas the local municipalities are
operating in their own towns. The new municipal boundaries include the rural
areas, but the municipalities cannot service the rural areas because they do not
as yet charge rates in the rural areas and therefore there is no revenue for the
fire fighting service. They operate on the basis of verbal working agreements
that make coordination of fire fighting very difficult.
The fire fighting functions of the EDM as a category C municipality and the local
municipalities as category B municipalities have been specified in the Municipal
Structure Act. The allocation (division) of functions and powers relating to fire
fighting service between the district municipality and local municipalities as
determined by the Municipal Structure Act (Act 117 of 1998) has not been done.
Due to the lack of invested capital, the resources are in a bad state. Some of
the services have no capacity to attend to chemical fires or hazardous
substance emergencies.
Internationally, private fire fighting services can be contracted by government
departments. These private fire fighting services are very large and the areas
that they serve are extensive. These services have their own personnel
structures functioning in an organisational structure that serves them well.
These private services are very cost-effective and can therefore offer
reasonable rates.
Page 4
iv
Bases on an investigation of various fire fighting services and different
structures, the proposed structure for fire fighting in the EDM area will be a
combination of structures. The diverse nature of the area will make the location
of a sectoral structure and extension of its capacity difficult, and several factors
that will impact on an new structure must be kept in mind. If all works well it will
be relatively easy to achieve the five operations performance objectives
envisaged for restructuring namely quality, speed, dependability, flexibility and
cost.
Page 5
v
ACKNOWLEDGEMENTS
I hereby wish to express my gratitude to the following individuals who
contributed to the successful and timeous completion of this dissertation
- To Peet van Rooyen for his support;
- To the George study group, namely
Marius Neser
Trix Holtzhausen
For their support during our years of studying;
- To fire fighters Andrè Tomlinson and Deon van Wyk who shared with me
their passion for fire fighting;
- Eden District Municipality, for making information available.
- To God, my pillar.
Page 6
vi
DEDICATION
This dissertation is dedicated to my family: Tom, Ina, Glenda, Peet, Elzaan,
Thomas and Diane.
Page 7
vii
TABLE OF CONTENTS
DECLARATION ii
ABSTRACT iii
ACKNOWLEDGEMENTS iii
DEDICATION vi
CHAPTER 1 1
INTRODUCTION, PROBLEM STATEMENT AND OUTLINE OF RESEARCH
PROJECT 1
1.1 INTRODUCTION 1
1.2 MAIN PROBLEM 2
1.3 SUB-PROBLEMS 2
1.4 DELIMITATION OF THE RESEARCH 3
1.4.1 Demarcation of Organisations to be researched 3
1.4.2 Geographic demarcation 3
1.5 DEFINITIONS OF KEY TERMS 3
1.5.1 The Fire Fighting Service 3
1.5.2 Demarcation 4
1.5.3 Benchmarking 4
1.5.4 Unique features of an organisation 4
1.5.5 Efficiency 4
1.5.6 Configuration 5
Page 8
viii
1.5.7 Stakeholders 5
1.5.8 The five performance objectives 5
1.6 IMPORTANCE OF THE RESEARCH 6
1.7 RESEARCH DESIGN 7
1.7.1 Literature Study 7
1.7.2 Empirical study 7
1.7.2.1 Measuring Instruments 7
1.7.2.2 Sample 8
1.7.2.3 Statistical analysis of data 8
1.8 DATABASES 8
1.9 LITERATURE OVERVIEW 8
1.10 OUTLINE OF CHAPTERS 10
CHAPTER 2 11
ORGANISATIONAL STRUCTURES AND LOCATION OF CAPACITY 11
2.1 INTRODUCTION 11
2.2 ORGANISATION CHARTS 13
2.3 DIFFERENT TYPES OF ORGANISATIONS 15
2.3.1 BUREAUCRATIC ORGANISATIONAL STRUCTURE 16
2.3.2 Flat Organization Structure 17
2.3.3 Network Organisation 18
2.3.4 The Virtual Organisation 20
2.3.5 Geographic Organisation 22
Page 9
ix
2.4 THE LOCATION OF CAPACITY 24
2.5 THE FIVE PERFORMANCE OBJECTIVES 28
2.5.1 The Quality Objective 30
2.5.2. The Speed Objective 31
2.5.3. The Dependability Objective 32
2.5.4 The Flexibility Objective 32
2.5.5 The Cost Objective 33
2.6 SUMMARY 34
CHAPTER 3 35
BENCHMARKING 35
3.1 INTRODUCTION 35
3.2 RURAL/METRO CORPORATION 36
3.3 ZULULAND FIRE PROTECTION SERVICES 39
3.4 SACRAMENTO METROPOLITAN FIRE DISTRICT (METRO FIRE) 46
3.5 METROPOLITAN POLICE DEPARTMENT 51
3.6 SUMMARY 60
CHAPTER 4 61
DESIGN OF THE EMPIRICAL STUDY 61
Page 10
x
4.1 INTRODUCTION 61
4.2 RESEARCH DESIGN 61
4.3 DESIGN AND STRUCTURE OF THE QUESTIONNAIRE 62
4.3.1 Administration of the questionnaire 65
4.3.2 Variables in questionnaire 66
4.4 SUMMARY 67
CHAPTER 5 68
RESULTS AND ANALYSIS OF THE EMPIRICAL STUDY 68
5.1 INTRODUCTION 68
5.2 ANALYSIS OF EMERGENCY CALLS ATTENDED 68
5.3 ANALYSIS OF QUANTITY OF FIRE STATIONS, SUB-STATIONS
AND CONTROL CENTRES 71
5.4 ANALYSIS OF FIRE SERVICES EXPENDITURE 72
5.5 ANALYSIS OF MANPOWER 73
5.6 CONCLUSION 75
CHAPTER 6 76
RISK PROFILE AND CAPACITY ANALYSIS 76
6.1 INTRODUCTION 76
6.2 CLIMATE 77
Page 11
xi
6.3 GEOPHYSICAL PROFILE 78
6.3.1 Coastal Platform 78
6.3.2 Upper Plateaux 78
6.3.3 Mountains 79
6.3.4 Vegetation 79
6.4 INFRASTRUCTURE 81
6.5 ROADS AND TRANSPORTATION 84
6.6 RAIL TRANSPORT 86
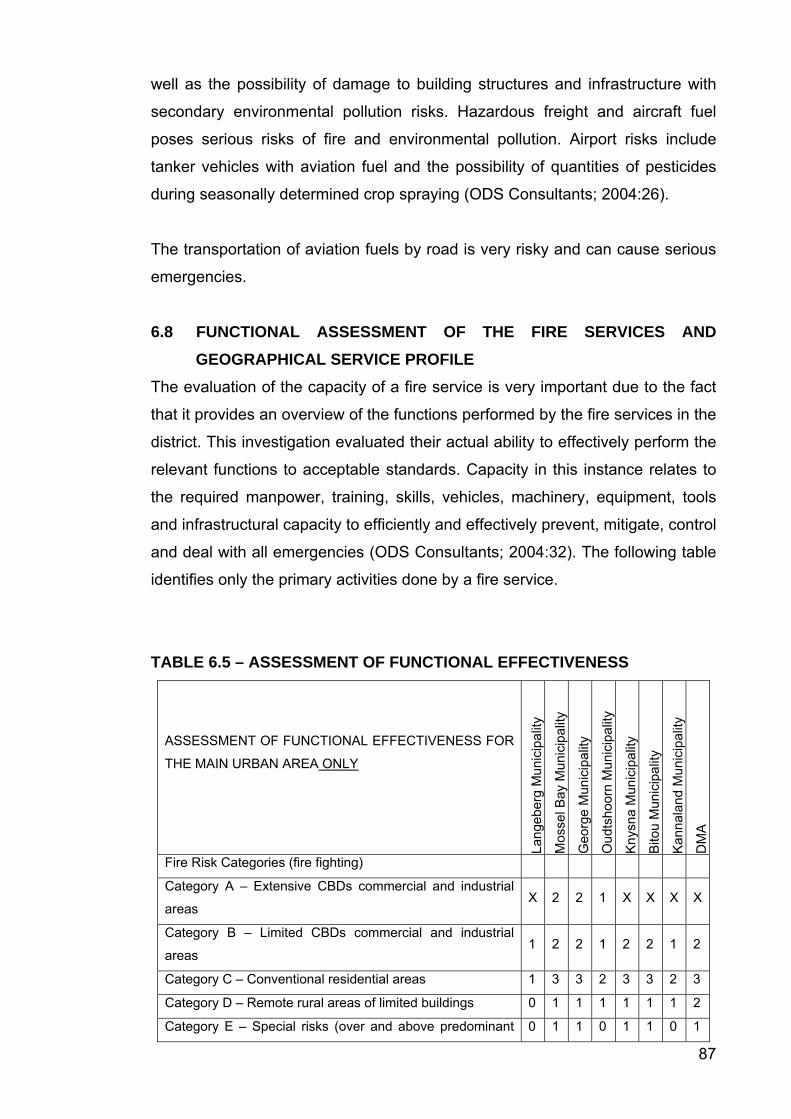
6.7 AIRPORTS 86
6.8 FUNCTIONAL ASSESSMENT OF THE FIRE SERVICES AND
GEOGRAPHICAL SERVICE PROFILE 87
6.9 CONCLUSION 92
CHAPTER 7 94
SUMMARY AND CONCLUSION 94
7.1 INTRODUCTION 94
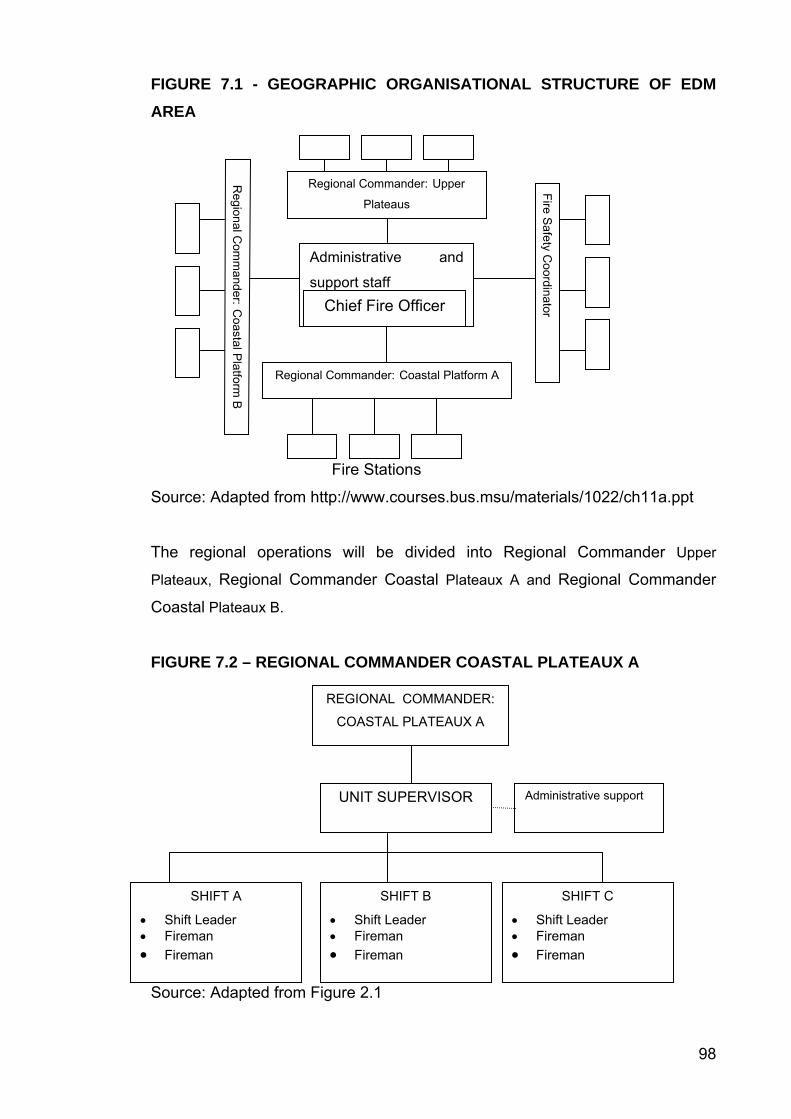
7.2 ORGANISATIONAL STRUCTURE 95
7.3 THE LOCATION OF CAPACITY 101
7.4 THE FIVE PERFORMANCE OBJECTIVES 103
7.4.1 Is the fire fighting service doing things right? 104
7.4.2 Is the fire fighting service first on a scene? 107
7.4.3 Is the fire fighting service doing things on time? 107
Page 12
xii
7.4.4 Is the fire fighting service making changes where necessary? 107
7.4.5 Is the fire fighting service doing their jobs cost effectively? 108
7.5 SUMMARY 110
REFERENCES 112
ANNEXURE A - QUESTIONNAIRE 117
Page 13
xiii
TABLE OF FIGURES AND TABLES
FIGURE 2.1 - EDM FIRE DEPARTMENT ........................................................12
FIGURE 2.2 THE RELATIONSHIP BETWEEN STRATEGIC CHOICE AND THE
ORGANISATIONAL STRUCTURE ...................................................................14
FIGURE 2.3 BUREAUCRATIC ORGANISATION STRUCTURE......................17
FIGURE 2.4 FLAT ORGANISATION ................................................................18
FIGURE 2.5 A DYNAMIC NETWORK ..............................................................19
FIGURE 2.6: NEST OF VIRTUALNESS ...........................................................21
FIGURE 2.7 THE GEOGRAPHIC ORGANISATION STRUCTURE..................23
FIGURE 2.8 - THE ADVANTAGES AND DISADVANTAGES OF A
GEOGRAPHIC STRUCTURE...........................................................................24
FIGURE 2.9 - SUPPLY AND DEMAND: SIDE-FACTORS FOR LOCATION
DECISIONS. .....................................................................................................26
FIGURE 2.10 - PERFORMANCE OBJECTIVES ..............................................30
FIGURE 2.11 – QUALITY MEANS DIFFERENT THINGS IN DIFFERENT
OPERATIONS. .................................................................................................31
FIGURE 3.1 - CORPORATE ORGANISATIONAL CHART ..............................38
FIGURE 3.2 - REGIONAL ORGANISATIONAL CHART...................................39
TABLE 3.1 - ZULULAND COASTAL FIRES AND LOSSES .........................42
TABLE 3.2 - ZULULAND INLAND FIRES AND LOSSES ..............................43
FIGURE 3.3 - ELEMENTS OF THE FIREHAWK SYSTEM ..............................45
TABLE 3.3 - FACTS ABOUT SACRAMENTO METROPOLITAN FIRE
DISTRICTS.......................................................................................................48
FIGURE 3.4 - SACRAMENTO METROPOLITAN FIRE DISTRICT ..................51
FIGURE 3.5 – PROPOSED NEW STRUCTURE OF METROPOLITAN POLICE
DEPARTMENT .................................................................................................54
FIGURE 3.6 – PROPOSED ROLE STRUCTURE OF METROPOLITAN
POLICE DEPARTMENT ...................................................................................57
TABLE 4.1: An Extract from the Questionnaire................................................64
TABLE 4.2: An Extract from the Questionnaire (continued).............................64
TABLE 4.3: An Extract from the Questionnaire (continued).............................65
TABLE 4.4: An Extract from the Questionnaire (continued).............................65
TABLE 5.1 – EMERGENCY CALLS ATTENDED ANNUALLY .........................69
TABLE 5.2 – FIRE STATIONS, SUB-STATIONS AND CONTROL ROOMS....71
Page 14
xiv
TABLE 5.3 – MUNICIPAL TOTAL OPERATING EXPENDITURE AND FIRE
SERVICES OPERATING EXPENDITURE .......................................................72
TABLE 5.4 – EDM OPERATIONAL MANPOWER PROFILE ...........................74
TABLE 6.1 – REGIONAL VEGETATION FEATURES. .....................................80
TABLE 6.2 – THE EDM DEMOGRAPHICS ......................................................81
FIGURE 6.1 - MAP OF THE EDM AREA………………………………………….83
TABLE 6.3 - MAIN URBAN CENTRES AND SETTLEMENTS IN THE EDM....84
TABLE 6.4 - TOWN DISTRIBUTION AND TRAVEL DISTANCES IN THE EDM
..........................................................................................................................85
TABLE 6.5 – ASSESSMENT OF FUNCTIONAL EFFECTIVENESS................87
TABLE 6.6 – RESOURCE ASSESSMENT FOR STRUCTURE FIRES............88
TABLE 6.7 – MAIN FIRE FIGHTING RESOURCES IN THE EDM ...................90
TABLE 7.1 - TOTAL MANPOWER STATISTICS..............................................96
TABLE 7.2 - IDENTIFICATION OF THE THREE GEOGRAPHICAL AREAS ...96
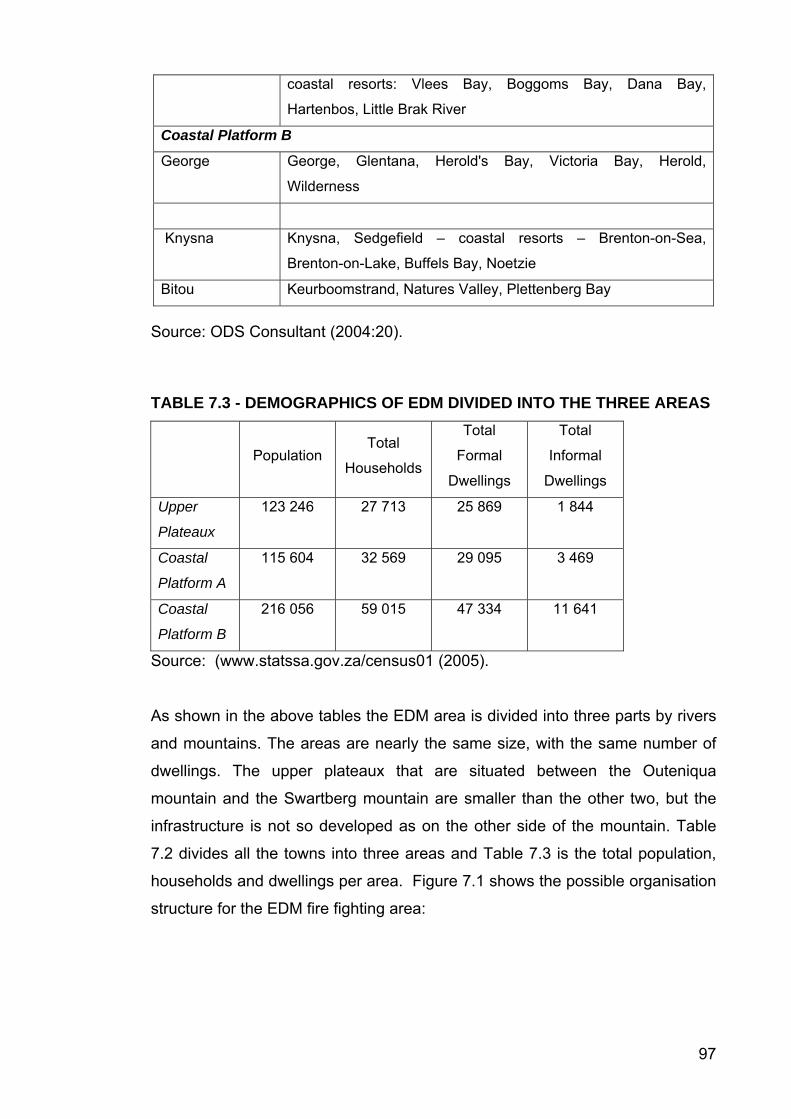
TABLE 7.3 - DEMOGRAPHICS OF EDM DIVIDED INTO THE THREE AREAS
..........................................................................................................................97
FIGURE 7.1 - GEOGRAPHIC ORGANISATIONAL STRUCTURE OF EDM
AREA ................................................................................................................98
FIGURE 7.2 – REGIONAL COMMANDER COASTAL PLATEAUX A ..............98
TABLE 7.4 – SUPPLY-SIDE FACTORS AND THEIR IMPLICATIONS ..........102
TABLE 7.5 – DEMAND-SIDE FACTORS AND THEIR IMPLICATIONS .........103
TABLE 7.6 – MAIN FIRE FIGHTING RESOURCES IN THE EDM .................105
Page 15
1
CHAPTER 1
INTRODUCTION, PROBLEM STATEMENT AND OUTLINE OF RESEARCH PROJECT
1.1 INTRODUCTION
Perhaps the greatest change evident in the way that public services will look
from a perspective of twenty years hence is that there is likely to be a much
more logical and end-user focused approach to the way in which organisations
operate. The current model, which typically sees a split of provision and
responsibility across national, regional and sometimes local boundaries, is
going to be challenged, possibly to the point of extinction (Milner, 2000:177).
Efficient and effective public services are an essential part of a healthy
democratic society. Many local authorities recognise this and successfully
achieve high standards, often in difficult circumstances. A fire service forms part
of all the public services that a local authority can provide. The importance of a
fire service is realised when disaster strikes. That is when a municipality must
demonstrate what resources are available to the fire services and what can be
achieved within the resources that are available (Johnson & Scholes; 2002:31).
Obeng (1997:198) states that you can find new ways of delivering old needs, as
one already knows who the customers are, where they are and what colour
underpants they wear. It is all out there for the taking, but the real barrier is in
your imagination. To be able to go virtual you will need to redraw your mental
maps. The opportunity is there but to convince people to redraw their mental
maps will be a large task.
Management formulates strategic goals and objectives which the total
organisation will seek to obtain. Swanepoel, Erasmus, Van Wyk and Schenk
(2000:87) define three different possible strategies, namely Corporate strategy
determines what types or areas of business it would be best to get involved in.
Business strategy on the other hand, is the decisions and practices concerned
Page 16
2
with how to complete and achieve success in these particular industries or
sectors. Functional strategy refers to the strategies relating to the various
functional areas such as marketing, public relations, operations and human
resources.
Structuring the flow of work also involves decisions about how the organisation
as a whole is to be structured. There are many ways to structure an
organisation. Typically, the pyramid-shaped structure (bureaucratic) consists of
a hierarchy of many different levels. Variables that influence design of a
structure are as follows: configuration, formalisation, standardisation,
specialisation and centralisation. The explosive growth in computing power and
networks, including the Internet, is turning organisations into networked
enterprises. Information can be distributed within and beyond the organisation.
This capability can be used to redesign and reshape organisations,
transforming their structure, scope of operations, reporting and control
mechanisms, work practices, works flows, products and services. Information
systems can reduce the number of levels in an organisation, giving a flatter
organisational structure that will provide managers with information to supervise
large numbers of workers and giving lower-level employees more decision-
making authority.
Every person’s knowledge is relatively unique.
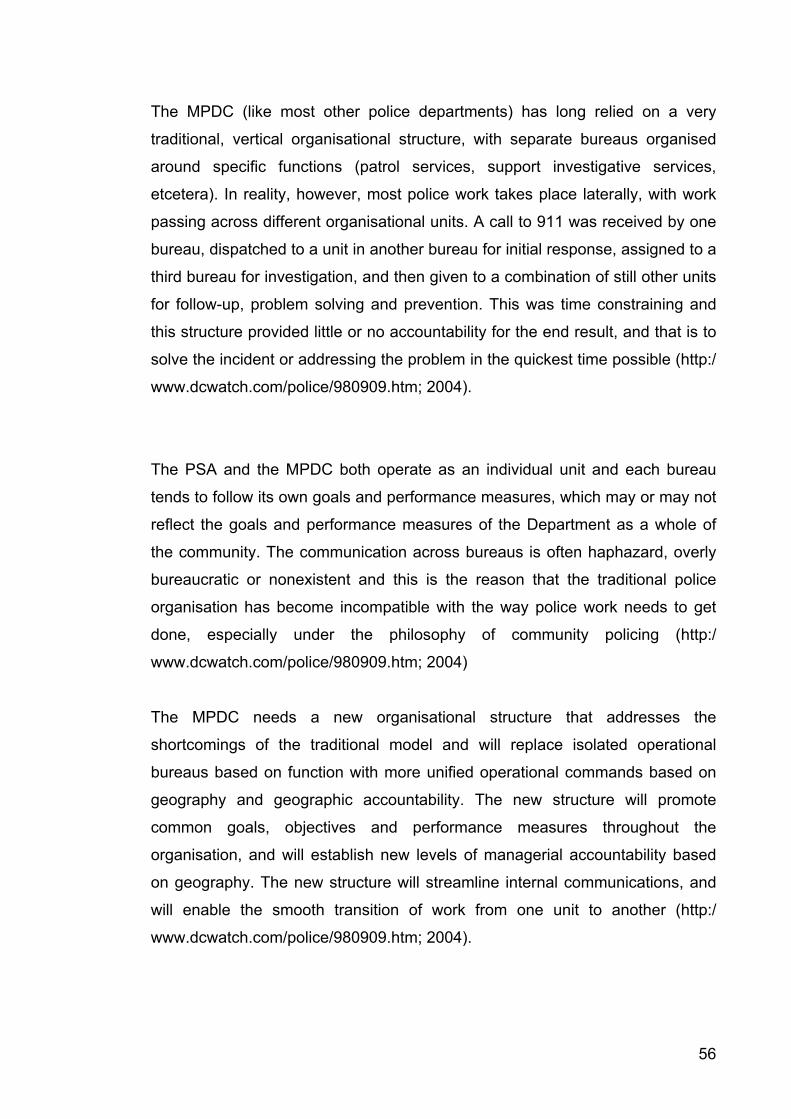
1.2 MAIN PROBLEM The main problem that was researched in this project is as follows:
How can an effective fire service operational structure be implemented in the Eden District Municipality Area?
1.3 SUB-PROBLEMS The main problem was resolved by addressing the following sub-problems:
• How do regional fire fighting services ideally operate?
• What viewpoints do knowledgeable people have about an operational
structure for a fire fighting service does it operate and how?
• How can the current fire fighting services be improved?
Page 17
3
• What is the risk profile and capacity of current fire fighting services in the
Eden District Municipality (EDM) area? 1.4 DELIMITATION OF THE RESEARCH 1.4 .1 Demarcation of Organisations to be researched The scope of the research was limited to the Southern Cape and Klein Karoo
region.
1.4.2 Geographic demarcation The Eden District Municipality (EDM) covers the Garden Route area and also
includes the Klein Karoo. The boundaries are from Storms River in the east to
Swellendam in the west and the Swartberg Mountains in the north. The EDM
covers a very big area with seven big municipalities to consider and work with.
Communication is primarily conducted via a multitude of meetings.
1.5 DEFINITIONS OF KEY TERMS To ensure common understanding, certain key terms used throughout the study
are defined below.
1.5.1 The Fire Fighting Service Each of the seven municipalities has a fire department. The organisational
structures of each fire department differ from one another.
Apart from the municipalities there are other groups that also maintain some
kind of fire fighting service. They are:
• Working For Fire,
• Nature conservation,
• Forestry,
• Farmers,
• PetroSA..
Page 18
4
1.5.2 Demarcation During July 1998 wall-to-wall municipalities were created with the demarcation
of the municipalities as per Local Government Municipal Demarcation Act [No.
27 of 1998]. Rural areas were thereby included in greater municipal boundary.
Previously the rural areas had been serviced by the District Councils.
1.5.3 Benchmarking Laudon and Laudon (2002:315) define benchmarking as measuring
performance against external industry standards, i.e. standards set by other
companies, or internally developed high standards, or some combination of the
two.
1.5.4 Unique features of an organisation No two organisations are identical, although all organisations have common
characteristics. Organisations differ in structure or shape, goals, constituencies,
leadership styles, tasks and surrounding environments. Organisations are open
to and dependent on the social and physical environment that surrounds them,
and they have a reciprocal relationship with the environment. Organisations
must respond to legislative and other requirements imposed by the government
and they can form alliances with others to influence the political process. New
government regulations put pressure on any organisation’s culture, politics and
people. Most organisations do not cope with large environmental shifts and fail
to adapt to a rapidly changing environment and a lack of resources (Laudon &
Laudon; 2002:72).
1.5.5 Efficiency According to Robbins (1998:23), efficiency is the ratio of effective output to the
input required to achieve it. When a hospital for example meets the needs of its
clientele successfully, it is effective, but it is efficient when the hospital can do
so at a low cost.
Inputs can be identified as labour, land and capital. Efficiency is achieved by
minimizing input and maximizing productive outputs (Hellriegel, Jackson,
Slocum, Staude & Associates; 2001:130).
Page 19
5
1.5.6 Configuration An organisation’s configuration consists of the structures, processes,
relationships and boundaries through which the organisation operates (Johnson
& Scholes; 2002:398).
1.5.7 Stakeholders Useful classifications of the performance objectives which any operation might
pursue can be gained by identifying the operation stakeholders. Slack,
Chambers and Johnston (2001:43) state that stakeholders are the people and
groups of people who have an interest in the operation and who may be
influenced or can influence the operation’s activities.
Stakeholders can also be identified as internal or external. Internal stakeholders
are identified as the operation’s employees and the external stakeholders are
the society or community groups and the company’s shareholders. External
stakeholders can have a direct commercial relationship with the company by
means of the company’s value chain.
In government departments, who are non-profit organisations, stakeholders can
overlap; they can be “shareholders” of a public service agency as well as their
main customer.
1.5.8 The five performance objectives In order to be more competitive, there are objectives that will contribute to
achieve the goals. The five basic performance objectives can be applied to all
types of operations. The following five objectives can be applied to achieve
greater competitiveness:
• To do things right → quality objective,
• To do things first → speed objective,
• To do things on time → dependability,
• To make changes where necessary → flexibility,
• To do things cheaply → cost objective (Slack et al., 2001:49).
Page 20
6
1.6 IMPORTANCE OF THE RESEARCH The production of goods and the delivery of services at market-related costs,
while still allowing for a return to the organisation or a non-for-profit
organisation, give good value for money to the taxpayers or whoever is funding
the operation. Cost is the major operation objective. The lower the cost of
producing services or goods, the lower the price to customers.
An operation will spend its money on staff, facilities, technology, equipment cost
and material costs. Comparing the cost structure of different operations is not
always straightforward and depends on how costs are categorized. Costs can
be categorized as fixed costs and variable costs. Cost is affected by the other
performance objectives:
• High-quality operations do not waste time or effort having to re-do things,
• Fast operations reduce the level of in-process inventory between micro
operations.
• Organised operations reduce administrative overheads.
• Dependable operations do not spring any unwelcome surprises on their
internal customers.
• Flexible operations adapt to changing circumstances quickly and without
disrupting the rest of the operation. Flexible micro operations can also
change over between tasks quickly and without wasting time and capacity.
The cost factor is only one of the reasons why it was important to do this
research. The current situation in the EDM is that the seven big municipalities
have a fully functional fire fighting service that only services areas within the old
municipal boundaries, while the District Council is still responsible for the rural
areas. This situation is due to the functions relating to the Municipal Structures
Amendment Act (Act 33 of 2000) that are not clearly divided between the
municipalities and the District Councils. In the meantime the taxpayers are
paying for a very expensive fire fighting service, or getting no service at all.
The geography and climate in the region require various fire fighting
management strategies. Each area has to cope with a different fire hazard in
the various seasons. There are forests, mountains, the Karoo and the south
Page 21
7
western districts. Resources must be managed in such a way that all the
different situations are catered for, and managed as cost effectively as possible.
1.7 RESEARCH DESIGN In this section the methodology followed in the research project is described. In
conducting the research the subsequent procedure was espoused to solve the
main problem as well as the sub-problems.
1.7.1 Literature Study A literature study was conducted to identify key factors leading to successes in
strategic fire fighting decisions. It was also necessary to determine which would
be more viable: the larger, regional fire fighting service, or whether it would be
more beneficial to retain the status quo. These key factors were compared to
the current situation as well as the creation of a regional fire fighting service.
Literature was obtained from the libraries of the Nelson Mandela Metropolitan
University, Municipalities in Eden District Municipal area and the Internet.
1.7.2 Empirical study The empirical study consists of:
1.7.2.1 Measuring Instruments a.) Case study – Data from case studies on the functioning of different
existing fire fighting services were collected and analysed. The aim of
investigating these case studies, as well as the subsequent interviews,
was to quantify what knowledgeable people believed are the
requirements or strategies for a regional fire fighting service, and to
obtain an inventory of equipment and skills.
b.) Interviews - Personal as well as telephonic interviews were conducted
with selected employees of stakeholders. The main objective of the
interviews was to obtain information regarding the status of the fire
fighting services in the EDM area. A questionnaire was completed by the
interviewees.
Page 22
8
1.7.2.2 Sample The sample was restricted to the seven big municipalities in the Eden District
municipal area. These seven municipalities are:
• Langeberg,
• Mosselbay,
• George,
• Knysna,
• Bitou,
• Demarcation Area (DMA),
• Oudtshoorn.
1.7.2.3 Statistical analysis of data Analysis of the data was done by following the following steps:
• Organisation of detail about the case,
• Categorisation of data,
• Interpretation of single instances,
• Identification of patterns, and
• Synthesis and generalization (Leedy, Ormrod; 2001:150).
1.8 DATABASES Research publications and relevant statistical data of governmental agencies,
municipals and other stakeholders were accessed to obtain information on
trends in fire fighting structures. These trends were used as a guideline for the
strategic development process.
1.9 LITERATURE OVERVIEW In an attempt to resolve the main and sub-problems, a literature study was
undertaken. The sub-problems were matched to some literature, although sub-
sections of the sub-problems had to be researched as well.
What method(s) could be used to analyse the ideal fire fighting service?
To address this sub-problem, the current situation was analysed by means of a
case study and interviews. Kreitner, Kinicki and Buelens (2002:24) define a
case study as an in-depth study of a single person, group or organisation. The
Page 23
9
methods of data collection of case studies are observations, interviews and
appropriate written documents and/or audiovisual material (Leedy; 2001:157)
Clark (1998:28) defines knowledge as the understanding of why and how
something works, for example, how and why the customer reaches a decision
to purchase a product or to hire a service. Knowledge is generally related to the
level of education of a person. Although it is something that has to be taught, it
does not necessarily have to be taught in schools or universities, it can also be
acquired by field training. It is important to note that knowledge does not have to
be of an academic nature.
Brewster, Dowling, Grobler, Holland and Wärnich (2000:136) classify business
knowledge into various categories:
• Advantaged knowledge is knowledge that does or can provide competitive
advantage for the company.
• Base knowledge forms an integral part of the business, e.g. best practices.
This provides only a short-term advantage.
• Trivial knowledge has no major impact on the company.
The dilemma for organisations is how to turn individual knowledge into a
corporate resource and asset. Knowledge creates the capacity to act and is an
individual human activity. It is created at the moment of interpretation and
resides in the heads of individuals, staff, customers, suppliers and competitors.
Every person’s knowledge is relatively unique.
How to improve the current situation?
Strategic management is the process of examining both the present and future
environments, formulating the organisation’s objectives and making,
implementing and controlling decisions focused on achieving these objectives in
the present and future environments (Swanepoel, Erasmus, Van Wyk &
Schenk; 2000:202).
Perhaps the greatest change evident in the way that public services will look
from a perspective of twenty years hence, is that there is likely to be a much
more logical and end-user focused approach to the way in which organisations
Page 24
10
operate. The current model, which typically sees a split of provision and
responsibility across national, regional and sometimes local boundaries, is
going to be challenged, possibly to the point of extinction (Milner; 2000:177).
What influence does the geographic demarcation have on the fire fighting
service?
Historic data such as rainfall patterns, temperatures during different seasons
and link to a fire call out, the number of call outs and the kind of call outs as well
as the duration of the service rendering and the location of the call out are
important. This survey was done in both municipal and rural areas.
1.10 OUTLINE OF CHAPTERS The study is presented as follows:
• Chapter 1 - The introduction to and overview of the research thesis.
• Chapter 2 - Organisational structure and location of capacity.
• Chapter 3 - Benchmarking
• Chapter 4 - Design of the empirical study
• Chapter 5 - Results and analysis of the empirical study
• Chapter 6 - Risk profile and capacity analysis
• Chapter 7 - Summary and conclusion.
• References - List of references
• Annexure - Questionnaire
Page 25
11
CHAPTER 2
ORGANISATIONAL STRUCTURES AND LOCATION OF CAPACITY
2.1 INTRODUCTION
“Come and visit the Garden Route, it is a taste of Eden and we all are crazy
about Eden.” These words of former Mayor, Mr. A Lamont, best describe the
area. The Eden District Municipality (EDM), situated on the Garden Route,
includes the Klein Karoo. The boundaries are from Storms River in the east to
Swellendam in the west and the Swartberg Mountains in the north.
The EDM is a local authority. The corporate strategy is to maximise income and
the business strategy is to take up all the functions being given the authority to
by law for example, to supply water, sewerage and fire fighting, tourism and
health services.
The organisational structure of EDM is the typical pyramid-shape. Management
comprises the top three levels of the organisational structure and the number of
levels downward depends on the function of the different departments. Even the
merge with Klein Karoo District Municipality did not alter the structure.
Specialisation is the only factor that distinguishes one department from the
other, for example Finance and the Fire Department.
The EDM consists of five departments, namely Finance, Corporative Services,
Community Services, Roads and Economic Development and Tourism. The
Fire Department is part of the Community Services Department. The fire
department is a necessity, but unfortunately this service is expensive. A current
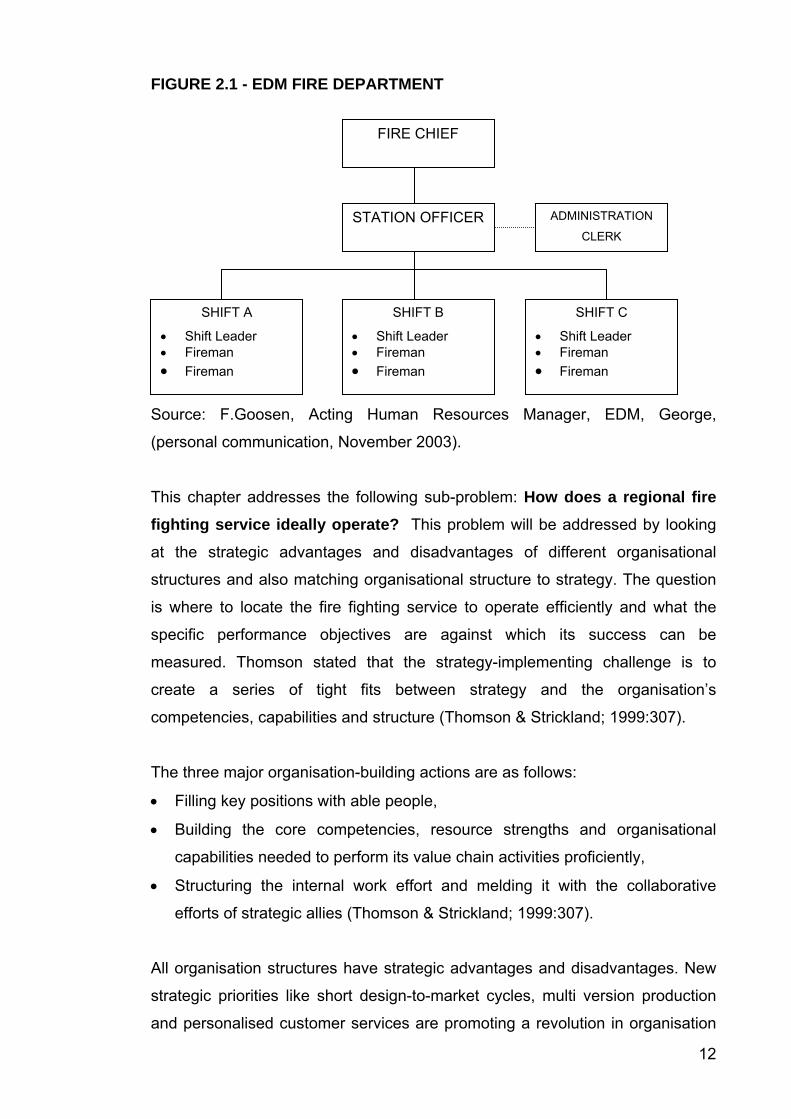
organisational structure of the EDM fire department is presented in figure 2.1.
Page 26
12
FIGURE 2.1 - EDM FIRE DEPARTMENT
Source: F.Goosen, Acting Human Resources Manager, EDM, George,
(personal communication, November 2003).
This chapter addresses the following sub-problem: How does a regional fire fighting service ideally operate? This problem will be addressed by looking
at the strategic advantages and disadvantages of different organisational
structures and also matching organisational structure to strategy. The question
is where to locate the fire fighting service to operate efficiently and what the
specific performance objectives are against which its success can be
measured. Thomson stated that the strategy-implementing challenge is to
create a series of tight fits between strategy and the organisation’s
competencies, capabilities and structure (Thomson & Strickland; 1999:307).
The three major organisation-building actions are as follows:
• Filling key positions with able people,
• Building the core competencies, resource strengths and organisational
capabilities needed to perform its value chain activities proficiently,
• Structuring the internal work effort and melding it with the collaborative
efforts of strategic allies (Thomson & Strickland; 1999:307).
All organisation structures have strategic advantages and disadvantages. New
strategic priorities like short design-to-market cycles, multi version production
and personalised customer services are promoting a revolution in organisation
FIRE CHIEF
STATION OFFICER ADMINISTRATION
CLERK
SHIFT A
• Shift Leader • Fireman • Fireman
SHIFT B
• Shift Leader • Fireman • Fireman
SHIFT C
• Shift Leader • Fireman • Fireman
Page 27
13
building featuring lean, flat, horizontal structures that are responsive and
innovative (Thomson & Strickland;1999:309).
Advances in information technology have made it possible for organisations to
focus on their core competencies. However traditional hierarchical design with
its top-down command structure is not totally obsolete. It is still necessary to
cope with routine functions, although it cannot be expected to deal with strategic
issues (Schultz, Bagraim, Potgieter, Viedge & Werner, 2003:236).
2.2 ORGANISATION CHARTS
Organisation theorists have many definitions for an organisation structure, but
the four common factors in all organisations are:
• Co-ordination of effort,
• A common goal,
• Division of labour,
• Hierarchy of authority (Kreitner et al., 2002:508).
The co-ordination of effort is achieved through formulation and enforcement of
policies, rules and regulations. Division of labour occurs where individuals
perform different tasks but want to achieve the same goal (common goal).
Making sure that the right people do the right things at the right time is called
the hierarchy of authority or chain of command. Keeping al these factors in
mind, an organisation chart can be defined as a graphic illustration showing
chain of formal authority and division of labour (Kreitner et al., 2002:509).
John Child proposed a strategic choice model that was based on behavioural
rather than on rational economic principles. This model resulted from a political
process involving organisational power holders. This model, as a model of
organisational structure, is determined largely by a dominant coalition of top
management strategists (Kreitner et al., 2002:528).
Page 28
14
FIGURE 2.2 THE RELATIONSHIP BETWEEN STRATEGIC CHOICE AND THE ORGANISATIONAL STRUCTURE
Source: Kreitner et al. (2002:528).
Figure 2.2 illustrates that specific strategic choices or decisions reflect how the
dominant coalition perceives environmental constraints and the organisation’s
objectives. The personal beliefs, attitudes, values and ethics of decision makers
are used to temper strategic choices. This theory directs our attention that an
organisation is structured to accommodate its mix of strategies. Therefore
corrective action must be taken if the organisation effectiveness criteria are not
met. The strategic choice theory and research teach managers two practical
lessons;
• The environment is just one of many determinants of structure;
• The design is subject to the interplays of personal power and politics,
(Kreitner et al., 2002:529).
Different organisations have different problems: an organisation that provides
goods or services in an environment with slow technological innovation and
relatively few competitors differs from an organisation in a growing, changing
and highly competitive market where there is a lot of uncertainty. Relative
Organisational
Objectives
Strategic
decisions
made by
dominant
Decision
makers’
personal
beliefs
Environmental
constraints Organisational
structure
Organisational
effectiveness
Organisational
strategies
Corrective action
• Target markets • Capital
sources/uses • Human
resources • Technology
• Total quality management
Page 29
15
stability in an organisation’s environment has major implications for its strategy
and structure. Firms operate in stable and changing environments and therefore
some functions may undergo little structural changes and others may change
considerably (Hellriegel et al., 2001:223).
2.3 DIFFERENT TYPES OF ORGANISATIONS The movement towards tighter and leaner organisations has drawn attention to
the importance of alternative forms of structure and has placed increased
emphasis on the demand for flexibility. Due to the revolutionary changes in
organisations, the need is great for new and flexible structures. The age of the
Internet and e-commerce demands adaptations of new organisational
architectures.
Hellriegel et al. (2001:202) conclude that organisational structures help
employees work together effectively by:
o Assigning human and other resources to tasks,
o Clarifying the responsibilities of employees and how their efforts should
mesh through job description, organisational charts and line of authority,
o Informing employees about the rules, operating procedures and
performance standards,
o Establishing procedures for collecting and evaluating information to help
management to make decisions and solve problems.
To be able to create an organisational structure for the EDM fire-fighting
service, it is important to investigate what the different structures in the
organisation are.
The following structures will be discussed:
• Bureaucratic organisation,
• Flat organisation,
• Network organisation,
• Virtual organisation,
• Geographic structure.
Page 30
16
2.3.1 Bureaucratic Organisational Structure
Swanepoel et al. (2000:244) define the bureaucratic organisational structure as
a structure that results from what is known as the mechanistic approach to
organisation design. Robbins (1989:489) states that the primary strength of the
bureaucracy lies in its ability to perform standardised activities in a highly
efficient manner. There is little need for innovative and experienced decision
makers below the level of senior executives. The peak of a bureaucracy’s
popularity was probably in the 1950’s and 1960’s. Firms such as IBM and
General Electric were organised as a bureaucracy. Although this structure is
currently out of fashion, the majority of large organisations still take on basic
bureaucratic characteristics, particularly specialisation and high formalisation
organisations.
The span of control has generally been widened, authority has become more
decentralised and the functional departments have been supplemented with an
increased use of teams (Robbins; 1989:490).
Characteristics of a bureaucratic organisation are:
• Emphasising the importance of achieving high levels of production,
• Efficiency through extensive use of rules and procedures,
• Centralised authority,
• High specialisation of labour,
• Tall pyramid-shape structure with a hierarchy of many levels,
• Top-down, “command-and-control”, military-like structure,
• Emphasis is placed on departmentalisation,
• Work is often structure in rigid functional work units, with definite boundaries
between different jobs, sections, departments, divisions and other word units
(Swanepoel et al., 2000:244).
Figure 2.3 is an example of a bureaucratic organisation structure.
Page 31
17
FIGURE 2.3 BUREAUCRATIC ORGANISATION STRUCTURE
Source: Swanepoel et al. (2000:245).
2.3.2 Flat Organisation Structure Swanepoel et al. (2000:244) state that a flat structure is essentially the result of
following the organic model or approach to organisation design. Characteristics
of a flat organisation structure are:
• Importance of high levels of adaptiveness, responsiveness and development
through limiting the use of rules, regulations and procedures,
• Decentralisation of authority,
• Lower degrees of specialisation,
• Wide spans of control,
• Jobs are more broadly defined with greater overlaps and flexible boundaries
between different word units,
• Teams are part of flat structures (Swanepoel et al., 2000:245).
Figure 2.4 is a graphic illustration of a flat organisational structure.
Page 32
18
FIGURE 2.4 FLAT ORGANISATION
Source: Swanepoel et al. (2000:245)
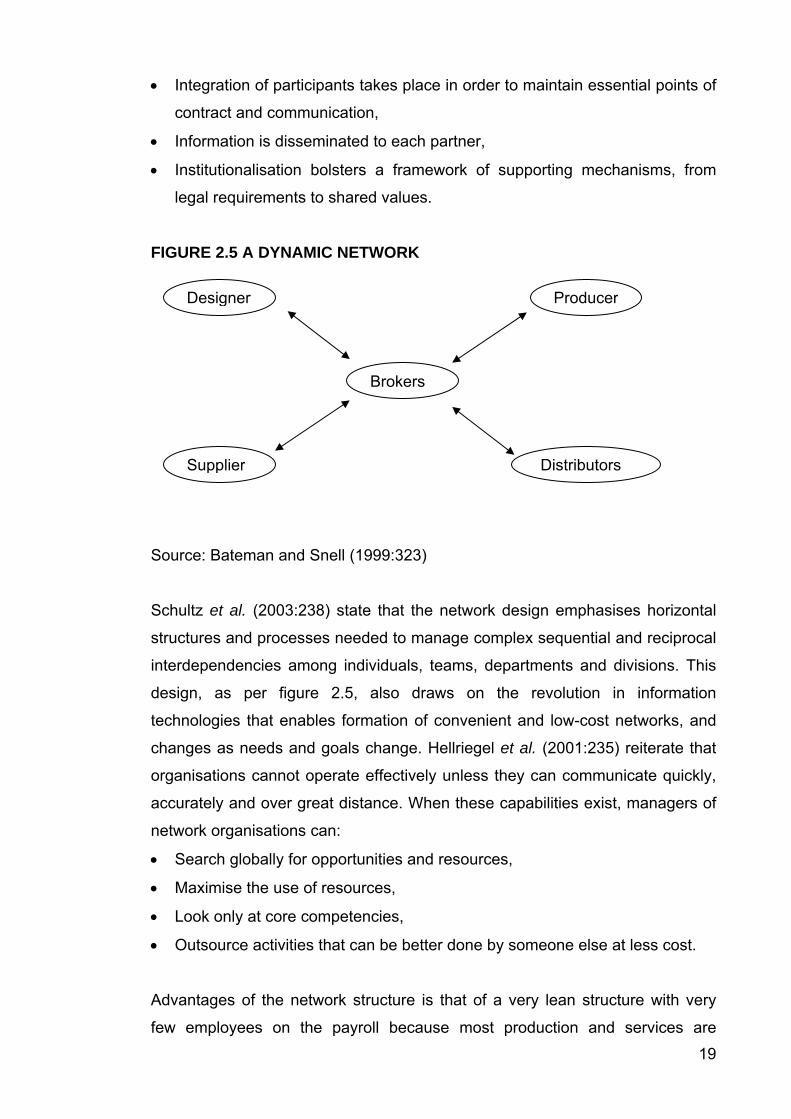
2.3.3 Network Organisation
The network structure blends traditional management concepts by the
exchange of agreements. The structure relies heavily on outsourcing and
contracting out. This gives companies the opportunity to downsize to their core
areas of competence and establish alliances with independent suppliers and
distributors. This structure is based on cooperative, multidisciplinary teams and
business networks across the enterprise with a modular or virtual organisation
structure (Swanepoel et al., 2000:246).
Bateman and Snell (1999:322) define a network organisation not as one
organisation, but as a web of interrelationships among many firms with flexible
arrangements among designers, suppliers, producers, distributors and
customers. Each firm is able to pursue their own distinctive competence. The
role of managers shifts in a network from that of command and control to more
like broker. The broker assembles and coordinates participants in a network
and plays a designer, process engineering and nurturing role to make certain
the relationships are healthy and mutually beneficial. Schultz, Bagraim,
Potgieter, Viedge and Werner (2003:238) are of the opinion that to create
successful external relationships, the six “I’s” can be effective in creating
alliances of flexible partnerships:
• Importance of relationships is stressed,
• Investment in the form of financial resources, management attention and
sponsorship,
• Interdependence of participants helps maintain the balance of power,
Page 33
19
• Integration of participants takes place in order to maintain essential points of
contract and communication,
• Information is disseminated to each partner,
• Institutionalisation bolsters a framework of supporting mechanisms, from
legal requirements to shared values.
FIGURE 2.5 A DYNAMIC NETWORK
Source: Bateman and Snell (1999:323)
Schultz et al. (2003:238) state that the network design emphasises horizontal
structures and processes needed to manage complex sequential and reciprocal
interdependencies among individuals, teams, departments and divisions. This
design, as per figure 2.5, also draws on the revolution in information
technologies that enables formation of convenient and low-cost networks, and
changes as needs and goals change. Hellriegel et al. (2001:235) reiterate that
organisations cannot operate effectively unless they can communicate quickly,
accurately and over great distance. When these capabilities exist, managers of
network organisations can:
• Search globally for opportunities and resources,
• Maximise the use of resources,
• Look only at core competencies,
• Outsource activities that can be better done by someone else at less cost.
Advantages of the network structure is that of a very lean structure with very
few employees on the payroll because most production and services are
Designer Producer
Distributors
Brokers
Supplier
Page 34
20
contracted for and coordinated by means of vertical information processing
systems. Workforce is flexible and challenges are because employees are
contractors who respond to changing tasks and new demands. Some networks
organisations preserve highly specialised teams (Hellriegel et al., 2001:236).
Successful networks potentially offer flexibility, innovation, quick responses to
threats and opportunities, and reduced cost and risk. But for these
arrangements to be successful, several things must occur:
• The firm must choose the right specialty,
• The firm must choose collaborators that are also excellent at what they do
and that provide complementary strengths,
• The firm must make certain that all parties fully understand the strategic
goals of the partnership,
• Each party must be able to trust the others with strategic information and
also trust that each collaborator will deliver quality products (Bateman and
Snell; 1999:323).
The most prominent disadvantages of a network structure are that the
managers have very little control, operations are not under one roof and
managers must rely on independent contractors and subcontractors to do the
work. Contractors can make mistakes and not report them, which results in
mistrust. Defining the organisation is very difficult due to the continuous
changes that are taking place. The frequent change of contractors has the
effect that new relationships must be built every time a contractor changes. The
relationship building takes time and is a money consumer due to the frequency.
Commitment to the organisation is low because employees tend to be
committed to the contractor that employs them (Hellriegel et al., 2001:236).
2.3.4 The Virtual Organisation
A key effect of information and communications technologies such as the
Internet is an increase of virtualisation in business activities and ways of
working. Virtualisation overcomes constraints of time and distance.
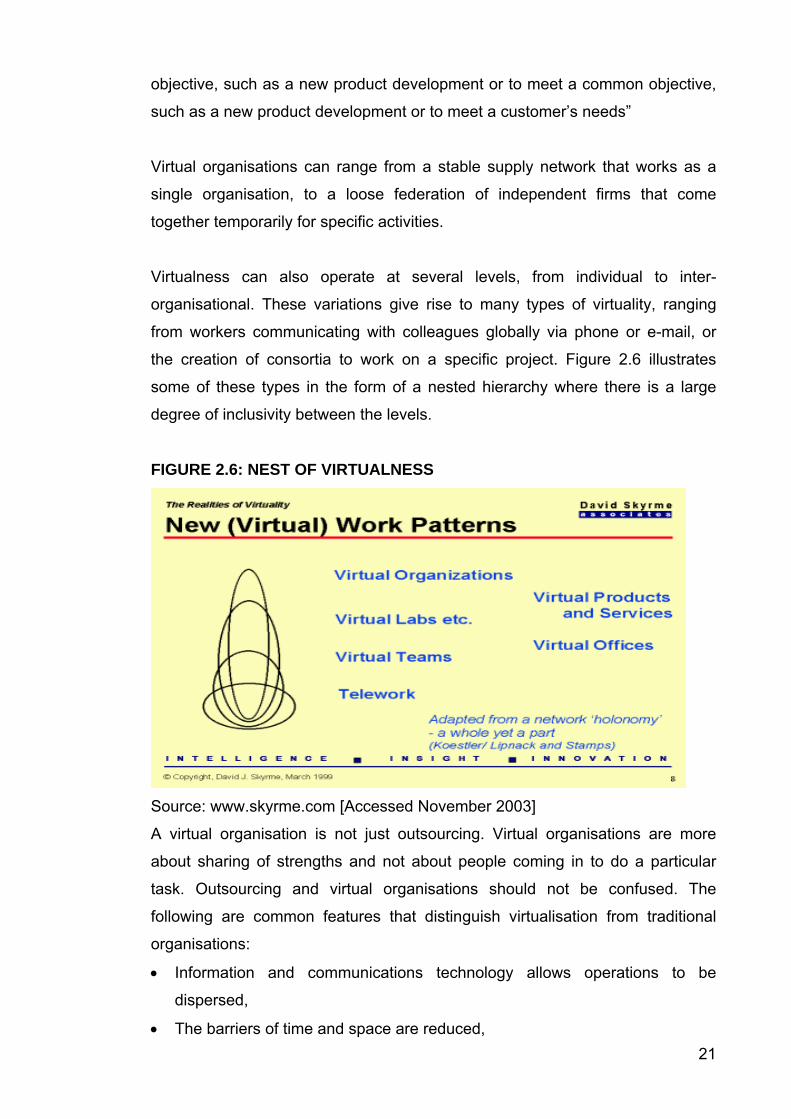
Skyrme (1999:20) defines the virtual corporation as “a temporary network of
independent companies that co-ordinates activities to meet a common
Page 35
21
objective, such as a new product development or to meet a common objective,
such as a new product development or to meet a customer’s needs”
Virtual organisations can range from a stable supply network that works as a
single organisation, to a loose federation of independent firms that come
together temporarily for specific activities.
Virtualness can also operate at several levels, from individual to inter-
organisational. These variations give rise to many types of virtuality, ranging
from workers communicating with colleagues globally via phone or e-mail, or
the creation of consortia to work on a specific project. Figure 2.6 illustrates
some of these types in the form of a nested hierarchy where there is a large
degree of inclusivity between the levels.
FIGURE 2.6: NEST OF VIRTUALNESS
Source: www.skyrme.com [Accessed November 2003]
A virtual organisation is not just outsourcing. Virtual organisations are more
about sharing of strengths and not about people coming in to do a particular
task. Outsourcing and virtual organisations should not be confused. The
following are common features that distinguish virtualisation from traditional
organisations:
• Information and communications technology allows operations to be
dispersed,
• The barriers of time and space are reduced,
Page 36
22
• Organisational structures are network-like and more dynamic,
• The interface with customers and markets is different,
• Employees and associates (business partners, suppliers, customers) adopt
new patterns of work,
• The locus of knowledge is diffused. It is not necessary in a specific place,
• Relationships not as bureaucratic,
• Company can be virtual and real, http://www.emporia.edu/ (2002).
The virtual organisation holds a number of important challenges for the future.
Brewster, Dowling, Grobler, Holland and Wärnich (2000:211) say that issues
such as effective communication and planning will need attention, as the face-
to-face approaches which have worked well over the years will disappear. In
addition, to capitalise on the flexibility and speed that are possible through these
networks, managers and team members will have to form clear agreements
from the outset regarding issues such as performance expectations, team
priorities, communication links and resource allocation.
Robbins (1989:493) states that the virtual organisation is highly centralised with
little or no departmentalisation. The only primary drawback to this structure is
that it reduces management’s control over key parts of its business.
“Commitment, trust and loyalty could erode badly if managers do not heed this caution by Charles Handy, the British management expert quoted earlier.” According to Handy: “A shared commitment still requires contact to make the commitment feel real’” (Kreitner et al., 2002:533).
2.3.5 Geographic Organisation
Thomson and Strickland (1999:291) define a geographic organisation as a
structure that suits firms well and that pursues different strategies in different
geographic regions. This organisation, which is organised on the basis of
geographic areas or territories, is a common structural form for enterprises
operating in diverse geographic markets or serving an expansive geographic
area. The main reason for its popularity is that it promotes improved
performance. In the public sector, such organisations as the U.S. Postal Service
and the Red Cross have adopted territorial structures in order to be directly
accessible to geographically dispersed clienteles.
Page 37
23
“The primary advantage of both the product and customer/regional approaches to departmentalisation is the ability to focus on customer needs and to provide faster, better service. But again, duplication of activities across many customer groups and geographic areas is expensive” (Bateman & Snell; 1999:292).
Hill (2004) has designed a geographical structure for a geographic organisation:
FIGURE 2.7 THE GEOGRAPHIC ORGANISATION STRUCTURE
Source:http://courses.bus.msu.edu/materials/1022/ch11a.ppt
Individual Stores
Page 38
24
FIGURE 2.8 - THE ADVANTAGES AND DISADVANTAGES OF A GEOGRAPHIC STRUCTURE
STRATEGIC ADVANTAGES STRATEGIC DISADVANTAGES
Allows tailoring of strategy to
needs of each geographical
market
Poses a problem of how much
geographic uniformity headquarters
should impose versus how much
geographic diversity should be
allowed
Delegates profit/loss
responsibility to lowest
strategic level
Greater difficulty in maintaining
consistent company image/reputation
from area to area when geographic
managers exercise much strategic
freedom
Improves functional
coordination within the target
market
Adds another layer of management to
run the geographic units
Takes advantage of economies
of local operations
Can result in duplication of staff
services at headquarters and
geographic levels, creating a cost
disadvantage
Regional units make an
excellent training ground for
higher level general managers
Source: Thomson and Strickland (1999:293)
2.4 THE LOCATION OF CAPACITY
Slack, Chambers and Johnston (2001:159) define location as the geographical
positioning of an operation relative to the input resources, other operations or
customers with which it interacts. Sometimes operations cannot logically justify
their location, as some are where they are for historical reasons. The decision
not to move is made on an assumption that the cost and disruption involved in
changing location would outweigh any potential benefits of a new location.
The retail industry knows what it means not to be at the right location. If the
location is wrong it can have a significant impact on profit. The location decision
Page 39
25
is also important in other types of operations. If a fire service station is
incorrectly located, it can slow down the average journey time of the fire crew in
getting to the fire. Therefore the location decision will usually have an effect on
an operation’s cost as well as on its ability to serve its customers. The decision
to relocate is very important due to the fact that moving an operation from one
site to another can be very expensive and the risks of inconveniencing
customers is very high and it is very difficult to undo or reverse.
There are two reasons for an organisation to make location decisions. Firstly,
these changes may occur in response to a demand for goods and services that
can increase or decrease according to the aggregated volume of demand. For
example, the increase in call outs for fires in a certain region due to the lack of
rain and changing weather patterns can suggest that a fire station could open a
new station. Secondly, the changes in supply and availability of inputs to the
operation and the changes in cost are reasons for making the location decision,
for example the cost of fuel when travelling long distances to fire call outs
(Slack et al., 2001;159).
It is very important to achieve an appropriate balance between three related
objectives to make a location decision. These objectives are as follows:
• The spatially variable cost of the operation due to the variables that change
with the geographical location,
• The service the operation is able to provide to its customers,
• The revenue potential of the operation (Slack et al., 2001:161).
For organisations that are profit driven, the last two objectives are related. In
non-profit organisations like the public service, revenue potential might not be a
relevant objective and so cost and customer service are often taken as the twin
objectives of location. The decisions made about where to locate an operation
are concerned with minimizing spatially variable costs and maximizing revenue
and/or customer service. All types of organisation are affected by both variables
but not always equally for all organisations. For example, customers may not
care very much where the products are made and location is unlikely to affect
the operation’s revenues significantly. The cost of the operation will be greatly
Page 40
26
affected by the location. Services are both cost and revenue affected by
location (Slack et al., 2001:161).
Slack et al. (2001:161) also state that the location decision for any operation is
determined by the relative strength of supply-side and demand-side factors as
shown in figure 2.9.
FIGURE 2.9 - SUPPLY AND DEMAND: SIDE-FACTORS FOR LOCATION DECISIONS.
Source: Slack et al. (2001:161).
According to figure 2.9, the supply-side influences vary in such a way as to
influence cost as location varies. The following supply-side factors influence
location;
• Labour costs,
• Land costs,
• Energy costs,
• Transportation costs,
• Community factors.
Supply–side factors
Which can vary
in such ways as
to influence cost
The
Operation
Demand–side factors
Which can vary in
such ways as to
influence customer
• Labour Skills • Suitability of Site • Image • Convenience for
Customers (e.g. speed and dependability)
• Labour Costs • Land Costs • Energy Costs • Transportation Costs • Community Costs
Page 41
27
Labour costs are the costs of employing people with particular skills. Labour
cost can differ from area to area and also between different countries. These
costs include both direct wage costs and non-wage costs. Labour costs exert a
major influence on the location decision (Slack et al., 2001:161).
Land costs are the costs to acquire the site itself or to rent the site. If the site is
in a main street, the rent will be much higher than that for a site in a rural area
(Slack et al., 2001:162).
Energy costs are important for an operation that uses large amounts of energy,
such as aluminium melting which is directly dependent on the availability of
hydroelectric generation of energy in an area. This factor can influence a
location decision directly (Slack et al., 2001:162).
Transportation costs can be considered in two parts. One is the cost of
transporting inputs for their source to the site of operation. The other part of
transportation cost is the transporting of goods from the site to customers (Slack
et al., 2001:162).
Community factors are those that derive operation costs from the social,
political and economic environment of its site. Community factors can have a
direct influence on the profitability of an organisation, for example the taxes are
very high. These factors are as follows:
• Local tax rates,
• Capital movement restrictions,
• Government financial assistance,
• Government planning assistance,
• Political stability,
• Local attitudes to inward investments,
• Language,
• Local amenities (for example schools, theatres, shops),
• Availability of support services,
• History of labour relations and behaviour,
• Environmental restrictions and waste disposal,
• Planning procedures and restrictions (Slack et al., 2001:163).
Page 42
28
Demand-side factors can vary in such a way as to influence customer
service/revenue as location varies. The demand-side factor areas are as
follows;
• Labour skills,
• Suitability of site,
• Image,
• Convenience for customers (speed and dependability).
Labour skills are important as the ability of the local labour force can have an
effect on customer’s reaction to the products or services which the operation
produces (Slack et al., 2001:165).
The suitability of the site itself can affect an operation’s ability to serve
customers’ and generate revenue. For example, if a luxury hotel moves away
from a lovely beach with palm trees to an industrial estate, it will rapidly lose its
attraction and revenue collection will decrease (Slack et al., 2001:165).
The image of location is important due to the fact that some locations are firmly
associated in customers’ minds, for example the different images of a hospital
and a bank
Convenience for customers is the most important demand-side factor for many
operations. Hospitals are therefore located close to centres of demand.
Similarly with other public services, location has a significant effect on the ability
of an organisation to serve its customers effectively (Slack et al., 2001:165).
To assist managers in making a good judgement in a location decision, there
are two more techniques to help make this decision. These are the weight-score
method and the centre-of-gravity method.
2.5 THE FIVE PERFORMANCE OBJECTIVES
Useful classifications of the performance objectives are used to identify the
operation stakeholders. Slack et al. (2001:43) stated that stakeholders are the
Page 43
29
people and groups of people who have an interest in the operation and who
may be influenced or can influence the operation’s activities.
Stakeholders can also be identified as internal or external. Internal stakeholders
are identified as the operation’s employees and the external stakeholders are
the society or community groups and the company’s shareholders. External
stakeholders can have a direct commercial relationship with the company by
means of the company’s value chain. In government departments, who are a
non-profit organisations, stakeholders can overlap; they can be “shareholders”
of a public service agency as well as their main customer.
In order to be more competitive, there are objectives that will contribute to
achieve the goals. The five basic performance objectives can be applied to all
types of operations. These five objectives that will assist you to be more
competitive are:
• You want to do things right → quality objective,
• You want to do things first → speed objective,
• You want to do things on time → dependability,
• You want to make changes where necessary → flexibility,
• You want to do things cheaply → cost objective.
A graphic display of these objectives is given in figure 2.10.
Page 44
30
FIGURE 2.10 - PERFORMANCE OBJECTIVES
Source: Slack et al. (2001:57)
2.5.1 The Quality Objective Everyone strives for error-free or mistake-free services or goods that are “fit for
their purpose”. Quality means doing things right. Each operation has it own set
of tasks or procedures that needs to be done right. In some ways quality is the
most visible part of what an operation does. Good quality products and services
mean high customer satisfaction and therefore the likelihood that the customer
will return or use the service again. An example of what quality can be is given
in figure 2.11.
FLEXIBILITY
Frequent new products
Maximum choice
Ability to Change
COST
Minimum Price,
Highest Value
Minimum cost
Maximum value
DEPENDABILITY
Dependable
Delivery
Reliable
Operation
QUALITY
Error -free products
and services
Error-Free
Processes
SPEED
Quick
Delivery
Fast
Throughput
Page 45
31
FIGURE 2.11 – QUALITY MEANS DIFFERENT THINGS IN DIFFERENT OPERATIONS.
Quality could mean….
Source: Adapted from Slack et al. (2001:45).
Another way of qualifying quality is as follows:
• Quality inside the operation.
• Quality reduces cost. Fewer mistakes in micro operations will use less time
for corrections.
• Quality increases dependability. A supermarket cannot afford to run out of
stock, it will lose customers and also income due to the fact that the
customers will go and buy from the opposition.
2.5.2. The Speed Objective The time between a customer asking for goods or services and the time the
customer receives the goods or services must be kept to a minimum. Thus
increase the availability of goods or services. The faster a customer can receive
the goods or services, the more likely he or she will be to purchase them or use
it.
Speed can also be inside the operation if fast response to external customers is
made possible by fast decision-making and speedy movement of materials and
information inside the organisation. Speed also reduces the turn around time of
inventory, especially in manufacturing plants where the increase in demand
requires the increase in production. The effect thereof is that the shelf life of
HOSPITAL
• Patients receive the most appropriate treatment
• Treatment is carried out in the correct manner.
• Patients are consulted and kept informed.
AUTOMOBILE PLANT
• All parts are made to specification. • All assembly is to specification. • The product is reliable.
Page 46
32
inventory is kept to a minimum. Speed reduces risks. Forecasting tomorrow’s
events is far less of a risk than forecasting next year’s (Slack et al., 2001:49).
2.5.3. The Dependability Objective Giving the dependability advantage to the customer means that you are doing
things on time so as to keep the delivery promise you have given your
customers. Customers may judge the dependability of an operation after the
product or service has been delivered (Slack et al., 2001:50). No matter how
inexpensive the service is or the goods are or how fast it is advertised as being
available, if the service is always late or for example the buses are always full,
then the potential customer will seek service elsewhere.
An operation’s internal dependability is governed by the micro operations. The
elimination of dead time is a good example of increasing dependability. A
decrease in process cycle time can be achieved by means of excellent
scheduling of tasks and ensuring sufficient supply of the required resources
(Slack et al., 2001:50).
Ineffective use of time will translate into extra cost. Spare parts might cost more
to be delivered at short notice. Dependability gives stability. If everything in an
operation is perfectly dependable, a level of trust will have been built up
between the different sections/departments of the operation. Everything will be
more predictable and each section of the operation can concentrate on
improving its own area of responsibility without having its attention diverted to
other sections (Slack et al., 2001:51)
2.5.4 The Flexibility Objective Melnyk and Denzler (1996:206) state that flexibility of a process should be
evaluated by measuring the number of steps, since many steps usually inhibit
flexibility. Automation increases flexibility. Physical links move work-in-process
quickly from one activity to the next, but they also increase changeover time
between runs for different products.
Page 47
33
Flexibility is also able to change far enough and fast enough to meet customer
requirements. Customers will need the operation to change so that it can
provide four types of requirement:
• Product/service flexibility → different products and services,
• Mix flexibility → a wide range or mix of products and services,
• Volume flexibility → different quantities or volumes of products and
services,
• Delivery flexibility → different delivery times (Slack et al., 2001:51).
Developing a flexible operation can also have advantages to the organisation
itself. Flexibility speeds up response time due to the fact that operations can be
changed to handle special circumstances. Flexibility can also save time where
people are multi skilled and can adapt quickly from one task to another.
Flexibility maintains dependability. Operations can take place on schedule when
unexpected events disrupt the normal events (Slack et al., 2001:54).
2.5.5 The Cost Objective The production of goods and services at a cost which enables them to be priced
appropriately for the market while still allowing for a return to the organisation or
a non-for-profit organisation gives good value to the taxpayers or whoever is
funding the operation. Cost is the major operation objective. The lower the cost
of producing their services or goods, the lower is the price to their customers
(Slack et al., 2001:55).
An operation will spend its money on staff, facilities, technology, equipment cost
and material costs. Comparing the cost structure of different operations is not
always straightforward, and depends on how costs are categorised. Cost can
be categorised as fixed costs and variable costs. Cost is affected by the other
performance objectives:
• High-quality operations do not waste time or effort having to re-do things,
• Fast operations reduce the level of in-process inventory between micro
operations,
• Organised operations reduce administrative overheads,
• Dependable operations do not spring any unwelcome surprises on their
internal customers,
Page 48
34
• Flexible operations adapt to changing circumstances quickly and without
disrupting the rest of the operation. Flexible micro operations can also
change over between tasks quickly and without wasting time and capacity
(Slack et al., 2001:56).
2.6 SUMMARY
In creating the working operational structure for the EDM fire fighting service
and in obtaining enough funds to upgrade the resources to an effective and
efficient service, the EDM fire fighting service will be the number one fire
fighting service in South Africa. This can only be achieved if the localisation
decision is made correctly and the five performance objectives have been met.
The organisational structure and location may not be the factors that influence
the performance of a fire fighting service. Chapter 3 will determine those factors
by addressing the following sub-problem: What viewpoints do knowledgeable
people have about an operational structure for a fire fighting service and how
should this service operate?
Page 49
35
CHAPTER 3
BENCHMARKING
3.1 INTRODUCTION “Being a paramedic is the most fulfilling profession I’ve ever experienced it is full of challenges, variety, and the opportunity to help someone in need. At the end of each day, I smile to myself because I know that I made a difference. It's an honour to be a paramedic” (Casey O’Brien, Rural/Metro paramedic; http:www.ruralmetrotn.com/htm/careers_frameset.htm).
Due to the fact that paramedics, and that include fire fighters, are very
passionate about their jobs, is it important to create organisational structures for
them to do their work. To be able to create a workable organisational structure
it is important to benchmark what knowledgeable people‘s viewpoints are about
a fire fighting service.
This chapter addresses the following sub-problem: What viewpoints do knowledgeable people have about an operational structure for a fire fighting service and how should it operate? Each fire fighting service is
unique in how it operates and who are funding the service. For the purpose of
this study the following will be investigated:
• Public fire fighting service,
• Private fire fighting service.
Public fire fighting service is still very common in South Africa. The problems
are that they are understaffed, under funded and management seems to be
unaccountable. Most of the fire brigades in South Africa form part of a
municipality which is situated in big towns.
Private fire fighting services are still in the embryo state as most of these
services are owned by private companies like PetroSA and Sappi. The
Zululand Fire Protection Service is an example of one semi-private fire fighting
service in South Africa. It is part of Working For Fire. The Rural/Metro
Corporation in the US is a private fire fighting service that operates in
Page 50
36
Scottsdale, Arizona, Tennessee, Oregon. It operates in 50 communities in five
states in America (hhtp:/blog.lewrockhwell.com/ 2004).
Rural/Metro has created a concept of providing a service to areas that may
have no service at all, or otherwise may have difficulty in obtaining such a
service. This service is funded by an annual subscription basis
(www.ruralmetrotn.com/ 2004).
Poole (2004), a free-lance writer based in Scottsdale, Arizona, states that fire
fighting services don’t need to be provided by government (www.fee.org/ 1 Nov,
2004).
In the light of the above statements, it may be beneficial to investigate public as
well as private fire fighting services. Therefore the following fire fighting and
public services were investigated:
• Rural/Metro Corporation,
• Zululand Fire Protection Services,
• Sacramento Metropolitan Fire District (METRO FIRE),
• Metropolitan Police Department.
3.2 RURAL/METRO CORPORATION
The Rural/Metro Corporation is a private emergency-services company
specialising in ambulance and fire protection services. The ambulance services
include emergency medical services (EMS), non-emergency transports and
other support services. Fire services include municipal, industrial,
airport/rescue, emergency response training for cruise lines, wildland and
hazardous materials response ( www.ruralmetrotn.com/ 2004).
Rural/Metro Corporation started its first fire service in 1948. An ambulance
service was added in 1975. The company now employs more than 11 000
people, answering 2 million emergency calls a year in 400 communities in the
United States. Corporate headquarters are located in Scottsdale, Arizona.
Rural/Metro stock is traded on the NASDAQ stock exchange
(www.ruralmetrotn.com/ 2004).
Page 51
37
Rural/Metro has several operations in Tennessee, including Shelby County
(Memphis), Nashville, Knox, Blount, Loudon and Franklin counties. In addition
to ambulance and fire protection, Rural/Metro’s Tennessee operations include
an airport rescue fire fighting contract with FedEx in Memphis, a plant safety
and security agreement with ALCOA, and industrial and maritime emergency
response training (www.ruralmetrotn.com/ 2004).
The Rural/Metro Fire Department provides a high-quality, cost-effective fire
service. Funding is by three methods. Some areas are funded by a volunteer
subscription method where the home owner pays an annual fee based on
square footage. Another method is a licensing agreement, where the town has
an ordinance (law) that demands of all residents in the community to pay a
subscription. The third is by contract, where the town collects a tax and in turn
pays for the services under contract. (Morris, 2004).
Non-members are billed for service at the rate of $800 per hour, per apparatus,
for all fire calls. Non-member fees for a typical house fire can cost as much as
10 years’ worth of membership costs. Homeowner’s insurance usually pays
only a fraction of the bill, leaving the property owner responsible for the
difference. The Rural/Metro Corporation provides the following services:
• Fire response,
• First Responder medical service,
• Applicable discounts on a homeowner’s insurance premiums,
• Free home fire and safety inspections, checks of smoke detectors and fire
extinguishers, and home escape plans that can save a family in the event of
a fire,
• Rural/Metro’s life-saving fire prevention and safety programs at schools,
churches, civic groups, neighbourhood meetings or workplaces,
• Services involving hazardous materials (www.ruralmetrotn.com/ 2004).
Rural/Metro’s employees are at the heart of everything they do. They are an
organisation of people serving people in their hour of need. Every member of
the Rural/Metro team is a partner in the organisation’s success, and they work
hard to provide a work environment that is stimulating, engaging and rewarding.
Page 52
38
Rural/Metro Corporation believes in searching for excellence in the employment
process and it seeks to employ only those individuals with innovative ideas, a
willingness to work as a team and a deep sense of community partnership and
support (www.ruralmetrotn.com/;2004).
The Rural/Metro organisation structure is as follows;
FIGURE 3.1 - CORPORATE ORGANISATIONAL CHART
Corporate Organizational Chart
Jack BruckerPresident & CEO
Board of DirectorsCor J. Clement Sr., Chairman
Barry Landon*SVP
Billing & Collection
Kurt KrumpermanVP
Strategic Initiatives & Federal Affairs
Board Compensation Committee
Board Governance Committee
Michael ZarrielloSVP & CFO
Christine WilsonExecutive Assistant
Board Audit Committee
Donna BerlinskiDirector of Corporate
Governance & Compliance
SW Ambulance& Arizona FireBarry Landon
President
Southern Emergency Group
Susan BrownGroup President
Mid-Atlantic/N.E.Emergency Service
GroupTodd Walker
Group President
Western U.S./CentralFlorida Emergency
Service GroupBoo Heffner
Group President*Also Group President
October 26, 2004
Source: www.ruralmetrotn.com/ (2004).
Figure 3.1 is an example of the corporate organisation structure. The fire
services are divided into three fire “regions” in Arizona. They are in the Phoenix,
Tucson and Yuma areas. They are all of similar size with their own fire chief.
The Fire Chief reports to the Vice President (Morris, 2005). The organisational
structure as per region is illustrated in Figure 3.2.
Page 53
39
FIGURE 3.2 - REGIONAL ORGANISATIONAL CHART
Source: R Hightower (2004).
3.3 ZULULAND FIRE PROTECTION SERVICES Jake Oosthuizen formed Zululand Fire Protection Services cc after 16 years of
aerial spraying and aerial fire fighting, with the object of providing a service to
the Zululand timber industry. Initially the operation was started by taking over
the control centre of the Zululand Fire Protection Association (ZFPA) which co-
ordinated all fire fighting operations in the Zululand Coastal Area (ZCA) which
covered approximately 80,000 hectares of timber. The operation control room
was not very sophisticated and only provided a basic communication service to
the timber growers in the area (http:/www.zpfs.co.za; 2004).
Today the control room is manned 24 hours a day, 12 months a year. Weather
information is collected via the internet from approximately eight weather
stations twice a day and fire danger index (FDI) is calculated. The internet is
used for weather predictions, satellite images and communication with the
forestry industry world wide.
Fire PreventionDistrict ChiefMike Norton
Queen Creek Westside
Cave Creek / Carefree Assist
W/ F H & P V
FleetManager
C. Lawson
Shop
Warehouse
East Cty.Batt. ChiefD. CaudleB. Grubb
Sta # 841
Sta # 854
Sta # 855
Sta # 857
Sta # 859
West Cty.Acting Batt. Chief
M. Norling
Sta # 821
Sta # 837
Central Cty.District ChiefC. Fitzgerald
Sta # 828
Ftn. HillsDistrict Chief
M. Zimmerman
Sta # 822
Sta # 823 Prevention
Maricopa/Pinal Fire Ops.Exec. Asst. Chief
B. Hansen
Fire ChiefGary Morris
Training/Special ProjectsAssistant Chief
K. Redden
Bus. Dev./Pub. RelationsRanda Hightower
Human ResourcesC. Ojile
Regional Training OfficerTBN
Scheduling/FinanceM. Brewer/T. Mulder
Pima Fire OperationsC. Pendleton
Chief of Operations
Yuma Fire OperationsD. Rathbun
Chief of Operations
Programmer/System AnalystCharles Landon
CommunicationsManager
E. Anderson
Comm Center
Page 54
40
The services of the Zululand Fire Protection Services (ZFPS) are contracted to
the majority of the timber growers in KwaZulu-Natal and the North East Cape to
co-ordinate aerial fire fighting operations. During the dry winter months, ZFPSD
co-ordinates the aerial operations of the four fire associations which cover the
KwaZulu-Natal area, for example KZNFPA, ZFPA, Zululand Inland Fire
Protection Association (ZIFPA) and Maputoland. The total timber area of these
associations is approximately 550 000 hectares. As ZFPS’s core competency is
aerial fire fighting they have the following aircraft that are used by the three
Zululand Associations:
• ZFPA - 1 x Turbine, 400 gallon bomber and 1 x C182 spotter,
• ZIFPA - 2 x Turbine, 400 gallon bombers and 1 x C182 spotter,
• MAPUTALAND - 1 x C182 spotter (http:/www.zpfs.co.za; 2004).
Fast reliable bomber aircraft are indispensable. During severe fire weather
conditions, bomber aircraft are placed on standby throughout the timber area to
decrease the reaction time from call out to first drop. A fully laden Air Tractor
802 (3000lts) can travel across any terrain at 6.16 kilometers per minute. Once
at the fire the aircraft can dump a large load of foam or retardant or several
smaller loads, depending on the fire situation. With sufficient bombers available,
a load could be dropped on the fire every 3 minutes. This aerial attack can
prevent a fire from climbing into the crowns, as the area is wetted, which slows
down the spread. All this is happening while the ground crew are still on their
way (http:/www.zpfs.co.za; 2004).
During the dry winter months which last from July to October, ZFPA, Zululand
Inland Fire Protection Association and the Department of Water Affairs and
Forestry contract in bomber and spotter aircraft from private aircraft operators.
ZFPS co-ordinates all the aircraft operations on behalf of all the stakeholders
and the Department of Water Affairs and Forestry in the Maputaland area. Two
turbo Thrushes and one C182 are based in Melmoth, covering the Zululand
Inland Area. One AT402, one turbo Thrush and one C182 are based
in Kwambonambi covering the Zululand Coastal area. One turbo Thrush and
one C182 cover the Maputaland area of Mbazwana and Manzingwenya.
Page 55
41
In October 1999 Zululand Fire Protection Services secured a contract with a
major timber company and provided a complete ground fire detection and
control service. When fire fighters are not fighting fires or training, they do
silviculture operations. Silviculture services are the following;
• Fire break preparation, including burning,
• Pre- plant preparation, including full cover sprays and burning,
• Chemical and manual weed control,
• Maintenance of conservation areas,
• Planting (http:/www.zpfs.co.za; 2004).
The staff of ZFPS is highly motivated and each is a specialist in his field. During
the dry winter months the aircrafts are the first line of attack. Aircraft cannot
operate efficiently without adequate ground support. This support must be in the
form of trained ground crews equipped with quality equipment.
During the remainder of the year, ZFPS utilizes fast attack vehicles with the
capacity of 700 liters of water and three fire fighters that operate as the first line
of attack. These vehicles are backed up by other tankers that carry 2500 liters
of water and five fire fighters, one tanker with 5000 liters of water and eight fire
fighters and a bulk tanker with 13 000 liters of water.
These vehicles and fire fighters are strategically placed with regard to current
fire danger weather and remain in contact with the operation center at all times
(http:/www.zpfs.co.za; 2004).
The Zululand Inland Area is covered by the Zululand Inland Fire Protection
Association (ZIFPA). ZIFPA is made up of 25 members, covering approximately
44 000ha, working towards the common goal of preventing fires, detecting fires,
utilizing initial attack fire fighting principles to minimize agricultural and forestry
losses through fire (http:/www.zifpa.co.za; 2004).
The Zululand interior is relatively mountainous with a fairly even mix of Pine,
Wattle and Eucalyptus plantations that are harvested in an average of 12 years.
The area has the unfortunate notoriety of having the fastest, most devastating
fires. In Zululand history, 6 000ha has been destroyed in 6 hours! Extreme fire
Page 56
42
weather conditions, aspect and terrain make this area a nightmare to fight fires
in (http:/www.zifpa.co.za; 2004).
The Zululand Coastal Area is covered by the Zululand Fire Protection
Association (ZFPA). The ZFPA is made up of 20 members, covering
approximately 80 000ha, working towards the common goal of preventing fires,
detecting fires, and utilizing initial fire fighting attack principles to minimize
agricultural and forestry losses through fire.
Zululand Coastal is one of the very few areas in South Africa that has a twelve
month fire season due to the unique weather conditions. It is a relatively flat
area with predominantly colonial Eucalyptus plantations that are harvested in an
average of seven years. High temperatures, coupled with high humidities and
the average rainfall of approximately 1100mm per year, make Zululand Coastal
the 'Forestry Pantry' of South Africa. The trees grow straight and fast -
unfortunately so do the fire fuels! The following are aircraft and fire statistics
updated 09/10/2004
TABLE 3.1 - ZULULAND COASTAL FIRES AND LOSSES
Year Total Fires
A/c Fires
Timber Burnt
Ha/FireAve A/c costs
per Fire
1995 299 45 310 1.04 R 1,827.25
1996 240 36 365 1.52 R 2,173.15
1997 196 23 149 0.76 R1.227.88
1998 416 47 2380 5.72 R 7,778.43
1999 457 30 282 0.62 R 3,144.47
2000 154 21 109 0.72 R 6,148.10
2001 260 48 187 0.7 R 5,933.26
2002 565 101 481 1.02 R 3,804.28
2003 557 188 1284 2.31 R 4,315.80
2004 195 22 198 1.52 R 22,186.23
Average 334 56 575 1.59 R 6,367.89
Source: http://www.zfps.co.za (2004).
Page 57
43
TABLE 3.2 - ZULULAND INLAND FIRES AND LOSSES
Year Total Fires
A/c Fires
Timber Burnt
Ha/FireAve A/c costs
per Fire
1995 170 41 5789 33.75 R 2,212.93
1996 69 12 360 5.24 R 1,720.52
1997 79 17 112 1.01 R 2,004.79
1998 110 35 2254 20.65 R 16,577.23
1999 141 56 981 6.96 R 11,875.43
2000 102 36 456 5.14 R 11,000.93
2001 178 46 416 2.33 R 8,264.11
2002 140 28 443 3.17 R 9,080.75
2003 113 32 927.5 8.21 R 14,883.19
2004 44 16 360 6.99 R 13,331.29
Average 115 32 1210 9.35 R 9,095.12
Source: http://www.zfps.co.za (2004).
Forest fires are one of nature’s most destructive forces, yet nothing has ever
been done to improve detection methods which have remained the same for
hundreds of years. Technology plays a vital role in all spheres of forestry today.
In order to help preventing great damage caused by a fire, the ZFPS have 11
electronic fire detection cameras. These cameras send live video images from
seventy two meter towers up to thirty five kilometres away. This camera system
is called the Firehawk. The Firehawk is a computerised fire detection system
whereby rotating digital cameras covering large forestry areas transmit
information to a base station where the Firehawk software differentiates
between fire, smoke and glow and automatically raises an alarm. Firehawk is a
computer aided forest risk management system that is controlled by a human
operator.
The Firehawk has replaced the manned lookout towers that are as old as
forestry itself. The human element associated with these lookout towers is the
problem. More often lookout towers are late in reporting fires. Guards have to
work long hours under difficult circumstances with only short breaks in
concentration. It is also very difficult for these staff members to pinpoint the
Page 58
44
actual location of any fire and to provide the best access details to the forester.
Yet this antiquated method is still used in many parts of the world. Millions of
dollars are spent annually in the combating fires, but nothing is done about their
early detection. Firehawk’s capabilities are as follows:
• Multi-tower capabilities. Up to eight (8) remote camera installations
can be connected to a single Firehawk processor. A base station
can have many processors,
• Cameras scan a full 360 degrees in less than four minutes,
• Detection of smoke, fire and glow 24 hours a day,
• Manual manipulation of any camera in the system without affecting
any other camera in the system,
• Multiple alarm reporting capabilities. Alarms are reported by the
system without affecting any camera scanning its designated area,
• Geographical information on any camera and sector position by a
simple touch of a button operation. This provides valuable
information to forestry personnel, such as fire location and best
access details,
• User friendly software, using the latest software platforms and
operating systems,
• Multiple time zones setup capabilities.(day night and twilight),
• Unwanted image alarms are filtered out,
• The system can be used for Management check-ups and controlling
of fire fighting operations (http://wwwfirehawk.co.za; 2004).
Firehawk has been designed to be installed in remote areas where cameras
can cover a radius of 6 to 8 km from the point of installation. Although the
capability of cameras is far beyond the 6 to 8 km radius, weather conditions do
not always allow detection of fires beyond this safe margin. Real-time video
images can be transmitted up to 30 km. without repetition being required. These
video images are fed to a central command base where they are processed.
Unwanted image alarms are filtered out and only those required are reported.
Page 59
45
During the past six years the system has been installed and tested in various
forestry areas throughout South Africa. The first installation was in the
Richmond area of KwaZulu-Natal. This area was chosen because of the
mountains, extreme temperature changes that occur, hot summers and very
cold winters with snow on high ground. This ensured that the system was tested
and developed to not only work under severe weather conditions, but also to be
accurate enough to guide foresters to the source of a fire in the shortest
possible time once detected.
FIGURE 3.3 - ELEMENTS OF THE FIREHAWK SYSTEM
Source www.zfps.co.za/firehawk_detection (2004).
Presently Firehawk is installed in two regions of South Africa, and is
continuously being expanded. Forestry companies Mondi, Sappi, NCT, SQF
and Masonite, private growers and Government agencies have committed
themselves to the Firehawk system as being the preferred system for the
detection of forest fires.
Page 60
46
The results of using the Firehawk are as follows:
• In 2000 during the fire season of Northern Kwa-Zulu Natal a total of 153 fires
were detected. Of these 87 fires were detected at night. Results at the end
of the season showed a burnt area rate of less than one hectare per fire
(0.7 ha per fire),
• In the 1998 fire season, before the Firehawk system was installed the
burnt area rate was 5.68 ha per fire (http://wwwfirehawk.co.za; 2004).
This proved that by having the capability to detect fires more rapidly, ground
crews and aerial support are able to get to the source of fires much faster,
thereby limiting damage and costs drastically.
3.4 SACRAMENTO METROPOLITAN FIRE DISTRICT (METRO FIRE) The Board of Directors of the American River Fire District adopted an
application for reorganisation with the Sacramento County Fire Protection
District on 25 September 1999. The new organisation was named the
Sacramento Metropolitan Fire District or Metro Fire. The administration and
membership of the District recognise the contribution and rich history of its
processor departments. There are 16 prior fire departments represented in the
Metro Fire organisation. The Sacramento Metropolitan Fire District is the
largest district in the County of Sacramento and the seventh largest local fire
agency in the State of California. The combined District will consist of
approximately six hundred and ninety employees with an area encompassing
417 square miles that include Sacramento and Placer counties
(http:www.smfd.ca.gov; 2004).
The name fire district implies that the primary responsibility is to suppress fires
and that is why the district was created in the first place. The Fire District Law
contained within the State of California Health and Safety code authorises a fire
district to provide much more than only fire fighting. The following additional
services are also provided;
• Rescue services,
• Emergency medical response,
Page 61
47
• Hazardous materials emergency response,
• Ambulance services,
• Any other services related to protecting life and property
(www.smfd.ca.gov/ADMIN.htm; 2004).
The US Census Bureau defined a special district as independent, special
purpose governmental units other than school districts that exist as separate
entities with substantial administrative and fiscal independence from general-
purpose governments (www.smfd.ca.gov/specialdistrict.htm; 2004).
The local constituency determines the needed function that the special districts
must fulfil. The following types of special districts are identified;
• Airport districts,
• Municipal districts,
• Hospital districts,
• Levee districts,
• Public utility districts,
• Recreation and park districts,
• Utility districts,
• Sanitary districts,
• Water districts,
• Resource conservation districts,
• Water storage districts.
Special districts are also formed to provide mosquito abatement, library
services, road maintenance, drainage function and fire services. The fire
protection service forms part of the non-enterprise districts that generally do not
charge for their services. In the multipurpose district, at least two services are
rendered for example fire suppression and prevention and arson investigation
(www.smfd.ca.gov/specialdistrict.htm; 2004).
Page 62
48
TABLE 3.3 - FACTS ABOUT SACRAMENTO METROPOLITAN FIRE DISTRICTS
These statistics are from 2004-2005 Budget
Demographics
Area served (sq. mi.) 417
Population 599,257
ISO Rating 3 in hydranted /8 in un-watered areas
Counties served Sacramento and Placer
Cities served City of Citrus Heights
Geography Mostly level. Two rivers, American &
Consumnes
Airports Mather Field, McClellan Field, Rancho
Murrieta, and Rio Linda
General Budget $120,819,311
Page 63
49
Source: http:// www.smfd.ca.gov (2004)
The Operations Division provides a multitude of emergency and non-emergency
services to the public. More than 500 firefighters working out of 42 stations are
directly responsible to mitigate a wide variety of emergency incidents 24/7. In
2002 the fire district responded to over 54,000 alarms. The following equipment
is operated by the fire district;
• 10 transporting Advanced Life Support medics,
• 7 reserve transporting medics,
• 38 engine companies,
• truck companies,
• 24 grass engines,
• 2 crash rescue rigs,
Incidents
2003 56 700
Authorized Personnel
Management 17
Fire Suppression 534
Support Staff 122
Total Paid Personnel 673
Reserve fire fighters 19
Physical Resources
Fire Stations (Full Time) 38
Fire Stations (Volunteer) 2
Fire Stations (Part Time) 2
Engine Companies 39
Truck Companies 5
Reserve Firefighter Engine Companies 14
Transporting Medic Units 10
Transporting Medic Units (Part Time) 2
Personal Watercraft Response Units 2
Inflatable Rubber Boat Response Units 2
ARFF Units 3
Historical Fire Apparatus 8
Page 64
50
• 6 water tenders,
• swift water rescue bikes,
• swift water rescue inflatable rubber boats,
• air units,
• 3 reserve fire fighter engine companies,
• 2 reserve fire fighter grass engines (http:// www.smfd.ca.gov; 2004).
Many of the District's engines are paramedic staffed and all responding units
provide EMT coverage. In addition to emergency medical alarms and structural
or wildland fire responses, the District's personnel are trained and equipped to
deal with swift water emergencies, confined space incidents, technical rescues,
hazardous materials incidents and crash fire rescue. In the 2000 wildland fire
season the District sent engine companies to Arizona, Wyoming and Nevada to
battle record size fires. Some of the District's personnel are trained and
experienced as overhead team staff and served on major complex fires in
Wyoming, Arizona, Colorado and Montana. Additionally, many of their members
hold critical roles. In addition to emergency medical alarms and structural or
wildland fire responses, the District's personnel are trained and equipped to
deal with swift water emergencies, confined space incidents, technical rescues,
hazardous materials incidents and crash fire rescue. Many of their members
hold critical roles on the urban search and rescue “Task Force 7 Team”. This
Team responds to large-scale disasters, both natural and manmade (http://
www.smfd.ca.gov; 2004)
Page 65
51
FIGURE 3.4 - SACRAMENTO METROPOLITAN FIRE DISTRICT
Source: www.smfd.ca.go/org_chart.htm (2004).
3.5 METROPOLITAN POLICE DEPARTMENT
The Metropolitan Police Department is not only a fire fighting service but they
are also a public service working in the community. Members of the
Metropolitan Police Department (MPD) have been serving the District of
Columbia (DC) for well over 100 years. During that time, the MPD has grown in
diversity as well as size. In 1802, when the original charter of Washington was
approved, police authority was centralised and power was granted to the city
itself to establish patrols, impose fines and establish inspection and licensing
procedures. Until the creation of the Metropolitan Police Department in 1861,
the city had only an auxiliary watch with one captain and 15 policemen. Today,
the Metropolitan Police Department includes more than 4,200 members that
consist of 3,600 sworn police officers and more than 600 civilian employees.
Their leader is Chief Charles H. Ramsey (www.mpdc.gov.am; 2004).
The mission of the MPD is: “ to prevent crime and the fear of crime, as we work
with others to build safe and healthy communities throughout the District of
Columbia” (www.mpdc.gov/mission; 2004). While serving and protecting the
community remains central to the MPD mission, the department is also
committed to building safer neighbourhoods in partnership with the community.
Page 66
52
The mission of the MPD is in line with reasons why police departments do exist:
• To respond to and solve criminal incidents,
• To respond to and resolve non-criminal incidents,
• To identify and solve broader crime and disorder problems.
These three functions are the unique responsibility of the police (http:/
www.dcwatch.com/police/980909.htm; 2004).
On May 2, 2004, the Metropolitan Police Department implemented a major
restructuring of its Police Service Areas (PSA), a basic building block of
community policing in the DC. The goal of the restructuring is to ensure better
police services for DC neighborhoods by providing greater flexibility in
neighborhood patrols and by aligning PSA more closely with natural
neighborhood boundaries. The restructuring plan reduces the number of PSA
from 83 to 45, thus creating new boundaries for all of the PSA, as well as new
boundaries for some police districts (www.mpdc.gov/psadistricts; 2004).
The new structure gave teams of PSA officers and supervisors greater
responsibility for fighting crime and established new ways for police and
community to work together to solve all the communities’ problems (http:
www.dcwatch.com/police/980909.htm; 2004).
The PSA model represented a good start. The resources devoted to it were
inadequate and a major problem was that the rest of the Police Department
remained locked in a rigid bureaucratic structure that not only failed to embrace
the new operating model; but actually got in the way of how basic police work
gets done.
The Metropolitan Police Department took the decision to make the police
service more effective. The managers decided to restructure the entire
department for three main reasons;
• Place more resources in the community,
• Focus resources on reducing crime and solving problems in the city's 83
PSA,
Page 67
53
• Hold managers at every level of the organisation accountable for the quality
of policing services within their geographic commands (http:/
www.dcwatch.com/police/980909.htm; 2004).
This actually means that they are putting the Police Department in a much
stronger position to take back the city’s neighbourhoods, block by block,
community by community and in partnership with residents and other agencies.
The managers were of the opinion that the new organisational structure would
enhance their ability to fight crime by:
• Increasing police resources in the community. Additional sworn personnel
like detectives, investigators and uniformed officers are being moved out of
centralised units to assignments in the community,
• Eliminating bureaus and cutting bureaucracy. The existing bureau structure
created excessive bureaucracy and made coordination across units
cumbersome and inefficient. Those four bureaus are being eliminated,
replaced by a more logical and streamlined command system which
promotes team work, communication and geographic accountability for
fighting crime,
• Strengthening the PSA. More officers and supervisors are being assigned
directly to the PSA. More field resources are being assigned in direct
support of the PSA, and PSA managers are being given greater authority
and responsibility to build partnerships and solve problems,
• Creating full-service police districts. Key operational services such as
patrols, investigations, focused missions; traffic and prevention are being
placed in the districts and at the district level. These crime-fighting services
will be more accessible to the community and of greater support to the PSA,
• Establishing geographic accountability throughout the organisation. The new
structure organises the districts into three Regional Operations Commands,
located in the community and led by a Regional Assistant Chief who is
accountable for managing resources and coordinating efforts throughout the
region. This creates a complete system of geographic accountability for
fighting crime in each PSA, districts and regions, all the way up to the chief
of police.
Page 68
54
• Streamlining the business side of the organisation. Administrative and
technical functions are being consolidated under a unified command that
can more efficiently provide the tools, training and technology that are
critically important to field personnel.
• Creating the capacity to continuously improve the Department. A new focus
on strategic planning will identify opportunities to improve the organisation
and develop innovative strategies and programs that meet the needs of
Department personnel. A new quality assurance team will follow up on this
work, ensuring compliance with new programs and standards and identifying
areas in need of further improvement. (http:/
www.dcwatch.com/police/980909.htm; 2004).
FIGURE 3.5 – PROPOSED NEW STRUCTURE OF METROPOLITAN POLICE DEPARTMENT
Source: http://www.dcwatch.com/police/980909.htm (2004)
The new structure as presented in, figure 3.5, eliminates the four bureaus and
creates a more streamlined organisation that promotes teamwork,
communication and accountability. The new organisational structure is a
significant departure from the way police departments as in Washington D.C.,
CHIEF of POLICE
Executive Assistant
Chief in Charge of
Assistant Chief in Charge
of Corporate Support
Regional Operations
Command
Special Services
Group
Page 69
55
and across the country have been organised. The new structure represents
nothing short of the wholesale transformation of the MPDC, from a bureaucratic,
incident-driven agency to a streamlined, customer-driven service organisation
and one that is focused on forging alliances to more effectively fight crime and
solve problems.
The reorganising of the new structure is not simple, and it will not happen
overnight. The new structure will not become effective immediately. The
transformation will take place in phases over the next few months and each
phase will be carefully planned and implemented. The new structure will have
the following advantages:
• It will bring the MPDC in line with the way police work gets done,
• It will promote a team orientation in fighting crime,
• All operational units, all the way up the chain of command, will be organised
by geographic area,
• All the units will share the same goals and be held accountable for achieving
the same results,
• The structure will support the MPDC commitment to community policing,
• It will bring a wider range of police services closer to the customer, thus
encouraging partnerships and problem solving that are key factors to
effective community policing,
• The new structure will put the MPDC in a position to regain their place as the
nation's leading police agency (http:/ www.dcwatch.com/ police/ 980909;
2004).
Community policing does not provide the organisational structure needed to
effectively carry out their work. Community policing simply provides the
principles or values that guide their efforts and principles such as listening to the
community, establishing partnerships, involving other government agencies,
etc. In recent years, police departments across the country (including the
MPDC) have struggled with trying to implement the philosophy of community
policing with the same organisational structures they had used for years. The
result is that the MPDC has become fundamentally out of sync with the way
work gets done in the organisation (http:/ www.dcwatch.com/police/980909.htm;
2004).
Page 70
56
The MPDC (like most other police departments) has long relied on a very
traditional, vertical organisational structure, with separate bureaus organised
around specific functions (patrol services, support investigative services,
etcetera). In reality, however, most police work takes place laterally, with work
passing across different organisational units. A call to 911 was received by one
bureau, dispatched to a unit in another bureau for initial response, assigned to a
third bureau for investigation, and then given to a combination of still other units
for follow-up, problem solving and prevention. This was time constraining and
this structure provided little or no accountability for the end result, and that is to
solve the incident or addressing the problem in the quickest time possible (http:/
www.dcwatch.com/police/980909.htm; 2004).
The PSA and the MPDC both operate as an individual unit and each bureau
tends to follow its own goals and performance measures, which may or may not
reflect the goals and performance measures of the Department as a whole of
the community. The communication across bureaus is often haphazard, overly
bureaucratic or nonexistent and this is the reason that the traditional police
organisation has become incompatible with the way police work needs to get
done, especially under the philosophy of community policing (http:/
www.dcwatch.com/police/980909.htm; 2004)
The MPDC needs a new organisational structure that addresses the
shortcomings of the traditional model and will replace isolated operational
bureaus based on function with more unified operational commands based on
geography and geographic accountability. The new structure will promote
common goals, objectives and performance measures throughout the
organisation, and will establish new levels of managerial accountability based
on geography. The new structure will streamline internal communications, and
will enable the smooth transition of work from one unit to another (http:/
www.dcwatch.com/police/980909.htm; 2004).
Page 71
57
FIGURE 3.6 – PROPOSED ROLE STRUCTURE OF METROPOLITAN POLICE DEPARTMENT
Source: http://www/dcwatch.com/police/980909.htm (2004).
The key elements of the MPDC's new structure as presented in figure 3.6, are
as follows:
Enhanced PSA. The PSA will be enhanced by the addition of resources
(both officers and supervisors) and the expansion of the PSA management
team.
Each PSA will be led by a manager who is clearly accountable, 24 hours a
day, for the results and behaviour of the members of the PSA team.
The PSA manager will report directly to the District Commander, thus
ensuring that other district resources are supporting crime fighting and
problem solving in the PSA.
The PSA manager will be assisted by a team of first-line PSA supervisors,
who will oversee the work on each shift, assist the PSA manager with
special projects and be accessible to the community and responsive to their
needs around the clock (http://www/dcwatch.com/police/980909.htm; 2004).
Full-Service Police Districts - The role of the police district is being dramatically
expanded, from a narrow focus on patrol to the full range of police services
Page 72
58
needed to solve crimes and address neighbourhood problems. Each district will
include:
Violent Crimes Investigators,
Property Crimes Investigators,
Focused Mission Teams,
Operational Support Team,
Customer Service (http://www/dcwatch.com/police/980909.htm; 2004).
Regional Operations Commands - The seven service police districts are being
restructured into three Regional Operations Commands (ROC). They will be
identified as follows:
Northern (Districts 2 and 4),
Central (Districts 1, 3 and 5),
Eastern (Districts 6 and 7) (http://www/dcwatch.com/police/980909.htm;
2004).
Each ROC is commanded by a Regional Assistant Chief whose office is located
in the community and who has the authority and who is free of the traditional
bureaucracy to make decisions and allocate resources to support crime fighting
and problem solving throughout the region. To supplement district and PSA
efforts, each ROC includes a youth investigations unit, a crime analysis
capability and an executive officer who serves as the liaison to the rest of the
organisation, including the 911 center.
Special Services. Highly specialised operational units that are citywide in
scope are being organised under a new Special Services Group. This group
includes those functions, such as emergency response, special events and
major narcotics that have unique training, resource and operational needs.
Like the Regional Operations Commands, the Special Services Group
reports to the Executive Assistant Chief in charge of operations. This
ensures coordination between these specialised units and PSA, district and
regional operations.
Operations Command. That is to ensure a 24-hour-a-day, department-wide
command presence. A new citywide operations command is being
established within the Office of the Executive Assistant Chief. Command-
Page 73
59
level personnel will be available to respond to and oversee major incidents
that require their presence at any location in the city, at any hour of the day.
Corporate Support. The Department's critical business functions are unified
under a new corporate support structure. Led by an Assistant Chief, this
structure streamlines the delivery of services in four key areas: human
services, business services, training services and operational support
services. Organising these corporate services under a single command
helps to ensure greater coordination within these functions and more
effective delivery of services to the operational side of the organisation
(http:/ www.dcwatch.com/police/980909.htm; 2004).
The role of the police district is being expanded, from a narrow focus on patrol
to the broad range of services needed to fight crime and solve problems. Many
of these functions will be staffed by personnel reassigned from centralised units.
The result is seven full service police districts in which the primary crime-
fighting resources of the Department are more accessible to the community
through the PSA structure (http:/ www.dcwatch.com/police/980909.htm; 2004).
Most operational services are being organised under three regional commands.
This creates geographic accountability for fighting crime throughout the
organisation as from the PSA up to the Chief of Police.
A lot of work remains to be done in implementing the new organisational
structure. This process will involve identifying new leadership in some areas;
defining and re-defining relationships between units; putting in place the
physical infrastructure; moving personnel to their new assignments in the
community; establishing policies and procedures; training, and more (http:/
www.dcwatch.com/police/980909.htm; 2004)
The new organisational structure goes a long way toward accomplishing all
three reasons mentioned to restructure. By itself, however, the new structure
does not guarantee success. That will continue to depend on the hard work,
dedication and service of members. This new structure is designed to provide
the personnel, the front-line officers and supervisors with the tools, the access
to resources and the management support they need to do their jobs. Creating
Page 74
60
an organisation that is more efficient and more responsive to its members’
needs puts the MPDC in a position to fulfil their commitment to make
Washington D.C., the safest major city in America, block by block, community
by community (http:/ www.dcwatch.com/police/980909.htm; 2004).
3.6 SUMMARY
The different fire fighting services make the point that the EDM Fire Fighting
Service is not unique in the way of operating over a large area. By obtaining the
geographical organisational structure, a much better and more cost effective
service can be provided. The reason why companies lost control over their
structure and their bureaucratic costs are escalating, is because they
experience problems with the clarity of their structure. The challenge for a
company is to manage its structure and control systems so that it can
economise on bureaucratic costs and ensure that they match the potential gains
from its strategy. The decrease of management cost will also result in a
decrease in cost charged to the public for a fire fighting service and it will make
the idea of a private fire fighting service or a tax charge for the service real.
To complete the picture, chapter four will analyse the EDM as well as the fire
fighting service of all its seven municipalities.
Page 75
61
Chapter 4
DESIGN OF THE EMPIRICAL STUDY
4.1 INTRODUCTION The previous chapter has focused on how a regional fire fighting service ideally
operates. It was of the utmost importance to determine the risk profile and to do
a capacity analysis of the EDM area in order to determine what knowledgeable
people believe the requirements for effective fire fighting management are.
This chapter addresses the following sub-problems: What viewpoints do
knowledgeable people have about an operational structure for a fire fighting
service and how does this system operate; and the second sub-problem: Risk
profile and capacity assessment analysis of the current fire fighting services in
the Eden District Municipality (EDM) area.
To address these two sub-problems, the current situation was analysed by
means of questionnaires and by doing research using the internet. Kotler
(2000:110) is of the opinion that market researchers have a choice of two main
research instruments in collecting data: questionnaires and mechanical devices.
In certain sections in this literature study there are adequate guidelines on how
to prepare a questionnaire and to analyse the data that have been collected.
Laudon and Laudon (2002:284) are of the opinion that rapid access to
knowledge is critical to the success of many companies and that the internet will
help with this problem. This information is available with blinding speed and the
system provides mountains of data from all over the world, which would
otherwise be too expensive and too difficult to tap.
4.2 RESEARCH DESIGN The empirical study was utilised to solve the sub-problem: What is the risk
profile and capacity analysis of the EDM area? As well as: What viewpoints do
knowledgeable people have about an operational structure for a fire fighting
service and how does this system operate?
Page 76
62
The first sub-problems was addressed by administering a questionnaire and the
second sub-problem by using the internet as a research tool for benchmarking
the different fire services. The information available from the ODS Consultant cc
was used to assist in creating a risk assessment as comprehensively as
possible.
Johnson and Scholes (2002:174) used the abovementioned method and some
others to determine what organisations should be concerned with when
improving their performance over time. They argued that, if they did not, they
were likely to lose their competitive advantage or even drop out of the market as
customer expectations and the performance of competitors were rising. This
can be done by looking at the performance of organisations in the same
industry or sector against a set of agreed performance indicators.
4.3 DESIGN AND STRUCTURE OF THE QUESTIONNAIRE The aim of any data collection effort is to obtain good quality information. This
information must be timely, accurate and relevant (Wegner, 2001:2). Kotler
(2000:110) states that a questionnaire is, because of its flexibility, by far the
most common used instrument for collecting primary data. A questionnaire
needs to be carefully developed, tested and debugged. The design of a
questionnaire is of utmost importance to ensure that the correct research
questions are addressed (Wegner, 2001:17). This collected data must then be
analysed to make a meaningful decision.
Due to the nature of the business for this research a structured interview was
used. According to Leedy and Ormrod (2001:196), a structured interview is
where a researcher asks a standard set of questions and no more. An
additional requirement for this study was to ease the operation of data
collection, thus the questionnaire was used in a telephone interview after
forwarding the said questionnaire to the respondent.
A questionnaire should consist of three sections:
• The administrative section – used to record the identity and details of the
respondent and also where the interview took place.
Page 77
63
• The demographic section – describes the respondent by a number of
demographic characteristics such as gender, company size or market
sector.
• The information sought – this makes up the major part of the questionnaire
and consists of all the questions which will extract data from respondents to
address the research objective (Wegner, 2001:19).
Part of the empirical study and the subsequent questionnaire is a sampling
plan. Such a sampling plan calls for three decisions:
• Sampling unit – who is to be surveyed? Clearly identify the target population
that will be sampled.
• Sample size – how many people should be surveyed? Large samples give
more reliable results than small samples.
• Sampling procedure – how should the respondents be chosen? A sample is
selected on a probability or a non-probability basis (Kotler, 2000:112).
Because of the limited size of the sample used in this study the non-probability
sampling method was used and consisted of the following three methods:
• Convenience sample – the researcher selected the most accessible
population members.
• Judgment sample – the researcher selected population members who were
good prospects for accurate information.
• Quota sample – the researcher found and interviewed a prescribed number
of people in each of several categories (Kotler, 2000:112).
The structure of the questionnaire for this study was based on the following
requirements for data collection:
• The emergency calls attended to annually by the different local authorities.
• The number of fire stations, sub-stations and control rooms in the EDM area.
• The total municipal operating expenditure and the total fire fighting
expenditure of each municipality.
• Manpower profile.
An extract of the questions in the questionnaire is presented in Table 3.2. A
copy of the questionnaire is presented in Annexure A to C. The purpose of the
Page 78
64
questionnaire and the type of questions asked with specific reference to the
different Municipalities were to determine specific information in creating a
holistic picture of each fire fighting service in the EDM area.
TABLE 4.1: An Extract from the Questionnaire
Date
Authority
Official
FIRES Number of
Formal/informal dwellings/ &field fires
Storage
Industry
Transport
Other
RESCUE
Transport accident
Environmental (mountains) not sea rescues
HAZMAT(chemical fires or emergencies)
The information in Table 4.1 determined where the “hot spots” were and what
type of service was required: a fire fighting service or a rescue service. This
information also indicates the number of fire fighters required.
TABLE 4.2: An Extract from the Questionnaire (continued)
Detail Number of
How many fire stations
How many sub-stations
How many satellite stations
How many control centers
The data in Table 4.2 would provide information on where all the fire stations
are located in the different areas.
Page 79
65
TABLE 4.3: An Extract from the Questionnaire (continued)
DETAIL / DESCRIPTION Amount
Municipal Total Operating Expenditure -
2002/2003
Fire Fighting Operating Expenditure -
2002/2003
Municipal Total Operating Expenditure -
2003/2004
Fire Fighting Operating Expenditure -
2003/2004
Source:
Table 4.3: The data would reveal the total operating expenditure of a
municipality compared with the fire fighting expenditure of the same
municipality.
TABLE 4.4: An Extract from the Questionnaire (continued)
Table 4.4: Data would determine the skills of and the number of fire fighters in
the EDM area.
4.3.1 Administration of the questionnaire The questionnaire was taken to the seven Municipalities in the EDM area. At
certain Municipalities the financial department could provide the researcher with
all the answers. The questions were asked by telephone interviewing.
Full time Staff Quantity
Qualified/Trained leadership
Unqualified and untrained leadership
Qualified/ trained fire-fighters
Unqualified/untrained fire-fighters
Part time Staff, Reservists and Volunteers
Qualified/trained leadership
Unqualified and untrained leadership
Qualified/trained fire-fighters
Unqualified/untrained fire-fighters
Page 80
66
According to Kotler (2001:112), telephone interviewing is the best method for
gathering information quickly, and the interviewer is also able to clarify the
questions and therefore the response rate is higher than when mailing the
questionnaires.
The researcher assisted in all of these interviews. The aim of these interviews
was to obtain information as accurate as possible that was about the fire
fighting services in the EDM area. After interviewing all seven municipalities, the
researcher processed the completed questionnaires.
4.3.2 Variables in questionnaire Wegner (2001:3) states that a variable is any characteristic that is being
measured or observed and that such a variable can take on different (random)
values at each observation or measurement and is called a random variable.
The aim of this questionnaire was to determine: What is the risk profile and
capacity analysis of the EDM area? As well as: What viewpoints do
knowledgeable people have about an operational structure for a fire fighting
service and how does this structure operate?
In this questionnaire there were a number of random variables such as:
• Emergency calls attended annually
o Fires
o Rescue
o Hazmat
• The number of fire stations, sub-stations and control rooms
• Manpower profile
o Qualified full time staff
o Unqualified full time staff
o Part time staff, reservists and volunteers
• Total Municipal operating expenditure
• Total Municipal fire fighting operating expenditure
Page 81
67
Data on these above mentioned variables assisted the researcher in
determining the assessment analysis of the fire fighting services in the EDM
area.
4.4 SUMMARY The questionnaire was the selected tool to determine: What is the risk profile
and capacity analysis of the EDM area?
As well as: What viewpoints do knowledgeable people have about an
operational structure for a fire fighting service and how does this service
operate?
Data obtained also assisted in determining in which organisational structure
would fit the fire services for the EDM area the best. The benchmarking against
other fire fighting service would help in designing the best operational structure
using all the possible resources.
Chapter 5 will reflect on the results obtained from the questionnaire.
Page 82
68
CHAPTER 5
RESULTS AND ANALYSIS OF THE EMPIRICAL STUDY
5.1 INTRODUCTION Slack, Chambers and Johnston (2001:601) state that benchmarking is one
approach that some companies can use to compare their operations with those
of other companies. Benchmarking is no longer restricted to only manufacturing
operations but also confined to services such as hospital and banks (Slack et
al., 2001:602).
The practice of benchmarking, where a comparison is made between an
organisation’s operation practices, and their way of doing things and those
adopted by other operations, was discussed in chapter three. The objective was
to see whether anything could be learnt from practices adopted by other
organisations, (Slack et al., (2001:604).
Slack et al. (2001:604) state that a prerequisite for benchmarking success is to
understand thoroughly your own processes and also to look at what is already
available. Therefore it is very important to know what the area looks like, how
many people are staying in the EDM area, what resources they have and what
the total expenditure of it operation is.
5.2 ANALYSIS OF EMERGENCY CALLS ATTENDED The completion of the questionnaire presented an opportunity to determine
where the high risk areas are. Table 5.1 presents data about all the call outs in
a year in the three major fire fighting services as well as in the EDM area. This
information was obtained by a telephonic questionnaire. A copy of the
questionnaire is presented in Annexure A.
Page 83
69
TABLE 5.1 – EMERGENCY CALLS ATTENDED ANNUALLY
EMERGENCY CALLS ATTENDED ANNUALLY
Mossel Bay
George Oudtshoorn
EDM
FIRES
Formal/informal
dwellings and field fires 473 360 86 35
Storage 2
Industry 1
Transport 19 22 8
Other 3 3
RESCUE
Transport accident 150 - 17 7
Environmental 30 - 1
HAZMAT
TOTAL CALLS 678 395 111 42
Source (Personal interviews)
H. Botha C. Marais H..Krapohl A. Van
Rensburg
Incidents in the rural areas are not always reported; therefore the statistics may
generally be understated. The statistics of the fire fighting services of Knysna
and Plettenberg Bay (Bitou) are not shown in Table 5.1, but it is expected that
their statistics are nearly the same as those in Table 5.1.
Langeberg Municipality has numerous towns and coastal settlements that are
widely fragmented by distance and topography. Risks are predominantly small
and the municipality performs a rudimentary, ad hoc structural fire fighting
function but only has the capacity to mitigate small to medium sized veld fires.
Table 5.1 shows that Mossel Bay attended more emergency calls than George,
that has a larger population. As shown per Table 6.3, Mossel Bay includes a
large quantity of towns with high risk areas. The climate of Mossel Bay, which is
“wet”, is also drier than the climate of George. The following are high risk area
identified in EDM, George and Mossel Bay:
Page 84
70
EDM (including Kannaland and the DMA) o plantations (Haarlem),
o filling stations,
o LPG gas supply establishments,
o high buildings,
o motor vehicle accidents,
o hazardous substance emergencies involving motor transport and
large structure fires.
i. Mossel Bay o major hazardous installations represented by PetroSA and the
Voorbaai tank farm,
o environmental pollution of the sea and rivers,
o Wolwedans Dam,
o accidents and hazardous substances associated with commercial
transport,
o veld and forest fires,
o the sawmill at Great Brak River,
o passengers and hazardous substances associated with rail transport,
o aircraft accidents,
o swift water and cliff rescues,
o structural and informal settlement fires and rescues,
o rescues after heavy and light motor vehicle accidents,
o Mossel Bay harbour.
ii. George o George airport and aircraft accidents,
o shopping centres,
o filling stations and LPG gas outlets,
o hotels, guest lodges and holiday resorts,
o thatched dwellings (Wilderness),
o wooden houses (Victoria Bay),
o sawmills (Dieprivier),
o squatter camp (Wilderness Heights), informal dwellings
(Touwsranten, Kleinkrantz)
o electrical transformer stations,
Page 85
71
o institutional buildings and schools.
5.3 ANALYSIS OF QUANTITY OF FIRE STATIONS, SUB-STATIONS AND CONTROL CENTRES
The purpose of these questions was to determine where in the EDM area the
stations, sub-stations and control centres are situated and the quantity of each.
In designing a new operational structure it is important to know the number of
stations and where they are situated due to the cost factor in creating new
stations. Some of the stations are already situated on the main routes of the
area.
Table 5.2 shows the quantity of fire stations, sub-stations and control centres in
the EDM area:
TABLE 5.2 – FIRE STATIONS, SUB-STATIONS AND CONTROL ROOMS
Lang
eber
g
Mos
sel B
ay
Geo
rge
Oud
tsho
orn
Kny
sna
Bito
u
EDM
Fire Stations 0 1 1 1 1 1 1
Sub-stations 0 1 0 0 1 1 2
Satellite 0 0 0 0 2 1 6
Control Centres 0 1 1 1 1 1 1
Source: Otto: 2004
Due to the responsibility of the EDM to provide a full range of fire fighting
services in the DMA and in the Kannaland Municipality as well as for combating
veld and mountain fires in all local municipalities, they have satellite stations in
the area. Control centers with call-taking facilities are located in all centres,
except in Langeberg, and are manned on a 24-hour basis by full time staff. The
Oudtshoorn centre does not appear to be manned at all times. Fire stations are
mainly situated in the different main towns.
Page 86
72
5.4 ANALYSIS OF FIRE SERVICES EXPENDITURE The fire fighting services are the “poor man” of the municipalities due to the fact
that very little capital expenditure has been channelled to the fire services for
several years. Table 5.3 shows the total operating expenditure of a municipality
with the fire fighting expenditure of the same municipality.
TABLE 5.3 – MUNICIPAL TOTAL OPERATING EXPENDITURE AND FIRE SERVICES OPERATING EXPENDITURE
Code Municipality
Municipal Total
Operating
Expenditure
2002/2003
Fire Fighting
Operating
Expenditure
2002/2003
Municipal
Total
Operating
Expenditure
2003/2004
Fire Fighting
Operating
Expenditure
2003/2004
WC041 Kannaland - - - -
WC042 Langeberg - 100 000 - 108 000
WC043 Mossel Bay 156 154 822 3 798 757 169 147 557 3 954 929
WC044 George 257 800 000 2 600 000 312 000 000 2 960 000
WC045 Oudtshoorn 87 446 135 264 454 101 748 206 277 913
WC047 Bitou 76 173 826 1 394 165 86 440 859 2 508 240
WC048 Knysna 137 862 750 2 366 130 158 692 280 2 649 100
DC4 Eden District 38 601 693 3 873 578 44 579 933 4 299 673
Source: WC042 (Maddison:2004)
WC043 (Botha:2004)
WC044 (Marais:2004)
WC045 (Krapohl:2004)
WC047 (Burger:2004)
WC048 (Nortier:2004)
DC4 (Zeelie:2004)
Table 5.3 indicates that the EDM fire fighting service covers 10% of the total
expenditure in 2003/2004. The EDM is also responsible for fire fighting services
in the rural areas, Kannaland and Langeberg.
The fire service is labour intensive and as may be expected, staff costs that
include allowances for part-time staff, uniforms and protective clothing,
generally account for between 60% and 85% (average 75%) of the total
operating budget of the service. As the fire services are subsidised services,
Page 87
73
any improvements or expansion of these services will have important
implications for municipal operating budgets and will directly impact on rates.
It will be equally significant to note the impact that future capital charges will
have on operating budgets due to the need for capitalisation and
recapitalisation of fire services inventory.
By using the tables above an estimation on conversion costs for existing
municipal premises into sub-stations or satellite stations may be in the order of
R250 000 to R300 000 each. The general operating costs, excluding staff costs
per station, may be in the order of between R90 000 and R100 000 per annum.
With raising external costs many operating expenditures may have been
effectively reduced. The fire fighting services are mainly funded by revenue in
the form of taxes or the services are charged by tariffs and accounts have been
sent out to clients. The payment of these accounts is very slow due to the fact
that some accounts must be paid by insurance companies and others by the
person himself. The public are not educated or mind shifted to acknowledge
that they should pay for a fire fighting service.
5.5 ANALYSIS OF MANPOWER The manpower of a fire fighting service of a municipality differs from other
municipal departments and is most often overlooked by decision makers. The
fire services are provided at full operational capacity, 24 hours per day and
seven days per week. Depending on the particular shift system employed and
when leave and illness is taken into account, this therefore translates into an
available or on-duty complement of (less than) 25 percent or 33 percent of the
total manpower reflected on the staff establishment of the municipality.
The purpose of these questions asked in the questionnaire was to emphasize
the factors relating to fire fighting effectiveness. It was necessary to know if
there is suitable leadership and what the levels of knowledge and skills in
management are. The main indicators in this regard are qualifications and the
amount and level(s) of training received. If levels of training provide the criterion
for manpower effectiveness, there should be no distinction between full-time
Page 88
74
staff, part-time staff and volunteers. The reliability of volunteers/reservists
reporting for duty is generally recognised to be a planning and organisational
problem.
TABLE 5.4 – EDM OPERATIONAL MANPOWER PROFILE
EDM Operational Manpower Profile
(excl CFO)
(training relates to formal training only)
Lang
eber
g M
unic
ipal
ity
Mos
sel B
ay M
unic
ipal
ity
Geo
rge
Mun
icip
ality
Oud
tsho
orn
Mun
icip
ality
Kny
sna
Mun
icip
ality
Bito
u M
unic
ipal
ity
ED
M
Full time Staff
Qualified/Trained leadership 0 3 2 0 0 2 4
Unqualified and untrained leadership 0 0 0 0 0 0 0
Qualified/ trained fire fighters 0 22 4 0 3 5 6
Unqualified/untrained fire fighters 0 1 6 1 13 0 0
Part time Staff, Reservists and Volunteers
Qualified/trained leadership 0 0 0 0 0 0 0
Unqualified and untrained leadership 0 0 0 0 0 0 0
Qualified/trained fire fighters 0 0 0 0 0 0 0
Unqualified/untrained fire fighters 9 11 0 10 28 15 12
Source: Otto:2004
Table 5.4 indicates that the majority of full-time fire fighters in the district only
have skills-based training. Operational safety and effectiveness require that
officers are also equipped with knowledge-based qualifications. The EDM area
does not have any dedicated fire prevention officers and no operational capacity
to assist in this function (Otto, personal communication, 2004).
The standard number of crew members for all structural fire fighting vehicles is
four. Due to manpower constraints, there may be significant differences in
crewing configurations of fire fighting vehicles that may generally vary between
two and four members per vehicle. Table 5.4 indicates that there are a total of
seventy two full-time fire fighters and 29 percent are not qualified or trained.
Page 89
75
Plettenberg Bay, Knysna, George and Mossel Bay and the District Municipality
each has a small core of full-time fire staff with the remainder of the
complement being made up of part-time staff. Langeberg, Kannaland and
Oudtshoorn Municipalities have very basic part-time staffing arrangements. Due
to the fact that some of the Municipalities are not providing fire cover to all risks
located within their boundaries, the very limited District Municipality resources
must often respond over excessive distances to deal with emergencies. All the
part-time or volunteer workers are untrained.
5.6 CONCLUSION The fire services in the rural areas are generally under resourced and the man-
power levels are very low. The shortage in resources may result in reduced
effectiveness in all level risks of fires. Local municipalities are extremely
fragmented by both geography and distance that will limit the utility and
effectiveness of operation agreements. Due to all the facts, it is very important
that all functions are standardised and the service standards determined.
Chapter 6 addresses the risk profile and capacity assessment analysis of the
current fire services in the EDM area.
Page 90
76
CHAPTER 6
RISK PROFILE AND CAPACITY ANALYSIS
6.1 INTRODUCTION Hellriegel et al. (2001:150) define risk as the condition under which individuals
can define a problem, specify the probability of certain events, identify
alternative solutions and state the probability of each solution leading to the
desired result.
The definition of risk points out that risk includes the concept of acceptable risk,
usually based on low probability evaluations and even sacrificial policy. When
decisions are taken on such a basis, albeit rational, it would be important that
such decisions are communicated to the affected parties or communities. In
these terms it would appear reasonable for a municipality to provide emergency
services that would reflect the general risks within a specified area.
Extraordinary risks would therefore be treated in terms of “the polluter pays”-
principle by which special measures may be imposed by the relevant parties
(ODS Consultants; 2004:29).
Risk is therefore pervasive and cannot be avoided. The nature and the cause of
the risk may change over time, as the extent of the damage or reward that may
result may also change (ODS Consultants; 2004:9).
This chapter addresses the following sub-problem: Risk profile and capacity assessment analysis of the current fire services in the EDM area. Part of
this investigation included a risk profile and risk analysis. This analysis was
done by:
• Interviews with fire services management officials,
• Personal site and area inspection and observations,
• Local information bureaus and publications,
• Department of Surveys and local maps,
• Internet research.
Page 91
77
Slack et al. (2001:604) state that a prerequisite for benchmarking success in an
organisation is to understand thoroughly that organisation’s processes and also
to look at what is already available. Therefore it is very important to know what
the area looks like, how many people are staying in the EDM area, what
resources they have and what the climate and the infrastructure are.
6.2 CLIMATE The EDM area has a moderate climate with rainfall occurring throughout the
year. The Little Karoo experiences the least rainfall in the EDM area with annual
rainfall of less than 400mm per year. The average rainfall of the Outeniqua
region is between 700mm and 1200mm per year. The average temperature for
coastal areas is between 14.6°C and 20.7°C. The Karoo is the warmest region
experiencing temperature variances of between 15°C and 17°C. Winds are
predominantly south-east and south-west
(www.routes.co.za/nature/ecoregions/fynbosmountains; 2005)
The western area experiences more wind than the central and eastern regions.
The influence of the sea results in moderate temperature ranges along the
coastal zone and coastal platform. Summer berg winds result in very hot
periods which, in the absence of rainfall, increase the risk and occurrence of
mountain and field fires throughout the region. Lower temperatures are
experienced at increased altitude in the mountains (Van Wyk, personal
communication, 2004).
The risk of flash floods occurs in the valleys that cut deeply through the coastal
plains throughout the region. There is also a risk of general flooding throughout
the district; however, the low-lying eastern regions and especially the lake area
around Sedgefield are especially susceptible. Flooding generally contributes to
various forms of environmental degradation (Van Wyk, personal
communication, 2004).
Coastal and low lying areas in the central and eastern regions experience
dense fog and mist during late autumn and early winter (May/June), posing a
high risk of road accidents from the vicinity of Mossel Bay to Plettenberg Bay
(Van Wyk, personal communication, 2004).
Page 92
78
In terms of the disaster management plan, it is very important to do climate
monitoring and the provision of early warnings to relevant sectors and/or
population groupings (Otto, personal Communications, 2004).
6.3 GEOPHYSICAL PROFILE
The geophysical profile of the EDM area has three characteristics namely the
coastal platform, upper plateaux and mountains.
6.3.1 Coastal Platform The coastal platform varies from flat to undulating with a width of about 40km in
the west in the Langeberg region to about five kilometres in the central and
eastern areas of the district. The coastal platform terminates at the foothills of
the mountain ranges and averages 230m in altitude. The main rivers and their
tributaries and deeply incised valleys partition and compartmentalise this
platform limiting road access across the plain and to coastal settlements. Most
valleys are densely vegetated in contrast to the plateau.
The entire length of the southern boundary of the Eden District comprises
coastline and the river mouths, estuaries and lagoons support an established
and growing marine culture industry comprising mussel, oyster, abalone and
seaweed production.
Maritime accidents and disasters fall outside the jurisdiction of the local
Municipalities; local authorities are nonetheless often exposed to the
consequences of such events. The National Sea Rescue Institute is responsible
for all maritime accidents.
6.3.2 Upper Plateaux These plateaux, averaging an altitude of about 400m, form the Klein Karoo and
occur inland between the Outeniqua and Swartberg mountains. The Kannaland
plateau in the west represents a sub-region of the Klein Karoo and is separated
from the Oudhtshoorn region by the Rooiberge.
Page 93
79
6.3.3 Mountains Foothills and mountain ranges that traverse the area from west to east
characterise the EDM and account for the greatest percentage of the total land
area. The Langeberg and Outeniqua Mountain ranges form a natural barrier,
separating the coastal region from the Little Karoo, with the Klein Swartberg,
Groot Swartberg and Kouga Mountains generally forming the northern boundary
of the district. The Langkloof Mountains in the east separate the narrow coastal
plain from the mountainous interior.
The Rooiberge in the west form an intermediate mountain range while the
Kammanassie and Kouga Mountains east of Oudtshoorn define the eastern
geophysical boundary of the Klein Karoo. The lower reaches of mountains are
variously wooded or populated by fynbos.
6.3.4 Vegetation Invasive alien vegetation of various exotic types is found throughout the district,
occurring with indigenous plant types and species. Indigenous vegetation
includes fynbos species, Karoo shrub and Afro-montane forest. Fynbos includes
mountain fynbos, coastal fynbos and renosterveld that occur from mountainous
regions through coastal plains to the marine interface
(www.plantzaafrica.com/vegetation; 2005)
Various types of thicket are found where there is fire protection and specifically
in disturbed ground, dry river valleys and interspersed with fynbos in dune
sands along the coast. The regional biosphere is variously described as being
threatened and endangered.
The EDM area has several important conservation areas and National Parks
occur throughout and including all local municipal areas; the main ones being:
• Gamka Mountain Nature Reserve 10 428 ha
• Goukamma Nature and Marine Reserve 2 500 ha
• Grootvadersbosch Nature Reserve 250 ha
• Boosmansbos Wilderness Area 15 202 ha
• Baviaanskloof Wilderness Area 15 321 ha
• Kammanassie Nature Reserve 49 430 ha
Page 94
80
• Keurbooms River Nature Reserve 740 ha
• Outeniqua Nature Reserve 38 000 ha
• Robberg Nature and Marine Reserve 1 897 ha
• Swartberg Nature Reserve 121 000 ha
• Gamkapoort Nature Reserve 8 000 ha
• Doring Rivier Wilderness Area 12 519 ha
• Rooiberg Nature Reserve 12 839 ha
• Knysna National Lake Area 15 000 ha
• Wilderness National Park 2 500 ha
• Tsitsikamma National Park 10 600 ha
(www.capenature.org.za; 2005).
Afro-montane forests occur in the south-eastern coastal part of the district from
George to Bitou (Plettenberg Bay) and cover about 60 500ha, with the greatest
consolidation occurring near Knysna. The forests with their high humidity, along
with their herbaceous plant layers and fire tolerant fringes, rarely burn, except in
very hot and windy conditions (www.plantzaafrica.com/vegetation; 2005). Table
6.1 shows the predominant regional vegetation features.
TABLE 6.1 – REGIONAL VEGETATION FEATURES.
Region Vegetation features
Langeberg Plantations, grassland, thicket and bush land, shrub land, low
fynbos and farmland.
Mossel Bay Shrub land, low fynbos and farmland
George Forest,plantation and farmland
Knysna Forest, plantation and farmland
Bitou Forest, plantation and farmland
Oudtshoorn Shrub land and low fynbos, grassland and farmland
Kannaland Grassland, shrub land and low fynbos and farmland
DMA Grassland, shrub land and low fynbos, plantation and farmland
Source: ODS Consultants (2004:17).
Seasonal fires in natural vegetation and open grazing land are predictable with
a high percentage being attributed to the human element. The high percentage
Page 95
81
of exotic species has a tendency of achieving higher than normal combustion
temperatures, greater flame heights and the rapid propagation of fires even in
otherwise resistant plant species (Van Wyk, personal interview, 2004).
Forestry and timber plantations are the predominant coverage in the area from
George to Knysna. Plantations in the Outeniqua region cover about 80 000ha
with substantial coverage occurring around Uniondale and in the foothills of the
Langeberg Mountains. The weeding out of alien vegetation through the
“Working for Water” programme has resulted in the dense accumulation of dead
combustible vegetation in many mountain catchments areas, adding to the
localised intensity of many fires (Van Wyk, personal interview, 2004).
6.4 INFRASTRUCTURE The Eden District Municipality covers a vast area with seven large municipalities
to consider and to work with. Links are created not via networks, but still in the
old way through hundreds of meetings. The opportunity is there, but to convince
people to redraw their mental maps will be a mammoth task.
Table 6.2 presents the demographics of the EDM area.
TABLE 6.2 – THE EDM DEMOGRAPHICS
Population % of
Population Total
Households
Total Formal
Dwellings
% Formal Dwellings of
Total Households
Total Informal
Dwellings
% Informal Dwellings of
Total Households
Bitou 29 184 6,42 8 759 7 156 81,7 1 604 18,31
DMA 14 597 3,21 3 528 3 454 97,9 71 2,01
George 135 415 29,77 35 525 29 247 82,3 6 245 17,58
Kannaland 23 970 5,27 6 062 5 877 97,2 188 3,10
Knysna 51 472 11,31 14 731 10 931 74,2 3 792 25,74
Langeberg 44 104 9,69 12 510 11 891 98,4 618 4,94
Mossel Bay 71 494 15,72 20 059 17 204 85,7 2 851 14,21
Oudtshoorn 84 685 18,62 18 123 16 538 91,2 1 585 8,75
TOTAL 454 921 100 119 307 102 298 85,7 16 954 14,21
Source: www.statssa.gov.za/census01 (2005).
The following are important points relating to district demographics:
Page 96
82
• Almost 57% of the total population and about 66% of all dwellings (12% of
which are informal) are found within a ten-kilometre belt from the coast on a
narrow coastal plateau, stretching from Mossel Bay to Bitou,
• The vast majority of the population is urbanised.
• Over 85% of all informal dwellings in the EDM area is found in the Mossel
Bay to Bitou areas.
• The region experiences a high average of in-migration and growth rates.
• George also represents the industrial, commercial and institutional hub of
the district.
• The region from Mossel Bay to Bitou also provides a similar percentage of
essential services and infrastructure including roads, bridges, energy
distribution, communications, water reticulation, sewage treatment and state,
municipal and private institutions.
• The municipalities of George (29,7%) and Mossel Bay (15,7%) have more
than 45% of the district population and possess the majority and greatest
diversity of commercial, industrial and manufacturing industries in the
district.
• Only 27% (Oudtshoorn 18,6%) of the total EDM population may be found
north of the Langeberg and Outeniqua Mountains.
• The Langeberg Municipality, only accommodates about 9,7% of the total
population.
• Rural population densities are generally low with the majority of the rural
population and rural settlements being directly associated with farming and
forestry activities in the region.
• The rural population in Bitou, however, makes up approximately 20% of the
total population.
• Within the ten-kilometre belt from the coast are numerous coastal resorts
which primarily provide tourist accommodation and recreational facilities.
The towns provide smaller scale institutional, commercial, retail, educational
and social structures, infrastructure and services.
• The urban distribution within local municipalities and within the EDM is very
fragmented.
• Infrastructure in terms of fire risk analysis primarily includes, but is not
limited, to all built structures, and includes built structures that accommodate
Page 97
83
the population as well as those that support and propagate human
endeavour, e.g. industries.
• Building structures are centred in towns. It is important to note that all coastal municipalities experience a substantial
influx of tourists and visitors during peak season. Figures generally describe this
population category in terms of total seasonal turnover (for example Mossel
Bay, 400 000). It would be difficult to assess actual daily or weekly averages for
each town or resort; however, this would be significant and in many instances
could more than double the resident population. Similarly, seasonal and out-of-
season promotional events provide exceptional influxes that inflate local
populations by similar proportions. Most notably, these include golfing
competitions in Bitou and George, the Knysna Oyster Festival, the Diaz Festival
and “Klein Karoo Nasionale Kunstefees” (KKNK).
The probability of fires and other emergencies in certain areas in the EDM
district is high. The lack of capacity to efficiently and effectively deal with such
emergencies presents a problem.
FIGURE 6.1 – MAP OF THE EDM AREA
Map source – www.demarcation.org.za
Page 98
84
The City of George and all main towns and rural settlements in the Eden District
are listed hereunder.
TABLE 6.3 - MAIN URBAN CENTRES AND SETTLEMENTS IN THE EDM Municipality Cities, Towns and Settlements
Kannaland Ladismith, Calitzdorp, Droëvlei, Van Wyksdorp, Zoar
Langeberg Albertinia, Gouritzmond, Heidelberg, Riversdal, Slang River, Still Bay,
Witsand/Fort Beaufort
Mossel Bay Friemersheim, Herbertsdale, Great Brak River, Mossel Bay - coastal
resorts: Vlees Bay, Boggoms Bay, Dana Bay, Hartenbos, Little Brak
River
George George, Glentana, Herold's Bay, Victoria Bay, Herold, Wilderness
Oudtshoorn De Rust/Blomnek, Dysseldorp, Oudtshoorn
Knysna Knysna, Sedgefield – coastal resorts – Brenton-on-Sea, Brenton-on-
Lake, Buffelo Bay, Noetzie
Bitou Keurboomstrand, Natures Valley, Plettenberg Bay
DMA Uniondale, Haarlem, Noll
Source: www.demarcation.org.za/ward_delimitation/FINAL/wc/munic(2005)
The listings in Table 6.3 with the map in Figure 6.1 are used as a point of
reference in future discussions. The name of the municipality will be used as the
main reference.
6.5 ROADS AND TRANSPORTATION The roads network that dissects the EDM area is dictated and limited by
mountains and deep river valleys. The roads network inland to Kannaland,
Oudtshoorn and the Demarcation Area (DMA) is restricted to a few passes
through mountain ranges. The normal road distances between major population
centres and between municipalities vary between forty kilometres to over ninety
kilometres. The roads network in the rural are is poorly connected to main roads
and other minor roads. The municipalities in the area are extremely fragmented
with numerous isolated and potentially vulnerable rural and coastal
communities.
Page 99
85
The N2-highway is the main link between municipalities along the cost and
coastal plateau. The N2 is also the important transit routé to the Eastern Cape
and to the Cape Town Metropolitan area. Other important routes are the N12
from George to Beaufort West via Oudtshoorn, the N9 through Uniondale to
Graaff-Reinet and the R62 from Oudtshoorn to Montagu. Table 6.4 indicates the
distances between the various towns. TABLE 6.4 - TOWN DISTRIBUTION AND TRAVEL DISTANCES IN THE EDM
Town Nearest Town Kilometres
Witsand 38km Heidelberg
Riversdal 29km
Stilbaai 40 – 42km
Vermaaklikheid 44km
Albertinia 39km
Slang River 64km
Gouritzmond 76km
Riversdal
Ladismith 99km
Gouritzmond 40km Albertinia
Mossel Bay 46km
Mossel Bay Hartenbos 10km
Groot Brak River 24km
Vleesbaai 43km
George 45km
Oudtshoorn 96km
Herold's Bay 15km
Pacaltsdorp 12km
Herold 30km
Wilderness 15km
Sedgefield 38km
Knysna 60km
George
Oudtshoorn 61km
Dysseldorp 24km
De Rust 35km
Calitzdorp 53km
Oudtshoorn
Ladismith 99km
Zoar 19km Ladismith
Calitzdorp 46km
Sedgefield 22km – Karatara 18km Knysna
Karatara 28km
Page 100
86
Plettenberg Bay 39km
Wittedrift 10km
The Crags 11km
Plettenberg Bay
Knysna 39km
Source: www.routes.co.za/wc (2005)
Road distances between the towns of adjoining municipalities along the coastal
zone average over 40km and between adjoining municipalities exceed 53km.
Distances from coastal towns to inland urban centres average 82km (including
the negotiation of mountain passes). All roads carry private vehicles, public
passenger transport and commercial vehicles. Cargos may include raw
industrial materials, household and commercial goods, agricultural produce,
livestock and processed and manufactured products and goods. Hazardous
materials are also transported. The proximity of mountains, mountain passes
and limited bypass alternatives make the limited transportation arteries
extremely vulnerable when disruption occurs in any emergency situation.
6.6 RAIL TRANSPORT There is a single route that enters the district out of Worcester via Swellendam
and continues along the coastal plateau through all the main towns to George
and Knysna. A line passes from George over the Outeniqua Mountains to
Oudtshoorn where it branches westwards to Calitzdorp and eastwards to the
Eastern Cape Province. The coastal line between George and Knysna includes
special tourist train services. A steam train service is alleged to be the primary
cause of veld fires along the coast during the dry season (ODS Consultants;
2004:26).
6.7 AIRPORTS The George Airport is the largest commercial airport in the region and handles
both passengers and freight. There is also a commercial airport in Plettenberg
Bay and airstrips in Oudtshoorn and Riversdal (ODS Consultants; 2004:26).
Airports pose variable accident risks to populations in their immediate surrounds
and by aircraft overflights. Commercial aircraft pass over the entire district.
Accidents pose life and injury risks to passengers and the local community as
Page 101
87
well as the possibility of damage to building structures and infrastructure with
secondary environmental pollution risks. Hazardous freight and aircraft fuel
poses serious risks of fire and environmental pollution. Airport risks include
tanker vehicles with aviation fuel and the possibility of quantities of pesticides
during seasonally determined crop spraying (ODS Consultants; 2004:26).
The transportation of aviation fuels by road is very risky and can cause serious
emergencies.
6.8 FUNCTIONAL ASSESSMENT OF THE FIRE SERVICES AND GEOGRAPHICAL SERVICE PROFILE
The evaluation of the capacity of a fire service is very important due to the fact
that it provides an overview of the functions performed by the fire services in the
district. This investigation evaluated their actual ability to effectively perform the
relevant functions to acceptable standards. Capacity in this instance relates to
the required manpower, training, skills, vehicles, machinery, equipment, tools
and infrastructural capacity to efficiently and effectively prevent, mitigate, control
and deal with all emergencies (ODS Consultants; 2004:32). The following table
identifies only the primary activities done by a fire service.
TABLE 6.5 – ASSESSMENT OF FUNCTIONAL EFFECTIVENESS
ASSESSMENT OF FUNCTIONAL EFFECTIVENESS FOR
THE MAIN URBAN AREA ONLY
Lang
eber
g M
unic
ipal
ity
Mos
sel B
ay M
unic
ipal
ity
Geo
rge
Mun
icip
ality
Oud
tsho
orn
Mun
icip
ality
Kny
sna
Mun
icip
ality
Bito
u M
unic
ipal
ity
Kan
nala
nd M
unic
ipal
ity
DM
A
Fire Risk Categories (fire fighting)
Category A – Extensive CBDs commercial and industrial
areas X 2 2 1 X X X X
Category B – Limited CBDs commercial and industrial
areas 1 2 2 1 2 2 1 2
Category C – Conventional residential areas 1 3 3 2 3 3 2 3
Category D – Remote rural areas of limited buildings 0 1 1 1 1 1 1 2
Category E – Special risks (over and above predominant 0 1 1 0 1 1 0 1
Page 102
88
risks)
Veld and mountain fires 0 2 2 2 2 2 2 3
Fire safety
Building plans scrutiny 0 3 3 0 3 3 0 0
Building construction inspections 0 3 2 0 2 3 0 0
Rational design appraisal 0 3 2 0 2 2 0 0
Fire prevention inspections 0 2 2 1 2 2 0 0
Major hazard assessments and approvals 0 3 3 0 3 3 0 0
Rescue
Fire-related rescue 0 3 3 2 3 3 3 3
Automotive and industrial extrication 0 3 0 2 2 2 2 2
High angle rescue 0 3 0 0 1 1 1 1
Environmental rescue 0 2 0 0 2 2 2 2
Confined space and collapse rescue 0 2 0 0 0 0 0 0
TABLE 6.6 – RESOURCE ASSESSMENT FOR STRUCTURE FIRES
RESOURCE ASSESSMENT FOR STRUCTURE FIRES IN
THE MAIN URBAN AREA ONLY
Due to inadequate resources throughout, all other urban
centres and rural areas in local municipalities were not
scored
Lang
eber
g M
unic
ipal
ity
Mos
sel B
ay M
unic
ipal
ity
Geo
rge
Mun
icip
ality
Oud
tsho
orn
Mun
icip
ality
Kny
sna
Mun
icip
ality
Bito
u M
unic
ipal
ity
Kan
nala
nd M
unic
ipal
ity
DM
A
Structural fire-fighting vehicles 1 2 3 2 2 2 1 3
Veld fire-fighting vehicles 1 2 2 1 2 3 3 3
General fire-fighting equipment 0 3 3 2 3 3 1 2
Flammable liquid fire-fighting equipment 0 4 1 1 4 3 0 1
Rescue vehicles 0 2 0 0 0 2 0 0
Accident rescue equipment 0 3 0 1 3 3 1 3
Environmental rescue equipment 0 2 0 0 2 2 0 1
HAZMAT equipment 0 3 1 0 3 3 0 2
Protective clothing and safety equipment 1 3 3 3 3 3 3 3
Breathing apparatus 1 3 3 3 4 3 3 3
Trained leadership 0 3 2 0 2 2 1 2
Trained manpower 0 3 2 0 2 2 2 2
Structural/specialist fire fighting average 1 3 3 1 3 3 2 2
Accident/environmental rescue average 0 3 0 2 3 3 2 2
Hazardous substances average 0 3 3 0 3 3 2 2
Note: The legend
Page 103
89
X - not applicable
0 - <10% effectiveness
1 - 10 – 25% effectiveness
2 - 26 – 50% effectiveness
3 - 51 – 75% effectiveness
4 - >75% effectiveness
Source: ODS Consultants (2004:33)
With reference to Tables 6.5 and 6.6 Langeberg municipality will be discussed:
• Langeberg municipality performs a rudimentary, ad hoc structural fire
fighting function but only has the capacity to mitigate small to medium-
sized veld fires. Other fires may be mitigated by chance and if attended
during the very early stages of their development.
• Vehicles and equipment are basic and no formal training of staff is
evident.
• The maintenance profile of resources is low and there is no dedicated
call-taking centre or fire administration.
• The municipality has no trained leadership as in a Chief Fire Officer
appointed in terms of the Fire Brigade Services Act, 1987.
• The municipality has no training and little practical capacity for fire
fighting other than for small to medium-ized veld fires.
• It has no capacity to attend chemical fires or hazardous substance
emergencies.
• There is no fire safety (fire prevention) capacity. Planned scrutiny, fire
inspections and enforcement occur via the building control department
without fire service input or recommendations.
• The municipality does not have the resources or training and does not
perform rescues of any type.
Page 104
90
TABLE 6.7 – MAIN FIRE FIGHTING RESOURCES IN THE EDM
Kan
nala
nd
Lang
eber
g
Mos
sel B
ay
Geo
rge
Oud
tsho
orn
Bito
u
Kny
sna
DM
A
EDM
(Geo
rge)
Major/Heavy Pumps (3850 ℓ/min) 1
Medium Pumps (2250 ℓ/min) 2 1 1 2
Light Pumps (<2250 ℓ/min) 1 2 1 1 1
2 x 4 Bush Fire Unit 2 1 4
4 x 4 Bush Fire Unit 1 2 1 3 3 10
Rescue Vehicle 1 1
HAZMAT Vehicle
Water Tanker 2 1 1 2 2
Aerial Appliance
Control Vehicle 1 1
Trailer (specify) 3f 1c 1c 1c 3c
B/A Compressor 1 1 1 1
Power Generator 2 4 1 2 2 2
Portable Pump 2
Floating Pump 2 2 1 2 2
Power Cutting Tools 1 1 5
Fire Hose 2 57 60 10 60 41
Branches 11 12 1 16 7 8
Ropes and Lines 4 1 1set
Ladders 2 4 3 1 6 2
Breathing Apparatus 2 10 12 6 10 21 12
Foam-Making Equipment 13 1 3 4 2
Power Rescue Tools 3 1 1 2
Pneumatic Rescue Equipment 3 2 3
First Aid/Life Support Equipment 1
Fire Station 2 1 1 1 4 1
Lecture Hall 1 1 1
Training Facilities
Chief Fire Officer 1 1 1
Deputising Officer
Fire Prevention Officer
Training Officer
Control Room Operator 1 4 1 4 3 5
Administration/Clerk 1
Operational Officer 3 2 2 4
Fire fighter 23 10 1 5 16 6
Reservist/Volunteer 9 11 10 15 28 12
Page 105
91
Note : Legend
denotes combination pumper/tanker
denotes vehicles in George and EDM rural area
f denotes fire trailers
c denotes HAZMAT trailer
Source: ODS Consultants (2004:43).
The following are interesting facts from Table 6.7:
• All the conventional pumpers in the district are older than 15 years with an
average age of over 20 years.
• The conventional pumpers are maintained at constant gross weight, that is
fully laden with equipment, water and materials from the date of commission.
• Pumpers are expected to perform at peak engine revolutions in all seasons
and weather conditions without the benefit of “warming up”.
• The chief fire officers and operational officers of the individual municipal fire
services are presently performing fire prevention functions. With the
increase of the area and complexity of all municipalities and the increase in
the numbers of emergencies attended, fire prevention functions have
generally been neglected. This function should have dedicated, specialist
staff and resources and should perform the full range of fire prevention
activities in terms of those described in SANS 10090:2003.
• The fire services do not generally operate on independent and secure
communications, but radio coverage is reasonably extensive except in
mountainous areas.
• Each Municipality has its own shift systems resulting in differing fire station
configurations.
• Accommodation for on-duty staff is provided in Mossel Bay, George, Knysna
and Plettenberg Bay only.
• Lecture facilities are located in most fire stations or alternative venues are
readily available, however.
• There are no municipal fire training facilities in the district.
• Only three chief fire fighting staff in the EDM area.
• Only two rescue vehicles operate in the area.
Page 106
92
• The Oudtshoorn Municipality has a single medium-pumping capacity vehicle
and the necessary equipment to attend low risk and limited moderate- and
high-risk emergencies.
• Veld fire fighting in the Oudtshoorn Municipal boundaries is very limited.
• Mossel Bay Municipality has one medium fire appliance with two support
vehicles that do not appear to be fully serviceable and are thus of
questionable reliability.
• The George Municipality has two medium pumpers supported by a water
tanker/pumper which constitute the predominant of the fire fighting capacity
at George.
• The Bitou Municipality possesses a satisfactory array of vehicles for
conducting veld fire operations; however, only a single light pumper is
available for structural fire fighting.
• The Langeberg Municipality has a light GMC pumper that is situated in
Riversdal and is in reasonable condition; otherwise, the effectiveness and/or
serviceability of most other fire fighting resources are viewed with
considerable reserve.
• The Knysna fire department has the capacity to confidently combat only low
risk fires with a single light pumper and may manage small fires of moderate
risks.
• The EDM has limited rescue equipment and HAZMAT resources.
6.9 CONCLUSION This analysis should stimulate the exploration of rational alternatives and also
enable a planned approach for the cost-effective extensions of functions and
services in all areas. Risk profile illustrates that all local municipalities are
extremely fragmented by both geography and distances between towns and
settlements.
The shortage in resources may result in reduced effectiveness in mitigating
large low-risk fires, small moderate-risk fires and most high-risk fires.
Using the information of other fire fighting services and that of the EDM area, a
suggested organisational structure is presented in chapter 7.This chapter will be
looking at the implications of the supply-side and demand-side factors of
Page 107
93
location. To be a competitive fire fighting service, the five performance
objectives must be applied.
Page 108
94
CHAPTER 7
SUMMARY AND CONCLUSION
7.1 INTRODUCTION Perhaps the greatest change evident in the way that public services will look
from a perspective of twenty years hence is that there is likely to be a much
more logical and end-user focused approach to the way in which organisations
operate. The current model, which typically sees a split of provision and
responsibility across national, regional and sometimes local boundaries, is
going to be challenged, possibly to the point of extinction (Milner; 2000:177).
Eddie Obeng (1997:198) states that you can find new ways of delivering old
needs: you already know who the customers are, where they are and what
colour underpants they wear. It is all out there for the taking, but the real barrier
is in your imagination. To be able to go virtual, you will need to redraw your
mental maps. We need to build new mental maps. The opportunity is there but
to convince people to redraw their mental maps will be a huge task.
In the language of the Chinese people there is a saying that goes like this: “May
you live in interesting times.” According to their tradition this is considered to be
a curse. Interesting times can be seen as a curse, because they often bring
about change and chaos. They are times when old ways of doing things no
longer apply and people need new approaches and perspectives (Melnyk &
Denzler; 1996:16).
The implementation of a fire fighting service operational structure will be a new
approach for fire fighting in the EDM area. This research did not include a study
of the legal framework in which the fire fighting service must operate. The legal
framework stipulates the following issues:
Executive authority for fire fighting services as specified by the
Constitution of the Republic of South Africa (Act 108 of 1996),
Page 109
95
The prescribed requirements and processes for deciding on a
mechanism for service delivery by the Municipal Systems Act (Act 32 of 2000),
The division of functions and powers relating to fire fighting services
between the district municipality and local municipalities by the
Municipal Structures Act (Act 117 of 1998), The Fire Brigade Services Act (Act 99 of 1987) that defines the
functions of a fire fighting service (ODS Consultants, 2004:9).
The above mentioned issues cannot be changed like an organisational
structure, but to be objective in creating a new structure the above mentioned
legal requirements have been taken into consideration. The division of powers
between the Eden District Municipality and the other seven local municipalities
is still a struggle for power and will not be solved in the near future. This
struggle for power also impacts on the morale of the fire fighters because they
feel that there is no actual direction due to a clumsy structure and an ineffective
centralising or decentralising of decision making. Therefore it is important to
create a new organisational structure that includes both district and local
municipalities. There is no definite division of boundaries when it comes to a
disaster in the rural areas.
7.2 ORGANISATIONAL STRUCTURE The movement towards tighter and leaner organisations has drawn attention to
the importance of alternative forms of structure, and has placed increased
emphasis on the demand for flexibility. Due to the revolutionary changes in
organisations, the need is great for new and flexible structures. It is therefore
very important to create a fire fighting management structure that will comprise
all aspects of the EDM area, including the diversity of the environment.
The new structure should include some characteristics of the bureaucratic
organisational structure, namely the flat organisation, virtual organisation,
network organisation and the geographic structure.
Thomson and Strickland (1999:291) state that a geographic organisation, as a
structure, suits firms pursuing different strategies in different geographic regions
Page 110
96
well. Due to the geographic diversity, this structure is the one to use as it will
promote improved performance. The primary advantage is to focus on customer
needs and provide faster, better service. The duplication of parts of the
organisation structure will be expensive, but the needs of a specific area will be
attended to and will result in faster and better service.
The geographic structure will be the design for both the District Municipality and
the other seven municipalities. The available manpower will be divided into
geographical areas according to the risks in that specific area. Table 7.1 shows
the available manpower and Table 7.2 the different areas:
TABLE 7.1 - TOTAL MANPOWER STATISTICS.
Rank Total Chief Fire Officer 3
Deputising Officer 0
Fire Prevention Officer 0
Training Officer 0
Control Room Operator 18
Administration/Clerk 1
Operational Officer 11
Fire fighter 61
Reservist/Volunteer 85
Source: Otto (2004)
TABLE 7.2 - IDENTIFICATION OF THE THREE GEOGRAPHICAL AREAS Municipality Cities, Towns and Settlements
UPPER PLATEAUX
Kannaland LADISMITH, CALITZDORP, DROËVLEI, VAN WYKSDORP,
ZOAR
Oudtshoorn De Rust/Blomnek, Dysseldorp, Oudtshoorn
DMA Uniondale, Haarlem, Noll
Coastal Platform A
Langeberg Albertinia, Gouritzmond, Heidelberg, Riversdal, Slang River, Still
Bay, Witsand/Fort Beaufort
Mossel Bay Friemersheim, Herbertsdale, Great Brak River, Mossel Bay -
Page 111
97
coastal resorts: Vlees Bay, Boggoms Bay, Dana Bay,
Hartenbos, Little Brak River
Coastal Platform B
George George, Glentana, Herold's Bay, Victoria Bay, Herold,
Wilderness
Knysna Knysna, Sedgefield – coastal resorts – Brenton-on-Sea,
Brenton-on-Lake, Buffels Bay, Noetzie
Bitou Keurboomstrand, Natures Valley, Plettenberg Bay
Source: ODS Consultant (2004:20).
TABLE 7.3 - DEMOGRAPHICS OF EDM DIVIDED INTO THE THREE AREAS
Population Total
Households
Total
Formal
Dwellings
Total
Informal
Dwellings
Upper
Plateaux
123 246 27 713 25 869 1 844
Coastal
Platform A
115 604 32 569 29 095 3 469
Coastal
Platform B
216 056 59 015 47 334 11 641
Source: (www.statssa.gov.za/census01 (2005).
As shown in the above tables the EDM area is divided into three parts by rivers
and mountains. The areas are nearly the same size, with the same number of
dwellings. The upper plateaux that are situated between the Outeniqua
mountain and the Swartberg mountain are smaller than the other two, but the
infrastructure is not so developed as on the other side of the mountain. Table
7.2 divides all the towns into three areas and Table 7.3 is the total population,
households and dwellings per area. Figure 7.1 shows the possible organisation
structure for the EDM fire fighting area:
Page 112
98
FIGURE 7.1 - GEOGRAPHIC ORGANISATIONAL STRUCTURE OF EDM AREA
Fire Stations
Source: Adapted from http://www.courses.bus.msu/materials/1022/ch11a.ppt
The regional operations will be divided into Regional Commander Upper
Plateaux, Regional Commander Coastal Plateaux A and Regional Commander
Coastal Plateaux B.
FIGURE 7.2 – REGIONAL COMMANDER COASTAL PLATEAUX A
Source: Adapted from Figure 2.1
REGIONAL COMMANDER:
COASTAL PLATEAUX A
UNIT SUPERVISOR Administrative support
SHIFT A
• Shift Leader • Fireman • Fireman
SHIFT B
• Shift Leader • Fireman • Fireman
SHIFT C
• Shift Leader • Fireman • Fireman
Administrative and
support staff Chief Fire Officer
Fire Safety C
oordinator
Regional Commander: Coastal Platform A
Regional C
omm
ander: Coastal P
latform B
Regional Commander: Upper
Plateaus
Page 113
99
Each regional command structure will look like the above structure and should
have characteristics of a bureaucratic organisational structure. This part of the
structure performs a particular high specialisation of labour. Other
characteristics are: centralised authority, top-down structure with definite
boundaries between different jobs, sections (in other word units). There can be
more than one unit supervisor with fire fighting teams, depending of the size of
the regional office. The Coastal Plateau B will have more than one unit
supervisor. George, Mossel Bay, Knysna, Bitou and Oudtshoorn, who each has
a fire station in town, can still be used as sub-stations due to their urban fire
fighting capacity and the realistic distances from them to the rural areas.
The Sacramento Metropolitan Fire District is also divided into districts and is
much larger than our local fire fighting services. The success of having 38 fire
stations, 673 paid personnel to cope with 56 700 call outs and the system of
working in districts, shows that the geographical model can work.
The Metropolitan Police Department also converted to a geographical
organisational structure. The new structure created a more streamlined
organisation that promotes teamwork, communication and accountability. They
could focus on what they really must do. If the fire fighting services in the EDM
area transform to a new structure, they will also be able to perform all the
functions according to the Fire Brigade Services Act (Act 99 of 1987). The fire
services must include the total package of fire services policies, functions, sub-
functions and related activities, which are:
Fire prevention,
Fire fighting,
Rescue,
Support and allied activities including,
Risk profile of the area of jurisdiction (risk categories),
Call receipt and processing requirements (including
communications),
Vehicle/equipment availability and maintenance,
Incident management procedures,
Pre-fire planning and risk visits,
Training/personnel,
Page 114
100
Water supplies,
Fire safety (fire prevention) functions and,
Occupational health and safety.
The new EDM fire fighting service organisation structure will be a flatter
structure than decentralised authority by creating the regional offices. The jobs
will be more broadly defined, with greater overlap and flexible boundaries
among the different regional offices.
The area from George to Knysna is predominantly covered with forestry and
timber plantations. Plantations in the Outeniqua region cover about 80 000ha
with substantial coverage occurring around Uniondale and in the foothills of the
Langeberg Mountains. The weeding out of alien vegetation has resulted in the
dense accumulation of dead combustible vegetation in many mountain
catchment areas, adding to the localised intensity of many fires (ODS
Consultants; 2004:18).
Mountain fires are regular seasonal occurrences and due to their inaccessibility,
height, steep slopes, ravines, gorges and isolated valleys, they pose serious
safety risks to fire fighters and isolated communities alike. Mountain fires also
destabilise rock faces and significantly contribute to rock falls and erosion. This
is especially significant in mountain passes and in areas that are in close
proximity to roads and human habitation. The lack of a roads network near the
mountain areas make it very difficult to fight a fire when it is still small.
These fires create their own dynamics that include firestorms and rapid vertical
propagation, generally termed “chimney effects”. These fires, their prevention
and control require special management knowledge and skills coupled to
intimate knowledge of the terrain and local agency structures and functioning.
They most often require multi-agency attendance and due to the size of areas
involved and their complexity, will most correctly be termed and dealt with as
disaster situations. This would require high-level strategic co-ordination and
complex tactical management preceded by detailed pre-incident planning and
multilateral co-operation (agreements) (ODS Consultants; 2004:18).
Page 115
101
The Zululand Fire Protection Services (ZFPS) is a private aerial fire fighting
service that is contracted by the timber growers in Kwazulu-Natal. With
sufficient bombers available, a load could be dropped on the fire every three
minutes, which would be happening while the ground crew are still on their way.
A network organisation can be created with an organisation like ZFPS. The
ZFPS or similar organisation is highly specialised and also understands the
strategic goals of the partnership.
The ZFPS is also using the Firehawk computerised fire detection system as
described in chapter 3. The EDM fire fighting service can use such a system to
increase efficiency effectively. Due to the regular seasonal mountain fire
occurrences, these fires can be spotted by the Firehawk system when it is still
very small. The Firehawk system can be installed on the various maintain tops
and can overlook each plateau and send the images to the control room. The
Firehawk will be identifying the exact spot where the fire is by using a
geographical information system. The identification will reduce cost by
searching for the fire and will decrease the time that it usually takes to arrive at
a fire.
If all the fire fighters in the EDM area were privately employed and the
communication networks were in place, a virtual organisation would be the
organisational structure to implement. The only permanent employees would be
those in the call centre. However, due to the current lack of computer skills of
the fire fighting personnel, it would not be possible to create a virtual
organisation. If the Firehawk system is a possibility, the control room personnel
must be educated to use it successfully, due to fact that it is a computerised
system.
7.3 THE LOCATION OF CAPACITY The definition of location of capacity, Slack et al. (2001:159), is that location is
the geographical positioning of an operation relative to the input resources,
other operations or customers with which it interacts. Sometimes operations
cannot logically justify their location. Some are where they are for historical
reasons. The decision not to move is made on an assumption that the cost and
Page 116
102
disruption involved in changing location would outweigh any potential benefits of
a new location.
The two fire fighting services in George are situated almost next to each other.
Sometimes they are disputing who is going on a call out, and sometimes they
both arrive at an emergency scene.
The identification of the supply-side and demand-side factors will simplify the
decision of location. The supply-side factors as implemented in the EDM area
are identified in Table 7.4.
TABLE 7.4 – SUPPLY-SIDE FACTORS AND THEIR IMPLICATIONS
SUPPLY-SIDE FACTORS
IMPLICATIONS
Labour costs Cost of employing extra fire fighters,
Cost off relocating existing fire fighters to areas
needed.
Land costs Cost of obtaining a fire station where no other exists.
Cost of upgrading existing stations to required
standards
Energy costs The only important factor is the availability of water.
Transportation costs Cost of delivering goods such as chemicals for
submitting a fire.
Travelling cost of fire fighters if necessary.
Community factors Government financial assistance in creating a
infrastructure for emergency services.
Language will be that of the region.
The demand-side factors can influence service to/revenue from customers as
the location varies. Table 7.5 identifies the demand-side factors that exert an
influence on a location decision;
Page 117
103
TABLE 7.5 – DEMAND-SIDE FACTORS AND THEIR IMPLICATIONS
DEMAND-SIDE FACTORS IMPLICATIONS Labour skills Do the local people have the skills to be fire
fighters?
Cost of training.
Suitability of site The fire station must be on such a site to be
able to move quickly to a call out.
Easy-to-reach main roads network.
Image Must look like a professional fire fighting
service to be proud of.
Convenience for customers
(speed and dependability).
The same as suitable site.
Resources must be in a dependable working
condition.
The Metropolitan Police Department decided to restructure the entire
department and relocate responsibilities to the districts for three reasons;
• To place resources in the community,
• Focus on resources on reducing crime and solving problems in the 83 areas
(districts),
• To hold managers at every level of the organisation accountable for the
quality of policing service within their geographic commands
(http://www.dcwatch.com/police/980909.htm; 2004).
By choosing the best location and the capacity to detect fires more rapidly and
quickly, limited damage and cost will decrease with a subsequent advantage to
the customer and community.
7.4 THE FIVE PERFORMANCE OBJECTIVES Today’s business world is swept, some would say convulsed, by epic change;
whole industries dissolve and re-form before our very eyes, and technology
defies the imagination almost weekly. In such times, the great strengths are not
clairvoyance and omniscience – in short, supply is the requirement under the
best of circumstances. Great strengths are flexibility, adaptability, a capacity for
learning quickly. To be clear in business today, one does not need to be a
prophet. But when great transformations are unfolding, one does need to grasp
the opportunity first (PriceWaterhouseCoopers; 1999:2)
Page 118
104
These five performance objectives can be applied to any type of operation and
will help the fire fighting service to be more competitive within themselves and
against other fire fighting services. The five objectives can be tested by asking
the following five questions;
• Is the fire fighting service doing things right?
• Is the fire fighting service first on a scene?
• Is the fire fighting service doing things on time?
• Is the fire fighting service making changes where necessary?
• Is the fire fighting service doing there job cost-effectively?
7.4.1 Is the fire fighting service doing things right? This begs the question what the quality of the fire fighting service is. Are they
following procedures when they are fighting a fire? What is the quality of their
resources?
The vehicles and much equipment throughout the district fall into two
categories;
• Inappropriate vehicles and equipment for the intended/stated application,
• Vehicles and equipment that are redundant or nearing redundancy.
Page 119
105
TABLE 7.6 – MAIN FIRE FIGHTING RESOURCES IN THE EDM
Source:ODS Consultants (2004:43).
Table 7.6 lists only the most important resources available within the district
which are shown as totals in Table 6.8 in chapter 6. The conventional pumpers
in the district are older than 15 years with an average age of over 20 years.
Maintenance is done on a continuous base. Funding will be needed to invest in
new vehicles. Using the Firehawk will also improve the quality of the service.
DESCRIPTION
Tota
l
Major/Heavy Pumps (3850 ℓ/min) 3
Medium Pumps (2250 ℓ/min) 6
Light Pumps (<2250 ℓ/min) 6
2 x 4 Bush Fire Unit 7
4 x 4 Bush Fire Unit 17
Rescue Vehicle 2
HAZMAT Vehicle 0
Water Tanker 8
Aerial Appliance 0
Control Vehicle 2
Trailer (specify) 9
B/A Compressor 4
Power Generator 13
Portable Pump 2
Floating Pump 9
Power Cutting Tools 7
Fire Hose 230
Branches 55
Ropes and Lines 6
Ladders 18
Breathing Apparatus 73
Foam-Making Equipment 23
Power Rescue Tools 7
Pneumatic Rescue Equipment 8
First Aid/Life Support Equipment 1
Fire Station 10
Page 120
106
With the exception of the vehicles, the other equipment is in a better condition
and can safeguard an error-free service. The trained fire fighters know all the
procedures and are leaders of a fire fighting team.
The resources of the Oudtshoorn Municipality will generally be inadequate to
effectively manage any complex fire situation. Equipment may generally be
classified as rudimentary and the fire service would be unable to deal with
moderate flammable liquid fires. The Mossel Bay Municipality’s vehicles are
generally well equipped. Taking the risk profile of the municipality into account,
it is believed that the vehicle fleet and the distribution of resources are
inadequate to provide equitable services to all communities or to manage
complex or major fires with any confidence. The existing vehicles of the George
Municipality, including the other equipment, will be successful in controlling
most expected fires. Capacity, to deal with veld fires is limited but satisfactory
for the main George urban area. The Bitou Municipal fire service has extremely
limited capacity for managing fires other than medium-size low-risk and small
moderate-risk fires. General fire fighting equipment, with the exception of
structural fire rescue, is satisfactory. Knysna Municipality will be able to manage
small to medium-size veld fires with some confidence.
The EDM maintains a main fire station in George with sub-stations in Uniondale
(DMA) and Ladismith (Kannaland). There is a total of 17 LDV veld fire units in
the district. The distribution of fire fighting resources is as follows:
• De Vlugt (Bitou) – 500ℓ LDV veld fire unit,
• Uniondale – 6000ℓ tanker fire engine and 500ℓ 4 x 4 LDV veld fire unit,
• Haarlem – 500ℓ LDV veld fire unit,
• Goedehoop – 500ℓ LDV veld fire unit,
• Eensaamheid – 500ℓ LDV veld fire unit,
• Ladismith – 6000ℓ tanker unit and 750ℓ 4 x 4 LDV veld fire unit,
• Calitzdorp – 500ℓ veld fire trailer. (Otto,2004)
Water for fire fighting and the availability of fire hydrants, are important factors
to make a localisation decision for fire fighting operations as well as for the
replenishment of tanker vehicles that are virtually non-existent, except in the
Page 121
107
larger towns. The general status of water supplies in many developing towns
and in most rural and coastal settlements is tenuous.
The district generally has limited bulk water storage facilities; however, general
proximity to the coast may provide a source of water for aerial fire fighting.
7.4.2 Is the fire fighting service first on a scene? Speed is the one objective that a fire fighting service is measure by. If the fire
fighters arrive late at a fire and it destroys everything, who is to blame? Speed
reduces risks. By using the Firehawk, the first response of Zululand Fire
Protection Services is fast and reduces the risk that the fire may develop into a
disaster. The fire is identified when it is just a smoke signal. In the EDM area
the response time is not so fast due to the load of water the vehicle carries and
the mountain passes. When a fire has been reported telephonically by a
member of the public, the control room reports the fire to the nearest fire station.
The quality of the resources plays a major role in the reaction time of the fire
fighting service.
7.4.3 Is the fire fighting service doing things on time? If the local fire department is always late when it is called out to an emergency
and there is another option, the customer will phone the private fire fighting
service when needed. In terms of dependability of a fire fighting service, the
quality of the resources plays a vital role. In the EDM area the different fire
stations have an agreement that they will help if the specific station cannot help
with an emergency.
7.4.4 Is the fire fighting service making changes where necessary? Flexibility is the ability to change far enough and fast enough to meet customer
requirements. The fire fighting services is flexible in their operation when its
members are able to change shifts quickly when they are busy fighting a fire.
They have the flexibility to change over to different procedures and products
during the process of fire fighting. The poor quality of resources can have a
hampering effect on their flexibility.
Page 122
108
7.4.5 Is the fire fighting service doing its job cost effectively? Cost is the major operation objective. The lower the cost, the higher the profit,
and when it is a non-profit organisation is it good value and the cost is relative
low. Cost can be categorised as fixed cost and variable cost. The costs are
influenced by other performance objectives.
By using tax payers’ money to provide a service that is actually very expensive,
the fire fighting service must be cost-effective. When an emergency occurs and
the fire services cannot operate due to restricted resources because of a lack of
funding, everybody asks questions. But when nothing happens and the fire
service decides to buy a new fire engine, then no funding is available.
The creation, improvement and/or extension of any service as well as the
allocation of financial resources to achieve this will require the revision of the
Integrated Development Plan(s) and Council approval of anticipated changes.
Plans should or could be revised to accommodate the necessary costs
associated with the upgrading of the fire services.
Councils have therefore committed the greatest proportion of capital
expenditure to the development and extension of the necessary infrastructure in
terms of approved five-year developmental programmes. It has been noted that
the limited capital expenditures for most fire services have been financed from
revenue, a source that cannot realistically be viewed to be secure and
sustainable, especially in terms of programmes for asset capitalisation or
recapitalisation. This is also generally indicative of the quantum and terms of
capital commitment by most municipalities. While the present situation may be
understandable, it is believed that further delays may make future capitalisation
and recapitalisation of the fire services unaffordable (ODS Consultants;
2004:53).
Due to the relatively small capital allocations for fire fighting services,
expenditures have primarily entailed the purchase of minor equipment and the
upgrading of existing infrastructure. Although some light veld fire vehicles have
been procured, no provision has been made for several years towards the
replacement and upgrading of obsolete fire fighting vehicles and major
Page 123
109
equipment. At this juncture, resources are inadequate to provide for the
necessary functions as described or to support the geographical or area-wide
roll-out of services (ODS Consultants; 2004:53).
Problems in funding the fire fighting services are further compounded by various
obligations imposed on both local and district municipalities in terms of the
Local Government: Municipal Systems Act and Local Government: Municipal
Structures Act. Alternative capital funding via grant(s) may also be sourced from
the Department of Provincial and Local Government (DPLG) in terms of
Municipal Infrastructure Grants (MIG) and such alternatives may be explored. A
recent government initiative to recapitulated fire services which the Provincial
Government is administering may also be investigated. Further options include
the sourcing of local capital funding via grants from the National Lottery or via
foreign donor developmental aid. This would be especially relevant to
developing services in/for disadvantaged communities (ODS Consultants;
2004:53).
Should agreement on a centralised or co-operative service structure be
reached, it would require agreement on equitable but proportional contributions
by each participating municipality for such a service. Operating costs are
generally funded via the rates accounts of local municipalities; however, it is
believed that the option of an emergency services levy should be considered.
This is believed to be the best option in that it would be based on property
ownership and may be further aligned to the particular service delivery
standards applicable to a particular area. Various abatements may also be
considered for areas with designated services (FBSA) and in defined self-help
municipal areas. As incentives for improving fire safety, further abatements may
also be offered to industries that employ special fire safety measures (ODS
Consultants; 2004:54).
The Rural/Metro Fire Department provides a high-quality, cost-effective fire
service. Their revenue is not tax-based as the customer pays Rural/Metro an
annual fee based on the total square footage of their home. Non-members are
billed for service at the rate of $800 per hour, per apparatus, for all fire calls.
Non-member fees for a typical house fire can cost as much as 10 years’ worth
Page 124
110
of membership costs. Homeowners’ insurance usually pays only a fraction of
the bill, leaving the property owner responsible for the difference.
Thomas DiLorenzo (2003) writes the following: “The average cost to
Rural/Metro customers is 25-50 percent lower than similar services provided by
governments although very few, if any, government fire departments can match
the quality of the Rural/Metro’s services.”
(http://blog.lewrockwell.com/lewrw/archives/002233.html; 2004)
7.5 SUMMARY Finally, fires and natural disasters are often viewed to be Acts of God. This has
the tendency of diminishing the importance and significance of organised
prevention and mitigation measures such as public education and awareness of
fire safety programmes and fire prevention activities. The impact of fire on
natural vegetation or on the poorest of the poor, particularly the rural poor,
cannot be overstated. It is those living at the margins, who are always the most
vulnerable.
The need to establish an integrated plan for fire management is an important
matter. Speedy response and adequate ground support are absolutely critical
factors in fighting fires. The implementation of a new structure for the EDM area
is not simple and it will not happen overnight. The new structure will not be
effective immediately but rather be done in phases over a few months. Each
phase must be planned and implemented carefully from logistics to policies,
procedures, training and politics. The establishment of an organisational
structure must follow the decision of location which will have a major impact on
the EDM fire fighting service in the whole area.
Prior to any decisions relating to the fire fighting services, it is imperative that all
functions are standardised and service standards determined. The following are
suggestions that could be implemented:
• Establish a single district disaster management/emergency service control
centre and communications network,
• An undivided fire fighting function whereby both the Municipalities and
District Municipalities form part of the new fire fighting service,
Page 125
111
• The immediate establishment of a co-ordinating structure for the purpose of
jointly determining standards, service delivery models, regulatory
mechanisms and operating guidelines for the fire services as a whole and,
• Structures and mechanisms should be explored to streamline and improve
service co-operation in the short term which can be prolonged to the future.
Once everything is in place, the new structure will bring the fire fighting service
in line with the way fire services ideally operate. Their functions are:
• Fire fighting ( fire suppression) function,
• Rescue function,
• Hazardous Substances Emergency (HAZMAT) function,
• Fire Prevention function,
• All derived or associated functions in connection with the above.
Page 126
112
REFERENCES
Bateman, T.S. & Snell, S.A. 1999. Management. Building Competitive
Advantage. 4th ed. New York: Irwin McGraw-Hill.
Botha, H. 2004. Personal Telephonic Interview. Mossel Bay Municipality
Financial Manager.
Burger, G. 2004. Personal Telephonic Interview. Bitou Municipality Assistant
Director: Finance.
Brewster, C., Dowling, P., Grobler, P., Holland, P. & Warnich, S. 2000.
Contemporary issues in human resource management. Cape Town: Oxford
University Press.
DC Watch [The homepage of Washington Metropolitan Police Department]
[Online], Available http:// www.dcwatch.com/ [Accessed 02 November 2004].
Gerber, P.D., Haasbroek, G.D., Nel, P.S., Schultz, H.B., Sono, T., Van Dyk,
P.S.& Werner, A. 5th ed. 2001. Human resources management. Cape Town:
Oxford University Press.
Hellriegel, D., Jackson, S.E., Slocum, J., Staude, G., and Associates. 2001.
Management. South African Edition. Cape Town: Oxford University Press.
Hightower, R. 2004, November, 22. Subject: Rural/Metro information. [Online].
Personal E-mail from R. Hightower,Rural/Metro Fire Department,
<[email protected] >. Accessed: 22/11/2004.
Johnson, G. and Scholes, K. 2002. Exploring corporate strategy. 6th ed.
NJ: Prentice Hall.
Page 127
113
Kotler, P. 2000. Marketing Management. The Millennium Edition.
Upper Saddle River, New Jersey: Prentice Hall.
Kotter, J.P. 2001. What leaders really do. Harvard Business Review.88-96.
(Management/leader).
Kreitner, R., Kinicki, A., & Beulens, M. 2002. Organizational Behaviour. 2nd ed.
Berkshire: McGraw-Hill.
Krapohl, J. 2004. Personal Telephonic Interview. Oudtshoorn Municipality
Assistant Director Finance.
Laudon, K.C. & Laudon, J.P. 2002. Management information systems –
managing the digital firm. 7th ed. New Jersey: Prentice-Hall.
Leedy, P.D & Ormrod, J.E. 2001. Practical Research – Planning and Design. 7th
ed.Ohio: Prentice-Hall
Lorenzo. T. 29 Oct 2003. “Privatized Fire Fighting” [Online] Available:
http://blog.lewrockwell.com/lewrw/archives/002233.html [Accessed 01
November 2004].
Maddison, T. 2004. Personal Telephonic Interview. Langeberg Municipality
Financial Manager.
Marais, C. 2004. Personal Telephonic Interview. George Municipality Adjutant
Director Finance.
Melnyck, S.A., Denzler, D.R. 1996. Operations Management: a value driven
approach. Irwin/McGraw-Hill .
Milner, E.M. 2000. Managing information and knowledge in the public sector.
London: Routledge.
Page 128
114
Metro Fire [The homepage of Sacramento Metropolitan Fire District] [Online].
Available http:// www.smfd.ca.gov/ [Accessed 01 November 2004].
Metropolitan Police Department [The homepage of the District of Columbia DC
Metropolitan Police Department] [Online]. Available http:// www.mpdc.gov.am/
[Accessed on 30 Oct 2004].
Morris, G. 2004. Personal Internet Interview. Rural/Metro Chief Fire City of
Scottsdale Arizona.
Nortier, I. 2004. Personal Telephonic Interview. Knysna Municipality Assistant
Director Finance.
Obeng, E. 1997. New rules for the new world. London:Capstone
ODS Consultants cc; 2004. Section 78 investigation of the fire service. George.
Otto, G. 2004. Personal Telephonic Interview. Eden District Municipality Acting
Fire Chief.
Poole. N.W. 1991, “Fire Fighting for Profit” [Online]. Available:
http://www.fee.org/vnews.php/ [Accessed 01 Nov 2004].
Price Waterhouse Coopers, 1999. Six forces shaping the future of business.
Detroit: Grenville Printing
Robbins, S. P. 1989. Organizational Behavior. 8th ed. Englewood, N.J: Prentice-
Hall.
Robbins, S.P. 1982. The Management of Human Resources. 8th ed.
Englewood, N.J: Prentice-Hall.
Rural/Metro [Homepage of Rural Metro Corporation][Online] Available:
http://www.ruralmetro.com/ [01 November 2004]
Page 129
115
Schultz, H.; Bagraim, J.; Potgieter, T.; Viedge, C. & Werner, A.
2003.Organisational Behaviour. A contemporary South African Perspective.
Pretoria: Van Schaik Publishers.
Swanepoel, B., Erasmus. B., Van Wyk. M., & Schenk. H. 2000. South African
Human Resource Management Theory and Practice.2nd ed. South Africa:Juta &
Co Ltd.
Skyrme, D.J. 1999. Knowledge networking. [Online]. Available: http://
www.skyrme.com. [Accessed – 02 November 2004].
Slack, N., Chambers, S., Johnston, R. Operations management. 3rd ed.
London: Prentice-Hall
Thomson, A.A. & Strickland, A.J. 1999. Strategic Management. 11th ed. New
York: Irwin McGraw-Hill
Van Rensburg, A. 2004. Personal Telephonic Interview. Eden District
Municipality Debtors Clerk.
Van Wyk, D. 2004. Personal Communication. Eden District Municipality Acting
Station Officer
Wegner, T. 2001. Applied Business Statistics. Juta: Cape Town.
www.capenature.org.za [Accessed 7 Oct 2005].
www.courses.bus.msu.edu/materials/1022/ch11a.ppt [Accessed 23 Nov 2004]
www.demarcation.org.za [Accessed 8 Nov 2005].
www.plantzaafrica.com [Accessed 19 Nov 2005].
www.routes.co.za [Accessed 8 Oct 2005].
Page 130
116
www.statssa.gov.za/census01 [Accessed 8 Oct 2005].
Zeelie, J. 2004. Personal Telephonic Interview. Eden District Municipality
Assistant Director Finance.
Zululand Fire Protection Service. [The homepage of the Zululand Fire
Protection Service] [Online], 09 November 2004 – last update. Available: http://
www.zfps.co.za/ [Accessed 10 October 2004]
Virtual Organisations. [Online] Available:
http:www.emporia.edu.ibed/jour/jourz3ot/cheri.htm. [Accessed 02/09/2002].
Page 131
117
ANNEXURE A - QUESTIONNAIRE
Date
Authority
Official
FIRES Number of
Formal / informal dwellings / & veld fires
Storage
Industry
Transport
Other
RESCUE
Transport accident
Environmental (mountains) not sea rescues
HAZMAT(chemical fires or emergencies)
Number of
How many fire Stations
How many sub-stations
How many satellite
How many control centers
Official
Amount
Municipal Total Operating Expenditure
2002/2003
Fire Fighting Operating Expenditure
Page 132
118
2002/2003
Municipal Total Operating Expenditure
2003/2004
Fire Fighting Operating Expenditure
2003/2004
Official:
Full time Staff
Qualified/Trained leadership
Unqualified and untrained leadership
Qualified/ trained fire-fighters
Unqualified/untrained fire-fighters
Part time Staff, Reservists and Volunteers
Qualified/trained leadership
Unqualified and untrained leadership
Qualified/trained fire-fighters
Unqualified/untrained fire-fighters