Financial Stability Report | December 2017 41 5. Risk assessment 5.1. Qualitative risk assessment EIOPA conducts twice a year a bottom-up survey among national supervisors to determine the key risks and challenges classified as the most imminent in terms of their probability and potential impact. The Autumn survey reveals that low interest rates, credit and equity risks remain the main risks, although overall they decreased slightly for the insurance sector (Figure 5.1). For the pension sector, the risk for low interest rates increased (Figure 5.2). According to the survey, low interest rates and sovereign credit risk are expected to decrease further, whilst equity risk and property risk is expected to increase (Figure 5.3). ALM risks and lapse risks are also expected to increase, albeit to a smaller extent. However, the overall increase is lower than the one observed in the Spring Survey 2017. The highest variations for the insurance sector when compared with the previous survey were ALM and lapse risks which increased by about 1%. All the other risks remain more or less unchanged. Figure 5.1: Risk assessment for the insurance sector Figure 5.2: Risk assessment for the pension funds sector Source: EIOPA Autumn Survey 2017 Note: Risks are ranked according to probability of materialisation (from 1 indicating low probability to 4 indicating high probability) and the impact (1 indicating low impact and 4 indicating high impact). The figure shows the aggregation (i.e. probability times impact) of the average scores assigned to each risk. Figure 5.3. Supervisory risk assessment for insurance and pension funds - expected future development Source: EIOPA Autumn Survey 2017 Note: EIOPA members indicated their expectation for the future development of these risks. Scores were provided in the range -2 indicating considerable decrease and +2 indicating considerable increase.
Transcript
Financial Stability Report | December 2017 41
5. Risk assessment
5.1. Qualitative risk assessment
EIOPA conducts twice a year a bottom-up survey among national supervisors to determine the key risks and challenges classified as the most imminent in terms of
their probability and potential impact. The Autumn survey reveals that low interest rates, credit and equity risks remain the main risks, although overall they decreased
slightly for the insurance sector (Figure 5.1). For the pension sector, the risk for low interest rates increased (Figure 5.2). According to the survey, low interest rates and sovereign credit risk are expected to decrease further, whilst equity risk and property
risk is expected to increase (Figure 5.3). ALM risks and lapse risks are also expected to increase, albeit to a smaller extent. However, the overall increase is lower than the
one observed in the Spring Survey 2017.
The highest variations for the insurance sector when compared with the previous
survey were ALM and lapse risks which increased by about 1%. All the other risks remain more or less unchanged.
Figure 5.1: Risk assessment for the insurance sector
Figure 5.2: Risk assessment for the pension funds sector
Source: EIOPA Autumn Survey 2017 Note: Risks are ranked according to probability of materialisation (from 1 indicating low probability to 4 indicating high probability) and the impact (1 indicating low impact and 4 indicating high impact). The figure shows the aggregation (i.e. probability times impact) of the average scores assigned to each risk.
Figure 5.3. Supervisory risk assessment for insurance and pension funds - expected
future development
Source: EIOPA Autumn Survey 2017 Note: EIOPA members indicated their expectation for the future development of these risks. Scores were provided in the range -2 indicating considerable decrease and +2 indicating considerable increase.
Financial Stability Report | December 2017 42
5.2. Quantitative risk assessment
This chapter further assesses the key risks and vulnerabilities identified in this report. In detail, more comments on the solvency capital requirements are made. The asset allocation and the investment portfolios are further analysed. Equity investments for
solo undertakings are also presented. Furthermore, the use of derivatives and insurers' exposure to the banking sector is shown. The profitability for insurers is
evaluated, assessing the ROI (return on investments) for the first time and includes the ROA (return on assets) projection for 2017. Finally, cross-border exposures and interlinkages are discussed as well.
With a still low yield environment, the market conditions have affected some insurers'
solvency ratios by increasing the value of long-term liabilities, eventually impacting the solvency position. The negative impact is higher for life insurers with more pronounced duration mismatch between assets and liabilities. In this context, the
latest developments of solvency ratios are illustrated below.
The net basic SCR reflecting insurers’ risk profiles exhibits heterogeneity at country level (Figure 5.4).45 The market risk varies from 22% in Latvia to 83% in Sweden before diversification. Non-life underwriting risks ranks second highest. It
varies from 10% in the Netherlands to 72% in Latvia. The diversification benefit has also a large impact on the Net Basic SCR. It ranges from -48% in Slovakia and -44%
in Hungary to -19% in Sweden and -20% in Denmark.
The EU/EEA average also shows that more than half of the net basic SCR is
composed of market risk while the diversification benefits reduce it by almost one third. Market risk is the main component that affects the SCR. Hence,
there are several measures like long-term guarantees and transitional measures that can mitigate the effect (see Chapter 6).
45 The diversification bar is calculated as the sum of diversification divided by the Total Net Basic SCR.
Financial Stability Report | December 2017 43
Figure 5.4: Breakdown of net basic SCR (basic SCR, Standard Formula)
Source: EIOPA Annual Solo (S.25.01 “Solvency Capital Requirement - for undertakings on Standard Formula”.) Reporting Reference Date: 31/12/2016
The distribution of SCR ratios with and without the impact of LTG and
transitional measures differs across undertakings and countries and in some countries the 100% critical threshold would be missed if these LTG measures were not applied (Figure 5.5). Given that transitional measures form an integral
part of Solvency II and are intended to limit the procyclicality of the regulatory changes, especially insurers in Germany, Spain and the UK make use of the
transitionals but also Greece and Portugal have various numbers of users.
Financial Stability Report | December 2017 44
Figure 5.5: Distribution of insurers’ SCR ratios with LTG and transitional measures
versus SCR ratios without LTG and transitional measures at country level (in %; median, interquartile range and 10th and 90th percentile)
Source: EIOPA (S.22.01.), sample based on 702 solo insurance undertakings in EEA Reporting Reference Date: 31/12/2016 Note: blue boxplots show SCR ratios with LTG and transitional measures and yellow boxplots show SCR ratios without LTG and transitional measures. Countries that have less than 5 insurers in the sample at the date of analysis have been excluded.
The LTG measures seem to provide a financial stability cushion potentially
acting in a counter cyclical manner.46 The Report on long-term guarantees measures and measures on equity risk has shown that, in the absence of the easing
effect of the LTG measures, insurers might be induced to force sales and de-risk in order to lower their SCR and MCR, possibly pushing further down asset prices, adding to the market volatility and potentially affecting financial stability.
The cumulative effect of LTG measures and transitionals on SCR is larger on life insurers while, as expected, the impact on non-life undertakings is for most countries
negligible. Figure 5.6a shows the impact of the LTG measures and the transitionals on the aggregate SCR ratio for life insurers from a 2,701 sample with the full bar showing
the aggregate SCR ratio with LTG measures and transitionals and each coloured block the impact of the corresponding measure or transitional while Figure 5.6b shows the
impact of the LTG measures and the transitionals on the aggregate SCR ratio for composite insurers. Out of 2,701 undertakings, 557 are life, 1758 are non-life and 386 are composites.
46 See EIOPA Insurance Stress Test Report 2016 and the Report on long-term guarantees measures and measures on
equity risk 2016.
Financial Stability Report | December 2017 45
Figure 5.6a: Cumulative effect of LTG
measures and transitionals on SCR ratios for life undertakings
Figure 5.6b: Cumulative effect of LTG
measures and transitionals on SCR ratios for composite undertakings
Source: EIOPA (S.22.01.), sample based on 2.701 solo insurance undertakings in EEA Reporting Reference Date: 31/12/2016
The loss absorbing capacity of technical provisions (LAC TP) and deferred taxes (LAC DT) have also a significant impact on the SCR ratio (Figure 5.7).
These measures are related to the circumstances where the defined losses and shocks of the standard formula SCR can be compensated by a simultaneous decrease in the
technical provisions for future discretionary benefits or an increase in net deferred taxes. The impact may be reduced if the undertaking can provide credible evidence that it can utilise the fiscal losses stemming from the impact of this pre-tax shock
loss. The discretionary benefits components in technical provisions have an impact on both the solvency balance sheet of the insurer by increasing technical provisions and
decreasing own funds and on the SCR by increasing the loss absorbency capacity of technical provisions, and hence decreasing the SCR (see Box 4).
Financial Stability Report | December 2017 46
Figure 5.7: Impact of LAC DT and LAC TP on the SCR ratio at country level
Source: EIOPA Annual Solo Reporting Reference Date: 31/12/2016
Figure 5.8 shows as for each of the 30 jurisdictions, the total amount of LAC DT as percentage of the bSCR* (defined as the basic SCR plus operational risk and the loss absorbing capacity of technical provisions). The blue bars show the part of LAC DT for
which a likely utilisation is being demonstrated by a net DT position on the balance sheet while the orange bars indicate the part of LAC DT that is being demonstrated by
other means, including future profits.
At country level, in HR and LU the LAC DT is close to the tax rate whereas BE,
AT, FR and DE insurers, among others, almost fully rely on net DTL for the likely utilisation of LAC DT. Insures in NO, ES and the NL rely mainly on future
profits, and carry-back if applicable (Figure 5.8).
Figure 5.8: Split of LAC DT over net Deferred Tax Liabilities (DTL) and other sources
(future profits) versus the tax rate per jurisdiction in the EEA.*/**
Source: EIOPA Annual Solo Reporting Reference Date: 31/12/2016 Note: * The total LAC DT per jurisdiction, both “net DTL LAC DT” and “Future Profits”, are the sums of the LAC DT in a specific jurisdiction as a percentage of the sums of the bSCR*, the SCR excluding LAC DT, in that jurisdiction. ** The part of LAC DT that is being demonstrated by future profits for Ireland, the Netherlands and the United Kingdom also contain the part of LAC DT that is being demonstrated by carry-back.
Financial Stability Report | December 2017 47
Box 4: SCR post stress analysis
One of the June 2017 EIOPA Financial Stability Report thematic articles dealt with
the re-estimation of Solvency Capital Requirement (SCR) after a shock.47 The
article elaborated on French Stress Test data to illustrate an unexpected
phenomenon at the time48: positive increase of the SCR value after a financial
shock identifying the drivers of this evolution. A similar analysis has been
conducted at EU level, using two financial scenarios, double hits, one originated
from a shock in the EU stock market (“CA1”) and the other in corporate debts
(“CA2”). Aggregating and anonymising the figures49, it is possible to fit the simple
linear model utilised in the maiden article:
𝑆𝐶𝑅 = 𝑎 ⋅ 𝑔𝐵𝑆𝐶𝑅 − 𝑏,
where, 𝑔𝐵𝑆𝐶𝑅 corresponds to the gross basic SCR, 𝑎 represents the risk exposure
(approximated as a fraction of the assets post over pre-stress) and 𝑏 the different
mitigation components: diversification, future discretionary benefits (“FDB”) and
Deferred Taxes (“DT”). Table B4.1 summarises the pre-stress position.
Table B4.1: Virtual insurance company calibrated for each scenario
Source: EIOPA
Using the linear mode T above, one infers the value of post-stress gBSCR’ and b’.
The Net SCR averages reported SCR of groups with a positive increase of the
capital charge. Results for each scenario are provided in table B4.2.
Table B4.2: Analysis of the two scenarios
Source: EIOPA
47 See June 2017 Financial Stability Report thematic article “Re-evaluation of the capital charge in insurance after a
large shock: empirical and theoretical views” by Fabrice Borel-Mathurin, Stéphane Loisel, and Johan Segers based on
EIOPA ST 2014.
48 The technical specifications and the analysis of the report of the 2014 EIOPA exercise are aligned with this view from
the past.
49 Each of them corresponds to one of the financial scenarios of the 2014 EIOPA stress test exercise (namely “CA1”
and “CA2” in the reporting template).
in M€ CA1 CA2
Liabilities 100 100
gBSCR 7.78 8.39
b 4.51 2.99
Net SCR 3.26 5.39
in M€
Actual
(a ≈ 0.93)a = 0.9 a= 0.8
Actual
(a ≈ 0.95)a = 0.9 a = 0.8
Liabilities' 95.1 92 81.8 93.4 90.4 80.3
gBSCR' 7.39 6.65 5.91 7.83 7.05 6.26
b' 3.6 2.86 2.12 1.83 1.05 0.27
Net SCR' 3.79 3.79 3.79 6.00 6.00 6.00
CA1 CA2
Financial Stability Report | December 2017 48
Finally, one can estimate the respective evolution of all mitigation components for
each scenario and evaluate their credibility. Assuming that 𝑏 is the sum of the
diversification module (assumed constant since it is an inherent characteristic of
the group), FDB and DT, one can infer the surge of the DT’s after stress (Table
B4.3). Although an increase of the DT is expected after a shock, its size is
questionable. Hence, the actual recoverability should be discussed.
Table B4.3: Analysis of the future discretionary benefits evolution
Source: EIOPA
These results obtained with the very simple linear model shed lights on the
prominence of the loss absorption capacities in the Solvency II framework. They
also confirm and reinforce first country specific estimations for the overall
European insurance sector.
Given the low yield environment and high level of uncertainties, combined with the risk of a sudden spike scenario, insurers' asset allocation might be
adjusted in order to accommodate interest rate risk. With sovereign bond yields as the benchmark for other assets' returns, the magnitude and the direction of portfolio movements are essential to be analysed.
Insurance companies have high exposure to fixed income assets, in
particular in government and corporate bonds which could be translated to higher interest rate sensitiveness and lower profitability in the current economic environment (Figure 5.9). However, holdings of government bonds, as a
share of investment, vary widely and range from 0% to approximately 70% for the 10th and 90th percentile respectively. The median value for investments in
government bonds has been relatively stable between Q2 2017 and Q4 2016, while the median for corporate bonds has increased by 2 percentage points, amounting to a total of 24% and 26.14% respectively. Also the median values for listed and unlisted
equity increased in the same period.
Investments in unlisted equity as well as mortgages and loans have slightly increased in Q2 2017 compared to the end of 2016 suggesting that there might be a trend towards more illiquid investments. The distribution of the
share of listed equities has also increased in Q2 2017.
FDB Analysis CA1 CA2
b'/b 79.8% 61.2%
FDB'/FDB 8.5% 13.9%
DT'/DT 310% 286%
Financial Stability Report | December 2017 49
Figure 5.9. Type of investment as a share of total investment. Cross-sectional
distribution (in % for the median, interquartile range and 10th and 90th percentile)
Source: EIOPA (sample based on 2027 solo insurance undertakings in EEA, asset by asset template, look through approach applied) Reporting Reference Date: 30/06/2017
On an aggregated level, in Q2 2017 life insurers' portfolios remain to be
focused on fixed-income assets with a heavy focus on corporate bonds (36%) and government bonds (32%) being the ones most exposed towards
interest rate risk (Figure 5.10a and 5.10b). This is due to the fact that life insurers are more focused on asset-liability matching as opposed to non-life insurers.
The non-life insurers' share on government bonds and corporate bonds is hence less than for life insurers (Figure 5.10c and 5.10d). However, compared to
Q4 2016, investment in fixed income assets recorded a slight increase for corporate bonds and a slight decrease for government bonds. Equities on the other hand are
higher for non-life insurers than for life insurers and also grew from Q4 2016 to Q2 2017.
The investment portfolio of undertakings pursuing both life and non-life insurance comprises mostly fixed income securities (Figure 5.10e and 5.10f). In
fact, about two thirds of assets make up this investment category.
Financial Stability Report | December 2017 50
Figure 5.10a: Investment split for life
insurance companies in Q4 2016
Figure 5.10b: Investment split for life
insurance companies in Q2 2017
Figure 5.10c: Investment split for non-life
insurance companies in Q4 2016
Figure 5.10d: Investment split for non-life
insurance companies in Q2 2017
Figure 5.10e: Investment split for
undertakings pursuing both life and non-life insurance business in Q4 2016
Figure 5.10f: Investment split for
undertakings pursuing both life and non-life insurance business in Q2 2017
Source: EIOPA (sample based on 2027 solo insurance undertakings in EEA, asset by asset template, look through approach applied) Reporting Reference Date: 30/06/2017
Financial Stability Report | December 2017 51
Traditional investments are affected by the low yield environment and given
the current situation, asset managers might look for alternative investments which can provide higher returns but could turn out to be more risky. The
EIOPA Investment Behaviour Report50 has revealed that there already exists a tendency to invest into new asset classes among insurance groups (see Box 5 for
further details on insurers’ exposures to real estate). The proportion of traditional investments of insurers seems to have slightly decreased in the last two quarters (Figure 5.11).
Figure 5.11: Proportion of traditional investments (including look-through information) as % total investments (bonds, equities, cash and deposits)
Source: EIOPA Quarterly Solo (S.06 and S.08 templates) Note: the indicator is computed as a percentage of total investments, where bonds, equities, cash and deposits are considered as traditional investments. Reporting Reference Date: 30/06/2017
Box 5: Insurers’ exposures to real estate
The EIOPA Investment Behaviour Report identified a tendency of insurers to invest
more in asset classes such as mortgages, loans and real estate. The report
concluded that the share of these investments in the total portfolio is currently
limited at European level, but that it could grow over time as a consequence of the
persistent low interest rate environment. Such investments expose insurers to
vulnerabilities in real estate markets, which in some European countries are
assessed to be currently high.51 Thus, a further analysis on the topic based on
Solvency II data is warranted given the need to monitor and evaluate potential
risks originating in real estate markets for the financial stability of the European
insurance sector.
To this aim, insurers’ holdings of real estate-related assets were assessed based
on solo data reported by insurance companies of the EEA Member States with
reference date Q1 2017. Real estate-related assets comprise investments in equity
50 Published on 16/11/2017
51 ESRB’s warnings on medium-term vulnerabilities in the residential real estate sector, 28 November 2016
of real estate related corporations, real estate funds, mortgages, property and any
other assets or investments related to the real estate sector.52
Overview of exposures
Total real estate-related assets in Q1 2017 amounted to EUR 642 bn, accounting
for around 7% of the total assets of the European insurance sector. Exposures
across countries are very diverse (Figure B5.1), ranging from 1% in Liechtenstein
to 17% in the Netherlands. Moreover, ten countries have exposures greater or
equal than 8% of total assets (Austria, Belgium, Cyprus, Finland, United Kingdom,
Croatia, Netherlands, Norway, Portugal and Sweden). Among these, six received a
warning on residential real estate vulnerabilities from the ESRB in 2016 (Austria,
Belgium, Finland, United Kingdom, Netherlands and Sweden). Depending on the
country, the main vulnerabilities identified by the ESRB were the strong growth in
residential real estate prices, high indebtedness levels and somewhat loose credit
standards. Some of these countries have implemented macroprudential measures
for the residential real estate market, although not all targeted exposures of the
insurance sector.
On aggregate level, life insurers are those most exposed to real estate-related
assets, which is probably justified by the need to match the long duration of their
liabilities to long-term investments that yield stable returns. Additionally, for life
insurers it should be taken into account that losses on the asset side (e.g. due to
developments in property markets) could be mitigated by the loss-absorbing
capacity of technical provisions.
Figure B5.1: Real estate-related assets in % of total assets and breakdown by
type of undertaking
Source: EIOPA Quarterly Solo. All figures exclude assets held for index-linked and unit-linked contracts.
Reporting Reference Date: 31/03/2017
52 Real estate-related assets comprise those reported in the list of assets of the Solvency II Quantitative Reporting Templates: i) investments and other assets with CIC code clearly identifying them as real estate-related (CIC 32, 45, 55, 65, 84 and 9); and ii) any other investments/assets with counterparty sector either construction of buildings or real estate activities (NACE F41 and L). Property includes that held for own use as under the Solvency II market-consistent balance sheet, fluctuations in market values for property have an impact on the undertakings’ own funds and solvency positions.
Financial Stability Report | December 2017 53
Figure B5.2 presents a breakdown of real estate exposures by asset class and by
residential and commercial real estate (RRE and CRE, respectively) for the whole
EU/EEA and for those countries with larger exposures and a larger share of the
European market in terms of total assets.53 EU/EEA exposures are mainly
attributed to mortgages and loans and property, which together account for 4.1%
of European insurers total assets. Exposures to equity, bonds and through
investment funds together comprise 3.1% of total assets. Exposures to CRE
amount to 2.3% of insurers total assets, while exposures to RRE sum up to
1.5%.54 Other exposures through investments in securities issued by or loans
granted to the real estate sector comprise 3.6% of total assets. A country
breakdown reveals that exposures to mortgages and loans predominate among
the countries with larger exposures and a larger share of the European market in
terms of total assets, with the exception of Sweden, where equity investments
prevail. In addition, most of these countries‘ exposures are to CRE or exposures
through investments in securities issued by or loans granted to real estate
counterparties, with the exception of the Netherlands, which is mainly exposed to
RRE.
Figure B5.2: Breakdown of real estate-related assets by asset class and by RRE
and CRE (in % of total assets)
Source: EIOPA Quarterly Solo. All figures exclude assets held for index-linked and unit-linked contracts. Look-
through approach is not applied
Reporting Reference Date: 31/03/2017
Financial stability considerations
Through their holdings of real estate-related assets, insurers are exposed to
market and credit risk. Negative developments in real estate markets have the
potential to impact the asset side of insurers’ balance sheets through several
channels: i) decrease in the market value of property due to changes in residential
53 Considering a minimum threshold of 2% of total EU/EEA assets excluding assets held for index-linked and unit-linked contracts.
54 These figures are likely to be underestimated because they do not include exposures through securities issued by and loans granted to real estate-related counterparties, as for these, the breakdown by RRE and CRE is not available.
Residential real estate prices in the euro area have been increasing since
beginning of 2014, reaching a year-on-year- growth rate of 4% in Q2 2017. In
some of the euro area countries with the largest exposures there were high price
increases, such as in Portugal (8%) and the Netherlands (7.3%). Strong house
price increases were also registered in exposed countries outside the euro area,
such as in Sweden (8.6%) and Norway (7.8%). Data on price-to-income and
price-to-rent ratios shows that prices are close to their long-term average in the
euro area, although in Belgium and in some other EU/EEA major countries
(Norway, Sweden and the United Kingdom) they are clearly above.55 Commercial
property prices have also been increasing in the euro area since 2014, with the
annual growth rate reaching 5.5% in Q4 2016 (Figure B5.4), which is still below
the pre-crisis peak (9.8% in Q3 2006).
In the euro area, household indebtedness as a percentage of GDP was still below
pre-crisis levels in Q1 2017, but the same does not hold for non-financial
corporations (Figure B5.4). In some of the EU countries identified as having the
largest exposures, household indebtedness is high as compared to the size of the
economy, particularly in Netherlands (108%), United Kingdom (88%) and Sweden
(86%). Indebtedness of non-financial corporations is predominantly high in
Belgium (158%), Sweden (147%), Netherlands (123%) and Finland (109%).
Figure B5.4: RRE and CRE prices (year-on-year growth rate, in %) and credit to households and non-financial corporations (as a % of GDP), euro area
Source: ECB and BIS. Last figure refers to 2016Q4 for CRE prices, 2017Q2 for RRE prices and 2017Q1 for credit. Nominal RRE prices and transaction-based CRE prices.
55 Based on OECD standardised price-to-income and price-to-rent ratios indicators with reference date 2017Q1 and
2017Q2 (not shown).
-8%
-6%
-4%
-2%
0%
2%
4%
6%
8%
10%
12%
20
06
Q1
20
06
Q4
20
07
Q3
20
08
Q2
20
09
Q1
20
09
Q4
20
10
Q3
20
11
Q2
20
12
Q1
20
12
Q4
20
13
Q3
20
14
Q2
20
15
Q1
20
15
Q4
20
16
Q3
20
17
Q2
CRE prices RRE prices
20
30
40
50
60
70
80
90
100
110
120
01
.03
.19
99
01
.04
.20
00
01
.05
.20
01
01
.06
.20
02
01
.07
.20
03
01
.08
.20
04
01
.09
.20
05
01
.10
.20
06
01
.11
.20
07
01
.12
.20
08
01
.01
.20
10
01
.02
.20
11
01
.03
.20
12
01
.04
.20
13
01
.05
.20
14
01
.06
.20
15
01
.07
.20
16
Credit to households and non-financial corporations as a % of GDP, Euro Area
Credit to households (% of GDP)
Credit to non-financial corporations (% of GDP)
Financial Stability Report | December 2017 56
Analysing insurers’ portfolios at country level, the heterogeneity across
individual insurers is also high (Figure 5.12). Insurers from Hungary (79.21%), Romania (68.10%) and Lithuania (66.29%) invest more than two thirds of their
portfolio in government bonds while insurers from Finland (10.65%), Sweden (15.26%) and Cyprus (15.61%) prefer other types of investments. Swedish insurers
are the largest investors in equity (37.27%).
For insurers relying heavily on government bonds home biased investment
behaviour can be observed. For example, insurers from Romania, Hungary and Poland have allocated more than 90% of their government bonds in their country issued bonds.
Figure 5.12: Investment split at country level
Source: EIOPA (sample based on 2027 solo insurance undertakings in EEA, asset by asset template, look through approach applied) Note: Red - above 90th percentile, Blue - below 10th percentile Reporting Reference Date: 30/06/2017
A further analysis of equity investments of solo insurers at member state level suggests that there are significant differences among countries
regarding their equity investments (Figure 5.13 and Box 6). According to Solvency II QRT data, equity investments seem to be high in countries like SE, DK,
FR, FI, BG and AT but this can be related also to the specificities of each country.
Insurance companies that are well capitalised tend to invest more in equity
than more vulnerable insurers. By splitting the SCR ratio into buckets and looking at the equity ratio in the portfolio, one can notice that in aggregate terms the share of
equity investments seems to be higher in well capitalised undertakings. As equities bear a higher risk charge than e.g. bonds in the SCR coverage calculation, it is important to see the connection between equity investments and the SCR ratio.
Financial Stability Report | December 2017 57
Nonetheless, increased investments in equity could also be attributed to other reasons
such as different business models.
Figure 5.13: Total equity as a % of Total Investment Assets, in %
Source: EIOPA (sample based on 2027 solo insurance undertakings in EEA, asset by asset template, look through approach applied) Reporting Reference Date: 30/06/2017
Box 6: Stock prices and equity portfolio allocation
The market value of equity portfolios has increased by 15% in total for the EEA
countries included in the sample from Q1 2016 until Q2 2017. Most global
reference indices have registered a positive growth during this period (Figure
B6.1). The total growth rate ranged from 1% for SEE to 38% for Ibovespa. The
Hang Seng Index increased 23% over this period and about 16% increase were
observed for both Nikkei 225 and S&P 500.
The impact of developments in stock prices on the market value of equity
portfolios was also investigated in EIOPA Investment Behaviour Report. The report
shows that from 2011 to 2016 the overall increase in the market value of equity
portfolios corresponded only partially to the increase in stock prices. The same
conclusion could be drawn by looking at the equity portfolios’ developments during
2016 and first half of 2017 (Figure B6.2). The contribution of changes in equity
prices to the observed growth rate of the market value of equity portfolios was
estimated based on a weighted average of stock market indices. The estimated
change in equity prices is referred to as cumulative returns. Estimated cumulative
returns for the whole sample range from -2% to 8% while the observed changes
in the market value of equity portfolios vary between -2% and 7%. The change in
the market value of equity portfolios is generally lower than the estimated returns
(except for the second quarter in 2016 and 2017). The overall equity portfolio
developments might suggest that, insurers rebalance their investment portfolios to
some degree, to maintain a relatively stable equity allocation over time.
Financial Stability Report | December 2017 58
Insurers can use derivatives in their portfolio for hedging purposes according to the
Solvency II regulation (Figure 5.14a, 5.14b and 5.14c).
In Q2 2017, the market value of derivatives was less than 0.4% of the total investments. In total figures, the Solvency II (market) value of derivatives is
approximately EUR 22.15 bn while the notional value of the contracts reached approximately EUR 4.36 trn in Q2 2017. 56
Compared to the volume of the derivatives contracts held at the end of 2016 by the European insurers, the value has significantly decreased in the first half of 2017. Put (call) options can be used to hedge (or leverage up i.e. increase the
risk exposure) equity, whereas the purchase (selling) of credit default swaps can be used to hedge (leverage up) default risk. Swaps are used to hedge interest rate risk.
Insurers may aggregate and hedge risks associated with certain blocks of invested assets or liabilities together (a portfolio hedge), or may hedge individual assets against one or more risks.
Among the three types of undertakings, life insurers are the ones that make
use of derivatives to hedge their portfolio risks (Figure 5.14a). In Q2 2017, swap contracts (46.87%) are the most common type of derivatives followed by put options (22.47%) and call options (19.02%). At the end of the 2016, forward contracts were
the second most used contracts while in Q2 2017 they only rank fourth with 10.33%. Non-life insurers are using more than two thirds forward contracts while the portfolio
of composite undertakings is similar with the one of life insurers.
56 The charts are computed using the absolute market values of the derivative contracts.
Figure B6.1: Developments in major
world indices (31.03.2016 =100)
Figure B6.2: Equity portfolios’
developments in total during 30.06.2016 – 30.06.2017
Source: Bloomberg.
Note: EIOPA’s calculations. Indices are shown for US (S&P 500),
Japan (NIKKEI 225), China (SSE Composite Index), Europe (Stoxx
600 Europe), Hong Kong (Hang Seng Index) and Brazil (Ibovespa).
Source: EIOPA and Bloomberg.
Note: EIOPA’s calculations. Cumulative returns are estimated
using a weighted average of stock market indices based on 2016
portfolio allocations per country. For exposures to EU/EEA
countries, Switzerland, US, Japan, China, Hong Kong and Brazil,
the reference stock market index was used. For exposures to
other countries and exposures with missing counterparty, the US
stock index was used.
Financial Stability Report | December 2017 59
Figure 5.14a: Derivatives for life insurance
companies
Figure 5.14b: Derivatives for non-life
insurance companies
Figure 5.14c: Derivatives for undertakings pursuing both life and non-life insurance
business
Source: EIOPA (sample based on 2027 solo insurance undertakings in EEA) Reporting reference date: 30/06/2017
Maintaining profitability is one of the main challenges for insurers in the current low yield environment (Figure 5.15). More than EUR 132 bn of profits is generated by fixed income assets, with a 60% contribution in the profits for life
insurers at the end of 2016. On the other hand, equities made up an additional EUR 28 bn for non-life insurers, contributing 36% to the profit of non-life insurers.
Derivatives are loss making for non-life and composite undertakings. Profit of investments by investments category has been calculated as the sum of dividends, interest, rents, gains and losses, unrealised gains and losses for each undertaking.
Financial Stability Report | December 2017 60
Figure 5.15: Profit of investments by investments category and by type of undertaking
The distribution of Return on Investments (ROI) shows a median value of 3.87% at the end of 2016 (Figure 5.16). However, discrepancies are significant with the 10th percentile showing a 0.68% ROI, while the 90th percentile reaches a
high 8.74%. Return on investments is computed as the ratio between the profit of investments (explained in the above figure) and total investments (derivatives are
taken into consideration).
Figure 5.16: Distribution of ROI at company level
Source: EIOPA Annual Solo Reporting Reference Date: 31/12/2016
Financial Stability Report | December 2017 61
The current data and projections reveal a slightly deteriorating ROA (Figure
5.17). In 2014 and 2015 the profitability increased and had a positive trend, but starting with 2016 the median ROA experienced a minor decrease. EIOPA’s projection
for 2017 has been updated with the latest available data for 2016 and indicates a median value of 0.75% for ROA for 2017, a slightly better ROA compared to the
previous projection.57 The reallocation of the investments might be triggered by the low profitability of insurers focused on asset-liability matching. Especially in the case of life insurers, the constant pressure on profitability affects both the assets and
liabilities side which will eventually also lead to a deteriorating solvency position.
Figure 5.17: Distribution of ROA and profitability projection58
Source: Bloomberg, Eurostat, EIOPA (sample based on 67 solo insurance undertakings in EEA) Reference Date: 20/09/2016 Note: * EIOPA own forecast
The interconnectedness between insurers and banks gives relevant implications for financial stability given that in the case of stress in the financial markets the banking system may potentially have spillover effects
over the insurance market. Hence, it is vital to identify channels of transmissions, in order to monitor them and mitigate the risk.
The insurance sector is extensively exposed towards the banking sector: the total exposure amounts to approximately EUR 2.5 trillion which corresponds
to 35.42% of insurers' total investments. Some insurers from countries such as Poland (90%), Croatia (85%) and Denmark (79%) tend to be more domestically
exposed, while insurers from Lichtenstein (96%) and Ireland (86%) tend to be more cross-border exposed (Figure 5.18).
57 This is in line with estimations from Bloomberg. Note that the EIOPA projection is slightly more conservative.
58 For more information on the methodology of the forecast see Box on page 61 in the EIOPA Spring Financial Stability
Report at https://eiopa.europa.eu/Pages/Financial-stability-and-crisis-prevention/financial-stability-report---June-
2017.aspx
Financial Stability Report | December 2017 62
Figure 5.18: Insurance sector exposure towards the banking sector, domestic versus
cross-border in %
Source: EIOPA (sample based on 2027 solo insurance undertakings in EEA) Reporting Reference Date: 30/06/2017
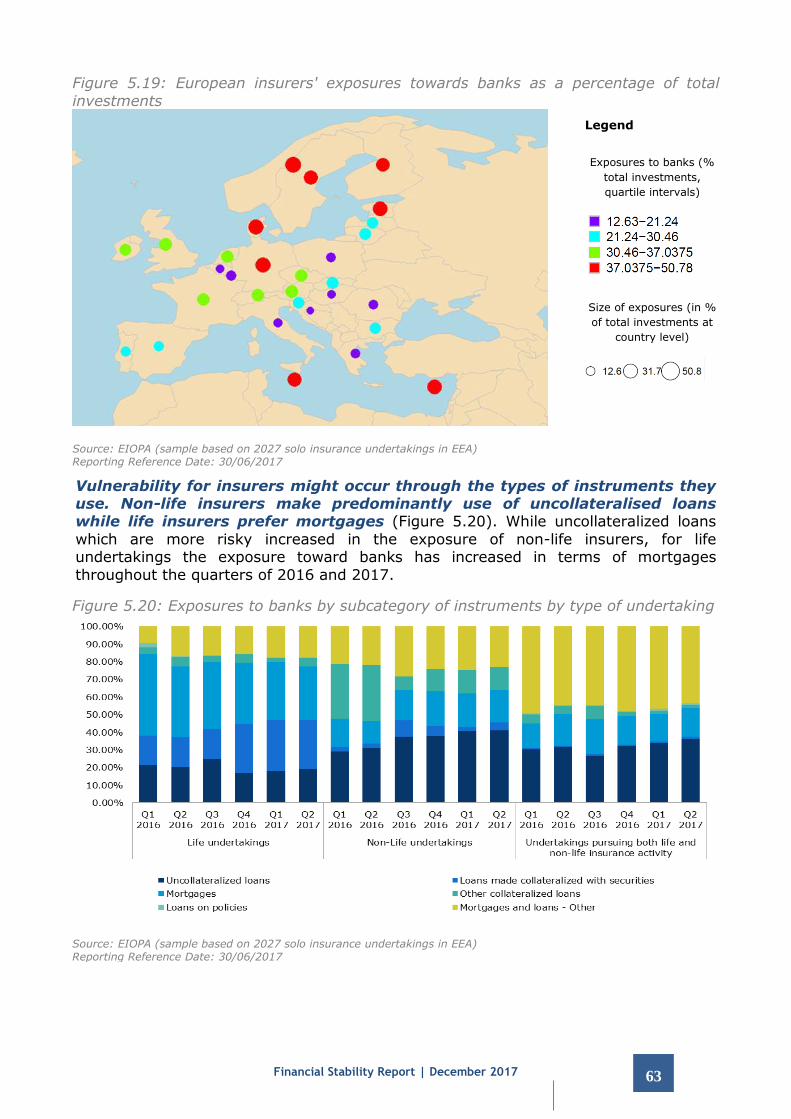
In the above mentioned context, a potential transmission channel is through investments (Figure 5.19). The map representation of EU insurers’ exposures
towards banks59 as a percentage of their total investment assets shows that some insurers are heavily exposed to the banking sector.60 Total exposures include corporate bonds, equity, cash and deposits, structured notes, collateralised securities,
mortgages and loans, property and other investments.
From a financial stability point of view, higher exposures towards other sectors increase the risk of contagion in case of distress in the financial markets. On an aggregated level, insurers’ exposure towards banks ranges from
12.63% in HR to 50.78% in NO as a percentage of their total investment assets. The colour and the size of the bubble in Figure 5.19 indicates in which quartile interval the
country is situated depending on how much insurers are exposed to banks on aggregate level. While non-performing loans ratio of banks have continued improving confirming the downward trend (4.5% in Q2 2017), there is still a wide spread
dispersion among EU countries with ratios ranging from 0.9% to 46.5%.61 This suggests that some insurers might be potentially vulnerable towards banks with high
NPL ratios.
59 The data presented is obtained by filtering the issuer with the NACE code K64 i.e. financial service activities, except
insurance and pension funding and by excluding K64.1.1 central banking.
60 The underlying data is computed as the percentage of total exposures towards banks of insurers in the amount of
total investment assets at country level.
61 EBA, Risk Dashboard, data as of Q2 2017.
Financial Stability Report | December 2017 63
Figure 5.19: European insurers' exposures towards banks as a percentage of total
investments
Legend
Exposures to banks (%
total investments,
quartile intervals)
Size of exposures (in %
of total investments at
country level)
Source: EIOPA (sample based on 2027 solo insurance undertakings in EEA) Reporting Reference Date: 30/06/2017
Vulnerability for insurers might occur through the types of instruments they use. Non-life insurers make predominantly use of uncollateralised loans while life insurers prefer mortgages (Figure 5.20). While uncollateralized loans
which are more risky increased in the exposure of non-life insurers, for life undertakings the exposure toward banks has increased in terms of mortgages
throughout the quarters of 2016 and 2017.
Figure 5.20: Exposures to banks by subcategory of instruments by type of undertaking
Source: EIOPA (sample based on 2027 solo insurance undertakings in EEA) Reporting Reference Date: 30/06/2017
Financial Stability Report | December 2017 64
Cross-border exposure is a potential channel of risk transmission. Financial turmoil in
the banking sector of one country might spill over due to cross-border holdings by insurers. But also, excessive domestic exposure, which can be seen as a lack of
diversification, might be a potential weakness or source of risk. Insurers may carry out insurance activities in another EEA country via Freedom of Establishment (FoE) or
via Freedom of Services (FoS) (See Box in Chapter 2).
The financial interlinkages derived from the cross border business support risk
diversification at country level leading to a more robust network, but also facilitate transmission of shocks generating a network more prone to systemic risks, yet more fragile in case of financial stress. Countries that receive more premiums than they
receive as a percentage of their total GWP are coloured in yellow (“receiver country”) while the blue colour suggests that the country subscribes more cross-border (“donor
country”) as a percentage of their total GWP. Moreover, the size of the bubble shows the size of the percentage of outgoing premiums in total GWP (Figure 5.21).
LU, IE and EE report more than 50% of their premiums subscribed cross-border, so they are the biggest ”donors”. The evidence shows that the
geographical factor is an important determinant of cross-border linkages. In particular EE insurers subscribe in LT and LV.
Figure 5.21: Cross-border business among EEA countries in terms of GWP
Source: EIOPA. Sample of 2800 solo insurers Reporting Reference Date: 31/12/2016
Financial Stability Report | December 2017 65
Risks are typically higher in a network where "receiver" countries have a
significant concentration of exposures to a few sources (Figure 5.22). Thus, a higher concentration reduces the benefit of the risk diversification given by the
domestic insurance mechanism. On the other side, a growing cross-border business could lead to higher volatility (more capital inflows and outflows) and uncertainty.
Countries that receive more claims than they receive as a percentage of their total incurred claims are coloured in yellow (“receiver country”) while the blue colour shows that the country subscribes more cross-border (“donor country”) as a percentage of
their total incurred claims. The size of the bubble shows the size of the percentage of outgoing incurred claims in total incurred claims.
LU, IE and EE are the biggest “donor” countries in terms of claims due to the large percentage of premiums that are subscribed cross-border as seen in the previous
network.
Figure 5.22: Cross-border business among EEA countries in terms of incurred claims
Source: EIOPA. Sample of 2800 solo insurers Reporting Reference Date: 31/12/2016