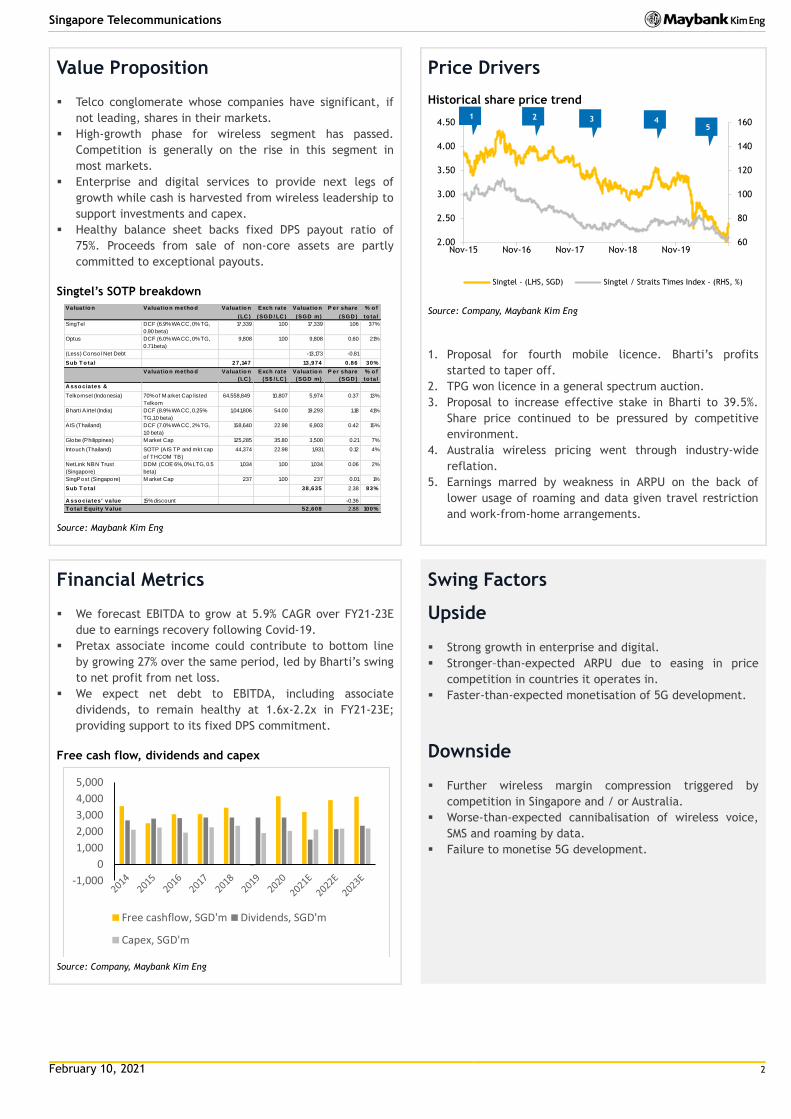
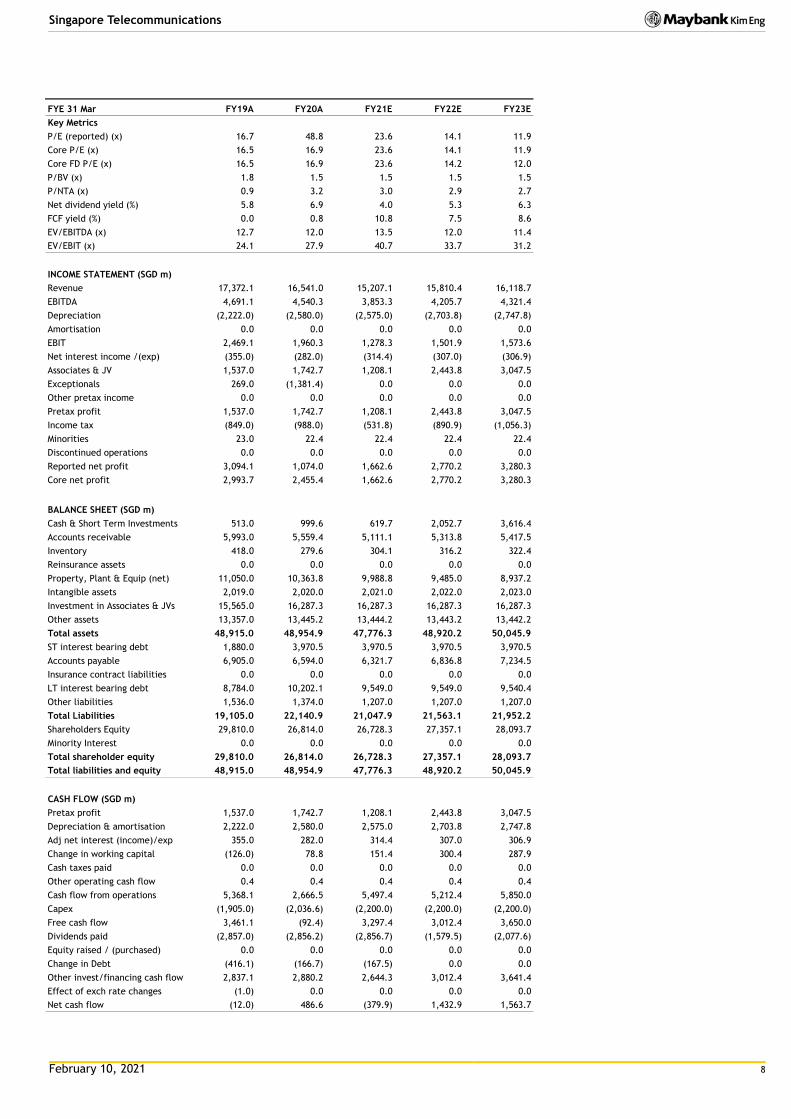
February 10, 2021 Telecommunications Singapore THIS REPORT HAS BEEN PREPARED BY MAYBANK KIM ENG RESEARCH SEE PAGE 11 FOR IMPORTANT DISCLOSURES AND ANALYST CERTIFICATIONS Co. Reg No: 198700034E MICA (P) : 099/03/2012 ESG Tear Sheet Insert Kareen Chan [email protected](65) 6231 5926 Singapore Telecommunications (ST SP) Sequential recovery Maintain BUY on deep value 9MFY21 EBIT is on track to meet MKE/consensus estimates. Maintain BUY and SOTP-based TP of SGD2.88. We think the worst is over as we see earnings recovering sequentially due to: i) gradual ARPU recovery post- Covid; ii) potential 5G ARPU uplift of 1.9% YoY from FY23-26E; iii) BHARTI driving associates’ recovery. Singtel remains our Top Pick in the Singapore telco space. We see deep value in Singtel as the market is ascribing almost zero value to its SG and Australia operations, while offering 5.3% FY22E yield. This is followed by NetLink NBN Trust (NETLINK SP, CP: SGD0.955, BUY, TP: SGD1.11). No changes to our forecasts 3QFY21 revenue of SGD4.2b fell 3% YoY but rose 9% QoQ due to strong demand for premium handsets (mainly iPhones). In addition, the decline in roaming and prepaid revenues was cushioned by the growth in subscription for the ‘Optus Choice’ customised data plans in Australia, which drove up post-paid ARPU by 2.7% QoQ. 9MFY20 revenue achieved 77%/76% of MKE/consensus. Operational EBITDA fell 14% YoY due to a narrower EBITDA margin of 23.7% (3QFY20: 26.6%, 2QFY21: 25.9%) as a result of a lower sales mix of National Broadband Network (NBN) migration. Meanwhile, EBIT reached 72%/76% of MKE/consensus estimates. We make no changes to our forecasts. BHARTI takes the driving seat Among the associates, green shoot is emerging for BHARTI (BHARTI IN, CP: INR595, BUY, TP: INR750) as 9MFY21 pre-tax loss narrowed significantly by 90.4% YoY to SGD35m. Additionally, we noted that BHARTI continues to outperform its peers across most operating metrics in India, recording the highest quarterly revenue due to strong customer additions. Our India telco analyst Neerav believes tariff hikes and 4G adoption from a low base will continue to be catalysts to drive BHARTI’s turnaround. We estimate India’s sector ARPU to grow 2-3% QoQ within 6 months and BHARTI to account for 18% of Singtel’s FY22E associates earnings. We believe BHARTI’s performance could drive recovery in regional associates’ contribution. NCS may pose upside surprise Enterprise revenue remained resilient despite disruptions to businesses caused by Covid-19. This was driven by strong ICT revenue growth of 7.9% YoY, led by NCS and Australia Enterprise as customers stepped up on digitalisation efforts. In particular, revenue from NCS was SGD809m (+75% QoQ and +79% YoY). While Group CEO Mr Yuen Kuan Moon has yet to announce his strategy, the recent restructuring of NCS to operate as an autonomous unit signals Singtel’s focus on the division. Share Price SGD 2.40 12m Price Target SGD 2.88 (+20%) Previous Price Target SGD 2.88 BUY Company Description Statistics 52w high/low (SGD) 3m avg turnover (USDm) Free float (%) Issued shares (m) Market capitalisation Major shareholders: 51.9% 5.7% 3.3% 16,515 63.6 Singtel is the largest integrated telecommunications service provider in Singapore and has significant share in Australia, India and ASEAN Temasek Holdings Central Provident Fund Capital Research 3.34/2.00 42.4 SGD39.6B USD29.9B Price Performance 80 85 90 95 100 105 110 115 120 2.00 2.20 2.40 2.60 2.80 3.00 3.20 3.40 3.60 Feb-19 May-19 Aug-19 Nov-19 Feb-20 May-20 Aug-20 Nov-20 Singtel - (LHS, SGD) Singtel / Straits Times Index - (RHS, %) -1M -3M -12M Absolute (%) (2) 8 (27) Relative to index (%) (1) (0) (21) Source: FactSet FYE Mar (SGD m) FY19A FY20A FY21E FY22E FY23E Revenue 17,372 16,541 15,207 15,810 16,119 EBITDA 4,691 4,540 3,853 4,206 4,321 Core net profit 2,994 2,455 1,663 2,770 3,280 Core FDEPS (cts) 18.3 15.0 10.2 17.0 20.1 Core FDEPS growth(%) 0.0 (18.0) (32.3) 66.6 18.4 Net DPS (cts) 17.5 17.5 9.7 12.7 15.1 Core FD P/E (x) 16.5 16.9 23.6 14.2 12.0 P/BV (x) 1.8 1.5 1.5 1.5 1.5 Net dividend yield (%) 5.8 6.9 4.0 5.3 6.3 ROAE (%) 10.4 3.8 6.2 10.2 11.8 ROAA (%) 6.2 5.0 3.4 5.7 6.6 EV/EBITDA (x) 12.7 12.0 13.5 12.0 11.4 Net gearing (%) (incl perps) 34.1 49.1 48.3 41.9 35.2 Consensus net profit - - 2,023 2,615 2,845 MKE vs. Consensus (%) - - (17.8) 5.9 15.3
Transcript
2.40
February 10, 2021
Tele
com
munic
ati
ons
Sin
gapore
THIS REPORT HAS BEEN PREPARED BY MAYBANK KIM ENG RESEARCH
SEE PAGE 11 FOR IMPORTANT DISCLOSURES AND ANALYST CERTIFICATIONS
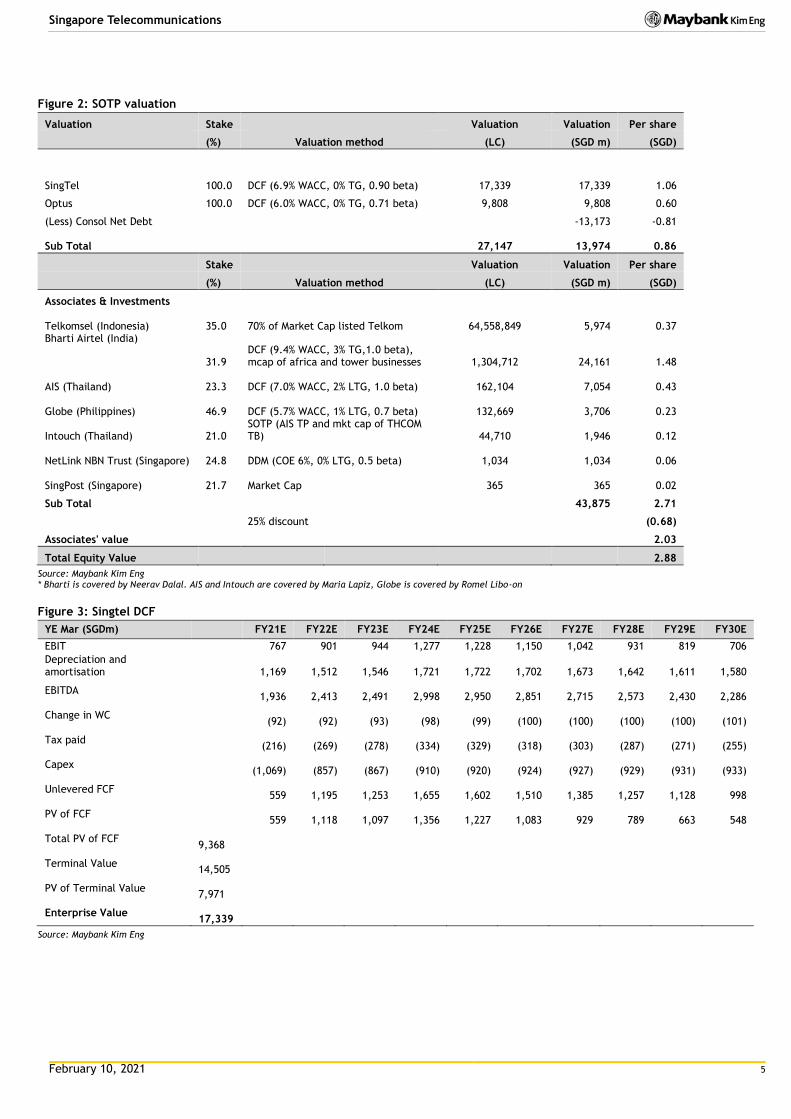
9MFY21 EBIT is on track to meet MKE/consensus estimates. Maintain BUY and SOTP-based TP of SGD2.88. We think the worst is over as we see earnings recovering sequentially due to: i) gradual ARPU recovery post-Covid; ii) potential 5G ARPU uplift of 1.9% YoY from FY23-26E; iii) BHARTI driving associates’ recovery. Singtel remains our Top Pick in the Singapore telco space. We see deep value in Singtel as the market is ascribing almost zero value to its SG and Australia operations, while offering 5.3% FY22E yield. This is followed by NetLink NBN Trust (NETLINK SP, CP: SGD0.955, BUY, TP: SGD1.11).
No changes to our forecasts
3QFY21 revenue of SGD4.2b fell 3% YoY but rose 9% QoQ due to strong demand for premium handsets (mainly iPhones). In addition, the decline in roaming and prepaid revenues was cushioned by the growth in subscription for the ‘Optus Choice’ customised data plans in Australia, which drove up post-paid ARPU by 2.7% QoQ. 9MFY20 revenue achieved 77%/76% of MKE/consensus. Operational EBITDA fell 14% YoY due to a narrower EBITDA margin of 23.7% (3QFY20: 26.6%, 2QFY21: 25.9%) as a result of a lower sales mix of National Broadband Network (NBN) migration. Meanwhile, EBIT reached 72%/76% of MKE/consensus estimates. We make no changes to our forecasts.
BHARTI takes the driving seat
Among the associates, green shoot is emerging for BHARTI (BHARTI IN, CP: INR595, BUY, TP: INR750) as 9MFY21 pre-tax loss narrowed significantly by 90.4% YoY to SGD35m. Additionally, we noted that BHARTI continues to outperform its peers across most operating metrics in India, recording the highest quarterly revenue due to strong customer additions. Our India telco analyst Neerav believes tariff hikes and 4G adoption from a low base will continue to be catalysts to drive BHARTI’s turnaround. We estimate India’s sector ARPU to grow 2-3% QoQ within 6 months and BHARTI to account for 18% of Singtel’s FY22E associates earnings. We believe BHARTI’s performance could drive recovery in regional associates’ contribution.
NCS may pose upside surprise
Enterprise revenue remained resilient despite disruptions to businesses caused by Covid-19. This was driven by strong ICT revenue growth of 7.9% YoY, led by NCS and Australia Enterprise as customers stepped up on digitalisation efforts. In particular, revenue from NCS was SGD809m (+75% QoQ and +79% YoY). While Group CEO Mr Yuen Kuan Moon has yet to announce his strategy, the recent restructuring of NCS to operate as an autonomous unit signals Singtel’s focus on the division.
Share Price SGD 2.40
12m Price Target SGD 2.88 (+20%)
Previous Price Target SGD 2.88
BUY
Company Description
Statistics
52w high/low (SGD)
3m avg turnover (USDm)
Free float (%)
Issued shares (m)
Market capitalisation
Major shareholders:
51.9%
5.7%
3.3%
16,515
63.6
Singtel is the largest integrated telecommunications
APPENDIX I: TERMS FOR PROVISION OF REPORT, DISCLAIMERS AND DISCLOSURES
DISCLAIMERS This research report is prepared for general circulation and for information purposes only and under no circumstances should it be considered or intended as an offer to sell or a solicitation of an offer to buy the securities referred to herein. Investors should note that values of such securities, if any, may fluctuate and that each secu rity’s price or value may rise or fall. Opinions or recommendations contained herein are in form of technical ratings and fundamental ratings. Technical ratings may differ from fundamental ratings as technical valuations apply different methodologies and are purely based on price and volume-related information extracted from the relevant jurisdiction’s stock exchange in the equity analysis. Accordingly, investors’ returns may be less than the original sum invested. Past performance is not necessarily a guide to future performance. This report is not intended to provide personal investment advice and does not take into account the specific investment objectives, the financial situation and the particular needs of persons who may receive or read this report. I nvestors should therefore seek financial, legal and other advice regarding the appropriateness of investing in any securities or the investment strategies discussed or recommended in this report.
The information contained herein has been obtained from sources believed to be reliable but such sources have not been independently verified by Maybank Investment Bank Berhad, its subsidiary and affiliates (collectively, “MKE”) and consequently no representation is made as to the accuracy or completeness of this report by MKE and it should not be relied upon as such. Accordingly, MKE and its officers, directors, associates, connected parties and/or employees (collectively, “Representatives”) shall not be liable for any direct, indirect or consequential losses or damages that may arise from the use or reliance of this report. Any information, opinions or recommendations contained herein are subject to change at any time, without prior notice.
This report may contain forward looking statements which are often but not always identified by the use of words such as “ant icipate”, “believe”, “estimate”, “intend”, “plan”, “expect”, “forecast”, “predict” and “project” and statements that an event or result “may”, “will”, “can”, “should”, “could” or “might” occur or be achieved and other similar expressions. Such forward looking statements are based on assumptions made and information currently available to us and are subject to certain risks and uncertainties that could cause the actual results to differ materially from those expressed in any forward looking statements. Readers are cautioned not to place undue relevance on these forward-looking statements. MKE expressly disclaims any obligation to update or revise any such forward looking statements to reflect new information, events or circumstances af ter the date of this publication or to reflect the occurrence of unanticipated events.
MKE and its officers, directors and employees, including persons involved in the preparation or issuance of this report, may, to the extent permitted by law, from time to time participate or invest in financing transactions with the issuer(s) of the securities mentioned in this report, perform services for or solicit business from such issuers, and/or have a position or holding, or other material interest, or effect transactions, in such securities or options thereon, or other investments related thereto. In addition, it may make markets in the securities mentioned in the material presented in this report. One or more directors, officers and/or employees of MKE may be a director of the issue rs of the securities mentioned in this report to the extent permitted by law.
This report is prepared for the use of MKE’s clients and may not be reproduced, altered in any way, transmitted to, copied or distr ibuted to any other party in whole or in part in any form or manner without the prior express written consent of MKE and MKE and its Representatives accepts no liability whatsoever for the actions of third parties in this respect.
This report is not directed to or intended for distribution to or use by any person or entity who is a citizen or resident of or located in any locality, state, country or other jurisdiction where such distribution, publication, availability or use would be contrary to law or regulation. This report is for distribution only under such circumstances as may be permitted by applicable law. The securities described herein may not be eligible for sale in all jurisdictions or to certain categories of investors. Without prejudice to the f oregoing, the reader is to note that additional disclaimers, warnings or qualifications may apply based on geographical location of the person or entity receiving this report.
Malaysia Opinions or recommendations contained herein are in the form of technical ratings and fundamental ratings. Technical ratings may differ from fundamental ratings as technical valuations apply different methodologies and are purely based on price and volume-related information extracted from Bursa Malaysia Securities Berhad in the equity analysis.
Singapore This report has been produced as of the date hereof and the information herein may be subject to change. Maybank Kim Eng Research Pte. Ltd. (“Maybank KERPL”) in Singapore has no obligation to update such information for any recipient. For distribution in Singapore, recipients of this report are to contact Maybank KERPL in Singapore in respect of any matters arising from, or in connection with, this report. If the recipient of this report is not an accredited investor, expert investor or i nstitutional investor (as defined under Section 4A of the Singapore Securities and Futures Act), Maybank KERPL shall be legally liable for the contents of this report, with such liability being limited to the extent (if any) as permitted by law.
Thailand Except as specifically permitted, no part of this presentation may be reproduced or distributed in any manner without the prior written permission of Maybank Kim Eng Securities (Thailand) Public Company Limited. Maybank Kim Eng Securities (Thailand) Public Company Limited (“MBKET”) accepts no liability whatsoeve r for the actions of third parties in this respect.
Due to different characteristics, objectives and strategies of institutional and retail investors, the research products of MBKET Inst itutional and Retail Research departments may differ in either recommendation or target price, or both. MBKET reserves the rights to disseminate MBKET Retail Research reports to institutional investors who have requested to receive it. If you are an authorised recipient, you hereby tacitly acknowledge that the research reports from MBKET Retail Research are first pr oduced in Thai and there is a time lag in the release of the translated English version.
The disclosure of the survey result of the Thai Institute of Directors Association (“IOD”) regarding corporate governance is made pursuant to the policy of the Office of the Securities and Exchange Commission. The survey of the IOD is based on the information of a company listed on the Stock Exchange of Thailand and the market for Alternative Investment disclosed to the public and able to be accessed by a general public investor. The result, therefore, is from the perspective of a third party. It is not an evaluation of operation and is not based on inside information. The survey result is as of the date appearing in the Corporate Governance Report of Thai Listed Companies. As a result, the survey may be changed after that date. MBKET does not confirm nor certify the accuracy of such survey result.
The disclosure of the Anti-Corruption Progress Indicators of a listed company on the Stock Exchange of Thailand, which is assessed by Thaipat Institute, is made in order to comply with the policy and sustainable development plan for the listed companies of the Office of the Securities and Exchange Commission. Tha ipat Institute made this assessment based on the information received from the listed company, as stipulated in the form for the assessment of Anti-corruption which refers to the Annual Registration Statement (Form 56-1), Annual Report (Form 56-2), or other relevant documents or reports of such listed company. The assessment result is therefore made from the perspective of Thaipat Institute that is a third party. It is not an assessment of operation and is not based on any inside information. Since this assessment is only the assessment result as of the date appearing in the assessment result, it may be changed after that date or when there is any change to the relevant information. Nevertheless, MBKET does not confirm, verify, or certify the accuracy and completeness of the assessment result.
US This third-party research report is distributed in the United States (“US”) to Major US Institutional Investors (as defined in Rule 15a-6 under the Securities Exchange Act of 1934, as amended) only by Maybank Kim Eng Securities USA Inc (“Maybank KESUSA”), a broker-dealer registered in the US (registered under Section 15 of the Securities Exchange Act of 1934, as amended). All responsibility for the distribution of this report by Maybank KESUSA in the US shall be borne by Maybank KESUSA. This report is not directed at you if MKE is prohibited or restricted by any legislation or regulation in any jurisdiction from making it available to you. You should satisfy yourself before reading it that Maybank KESUSA is permitted to provide research material concerning investments to you under relevant legislation and regulations. All U.S. persons receiving and/or accessing this report and wishing to effect transactions in any security mentioned within must do so with: Maybank Kim Eng Securities USA Inc. 400 Park Avenue, 11th Floor, New York, New York 10022, 1-(212) 688-8886 and not with, the issuer of this report.
February 10, 2021 12
Singapore Telecommunications
Disclosure of Interest
Malaysia: MKE and its Representatives may from time to time have positions or be materially interested in the securities referred to he rein and may further act as market maker or may have assumed an underwriting commitment or deal with such securities and may also perform or seek to perform investment banking services, advisory and other services for or relating to those companies. Singapore: As of 10 February 2021, Maybank KERPL and the covering analyst do not have any interest in any companies recommended in this research report. Thailand: MBKET may have a business relationship with or may possibly be an issuer of derivative warrants on the securities /companies mentioned in the research report. Therefore, Investors should exercise their own judgment before making any investment decisions. MBKET, its associates, directors, connected parties and/or employees may from time to time have interests and/or underwriting commitments in the securities mentioned in this report. Hong Kong: As of 10 February 2021, KESHK and the authoring analyst do not have any interest in any companies recommended in this research report. India: As of 10 February 2021, and at the end of the month immediately preceding the date of publication of the research report, KESI, authoring analyst or their associate / relative does not hold any financial interest or any actual or beneficial ownership in any shares or having any conflict of interest in the subject companies except as otherwise disclosed in the research report.
In the past twelve months KESI and authoring analyst or their associate did not receive any compensation or other benefits from the subject companies or third party in connection with the research report on any account what so ever except as otherwise disclosed in the research report.
MKE may have, within the last three years, served as manager or co-manager of a public offering of securities for, or currently may make a primary market in issues of, any or all of the entities mentioned in this report or may be providing, or have provided within the previous 12 months, significant advice or investment services in relation to the inves tment concerned or a related investment and may receive compensation for the services provided from the companies covered in this report.
OTHERS
Analyst Certification of Independence
The views expressed in this research report accurately reflect the analyst’s personal views about any and all of the subject securities or issuers; and no part of the research analyst’s compensation was, is or will be, directly or indirectly, related to the specific recommendations or views expressed in the report.
Reminder
Structured securities are complex instruments, typically involve a high degree of risk and are intended for sale only to soph isticated investors who are capable of understanding and assuming the risks involved. The market value of any structured security may be affected by changes in economic, financial and political factors (including, but not limited to, spot and forward interest and exchange rates), time to maturity, market conditions and volatility and the credit quality of any issuer or reference issuer. Any investor interested in purchasing a structured product should conduct its own analysis of the product and consult with its own professional advisers as to the risks involved in making such a purchase.
No part of this material may be copied, photocopied or duplicated in any form by any means or redistributed without the prior consent of MKE.
UK This document is being distributed by Maybank Kim Eng Securities (London) Ltd (“Maybank KESL”) which is authorized and regula ted, by the Financial Conduct Authority and is for Informational Purposes only. This document is not intended for distribution to anyone defined as a Retail Client under the Financial Services and Markets Act 2000 within the UK. Any inclusion of a third party link is for the recipients convenience only, and that the firm does not take any responsibility for its comments or accuracy, and that access to such links is at the individuals own risk. Nothing in this report should be considered as constituting legal, accounting or tax advice, and that f or accurate guidance recipients should consult with their own independent tax advisers.
DISCLOSURES
Legal Entities Disclosures Malaysia: This report is issued and distributed in Malaysia by Maybank Investment Bank Berhad (15938- H) which is a Participating Organization of Bursa Malaysia Berhad and a holder of Capital Markets and Services License issued by the Securities Commission in Malaysia. Singapore: This report is distributed in Singapore by Maybank KERPL (Co. Reg No 198700034E) which is regulated by the Monetary Authority of Singapore. Indonesia: PT Maybank Kim Eng Securities (“PTMKES”) (Reg. No. KEP-251/PM/1992) is a member of the Indonesia Stock Exchange and is regulated by the Financial Services Authority (Indonesia). Thailand: MBKET (Reg. No.0107545000314) is a member of the Stock Exchange of Thailand and is regulated by the Ministry of Finance and the Securities and Exchange Commission. Philippines: Maybank ATRKES (Reg. No.01-2004-00019) is a member of the Philippines Stock Exchange and is regulated by the Securities and Exchange Commission. Vietnam: Maybank Kim Eng Securities Limited (License Number: 117/GP-UBCK) is licensed under the State Securities Commission of Vietnam. Hong Kong: KESHK (Central Entity No AAD284) is regulated by the Securities and Futures Commission. India: Kim Eng Securities India Private Limited (“KESI”) is a participant of the National Stock Exchange of India Limited and the Bombay Stock Exchange and is regulated by Securities and Exchange Board of India (“SEBI”) (Reg. No. INZ000010538). KESI is also registered with SEBI as Category 1 Merchant Banker (Reg. No. INM 000011708) and as Research Analyst (Reg No: INH000000057) US: Maybank KESUSA is a member of/ and is authorized and regulated by the FINRA – Broker ID 27861. UK: Maybank KESL (Reg No 2377538) is authorized and regulated by the Financial Conduct Authority.
February 10, 2021 13
Singapore Telecommunications
Historical recommendations and target price: Singapore Telecommunications (ST SP)
Definition of Ratings
Maybank Kim Eng Research uses the following rating system
BUY Return is expected to be above 10% in the next 12 months (including dividends)
HOLD Return is expected to be between 0% to 10% in the next 12 months (including dividends)
SELL Return is expected to be below 0% in the next 12 months (including dividends)
Applicability of Ratings
The respective analyst maintains a coverage universe of stocks, the list of which may be adjusted according to needs. Investment ratings are only applicable to the stocks which form part of the coverage universe. Reports on companies which are not part of the coverage do not carry investment ratings as we do not actively follow developments in these companies.