78
10 Analytic Geometry 57050_10_ch10_p742-819.qxd 08/04/2008 11:46 AM Page 742

10 Analytic Geometry
57050_10_ch10_p742-819.qxd 08/04/2008 11:46 AM Page 742

CHAPTER 10 Analytic Geometry 743
Chapter Overview
Conic sections are the curves we get when we make a straight cut in a cone, as shownin the figure. For example, if a cone is cut horizontally, the cross section is a circle.So a circle is a conic section. Other ways of cutting a cone produce parabolas,ellipses, and hyperbolas.
Our goal in this chapter is to find equations whose graphs are the conic sections.We already know from Section 1.8 that the graph of the equation x 2 � y 2 � r 2 is acircle. We will find equations for each of the other conic sections by analyzing theirgeometric properties.
Conic sections are important because their shapes are hidden in the structure ofmany things. For example, the path of a planet moving around the sun is an ellipse.
The trajectory of abasketball is a parabola.
The orbit of a planetis an ellipse.
The shape of a coolingtower is a hyperbola.
Ellipse Parabola HyperbolaCircle
743
10.1 Parabolas
10.2 Ellipses
10.3 Hyperbolas
10.4 Shifted Conics
10.5 Rotation of Axes
10.6 Polar Equations of Conics
10.7 Plane Curves and Parametric Equations
Phot
oDis
c/Ge
tty Im
ages
57050_10_ch10_p742-819.qxd 08/04/2008 11:46 AM Page 743

744 CHAPTER 10 Analytic Geometry
SUGGESTED TIME
AND EMPHASIS
class.
Recommended material.
POINTS TO STRESS
1. The definition and geometryof parabolas.
2. Using the equation of aparabola to find relevantconstants.
3. Graphing a parabola given itsequation.
12
IN-CLASS MATERIALS
Have students sketch a parabola “from scratch.” Hand out a sheet of paper with focus and directrix, andhand out rulers. Get the students to just plot points where the distance from the point to the directrix isequal to the distance from the point to the focus. Have them keep plotting points until a parabolic shapeemerges.
The path of a projectile (such as a rocket, a basketball, or water spouting from a foun-tain) is a parabola—which makes the study of parabolas indispensable in rocket sci-ence. The conic sections also occur in many unexpected places. For example, thegraph of crop yield as a function of amount of rainfall is a parabola (see page 321).We will examine some uses of the conics in medicine, engineering, navigation, andastronomy.
In Section 10.7 we study parametric equations, which we can use to describe thecurve that a moving body traces out over time. In Focus on Modeling, page 816, wederive parametric equations for the path of a projectile.
10.1 Parabolas
We saw in Section 2.5 that the graph of the equation y � ax 2 � bx � c is a U-shapedcurve called a parabola that opens either upward or downward, depending onwhether the sign of a is positive or negative.
In this section we study parabolas from a geometric rather than an algebraic pointof view. We begin with the geometric definition of a parabola and show how this leadsto the algebraic formula that we are already familiar with.
744 CHAPTER 10 Analytic Geometry
Geometric Definition of a Parabola
A parabola is the set of points in the plane equidistant from a fixed point F(called the focus) and a fixed line l (called the directrix).
This definition is illustrated in Figure 1. The vertex V of the parabola lies halfwaybetween the focus and the directrix, and the axis of symmetry is the line that runsthrough the focus perpendicular to the directrix.
In this section we restrict our attention to parabolas that are situated with the ver-tex at the origin and that have a vertical or horizontal axis of symmetry. (Parabolas inmore general positions will be considered in Sections 10.4 and 10.5.) If the focus ofsuch a parabola is the point , then the axis of symmetry must be vertical andthe directrix has the equation y � �p. Figure 2 illustrates the case p � 0.
Figure 2
y=_p
F(0, p)
P(x, y)
y
x
y
0 p
p
F10, p 2
parabola
l
axis
focus
vertex directrix
F
V
Figure 1
57050_10_ch10_p742-819.qxd 08/04/2008 11:46 AM Page 744

CHAPTER 10 Analytic Geometry 745
If is any point on the parabola, then the distance from P to the focus F (us-ing the Distance Formula) is
The distance from P to the directrix is
By the definition of a parabola, these two distances must be equal:
Square both sides
Expand
Simplify
If p � 0, then the parabola opens upward, but if p � 0, it opens downward. When xis replaced by �x, the equation remains unchanged, so the graph is symmetric aboutthe y-axis.
Equations and Graphs of Parabolas
The following box summarizes what we have just proved about the equation and fea-tures of a parabola with a vertical axis.
x2 � 4py
x2 � 2py � 2py
x2 � y2 � 2py � p2 � y2 � 2py � p2
x2 � 1y � p 2 2 � 0 y � p 0 2 � 1y � p 2 2 2x2 � 1y � p 2 2 � 0 y � p 00 y � 1�p 2 0 � 0 y � p 02x2 � 1y � p 2 2
P1x, y 2SECTION 10.1 Parabolas 745
Parabola with Vertical Axis
The graph of the equation
is a parabola with the following properties.
VERTEX
FOCUS
DIRECTRIX
The parabola opens upward if p � 0 or downward if p � 0.
y=_p
F(0, p)
x
y
0
≈=4py with p>0 ≈=4py with p<0
y=_p
F(0, p)
x
y
0
y � �p
F10, p 2V10, 0 2x2 � 4py
57050_10_ch10_p742-819.qxd 08/04/2008 11:46 AM Page 745

746 CHAPTER 10 Analytic Geometry
ALTERNATE EXAMPLE 1Find the equation of the parabolawith vertex V(0, 0) and focusF(0, -8).
ANSWER
ALTERNATE EXAMPLE 2Find the focus and directrix of theparabola y = -5x2.
ANSWER
a0, 1
20b , y =
1
20
x2 = -32y
IN-CLASS MATERIALS
As of this writing, it is possible to purchase a parabolic listening device for about $50 on eBay, or about$80 new. If this is feasible, many experiments and demonstrations can be done. For example, students canwhisper from a long distance away and be heard using the device.
Example 1 Finding the Equation of a Parabola
Find the equation of the parabola with vertex and focus , and sketchits graph.
Solution Since the focus is , we conclude that p � 2 (and so the directrixis ). Thus, the equation of the parabola is
x2 � 4py with p � 2
Since p � 2 � 0, the parabola opens upward. See Figure 3.
■
Example 2 Finding the Focus and Directrix
of a Parabola from Its Equation
Find the focus and directrix of the parabola y � �x 2, and sketch the graph.
Solution To find the focus and directrix, we put the given equation in the standard form x 2 � �y. Comparing this to the general equation x 2 � 4py, we seethat 4p � �1, so . Thus, the focus is and the directrix is .The graph of the parabola, together with the focus and the directrix, is shown inFigure 4(a). We can also draw the graph using a graphing calculator as shown in Figure 4(b).
■
x
y
2_2
1
_2y=_≈
F!0, _ @14
14y=
(a) (b)
1
2_2
_4
Figure 4
y � 14F A0, �
14Bp � �
14
y=_2
F(0, 2)
≈=8y
x
y
3_3
_3
3
0
Figure 3
x2 � 8y
x2 � 412 2yy � �2F10, 2 2
F10, 2 2V10, 0 2746 CHAPTER 10 Analytic Geometry
Mathematics in
the Modern World
Looking Inside Your Head
How would you like to look insideyour head? The idea isn’t particu-larly appealing to most of us, butdoctors often need to do just that. Ifthey can look without invasivesurgery, all the better. An X-raydoesn’t really give a look inside, itsimply gives a “graph” of the den-sity of tissue the X-rays must passthrough. So an X-ray is a “flat-tened” view in one direction. Sup-pose you get an X-ray view frommany different directions—canthese “graphs” be used to recon-struct the three-dimensional insideview? This is a purely mathematicalproblem and was solved by mathe-maticians a long time ago. How-ever, reconstructing the inside viewrequires thousands of tedious com-putations. Today, mathematics andhigh-speed computers make it pos-sible to “look inside” by a processcalled Computer Aided Tomogra-phy (or CAT scan). Mathematicianscontinue to search for better waysof using mathematics to reconstructimages. One of the latest tech-niques, called magnetic resonanceimaging (MRI), combines molecu-lar biology and mathematics for aclear “look inside.”
Roge
r Res
smey
er/C
orbi
s
57050_10_ch10_p742-819.qxd 08/04/2008 11:46 AM Page 746

CHAPTER 10 Analytic Geometry 747
SAMPLE QUESTION
Text Question
How can you tell if the axis of aparabola is vertical or horizontal?
Answer
If there is a y2 term it is horizontal;if there is an x2 term it is vertical.
ALTERNATE EXAMPLE 3 Find the focus and directrix of theparabola. 2x + y 2 = 0
ANSWER
a0, -1
2b , x =
1
2
Reflecting the graph in Figure 2 about the diagonal line y � x has the effect of interchanging the roles of x and y. This results in a parabola with horizontal axis. By the same method as before, we can prove the following properties.
SECTION 10.1 Parabolas 747
Parabola with Horizontal Axis
The graph of the equation
is a parabola with the following properties.
VERTEX
FOCUS
DIRECTRIX
The parabola opens to the right if p � 0 or to the left if p � 0.
x=_p
F( p, 0)x
y
0
x=_p
F( p, 0)x
y
0
¥=4px with p>0 ¥=4px with p<0
x � �p
F1p, 0 2V10, 0 2y2 � 4px
Example 3 A Parabola with Horizontal Axis
A parabola has the equation 6x � y 2 � 0.
(a) Find the focus and directrix of the parabola, and sketch the graph.
(b) Use a graphing calculator to draw the graph.
Solution
(a) To find the focus and directrix, we put the given equation in the standard formy 2 � �6x. Comparing this to the general equation y 2 � 4px, we see that 4p � �6, so . Thus, the focus is and the directrix is .Since p � 0, the parabola opens to the left. The graph of the parabola, togetherwith the focus and the directrix, is shown in Figure 5(a) on the next page.
(b) To draw the graph using a graphing calculator, we need to solve for y.
Subtract 6x
Take square roots y � ;1�6x
y2 � �6x
6x � y2 � 0
x � 32F A�
32, 0Bp � �3
2
57050_10_ch10_p742-819.qxd 08/04/2008 11:46 AM Page 747

748 CHAPTER 10 Analytic Geometry
IN-CLASS MATERIALS
Make the connection between quadratic functions and parabolas explicit. Point out that any equation of theform y = ax2 + bx + c can be written as y = n(x - h)2 + k by completing the square, yielding a (possiblyshifted) parabola. The constant n, of course, can be written as 4p. Note that if a = 0 we have a line. So wecan call a line a “degenerate parabola.”
To obtain the graph of the parabola, we graph both functions
as shown in Figure 5(b).
Figure 5■
The equation y 2 � 4px does not define y as a function of x (see page 164). So,to use a graphing calculator to graph a parabola with horizontal axis, we must firstsolve for y. This leads to two functions, and . We need tograph both functions to get the complete graph of the parabola. For example, in Fig-ure 5(b) we had to graph both and to graph the parabola y 2 � �6x.
We can use the coordinates of the focus to estimate the “width” of a parabola whensketching its graph. The line segment that runs through the focus perpendicular to theaxis, with endpoints on the parabola, is called the latus rectum, and its length is thefocal diameter of the parabola. From Figure 6 we can see that the distance from anendpoint Q of the latus rectum to the directrix is . Thus, the distance from Q tothe focus must be as well (by the definition of a parabola), and so the focal di-ameter is . In the next example we use the focal diameter to determine the“width” of a parabola when graphing it.
latusrectum
x=_p
F( p, 0)
2p
ppQ
x
y
0
Figure 6
0 4p 0 0 2p 0 0 2p 0
y � �1�6xy � 1�6x
y � �14pxy � 14px
(a)
32x=
32_F ! , 0@ 1
1
6x+¥=0
x
y
0 2_6
_6
6
y = – –6x
(b)
y = –6x
y � 1�6x and y � �1�6x
748 CHAPTER 10 Analytic Geometry
Archimedes (287–212 B.C.) wasthe greatest mathematician of theancient world. He was born inSyracuse, a Greek colony on Sicily,a generation after Euclid (see page532). One of his many discoveriesis the Law of the Lever (see page69). He famously said, “Give me aplace to stand and a fulcrum for mylever, and I can lift the earth.”
Renowned as a mechanical ge-nius for his many engineering in-ventions, he designed pulleys forlifting heavy ships and the spiralscrew for transporting water tohigher levels. He is said to haveused parabolic mirrors to concen-trate the rays of the sun to set fire toRoman ships attacking Syracuse.
King Hieron II of Syracuse oncesuspected a goldsmith of keepingpart of the gold intended for theking’s crown and replacing it withan equal amount of silver. The kingasked Archimedes for advice.While in deep thought at a publicbath, Archimedes discovered thesolution to the king’s problemwhen he noticed that his body’svolume was the same as the volumeof water it displaced from the tub.As the story is told, he ran homenaked, shouting “Eureka, eureka!”(“I have found it, I have found it!”)This incident attests to his enor-mous powers of concentration.
In spite of his engineeringprowess, Archimedes was mostproud of his mathematical discov-
(continued)
57050_10_ch10_p742-819.qxd 08/04/2008 11:46 AM Page 748

CHAPTER 10 Analytic Geometry 749
ALTERNATE EXAMPLE 4Find the focus, directrix, and focaldiameter of the parabola.
ANSWER
ALTERNATE EXAMPLE 5aFind equations for the parabolaswith vertex at the origin and foci:
ANSWER
DRILL QUESTION
Find the focus and directrix of
and sketch its graph.
Answer
Focus (0, 4), directrix y = -4
4
focus
directrix
1
x
y
_4
y =1
16 x2
y = 0.0625x2
y = 2x2, y = x2, y = 0.25x2,
F4(0, 4)
F3(0, 1),F1a0, 1
8b , F2a0,
1
4b ,
a0, 9
16b , y = -
9
16,
9
4
y = 4
9x2
IN-CLASS MATERIALS
Using dental floss and modeling compound (such as clay or Play-Doh®), it is easy for the students to makehalf a cone and slice it. Have the class attempt to do so to get a parabola. Most of them will wind up creat-ing half of a hyperbola. Refer these students to the chapter overview. Make sure they note that a parabola isnot as easy to create this way as hyperbolas or ellipses. If the cut is made at the wrong angle, even slightly,one of these two shapes will be formed instead of a parabola.
Example 4 The Focal Diameter of a Parabola
Find the focus, directrix, and focal diameter of the parabola , and sketch its graph.
Solution We first put the equation in the form x 2 � 4py.
Multiply each side by 2
From this equation we see that 4p � 2, so the focal diameter is 2. Solving for pgives , so the focus is and the directrix is . Since the focal diameter is 2, the latus rectum extends 1 unit to the left and 1 unit to the right of the focus. The graph is sketched in Figure 7. ■
In the next example we graph a family of parabolas, to show how changing thedistance between the focus and the vertex affects the “width” of a parabola.
Example 5 A Family of Parabolas
(a) Find equations for the parabolas with vertex at the origin and foci, and .
(b) Draw the graphs of the parabolas in part (a). What do you conclude?
Solution
(a) Since the foci are on the positive y-axis, the parabolas open upward and haveequations of the form x 2 � 4py. This leads to the following equations.
Equation Form of the equation Focus p x 2 � 4py for graphing calculator
y � 2x 2
x 2 � 2y y � 0.5x 2
p � 1 x 2 � 4y y � 0.25x 2
p � 4 x 2 � 16y y � 0.0625x 2
(b) The graphs are drawn in Figure 8. We see that the closer the focus to the vertex,the narrower the parabola.
Figure 8
A family of parabolas ■
5
_0.5_5 5
5
_0.5_5 5
5
_0.5_5 5
5
_0.5_5 5
y=2≈ y=0.5≈ y=0.25≈ y=0.0625≈
F410, 4 2F310, 1 2 p � 12F2A0, 12B x2 � 1
2 yp � 18F1A0, 18B
F410, 4 2F1A0, 18B, F2A0, 12B, F3A0, 1B
y � � 12A0, 12Bp � 1
2
x2 � 2y
y � 12 x2
y � 12 x2
SECTION 10.1 Parabolas 749
eries. These include the formulasfor the volume of a sphere,
; the surface area of asphere, ; and a carefulanalysis of the properties ofparabolas and other conics.
S � 4pr 2V � 4
3 pr 3
x
y
2
1 1
12y=_
12y= x™
12F !0, @
12!_1, @ 1
2!1, @
Figure 7
57050_10_ch10_p742-819.qxd 08/04/2008 11:46 AM Page 749

750 CHAPTER 10 Analytic Geometry
EXAMPLEA shifted parabola:y = 2x2 - 8x + 2
= 2(x2 - 4x) + 2= 2(x2 - 4x + 4) - 6= 2(x - 2)2 - 6
.
ALTERNATE EXAMPLE 6A searchlight has a parabolicreflector that forms a “bowl,”which is 18 in. wide from rim torim and 10 in. deep, as shown inthe figure below. If the filamentof the light bulb is located at thefocus, how far from the vertex ofthe reflector is it?
ANSWER
81
40
18 in.
10 in.
3210
2
_2
_4
_6
x
y-1
2 - 6 = -132
directrix y == A2, -112 B ,
p = 12, focus A0 + 2, 12 - 6 B
IN-CLASS MATERIALS
Discuss the reflection properties of parabolas: A beam of light originating at the origin will emerge parallelto the parabola’s axis of symmetry, and a beam of light that is parallel to the parabola’s axis of symmetrywill reflect off of the parabola in a direction that goes through its focus. One nice project is to construct aparabolic pool table or miniature golf hole. The students accurately graph a parabola, and glue erasers orwood along its border, placing the “hole” at the focus. A golf ball or pool ball that is rolled in a directionparallel to the axis will always bounce into the hole.
Applications
Parabolas have an important property that makes them useful as reflectors for lampsand telescopes. Light from a source placed at the focus of a surface with paraboliccross section will be reflected in such a way that it travels parallel to the axis of theparabola (see Figure 9). Thus, a parabolic mirror reflects the light into a beam of par-allel rays. Conversely, light approaching the reflector in rays parallel to its axis ofsymmetry is concentrated to the focus. This reflection property, which can be provedusing calculus, is used in the construction of reflecting telescopes.
Example 6 Finding the Focal Point of
a Searchlight Reflector
A searchlight has a parabolic reflector that forms a “bowl,” which is 12 in. widefrom rim to rim and 8 in. deep, as shown in Figure 10. If the filament of the lightbulb is located at the focus, how far from the vertex of the reflector is it?
Solution We introduce a coordinate system and place a parabolic cross section of the reflector so that its vertex is at the origin and its axis is vertical (see Figure 11). Then the equation of this parabola has the form x 2 � 4py. FromFigure 11 we see that the point lies on the parabola. We use this to find p.
The point satisfies the equation x2 � 4py
The focus is , so the distance between the vertex and the focus is .Because the filament is positioned at the focus, it is located . from the vertex of the reflector. ■
1 18 in
98 � 1
18 inF A0, 98B p � 9
8
36 � 32p
16, 8 2 62 � 4p18 2 16, 8 2
8 in.
12 in.
Figure 10
A parabolic reflector
F
Figure 9
Parabolic reflector
750 CHAPTER 10 Analytic Geometry
(6, 8)
8
12
1 18
x
y
0_6 6
Figure 11
57050_10_ch10_p742-819.qxd 08/04/2008 11:46 AM Page 750

CHAPTER 10 Analytic Geometry 751
SECTION 10.1 Parabolas 751
1–6 ■ Match the equation with the graphs labeled I–VI. Givereasons for your answers.
1. y 2 � 2x 2. 3. x 2 � �6y
4. 2x 2 � y 5. y 2 � 8x � 0 6. 12y � x 2 � 0
7–18 ■ Find the focus, directrix, and focal diameter of theparabola, and sketch its graph.
7. y 2 � 4x 8. x 2 � y
9. x 2 � 9y 10. y 2 � 3x
11. y � 5x 2 12. y � �2x 2
13. x � �8y 2 14.
15. x 2 � 6y � 0 16. x � 7y 2 � 0
17. 5x � 3y 2 � 0 18. 8x 2 � 12y � 0
19–24 ■ Use a graphing device to graph the parabola.
19. x 2 � 16y 20. x 2 � �8y
21. 22. 8y 2 � x
23. 4x � y 2 � 0 24. x � 2y 2 � 0
25–36 ■ Find an equation for the parabola that has its vertex atthe origin and satisfies the given condition(s).
25. Focus 26. Focus F A0, � 12BF10, 2 2
y2 � � 13 x
x � 12 y2
I II
x101
y
III IV
x11
y
x10
1
y
x2
2
y
V VI
x10
1
y
x1
1
y
0
y2 � � 14 x
27. Focus 28. Focus
29. Directrix x � 2 30. Directrix y � 6
31. Directrix y � �10 32. Directrix
33. Focus on the positive x-axis, 2 units away from the directrix
34. Directrix has y-intercept 6
35. Opens upward with focus 5 units from the vertex
36. Focal diameter 8 and focus on the negative y-axis
37–46 ■ Find an equation of the parabola whose graph isshown.
37. 38.
39. 40.
41. 42.
43. 44.
directrix
square hasarea 16
y
0 x
(4, _2)
0
y
x
focus
y
0 x5
3232
0
y
x
focus
0
y
x_3
focus
x=4
0
y
x
directrix
x=_2
0
y
x
directrix
0
y
x
2
focus
x � � 18
F15, 0 2F1�8, 0 210.1 Exercises
57050_10_ch10_p742-819.qxd 08/04/2008 11:46 AM Page 751

752 CHAPTER 10 Analytic Geometry
752 CHAPTER 10 Analytic Geometry
45. 46.
47. (a) Find equations for the family of parabolas with vertex at the origin and with directrixes , y � 1, y � 4,and y � 8.
(b) Draw the graphs. What do you conclude?
48. (a) Find equations for the family of parabolas with vertex atthe origin, focus on the positive y-axis, and with focaldiameters 1, 2, 4, and 8.
(b) Draw the graphs. What do you conclude?
Applications
49. Parabolic Reflector A lamp with a parabolic reflector isshown in the figure. The bulb is placed at the focus and thefocal diameter is 12 cm.
(a) Find an equation of the parabola.
(b) Find the diameter of the opening, 20 cm fromthe vertex.
50. Satellite Dish A reflec-tor for a satellite dish isparabolic in cross section,with the receiver at the focus F. The reflector is 1 ft deep and 20 ft widefrom rim to rim (see thefigure). How far is the re-ceiver from the vertex ofthe parabolic reflector?
51. Suspension Bridge In a suspension bridge the shape of the suspension cables is parabolic. The bridge shown inthe figure has towers that are 600 m apart, and the lowest
A
B
6 cm
6 cm
20 cmO
D
C
F
d1C, D 2
y � 12
focus
y
0 x2
12slope=
focus shadedregionhas area 8
0
y
x
point of the suspension cables is 150 m below the top of the towers. Find the equation of the parabolic part of the cables, placing the origin of the coordinate system at thevertex.
NOTE This equation is used to find the length of cableneeded in the construction of the bridge.
52. Reflecting Telescope The Haletelescope at the Mount PalomarObservatory has a 200-in. mirror,as shown. The mirror is con-structed in a parabolic shape thatcollects light from the stars and focuses it at the prime focus, thatis, the focus of the parabola. Themirror is 3.79 in. deep at its center.Find the focal length of this para-bolic mirror, that is, the distancefrom the vertex to the focus.
Discovery • Discussion
53. Parabolas in the Real World Several examples of theuses of parabolas are given in the text. Find other situationsin real life where parabolas occur. Consult a scientific ency-clopedia in the reference section of your library, or searchthe Internet.
54. Light Cone from a Flashlight A flashlight is held toform a lighted area on the ground, as shown in the figure. Is it possible to angle the flashlight in such a way that theboundary of the lighted area is a parabola? Explain your answer.
600 m
150 m
F
1 ft20 ft
?
Primefocus
200 in.
3.79 in.
57050_10_ch10_p742-819.qxd 08/04/2008 11:47 AM Page 752
CHAPTER 10 Analytic Geometry 753
SUGGESTED TIME
AND EMPHASIS
class.
Optional material.
POINTS TO STRESS
1. The definition and geometryof ellipses.
2. Using the equation of an ellipseto find relevant constants and tograph the ellipse.
3. Eccentricity.
12 -1
IN-CLASS MATERIALS
Many representational artists never draw circles, notingthat it is rare in nature to see a circle, since we are usuallylooking at an angle, thus seeing an ellipse. Perhaps havethe students bring in photographs of manhole covers andother “circular” objects, noting that if the camera angle isnot straight on, the resultant image is elliptical. (Becauseof the optical illusion of perspective, it makes thingseasier to draw the outline of the “circle” with a markerto see that it is an ellipse.)
10.2 Ellipses
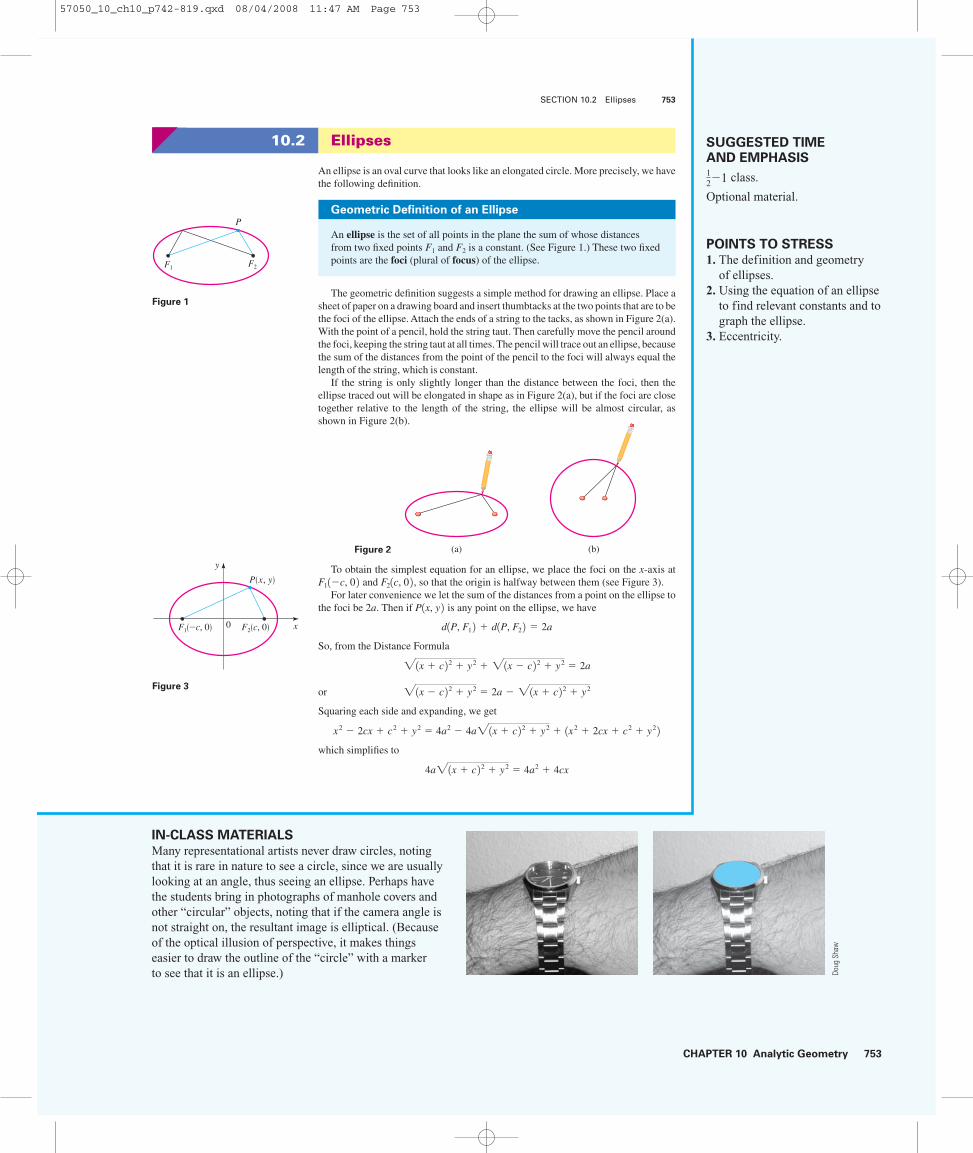
An ellipse is an oval curve that looks like an elongated circle. More precisely, we havethe following definition.
The geometric definition suggests a simple method for drawing an ellipse. Place asheet of paper on a drawing board and insert thumbtacks at the two points that are to bethe foci of the ellipse. Attach the ends of a string to the tacks, as shown in Figure 2(a).With the point of a pencil, hold the string taut. Then carefully move the pencil aroundthe foci, keeping the string taut at all times. The pencil will trace out an ellipse, becausethe sum of the distances from the point of the pencil to the foci will always equal thelength of the string, which is constant.
If the string is only slightly longer than the distance between the foci, then the ellipse traced out will be elongated in shape as in Figure 2(a), but if the foci are closetogether relative to the length of the string, the ellipse will be almost circular, asshown in Figure 2(b).
To obtain the simplest equation for an ellipse, we place the foci on the x-axis atand , so that the origin is halfway between them (see Figure 3).
For later convenience we let the sum of the distances from a point on the ellipse tothe foci be 2a. Then if is any point on the ellipse, we have
So, from the Distance Formula
or
Squaring each side and expanding, we get
which simplifies to
4a21x � c 2 2 � y2 � 4a2 � 4cx
x2 � 2cx � c2 � y2 � 4a2 � 4a21x � c 2 2 � y2 � 1x2 � 2cx � c2 � y2 221x � c 2 2 � y2 � 2a � 21x � c 2 2 � y2
21x � c 2 2 � y2 � 21x � c 2 2 � y2 � 2a
d1P, F1 2 � d1P, F2 2 � 2a
P1x, y 2F21c, 0 2F11�c, 0 2(b)(a)Figure 2
SECTION 10.2 Ellipses 753
P(x, y)
F¤(c, 0)F⁄(_c, 0) 0
y
x
Figure 3
F⁄
P
F¤
Figure 1
Geometric Definition of an Ellipse
An ellipse is the set of all points in the plane the sum of whose distancesfrom two fixed points F1 and F2 is a constant. (See Figure 1.) These two fixedpoints are the foci (plural of focus) of the ellipse.
Doug
Sha
w
57050_10_ch10_p742-819.qxd 08/04/2008 11:47 AM Page 753

754 CHAPTER 10 Analytic Geometry
DRILL QUESTION
Find the vertices and foci of theellipse 4x2 + y2 = 1 and sketchits graph.
Answer
Vertices: (0, 1), (0, -1), ,
Foci: a0, 13
2b a0, -
13
2b
a- 1
2, 0b
a1
2, 0b
y
x_1 10 2_2
_1
1
IN-CLASS MATERIALS
Note that if a = b then we have only one focus, at (0, 0). In this case, the geometric definition breaksdown, but it is clear from the equation that we have a circle. This is why a circle can be thought of as a“degenerate ellipse.”
(0, b)
(a, 0)
(_a, 0)
(0, _b)
(_c, 0) (c, 0)
b
c
a
0
y
x
Dividing each side by 4 and squaring again, we get
Since the sum of the distances from P to the foci must be larger than the distance be-tween the foci, we have that 2a � 2c, or a � c. Thus, a 2 � c 2 � 0, and we can divideeach side of the preceding equation by to get
For convenience let b 2 � a 2 � c 2 1with b � 02. Since b 2 � a 2, it follows that b � a.The preceding equation then becomes
This is the equation of the ellipse. To graph it, we need to know the x- and y-intercepts.Setting y � 0, we get
so x 2 � a 2, or x � �a. Thus, the ellipse crosses the x-axis at and , asin Figure 4. These points are called the vertices of the ellipse, and the segment thatjoins them is called the major axis. Its length is 2a.
1�a, 0 21a, 0 2x2
a2 � 1
x2
a2 �y2
b2 � 1 with a � b
x2
a2 �y2
a2 � c2 � 1
a21a2 � c2 2 1a2 � c2 2x2 � a2y2 � a21a2 � c2 2 a2x2 � 2a2cx � a2c2 � a2y2 � a4 � 2a2cx � c2x2
a2 3 1x � c 2 2 � y2 4 � 1a2 � cx 2 2754 CHAPTER 10 Analytic Geometry
Figure 4
x2
a2 �y2
b2 � 1 with a � b
Similarly, if we set x � 0, we get y � �b, so the ellipse crosses the y-axis at and . The segment that joins these points is called the minor axis, and it haslength 2b. Note that 2a � 2b, so the major axis is longer than the minor axis. The ori-gin is the center of the ellipse.
If the foci of the ellipse are placed on the y-axis at rather than on the x-axis, then the roles of x and y are reversed in the preceding discussion, and we geta vertical ellipse.
Equations and Graphs of Ellipses
The following box summarizes what we have just proved about the equation and fea-tures of an ellipse centered at the origin.
10, �c 210, �b 2 10, b 2
The orbits of the planets are ellipses,with the sun at one focus.
57050_10_ch10_p742-819.qxd 08/04/2008 11:47 AM Page 754

CHAPTER 10 Analytic Geometry 755
SAMPLE QUESTION
Text Question
Does describe a
horizontal or a vertical ellipse?How do you know?
Answer
It is vertical because the denomi-nator of the y2 term is larger thanthat of the x2 term.
ALTERNATE EXAMPLE 1Find the foci, vertices, and thelengths of the major and minoraxes for the following ellipse.
ANSWER
EXAMPLE
A vertical ellipse:
EXAMPLE A horizontal ellipse:
x
y
40_4
1
_1
x2
9+ 4y2 = 1
50_5
5
_5
x
y
x2
16+
y2
25= 1
(6, 0), (-6, 0), 12, 10
A111, 0 B , A-111, 0 B ,
x2
36+
y2
25= 1
x2
52 +y2
62 = 1
IN-CLASS MATERIALS
Have students sketch an ellipse with thumbtacks and string, as suggested in the text. Have some use focithat are close together, and some that are farther apart. Make sure they see the connection between thisactivity and the idea that the summed distance from the foci is a constant.
Example 1 Sketching an Ellipse
An ellipse has the equation
(a) Find the foci, vertices, and the lengths of the major and minor axes, and sketchthe graph.
(b) Draw the graph using a graphing calculator.
Solution
(a) Since the denominator of x 2 is larger, the ellipse has horizontal major axis. Thisgives a 2 � 9 and b 2 � 4, so c 2 � a 2 � b 2 � 9 � 4 � 5. Thus, a � 3, b � 2,and .
FOCI
VERTICES
LENGTH OF MAJOR AXIS 6
LENGTH OF MINOR AXIS 4
The graph is shown in Figure 5(a) on the next page.
1�3, 0 21�15, 0 2c � 15
x2
9�
y2
4� 1
SECTION 10.2 Ellipses 755
Ellipse with Center at the Origin
The graph of each of the following equations is an ellipse with center at theorigin and having the given properties.
EQUATION
a � b � 0 a � b � 0
VERTICES
MAJOR AXIS Horizontal, length 2a Vertical, length 2a
MINOR AXIS Vertical, length 2b Horizontal, length 2b
FOCI , c 2 � a 2 � b 2 , c 2 � a 2 � b 2
GRAPH
b
a
_a
_b
F⁄(0, _c)
F¤(0, c)y
x0
b
a_a
_b
F⁄(_c, 0) F¤(c, 0)
y
x0
10, �c 21�c, 0 210, �a 21�a, 0 2x2
b2 �y2
a2 � 1x2
a2 �y2
b2 � 1
In the standard equation for an ellipse,a 2 is the larger denominator and b 2 isthe smaller. To find c 2, we subtract:larger denominator minus smaller denominator.
57050_10_ch10_p742-819.qxd 08/04/2008 11:47 AM Page 755

756 CHAPTER 10 Analytic Geometry
ALTERNATE EXAMPLE 2The vertices of an ellipse are
and the foci are .Find its equation.
ANSWERx2
36+
y2
20= 1
(; 4, 0)(;6, 0)
(b) To draw the graph using a graphing calculator, we need to solve for y.
Subtract x2/9
Multiply by 4
Take square roots
To obtain the graph of the ellipse, we graph both functions
as shown in Figure 5(b).
■
Example 2 Finding the Foci of an Ellipse
Find the foci of the ellipse 16x 2 � 9y 2 � 144, and sketch its graph.
Solution First we put the equation in standard form. Dividing by 144, we get
Since 16 � 9, this is an ellipse with its foci on the y-axis, and with a � 4 and b � 3. We have
Thus, the foci are . The graph is shown in Figure 6(a).10, �17 2 c � 17
c2 � a2 � b2 � 16 � 9 � 7
x2
9�
y2
16� 1
(b)(a)
3
40 x
y
F⁄!_œ∑5, 0@
F¤!œ∑5, 0@
4.7_4.7
_3.1
3.1
y = –2 œ∑∑∑∑∑1 – x2/9
y = 2 œ∑∑∑∑∑1 – x2/9
y � 221 � x2/9 and y � �2 21 � x2/9
y � �2 B1 �x2
9
y2 � 4 a1 �x2
9b
y2
4� 1 �
x2
9
x2
9�
y2
4� 1
756 CHAPTER 10 Analytic Geometry
Figure 5
x2
9�
y2
4� 1
Note that the equation of an ellipsedoes not define y as a function of x (seepage 164). That’s why we need tograph two functions to graph an ellipse.
57050_10_ch10_p742-819.qxd 08/04/2008 11:47 AM Page 756

CHAPTER 10 Analytic Geometry 757
ALTERNATE EXAMPLE 3 Find the foci of the ellipse 9x2 + 4y2 = 36.
ANSWER
(0, 15), (0, -15)
We can also draw the graph using a graphing calculator as shown in Figure 6(b).
■
Example 3 Finding the Equation of an Ellipse
The vertices of an ellipse are and the foci are . Find its equation and sketch the graph.
Solution Since the vertices are , we have a � 4. The foci are ,so c � 2. To write the equation, we need to find b. Since c 2 � a 2 � b 2, we have
Thus, the equation of the ellipse is
The graph is shown in Figure 7. ■
Eccentricity of an Ellipse
We saw earlier in this section (Figure 2) that if 2a is only slightly greater than 2c, theellipse is long and thin, whereas if 2a is much greater than 2c, the ellipse is almostcircular. We measure the deviation of an ellipse from being circular by the ratio of aand c.
x2
16�
y2
12� 1
b2 � 16 � 4 � 12
22 � 42 � b2
1�2, 0 21�4, 0 21�2, 0 21�4, 0 2
0 x
y
4
F¤ !0, œ∑7@5
F⁄!0, _œ∑7@
9_9
_5
5
5y = –4œ∑∑∑∑∑1 – x2/9
y = 4 œ∑∑∑∑∑1 – x2/9
(a) (b)
SECTION 10.2 Ellipses 757
Figure 6
16x 2 � 9y 2 � 144
4
0 x
y
5
F⁄(_2, 0)
F¤(2, 0)
Figure 7
x2
16�
y2
12� 1
Definition of Eccentricity
For the ellipse or 1with a � b � 02, the
eccentricity e is the number
where . The eccentricity of every ellipse satisfies 0 � e � 1.c � 2a2 � b2
e �ca
x2
b2 �y2
a2 � 1x2
a2 �y2
b2 � 1
57050_10_ch10_p742-819.qxd 08/04/2008 11:47 AM Page 757

758 CHAPTER 10 Analytic Geometry
ALTERNATE EXAMPLE 4Find the equation of the ellipsewith foci and eccentricity
ANSWER
x2
225+
y2
625= 1
e = 45.
(0, ;20)
IN-CLASS MATERIALS
As noted in Section 10.1, one can use dental floss and a modeling compound (such as clay or Play-Doh®)to make half a cone and slice it. Have the class attempt to do so to get a circle. Note that if their angle isslightly off, they will get an ellipse. Make the analogy that just as a square is a particular kind of rectangle,a circle is a particular kind of ellipse.
Thus, if e is close to 1, then c is almost equal to a, and the ellipse is elongated inshape, but if e is close to 0, then the ellipse is close to a circle in shape. The eccen-tricity is a measure of how “stretched” the ellipse is.
In Figure 8 we show a number of ellipses to demonstrate the effect of varying theeccentricity e.
Figure 8
Ellipses with various eccentricities
Example 4 Finding the Equation of an Ellipse
from Its Eccentricity and Foci
Find the equation of the ellipse with foci and eccentricity , and sketchits graph.
Solution We are given and c � 8. Thus
Eccentricity
Cross multiply
To find b, we use the fact that c 2 � a 2 � b 2.
Thus, the equation of the ellipse is
Because the foci are on the y-axis, the ellipse is oriented vertically. To sketch the ellipse, we find the intercepts: The x-intercepts are �6 and the y-intercepts are�10. The graph is sketched in Figure 9. ■
Gravitational attraction causes the planets to move in elliptical orbits around thesun with the sun at one focus. This remarkable property was first observed by Johannes Kepler and was later deduced by Isaac Newton from his inverse square lawof gravity, using calculus. The orbits of the planets have different eccentricities,but most are nearly circular (see the margin note above).
x2
36�
y2
100� 1
b � 6
b2 � 102 � 82 � 36
82 � 102 � b2
a � 10
4a � 40
e �ca
4
5�
8a
e � 45
e � 4510, �8 2
e=0.86e=0.1 e=0.5 e=0.68
758 CHAPTER 10 Analytic Geometry
0 x
y
6
10
_6
_10
F⁄(0, 8)
F¤(0, _8)
Figure 9
x2
36�
y2
100� 1
Eccentricities of the Orbits
of the Planets
The orbits of the planets are el-lipses with the sun at one focus.For most planets these ellipseshave very small eccentricity, sothey are nearly circular. However,Mercury and Pluto, the innermostand outermost known planets, havevisibly elliptical orbits.
Planet Eccentricity
Mercury 0.206Venus 0.007Earth 0.017Mars 0.093Jupiter 0.048Saturn 0.056Uranus 0.046Neptune 0.010Pluto 0.248
57050_10_ch10_p742-819.qxd 08/04/2008 11:47 AM Page 758

CHAPTER 10 Analytic Geometry 759
IN-CLASS MATERIALS
Discuss the reflection property of an ellipse: A beam of light originating at one focus will reflect off theellipse and pass through the other focus. One nice project is to construct an elliptical pool table. Thestudents accurately graph an ellipse and glue erasers or wood along its border, placing the “hole” atone focus and marking the second. A golf ball or pool ball that is placed on the mark and struck in anydirection will ricochet into the hole.
SECTION 10.2 Ellipses 759
1–4 ■ Match the equation with the graphs labeled I–IV. Givereasons for your answers.
1. 2.
3. 4x 2 � y 2 � 4 4. 16x 2 � 25y 2 � 400
5–18 ■ Find the vertices, foci, and eccentricity of the ellipse.Determine the lengths of the major and minor axes, and sketchthe graph.
5. 6.x2
16�
y2
25� 1
x2
25�
y2
9� 1
I II
III IV
y
x0
1
1
y
x0
1
1
x0
1
2
yy
x01
1
x2 �y2
9� 1
x2
16�
y2
4� 1
7. 9x 2 � 4y 2 � 36 8. 4x 2 � 25y 2 � 100
9. x 2 � 4y 2 � 16 10. 4x 2 � y 2 � 16
11. 2x 2 � y 2 � 3 12. 5x 2 � 6y 2 � 30
13. x 2 � 4y 2 � 1 14. 9x 2 � 4y 2 � 1
15. 16. x 2 � 4 � 2y 2
17. y 2 � 1 � 2x 2 18. 20x 2 � 4y 2 � 5
19–24 ■ Find an equation for the ellipse whose graph is shown.
19. 20.
21. 22.
0
4 F(0, 3)y
x
F(0, 2)
0
y
x2
0
5y
x2
y
x0
4
5
12 x2 � 1
8 y2 � 14
Ellipses, like parabolas, have an interesting reflection property that leads to a num-ber of practical applications. If a light source is placed at one focus of a reflecting sur-face with elliptical cross sections, then all the light will be reflected off the surface tothe other focus, as shown in Figure 10. This principle, which works for sound wavesas well as for light, is used in lithotripsy, a treatment for kidney stones. The patient isplaced in a tub of water with elliptical cross sections in such a way that the kidneystone is accurately located at one focus. High-intensity sound waves generated at theother focus are reflected to the stone and destroy it with minimal damage to sur-rounding tissue. The patient is spared the trauma of surgery and recovers within daysinstead of weeks.
The reflection property of ellipses is also used in the construction of whisperinggalleries. Sound coming from one focus bounces off the walls and ceiling of an el-liptical room and passes through the other focus. In these rooms even quiet whispersspoken at one focus can be heard clearly at the other. Famous whispering galleries include the National Statuary Hall of the U.S. Capitol in Washington, D.C. (see page 771), and the Mormon Tabernacle in Salt Lake City, Utah.
10.2 Exercises
F⁄ F¤
Figure 10
57050_10_ch10_p742-819.qxd 08/04/2008 11:47 AM Page 759

760 CHAPTER 10 Analytic Geometry
760 CHAPTER 10 Analytic Geometry
23. 24.
25–28 ■ Use a graphing device to graph the ellipse.
25. 26.
27. 6x 2 � y 2 � 36 28. x 2 � 2y 2 � 8
29–40 ■ Find an equation for the ellipse that satisfies the givenconditions.
29. Foci , vertices
30. Foci , vertices
31. Length of major axis 4, length of minor axis 2, foci on y-axis
32. Length of major axis 6, length of minor axis 4, foci on x-axis
33. Foci , length of minor axis 6
34. Foci , length of major axis 12
35. Endpoints of major axis , distance between foci 6
36. Endpoints of minor axis , distance between foci 8
37. Length of major axis 10, foci on x-axis, ellipse passesthrough the point
38. Eccentricity , foci
39. Eccentricity 0.8, foci
40. Eccentricity , foci on y-axis, length of major axis 4
41–43 ■ Find the intersection points of the pair of ellipses.Sketch the graphs of each pair of equations on the same coordi-nate axes and label the points of intersection.
41. 42.
43.
44. The ancillary circle of an ellipse is the circle with radiusequal to half the length of the minor axis and center the
c100x2 � 25y2 � 100
x2 �y2
9� 1
µ x2
16�
y2
9� 1
x2
9�
y2
16� 1
e4x2 � y2 � 4
4x2 � 9y2 � 36
13/2
1�1.5, 0 210, �2 219
115, 2 210, �3 21�10, 0 21�5, 0 210, �2 2
10, �5 210, �3 2 1�5, 0 21�4, 0 2
x2 �y2
12� 1
x2
25�
y2
20� 1
(_1, 2)
0
y
x20
y
x16
(8, 6)
same as the ellipse (see the figure). The ancillary circle isthus the largest circle that can fit within an ellipse.
(a) Find an equation for the ancillary circle of the ellipse x 2 � 4y 2 � 16.
(b) For the ellipse and ancillary circle of part (a), show thatif is a point on the ancillary circle, then is apoint on the ellipse.
45. (a) Use a graphing device to sketch the top half (the portionin the first and second quadrants) of the family of el-lipses x 2 � ky 2 � 100 for k � 4, 10, 25, and 50.
(b) What do the members of this family of ellipses have incommon? How do they differ?
46. If k � 0, the following equation represents an ellipse:
Show that all the ellipses represented by this equation havethe same foci, no matter what the value of k.
Applications
47. Perihelion and Aphelion The planets move around thesun in elliptical orbits with the sun at one focus. The pointin the orbit at which the planet is closest to the sun is calledperihelion, and the point at which it is farthest is calledaphelion. These points are the vertices of the orbit. Theearth’s distance from the sun is 147,000,000 km at perihe-lion and 153,000,000 km at aphelion. Find an equation forthe earth’s orbit. (Place the origin at the center of the orbitwith the sun on the x-axis.)
48. The Orbit of Pluto With an eccentricity of 0.25,Pluto’s orbit is the most eccentric in the solar system. Thelength of the minor axis of its orbit is approximately10,000,000,000 km. Find the distance between Pluto and the sun at perihelion and at aphelion. (See Exercise 47.)
aphelion perihelion
x2
k�
y2
4 � k� 1
ancillarycircle
ellipse
12s, t 21s, t 2
57050_10_ch10_p742-819.qxd 08/04/2008 11:47 AM Page 760

CHAPTER 10 Analytic Geometry 761
SECTION 10.2 Ellipses 761
49. Lunar Orbit For an object in an elliptical orbit around the moon, the points in the orbit that are closest to and farthest from the center of the moon are called periluneand apolune, respectively. These are the vertices of the orbit. The center of the moon is at one focus of the orbit.The Apollo 11 spacecraft was placed in a lunar orbit withperilune at 68 mi and apolune at 195 mi above the surface of the moon. Assuming the moon is a sphere of radius1075 mi, find an equation for the orbit of Apollo 11. (Placethe coordinate axes so that the origin is at the center of theorbit and the foci are located on the x-axis.)
50. Plywood Ellipse A carpenter wishes to construct an el-liptical table top from a sheet of plywood, 4 ft by 8 ft. Hewill trace out the ellipse using the “thumbtack and string”method illustrated in Figures 2 and 3. What length of stringshould he use, and how far apart should the tacks be located,if the ellipse is to be the largest possible that can be cut outof the plywood sheet?
51. Sunburst Window A “sunburst” window above a door-way is constructed in the shape of the top half of an ellipse,as shown in the figure. The window is 20 in. tall at its high-est point and 80 in. wide at the bottom. Find the height ofthe window 25 in. from the center of the base.
80 in.
25 in.
h 20 in.
moon
68 mi
195 miperiluneapolune
Discovery • Discussion
52. Drawing an Ellipse on a Blackboard Try drawing anellipse as accurately as possible on a blackboard. Howwould a piece of string and two friends help this process?
53. Light Cone from a Flashlight A flashlight shines on a wall, as shown in the figure. What is the shape of theboundary of the lighted area? Explain your answer.
54. How Wide Is an Ellipse at Its Foci? A latus rectum foran ellipse is a line segment perpendicular to the major axisat a focus, with endpoints on the ellipse, as shown. Showthat the length of a latus rectum is 2b 2/a for the ellipse
55. Is It an Ellipse? A piece of paper is wrapped around a cylindrical bottle, and then a compass is used to draw a circle on the paper, as shown in the figure. When the paper is laid flat, is the shape drawn on the paper an ellipse?(You don’t need to prove your answer, but you may want todo the experiment and see what you get.)
b
a
_b
_a
foci
latus rectum
y
x
x2
a2 �y2
b2 � 1 with a � b
57050_10_ch10_p742-819.qxd 08/04/2008 11:47 AM Page 761

762 CHAPTER 10 Analytic Geometry
SUGGESTED TIME
AND EMPHASIS
class.
Optional material.
12
POINTS TO STRESS
1. The definition and geometry of hyperbolas.2. Using the equation of a hyperbola to find relevant constants.3. Graphing a hyperbola given its equation.
10.3 Hyperbolas
Although ellipses and hyperbolas have completely different shapes, their definitionsand equations are similar. Instead of using the sum of distances from two fixed foci,as in the case of an ellipse, we use the difference to define a hyperbola.
762 CHAPTER 10 Analytic Geometry
Geometric Definition of a Hyperbola
A hyperbola is the set of all points in the plane, the difference of whose dis-tances from two fixed points F1 and F2 is a constant. (See Figure 1.) Thesetwo fixed points are the foci of the hyperbola.
As in the case of the ellipse, we get the simplest equation for the hyperbola byplacing the foci on the x-axis at , as shown in Figure 1. By definition, if lies on the hyperbola, then either or mustequal some positive constant, which we call 2a. Thus, we have
or
Proceeding as we did in the case of the ellipse (Section 10.2), we simplify this to
From triangle PF1F2 in Figure 1 we see that . It followsthat 2a � 2c, or a � c. Thus, c 2 � a 2 � 0, so we can set b 2 � c 2 � a 2. We then sim-plify the last displayed equation to get
This is the equation of the hyperbola. If we replace x by �x or y by �y in this equa-tion, it remains unchanged, so the hyperbola is symmetric about both the x- and y-axes and about the origin. The x-intercepts are �a, and the points and
are the vertices of the hyperbola. There is no y-intercept, because setting x � 0 in the equation of the hyperbola leads to �y 2 � b 2, which has no real solution.Furthermore, the equation of the hyperbola implies that
so x 2/a 2 � 1; thus, x 2 � a 2, and hence x � a or x � �a. This means that the hyper-bola consists of two parts, called its branches. The segment joining the two verticeson the separate branches is the transverse axis of the hyperbola, and the origin iscalled its center.
If we place the foci of the hyperbola on the y-axis rather than on the x-axis, thenthis has the effect of reversing the roles of x and y in the derivation of the equation ofthe hyperbola. This leads to a hyperbola with a vertical transverse axis.
x2
a2 �y2
b2 � 1 � 1
1�a, 0 2 1a, 0 2x2
a2 �y2
b2 � 1
0 d1P, F1 2 � d1P, F2 2 0 � 2c
1c2 � a2 2x2 � a2y2 � a21c2 � a2 2 21x � c 2 2 � y2 � 21x � c 2 2 � y2 � �2a
d1P, F1 2 � d1P, F2 2 � �2a
d1P, F2 2 � d1P, F1 2d1P, F1 2 � d1P, F2 2 P1x, y 21�c, 0 2x
y
0 F¤(c, 0)
P(x, y)
F⁄(_c, 0)
Figure 1
P is on the hyperbola if.0 d1P, F1 2 � d1P, F2 2 0 � 2a
57050_10_ch10_p742-819.qxd 08/04/2008 11:47 AM Page 762

CHAPTER 10 Analytic Geometry 763
Equations and Graphs of Hyperbolas
The main properties of hyperbolas are listed in the following box.
SECTION 10.3 Hyperbolas 763
Hyperbola with Center at the Origin
The graph of each of the following equations is a hyperbola with center at the origin and having the given properties.
EQUATION
VERTICES
TRANSVERSE AXIS Horizontal, length 2a Vertical, length 2a
ASYMPTOTES
FOCI , c 2 � a 2 � b 2 , c 2 � a 2 � b 2
GRAPH
x
yy=_ xba y= xb
a
F¤(c, 0)
b
F⁄(_c, 0)
_b
a_a x
y
b
F⁄(0, c)
_b
F¤(0, _c)
a
_a
y=_ xab y= xa
b
10, �c 21�c, 0 2 y � �a
b xy � �
ba
x
10, �a 21�a, 0 2y2
a2 �x2
b2 � 1 1a � 0, b � 0 2x2
a2 �y2
b2 � 1 1a � 0, b � 0 2
The asymptotes mentioned in this box are lines that the hyperbola approaches forlarge values of x and y. To find the asymptotes in the first case in the box, we solvethe equation for y to get
As x gets large, a 2/x 2 gets closer to zero. In other words, as x �qwe have a 2/x 2 � 0.So, for large x the value of y can be approximated as . This shows thatthese lines are asymptotes of the hyperbola.
Asymptotes are an essential aid for graphing a hyperbola; they help us determineits shape. A convenient way to find the asymptotes, for a hyperbola with horizontaltransverse axis, is to first plot the points , , , and . Thensketch horizontal and vertical segments through these points to construct a rectangle,as shown in Figure 2(a) on the next page. We call this rectangle the central box ofthe hyperbola. The slopes of the diagonals of the central box are �b/a, so by extend-ing them we obtain the asymptotes , as sketched in part (b) of the fig-ure. Finally, we plot the vertices and use the asymptotes as a guide in sketching the
y � �1b/a 2x10, �b 210, b 21�a, 0 21a, 0 2
y � �1b/a 2x � �
ba
x B1 �a2
x2
y � �ba
2x2 � a2
Asymptotes of rational functions arediscussed in Section 3.6.
57050_10_ch10_p742-819.qxd 08/04/2008 11:47 AM Page 763

764 CHAPTER 10 Analytic Geometry
SAMPLE QUESTION
Text Question
Is the equation of a
horizontal or a vertical hyperbola?How do you know?
Answer
It is horizontal because the x2 termis positive.
ALTERNATE EXAMPLE 1Find the vertices, foci, andasymptotes of the hyperbola 25x2 - 144y2 = 3600.
ANSWER
y = ;5
12x
(;12, 0), (;13, 0),
x2
52 -y2
62 = 1
IN-CLASS MATERIALS
Have students sketch a hyperbola “from scratch.” Hand out a sheet of paper with two foci, and hand outrulers. Get the students to plot points where the difference of the distances between the points and the fociis 1 inch. Have them keep plotting points until a hyperbolic shape emerges.
hyperbola shown in part (c). (A similar procedure applies to graphing a hyperbolathat has a vertical transverse axis.)
Figure 2
Steps in graphing the hyperbola x2
a2 �y2
b2 � 1
(a) Central box (b) Asymptotes (c) Hyperbola
x
y
b
_b
a_a x
y
b
_b
a_a0 x
y
b
_b
a_a
764 CHAPTER 10 Analytic Geometry
How to Sketch a Hyperbola
1. Sketch the Central Box. This is the rectangle centered at the origin,with sides parallel to the axes, that crosses one axis at �a, the other at �b.
2. Sketch the Asymptotes. These are the lines obtained by extending the diagonals of the central box.
3. Plot the Vertices. These are the two x-intercepts or the two y-intercepts.
4. Sketch the Hyperbola. Start at a vertex and sketch a branch of the hyperbola, approaching the asymptotes. Sketch the other branch in the same way.
Example 1 A Hyperbola with Horizontal
Transverse Axis
A hyperbola has the equation
(a) Find the vertices, foci, and asymptotes, and sketch the graph.
(b) Draw the graph using a graphing calculator.
Solution
(a) First we divide both sides of the equation by 144 to put it into standard form:
x2
16�
y2
9� 1
9x2 � 16y2 � 144
57050_10_ch10_p742-819.qxd 08/04/2008 11:47 AM Page 764
CHAPTER 10 Analytic Geometry 765
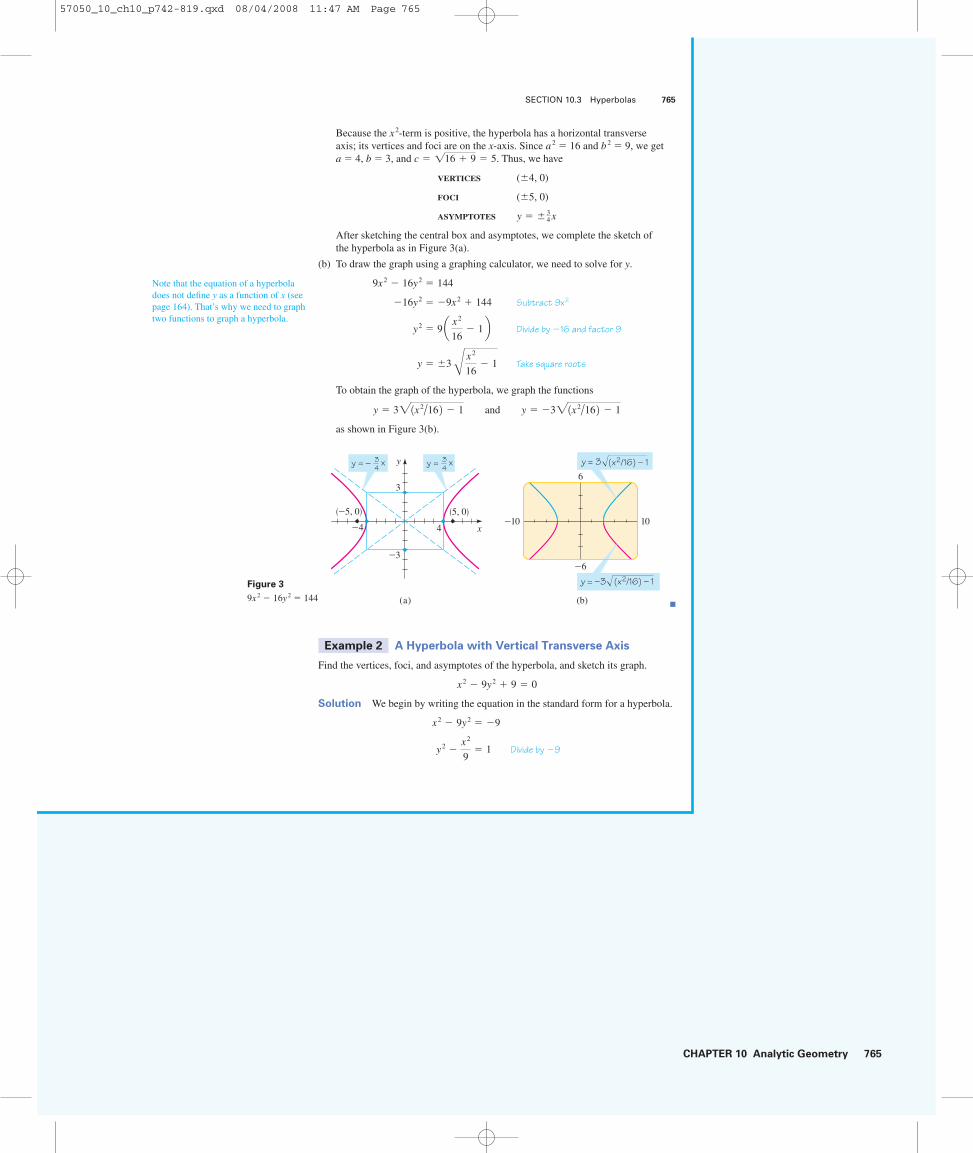
Because the x 2-term is positive, the hyperbola has a horizontal transverse axis; its vertices and foci are on the x-axis. Since a 2 � 16 and b 2 � 9, we get a � 4, b � 3, and . Thus, we have
VERTICES (�4, 0)
FOCI (�5, 0)
ASYMPTOTES
After sketching the central box and asymptotes, we complete the sketch of the hyperbola as in Figure 3(a).
(b) To draw the graph using a graphing calculator, we need to solve for y.
Subtract 9x2
Divide by �16 and factor 9
Take square roots
To obtain the graph of the hyperbola, we graph the functions
as shown in Figure 3(b).
■
Example 2 A Hyperbola with Vertical Transverse Axis
Find the vertices, foci, and asymptotes of the hyperbola, and sketch its graph.
Solution We begin by writing the equation in the standard form for a hyperbola.
Divide by �9 y2 �x2
9� 1
x2 � 9y2 � �9
x2 � 9y2 � 9 � 0
x
yy = – 34
(5, 0)
3
(_5, 0)
_3
4_4
(a) (b)
10_10
x y = 34
x
_6
6
_y = –3œ (x2/16) – 1
(x2/16) – 1y = 3œ
y � 321x2/16 2 � 1 and y � �321x2/16 2 � 1
y � �3 Bx2
16� 1
y2 � 9 a x2
16� 1 b �16y2 � �9x2 � 144
9x2 � 16y2 � 144
y � � 34 x
c � 116 � 9 � 5
SECTION 10.3 Hyperbolas 765
Figure 3
9x 2 � 16y 2 � 144
Note that the equation of a hyperboladoes not define y as a function of x (seepage 164). That’s why we need to graphtwo functions to graph a hyperbola.
57050_10_ch10_p742-819.qxd 08/04/2008 11:47 AM Page 765

766 CHAPTER 10 Analytic Geometry
DRILL QUESTION
Find the vertices, foci, and asymp-totes of the hyperbola given by
. Then graph it.
Answer
Vertices (0, ), foci (0, )asymptotes
ALTERNATE EXAMPLE 3 Find the equation of the hyperbolain standard form with vertices(±2, 0) and foci (±3, 0).
ANSWER
EXAMPLEA horizontal hyperbola:
Vertices ( , 0), asymptotes
foci a;A37
2, 0b
y = ;1
312 x,
;3
x2
9- 2y2 = 1
x2
4-
y2
5= 1
y = ;2x;15;2
y2
4- x2 = 1
IN-CLASS MATERIALS
As noted in Section 10.1, one can use dental floss and a modeling compound (such as clay or Play-Doh®)to make a half-cone and slice it. Have the students attempt to do so to get a hyperbola. Notice that the slicedoes not have to be straight up and down, as shown in the prologue to the chapter. As long as the slicewould cut the other half of the cone, the resultant curve is a hyperbola.
Because the y 2-term is positive, the hyperbola has a vertical transverse axis; its fociand vertices are on the y-axis. Since a 2 � 1 and b 2 � 9, we get a � 1, b � 3, and
. Thus, we have
VERTICES 10, �12FOCI 10, � 2ASYMPTOTES
We sketch the central box and asymptotes, then complete the graph, as shown inFigure 4(a).
We can also draw the graph using a graphing calculator, as shown in Figure 4(b).
Figure 4
x 2 � 9y 2 � 9 � 0 ■
Example 3 Finding the Equation of a Hyperbola
from Its Vertices and Foci
Find the equation of the hyperbola with vertices and foci . Sketchthe graph.
Solution Since the vertices are on the x-axis, the hyperbola has a horizontaltransverse axis. Its equation is of the form
We have a � 3 and c � 4. To find b, we use the relation a 2 � b 2 � c 2:
Thus, the equation of the hyperbola is
x2
9�
y2
7� 1
b � 17
b2 � 42 � 32 � 7
32 � b2 � 42
x2
32 �y2
b2 � 1
1�4, 0 21�3, 0 2
(a) (b)
5_5x
y
3
1
F¤Ó0, _œ∑10Ô
F⁄Ó0, œ∑10Ô 2
_2
y = – œ 1 + x2/9
y = œ 1 + x2/9
y � � 13 x
110
c � 11 � 9 � 110
766 CHAPTER 10 Analytic Geometry
Paths of Comets
The path of a comet is an ellipse, aparabola, or a hyperbola with thesun at a focus. This fact can beproved using calculus and New-ton’s laws of motion.* If the path isa parabola or a hyperbola, thecomet will never return. If the pathis an ellipse, it can be determinedprecisely when and where thecomet can be seen again. Halley’scomet has an elliptical path and re-turns every 75 years; it was lastseen in 1987. The brightest cometof the 20th century was cometHale-Bopp, seen in 1997. Its orbitis a very eccentric ellipse; it is ex-pected to return to the inner solarsystem around the year 4377.
*James Stewart, Calculus, 5th ed. (Pa-cific Grove, CA: Brooks/Cole, 2003),pp. 912–914.
y
x
5
0
_5
2_2
x
y2
5_5 0_2
57050_10_ch10_p742-819.qxd 08/04/2008 11:47 AM Page 766

CHAPTER 10 Analytic Geometry 767
ALTERNATE EXAMPLE 4Find the equation and the foci ofthe hyperbola with vertices (0, ±4)and asymptotes y = 4x.
ANSWER
EXAMPLEA vertical hyperbola:
Vertices (0, ±5), asymptotes
y = ;5
4 x, foci (0, ;141)
-x2
16+
y2
25= 1
(0, -117)
(0, 117),y2
16- x2 = 1,
IN-CLASS MATERIALS
Discuss the reflection property of hyperbolas: Take a point between the branches, and aim a beam of lightat one of the foci. It will reflect off the hyperbola, and go in a path aimed directly at the other focus. Thisreflection property is harder to model physically than those of the ellipse and the parabola.
The graph is shown in Figure 5.
SECTION 10.3 Hyperbolas 767
0 x
y
3
_3
_3 3
Ϸ7
_Ϸ7
Figure 5
x2
9�
y2
7� 1
x
y
1
F⁄
F¤
Figure 6
y2
4� x2 � 1
Example 4 Finding the Equation of a Hyperbola
from Its Vertices and Asymptotes
Find the equation and the foci of the hyperbola with vertices and asymp-totes y � �2x. Sketch the graph.
Solution Since the vertices are on the y-axis, the hyperbola has a vertical trans-verse axis with a � 2. From the asymptote equation we see that a/b � 2. Since a � 2, we get 2/b � 2, and so b � 1. Thus, the equation of the hyperbola is
To find the foci, we calculate c 2 � a 2 � b 2 � 22 � 12 � 5, so . Thus, thefoci are . The graph is shown in Figure 6. ■
Like parabolas and ellipses, hyperbolas have an interesting reflection property.Light aimed at one focus of a hyperbolic mirror is reflected toward the other focus, asshown in Figure 7. This property is used in the construction of Cassegrain-type tele-scopes. A hyperbolic mirror is placed in the telescope tube so that light reflected fromthe primary parabolic reflector is aimed at one focus of the hyperbolic mirror. The lightis then refocused at a more accessible point below the primary reflector (Figure 8).
Figure 7 Figure 8
Reflection property of hyperbolas Cassegrain-type telescope
F⁄
F¤
Hyperbolicreflector
Parabolic reflector
F⁄F¤
10, �15 2 c � 15
y2
4� x2 � 1
10, �2 2■
x
y
2_2
5
0
_5
57050_10_ch10_p742-819.qxd 08/04/2008 11:47 AM Page 767

768 CHAPTER 10 Analytic Geometry
The LORAN (LOng RAnge Navigation) system was used until the early 1990s; ithas now been superseded by the GPS system (see page 656). In the LORAN system,hyperbolas are used onboard a ship to determine its location. In Figure 9 radio sta-tions at A and B transmit signals simultaneously for reception by the ship at P. Theonboard computer converts the time difference in reception of these signals into a dis-tance difference . From the definition of a hyperbola this locatesthe ship on one branch of a hyperbola with foci at A and B (sketched in black in thefigure). The same procedure is carried out with two other radio stations at C and D,and this locates the ship on a second hyperbola (shown in red in the figure). (In prac-tice, only three stations are needed because one station can be used as a focus for bothhyperbolas.) The coordinates of the intersection point of these two hyperbolas, whichcan be calculated precisely by the computer, give the location of P.
10.3 Exercises
A
BC
D
P
d1P, A 2 � d1P, B 2
768 CHAPTER 10 Analytic Geometry
1–4 ■ Match the equation with the graphs labeled I–IV. Givereasons for your answers.
1. 2.
3. 16y 2 � x 2 � 144 4. 9x 2 � 25y 2 � 225
I II
III IV
x
y
2
1
41
x
y
x
y
1
1
y
x2
2
y2 �x2
9� 1
x2
4� y2 � 1
5–16 ■ Find the vertices, foci, and asymptotes of the hyperbola,and sketch its graph.
5. 6.
7. 8.
9. x 2 � y 2 � 1 10. 9x 2 � 4y 2 � 36
11. 25y 2 � 9x 2 � 225 12. x 2 � y 2 � 4 � 0
13. x 2 � 4y 2 � 8 � 0 14. x 2 � 2y 2 � 3
15. 4y 2 � x 2 � 1 16. 9x 2 � 16y 2 � 1
17–22 ■ Find the equation for the hyperbola whose graph isshown.
17.
0 x
y
1
F¤(4, 0)F⁄(_4, 0)1
x2
2� y2 � 1y2 �
x2
25� 1
y2
9�
x2
16� 1
x2
4�
y2
16� 1
Figure 9
LORAN system for findingthe location of a ship
57050_10_ch10_p742-819.qxd 08/04/2008 11:47 AM Page 768

CHAPTER 10 Analytic Geometry 769
SECTION 10.3 Hyperbolas 769
18. 19.
20.
21. 22.
23–26 ■ Use a graphing device to graph the hyperbola.
23. x 2 � 2y 2 � 8 24. 3y 2 � 4x 2 � 24
25. 26.
27–38 ■ Find an equation for the hyperbola that satisfies thegiven conditions.
27. Foci , vertices
28. Foci , vertices
29. Foci , vertices
30. Foci , vertices
31. Vertices , asymptotes y � �5x
32. Vertices , asymptotes
33. Foci , asymptotes y � � 12 x10, �8 2 y � �
13 x10, �6 21�1, 0 2 1�2, 0 21�6, 0 2 10, �1 210, �2 2 10, �8 210, �10 2 1�3, 0 21�5, 0 2
x2
100�
y2
64� 1
y2
2�
x2
6� 1
y=3x
y=_3x
0 x
y
3
1
y=_ x12 y= x1
2
x
y
_5 5
(4, 4)
2Ϸ3
2x
y
0 x
y
_4
4
(3, _5)20 x
y
_12
12 F⁄(0, 13)
F¤(0, _13)
34. Vertices , hyperbola passes through
35. Asymptotes y � �x, hyperbola passes through
36. Foci , hyperbola passes through
37. Foci , length of transverse axis 6
38. Foci , length of transverse axis 1
39. (a) Show that the asymptotes of the hyperbola x 2 � y 2 � 5are perpendicular to each other.
(b) Find an equation for the hyperbola with foci and with asymptotes perpendicular to each other.
40. The hyperbolas
are said to be conjugate to each other.
(a) Show that the hyperbolas
are conjugate to each other, and sketch their graphs onthe same coordinate axes.
(b) What do the hyperbolas of part (a) have in common?
(c) Show that any pair of conjugate hyperbolas have the relationship you discovered in part (b).
41. In the derivation of the equation of the hyperbola at the beginning of this section, we said that the equation
simplifies to
Supply the steps needed to show this.
42. (a) For the hyperbola
determine the values of a, b, and c, and find the coordi-nates of the foci F1 and F2.
(b) Show that the point lies on this hyperbola.
(c) Find and .
(d) Verify that the difference between and is 2a.
43. Hyperbolas are called confocal if they have the same foci.
(a) Show that the hyperbolas
are confocal.
y2
k�
x2
16 � k� 1 with 0 � k � 16
d1P, F2 2d1P, F1 2d1P, F2 2d1P, F1 2 P15, 163 2
x2
9�
y2
16� 1
1c2 � a2 2x2 � a2y2 � a21c2 � a2 221x � c 2 2 � y2 � 21x � c 2 2 � y2 � �2a
x2 � 4y2 � 16 � 0 and 4y2 � x2 � 16 � 0
x2
a2 �y2
b2 � 1 and x2
a2 �y2
b2 � �1
1�c, 0 210, �1 21�5, 0 2 14, 1 21�3, 0 2 15, 3 21�5, 9 210, �6 2
57050_10_ch10_p742-819.qxd 08/04/2008 11:47 AM Page 769

770 CHAPTER 10 Analytic Geometry
770 CHAPTER 10 Analytic Geometry
(b) Use a graphing device to draw the top branches of the family of hyperbolas in part (a) for k � 1, 4, 8,and 12. How does the shape of the graph change as kincreases?
Applications
44. Navigation In the figure, the LORAN stations at A and Bare 500 mi apart, and the ship at P receives station A’s sig-nal 2640 microseconds (ms) before it receives the signalfrom B.
(a) Assuming that radio signals travel at 980 ft/ms, find
(b) Find an equation for the branch of the hyperbola indi-cated in red in the figure. (Use miles as the unit of distance.)
(c) If A is due north of B, and if P is due east of A, how faris P from A?
45. Comet Trajectories Some comets, such as Halley’scomet, are a permanent part of the solar system, traveling in elliptical orbits around the sun. Others pass through thesolar system only once, following a hyperbolic path with thesun at a focus. The figure shows the path of such a comet.Find an equation for the path, assuming that the closest thecomet comes to the sun is 2 109 mi and that the path thecomet was taking before it neared the solar system is at aright angle to the path it continues on after leaving the solarsystem.
x
y
2 10ª mi
x (mi)
y (mi)
PA
B
0
250
_250
d1P, A 2 � d1P, B 2
46. Ripples in Pool Two stones are dropped simultaneouslyin a calm pool of water. The crests of the resulting wavesform equally spaced concentric circles, as shown in thefigures. The waves interact with each other to create certaininterference patterns.
(a) Explain why the red dots lie on an ellipse.
(b) Explain why the blue dots lie on a hyperbola.
Discovery • Discussion
47. Hyperbolas in the Real World Several examples of theuses of hyperbolas are given in the text. Find other situa-tions in real life where hyperbolas occur. Consult a scientificencyclopedia in the reference section of your library, orsearch the Internet.
48. Light from a Lamp The light from a lamp forms alighted area on a wall, as shown in the figure. Why is theboundary of this lighted area a hyperbola? How can onehold a flashlight so that its beam forms a hyperbola on theground?
57050_10_ch10_p742-819.qxd 08/04/2008 11:47 AM Page 770

CHAPTER 10 Analytic Geometry 771
SECTION 10.3 Hyperbolas 771
Conics in Architecture
In ancient times architecture was part of mathematics, so architects had to be mathematicians. Many of the structures they built—pyramids, temples,amphitheaters, and irrigation projects—still stand. In modern times architectsemploy even more sophisticated mathematical principles. The photographs below show some structures that employ conic sections in their design.
D I S C O V E R YP R O J E C T
Roman Amphitheater in Alexandria, Egypt(circle)Nik Wheeler/Corbis
Ceiling of Statuary Hall in the U.S. Capitol(ellipse)Architect of the Capitol
Roof of the Skydome in Toronto, Canada(parabola)Walter Schmid/Stone/Getty Images
Roof of Washington Dulles Airport(hyperbola and parabola)Richard T. Nowitz /Corbis
McDonnell Planetarium, St. Louis, MO(hyperbola)Courtesy of Chamber of Commerce, St. Louis, MO
Attic in La Pedrera, Barcelona, Spain(parabola)O. Alamany and Vincens/Corbis
Architects have different reasons for using conics in their designs. For example,the Spanish architect Antoni Gaudi used parabolas in the attic of La Pedrera (see photo above). He reasoned that since a rope suspended between two pointswith an equally distributed load (like in a suspension bridge) has the shape of a parabola, an inverted parabola would provide the best support for a flat roof.
Constructing Conics
The equations of the conics are helpful in manufacturing small objects, becausea computer-controlled cutting tool can accurately trace a curve given by an equation. But in a building project, how can we construct a portion of a
57050_10_ch10_p742-819.qxd 08/04/2008 11:47 AM Page 771

772 CHAPTER 10 Analytic Geometry
parabola, ellipse, or hyperbola that spans the ceiling or walls of a building? Thegeometric properties of the conics provide practical ways of constructing them.For example, if you were building a circular tower, you would choose a centerpoint, then make sure that the walls of the tower are a fixed distance from thatpoint. Elliptical walls can be constructed using a string anchored at two points,as shown in Figure 1.
To construct a parabola, we can use the apparatus shown in Figure 2. A piece of string of length a is anchored at F and A. The T-square, also of length a, slidesalong the straight bar L. A pencil at P holds the string taut against the T-square.As the T-square slides to the right the pencil traces out a curve.
From the figure we see that
The string is of length a
The T-square is of length a
It follows that . Subtracting fromeach side, we get
The last equation says that the distance from F to P is equal to the distance from P to the line L. Thus, the curve is a parabola with focus F and directrix L.
In building projects it’s easier to construct a straight line than a curve. So insome buildings, such as in the Kobe Tower (see problem 4), a curved surface isproduced by using many straight lines. We can also produce a curve usingstraight lines, such as the parabola shown in Figure 3.
Figure 3
Tangent lines to a parabola
d1F, P 2 � d1L, P 2d1P, A 2d1F, P 2 � d1P, A 2 � d1L, P 2 � d1P, A 2d1L, P 2 � d1P, A 2 � a
d1F, P 2 � d1P, A 2 � a
Parabola
L
F
aP
A
Figure 2
Constructing a parabola
772 CHAPTER 10 Analytic Geometry
Circle
C
P
F1
P
F2
Ellipse
Figure 1
Constructing a circle and anellipse
57050_10_ch10_p742-819.qxd 08/04/2008 11:47 AM Page 772

CHAPTER 10 Analytic Geometry 773
SECTION 10.3 Hyperbolas 773
Each line is tangent to the parabola; that is, the line meets the parabola at exactly one point and does not cross the parabola. The line tangent to theparabola y � x 2 at the point is
You are asked to show this in problem 6. The parabola is called the envelope ofall such lines.
1. The photographs on page 771 show six examples of buildings that containconic sections. Search the Internet to find other examples of structures thatemploy parabolas, ellipses, or hyperbolas in their design. Find at least oneexample for each type of conic.
2. In this problem we construct a hyperbola. The wooden bar in the figure canpivot at F1. A string shorter than the bar is anchored at F2 and at A, the otherend of the bar. A pencil at P holds the string taut against the bar as it movescounterclockwise around F1.
(a) Show that the curve traced out by the pencil is one branch of a hyperbolawith foci at F1 and F2.
(b) How should the apparatus be reconfigured to draw the other branch ofthe hyperbola?
3. The following method can be used to construct a parabola that fits in a given rectangle. The parabola will be approximated by many short line segments.
First, draw a rectangle. Divide the rectangle in half by a vertical line segment and label the top endpoint V. Next, divide the length and width ofeach half rectangle into an equal number of parts to form grid lines, as shownin the figure on the next page. Draw lines from V to the endpoints of horizon-tal grid line 1, and mark the points where these lines cross the vertical gridlines labeled 1. Next, draw lines from V to the endpoints of horizontal gridline 2, and mark the points where these lines cross the vertical grid lines la-beled 2. Continue in this way until you have used all the horizontal grid lines.
Pivotpoint
Hyperbola
F1 F2
P
A
y � 2ax � a2
1a, a2 2
57050_10_ch10_p742-819.qxd 08/04/2008 11:47 AM Page 773

774 CHAPTER 10 Analytic Geometry
Now, use line segments to connect the points you have marked to obtain anapproximation to the desired parabola. Apply this procedure to draw aparabola that fits into a 6 ft by 10 ft rectangle on a lawn.
4. In this problem we construct hyperbolic shapes using straight lines. Punchequally spaced holes into the edges of two large plastic lids. Connect corre-sponding holes with strings of equal lengths as shown in the figure. Holdingthe strings taut, twist one lid against the other. An imaginary surface passingthrough the strings has hyperbolic cross sections. (An architectural exampleof this is the Kobe Tower in Japan shown in the photograph.) What happensto the vertices of the hyperbolic cross sections as the lids are twisted more?
5. In this problem we show that the line tangent to the parabola y � x 2 at thepoint has the equation .
(a) Let m be the slope of the tangent line at . Show that the equationof the tangent line is .
(b) Use the fact that the tangent line intersects the parabola at only one pointto show that is the only solution of the system.
(c) Eliminate y from the system in part (b) to get a quadratic equation in x.Show that the discriminant of this quadratic is . Since the system in (b) has exactly one solution, the discriminant must equal 0.Find m.
(d) Substitute the value for m you found in part (c) into the equation in part(a) and simpify to get the equation of the tangent line.
1m � 2a 2 2e y � a2 � m1x � a 2
y � x2
1a, a2 2 y � a2 � m1x � a 21a, a2 2y � 2ax � a21a, a 2 2
3
2
1
2 1 1 2 33
V
3
2
1
2 1 1 2 33
V
3
2
1
2 1 1 2 33
V
774 CHAPTER 10 Analytic Geometry
ww
w.s
kysc
rape
rs.c
om
0 x
y
Tangentline
y=x2
a
a2
57050_10_ch10_p742-819.qxd 08/04/2008 11:47 AM Page 774

CHAPTER 10 Analytic Geometry 775
SUGGESTED TIME
AND EMPHASIS
1 class. Optional material. May be covered in conjunction withSections 10.1–10.3.
POINTS TO STRESS
1. Completing the square in a general equation of a conic in order to apply the techniques of Section 2.5to graph the conic.
2. Identifying conic sections by the constants in the general equation.3. Understanding degenerate conic sections.
SECTION 10.4 Shifted Conics 775
6. In this problem we prove that when a cylinder is cut by a plane an ellipse is formed. An architectural example of this is the Tycho Brahe Planetarium in Copenhagen (see the photograph). In the figure a cylinder is cut by a plane resulting in the red curve. Two spheres with the same radius as thecylinder slide inside the cylinder so that they just touch the plane at F1 andF2. Choose an arbitrary point P on the curve and let Q1 and Q2 be the twopoints on the cylinder where a vertical line through P touches the “equator”of each sphere.
(a) Show that PF1 � PQ1 and PF2 � PQ2. [Hint: Use the fact that all tan-gents to a sphere from a given point outside the sphere are of the samelength.]
(b) Explain why PQ1 � PQ2 is the same for all points P on the curve.
(c) Show that PF1 � PF2 is the same for all points P on the curve.
(d) Conclude that the curve is an ellipse with foci F1 and F2.
10.4 Shifted Conics
In the preceding sections we studied parabolas with vertices at the origin and ellipsesand hyperbolas with centers at the origin. We restricted ourselves to these cases be-cause these equations have the simplest form. In this section we consider conicswhose vertices and centers are not necessarily at the origin, and we determine howthis affects their equations.
In Section 2.4 we studied transformations of functions that have the effect of shift-ing their graphs. In general, for any equation in x and y, if we replace x by x � h orby x � h, the graph of the new equation is simply the old graph shifted horizontally;if y is replaced by y � k or by y � k, the graph is shifted vertically. The following boxgives the details.
Q1
Q2
P
F2
F1
Bob
Kris
t/Co
rbis
57050_10_ch10_p742-819.qxd 08/04/2008 11:47 AM Page 775

776 CHAPTER 10 Analytic Geometry
SAMPLE QUESTION
Text Question
Identify the conic section withequation 9x2 - 36x + 4y2 = 0.
Answer
Ellipse
EXAMPLEA non-degenerate ellipse:
ALTERNATE EXAMPLE 1For the graph of the ellipse
determine the coordinates of thefoci.
ANSWER(-5, 3 - 215)(-5, 3 + 215),
(x - 5) 2
16 +
(y - 3) 2
36 = 1
(x - 3) 2
4 +
(y + 5) 2
25 = 1
+ 324 = 0 3+ 40y25x2 + 4y2 - 150x
Shifted Ellipses
Let’s apply horizontal and vertical shifting to the ellipse with equation
whose graph is shown in Figure 1. If we shift it so that its center is at the point instead of at the origin, then its equation becomes
Example 1 Sketching the Graph of a Shifted Ellipse
Sketch the graph of the ellipse
and determine the coordinates of the foci.
Solution The ellipse
Shifted ellipse1x � 1 2 2
4�1y � 2 2 2
9� 1
1x � 1 2 24
�1y � 2 2 2
9� 1
y
x
b
a(0, 0)
+ =1y™b™
x
™a™
b
a
(h, k)
h
k
(x-h, y-k)
(x, y)
=1(y-k)™
b™(x-h)™
a™ +
Figure 1
Shifted ellipse
1x � h 2 2a2 �
1y � k 2 2b2 � 1
1h, k 2x2
a2 �y2
b2 � 1
776 CHAPTER 10 Analytic Geometry
Shifting Graphs of Equations
If h and k are positive real numbers, then replacing x by x � h or by x � hand replacing y by y � k or by y � k has the following effect(s) on the graphof any equation in x and y.
Replacement How the graph is shifted
1. x replaced by x � h Right h units
2. x replaced by x � h Left h units
3. y replaced by y � k Upward k units
4. y replaced by y � k Downward k units
y
x50
-5
-10
57050_10_ch10_p742-819.qxd 08/04/2008 11:47 AM Page 776

CHAPTER 10 Analytic Geometry 777
ALTERNATE EXAMPLE 2Determine the vertex, focus, anddirectrix of the parabola. x2 - 4x = 36y - 112
ANSWER
(2, 3), (2, 12), y = -6
IN-CLASS MATERIALS
Class time can be saved if this section is covered along with Sections 10.1–10.3. For example, afterdiscussing parabolas, immediately do an example of a shifted parabola. Teach ellipses and hyperbolassimilarly.
is shifted so that its center is at . It is obtained from the ellipse
Ellipse with center at origin
by shifting it left 1 unit and upward 2 units. The endpoints of the minor and major axes of the unshifted ellipse are , , , . We apply therequired shifts to these points to obtain the corresponding points on the shifted ellipse:
This helps us sketch the graph in Figure 2.To find the foci of the shifted ellipse, we first find the foci of the ellipse with
center at the origin. Since a 2 � 9 and b 2 � 4, we have c 2 � 9 � 4 � 5, so .So the foci are . Shifting left 1 unit and upward 2 units, we get
Thus, the foci of the shifted ellipse are
■
Shifted Parabolas
Applying shifts to parabolas leads to the equations and graphs shown in Figure 3.
Figure 3
Shifted parabolas
Example 2 Graphing a Shifted Parabola
Determine the vertex, focus, and directrix and sketch the graph of the parabola.
x2 � 4x � 8y � 28
(a) (x-h)™=4p(y-k)p>0
(b) (x-h)™=4p(y-k)p<0
(c) (y-k)™=4p(x-h)p>0
(d) (y-k)™=4p(x-h)p<0
x
y
0(h, k) x
y
0
(h, k)
x
y
0
(h, k)
x
y
0
(h, k)
A�1, 2 � 15B and A�1, 2 � 15BA0, �15B � A0 � 1, �15 � 2B � A�1, 2 � 15B A0, 15B � A0 � 1, 15 � 2B � A�1, 2 � 15BA0, �15B c � 15
10, �3 2 � 10 � 1, �3 � 2 2 � 1�1, �1 2 10, 3 2 � 10 � 1, 3 � 2 2 � 1�1, 5 2 1�2, 0 2 � 1�2 � 1, 0 � 2 2 � 1�3, 2 2 12, 0 2 � 12 � 1, 0 � 2 2 � 11, 2 210, �3 210, 3 21�2, 0 212, 0 2
x2
4�
y2
9� 1
1�1, 2 2SECTION 10.4 Shifted Conics 777
0 x
y
(_1, 5)
(1, 2)(_3, 2)
(_1, _1)
3
2
(_1, 2)
Figure 21x � 1 2 24
�1y � 2 2 2
9� 1
DRILL QUESTION
Graph the conic section withequation4x2 - 16x + 9y2 - 20 = 0.
Answer
3(x - 2)2
9+
y2
4= 1
3 4(x - 2)2 + 9y2 = 36
4x2 - 16x + 9y2 - 20 = 0
y
x0 432
2
1
-2
57050_10_ch10_p742-819.qxd 08/04/2008 11:47 AM Page 777

778 CHAPTER 10 Analytic Geometry
ALTERNATE EXAMPLE 3 Find the center, vertices, foci,and asymptotes of the givenhyperbola. 4x2 - 32x - 16y2 - 32y = 16
ANSWER
y = -1
2x + 1
(8, -1), y =1
2x - 3,
(4 + 215, -1)(0, -1),
(4, -1), (4 - 215, -1),
IN-CLASS MATERIALS
Help the class recognize the difference between the formulas of conic sections by pointing out that theequation of a parabola has degree 2 in only one variable (which variable it is determines which type ofparabola it is). Equations of ellipses and hyperbolas have degree 2 in both variables; for ellipses thesecond-degree terms have the same sign, and for hyperbolas they have opposite signs.
Solution We complete the square in x to put this equation into one of the formsin Figure 3.
Add 4 to complete the square
Shifted parabola
This parabola opens upward with vertex at . It is obtained from the parabola
Parabola with vertex at origin
by shifting right 2 units and upward 3 units. Since 4p � 8, we have p � 2, so thefocus is 2 units above the vertex and the directrix is 2 units below the vertex. Thus,the focus is and the directrix is y � 1. The graph is shown in Figure 4. ■
Shifted Hyperbolas
Applying shifts to hyperbolas leads to the equations and graphs shown in Figure 5.
Example 3 Graphing a Shifted Hyperbola
A shifted conic has the equation
(a) Complete the square in x and y to show that the equation represents ahyperbola.
(b) Find the center, vertices, foci, and asymptotes of the hyperbola and sketch its graph.
(c) Draw the graph using a graphing calculator.
Solution
(a) We complete the squares in both x and y:
Complete the squares
Divide this by 144
Shifted hyperbola
Comparing this to Figure 5(a), we see that this is the equation of a shifted hyperbola.
1x � 4 2 2
16�1y � 1 2 2
9� 1
91x � 4 2 2 � 161y � 1 2 2 � 144
91x2 � 8x � 16 2 � 161y2 � 2y � 1 2 � 16 � 9 # 16 � 16 # 1 91x2 � 8x 2 � 161y2 � 2y 2 � 16
9x2 � 72x � 16y2 � 32y � 16
x
y
0
(h, k)
x
y
0
(h, k)
=1(x-h)™
a™(y-k)™
b™-(a) =1
( y-k)™b™
(x-h)™a™
+-(b)
12, 5 2x2 � 8y
12, 3 2 1x � 2 2 2 � 81y � 3 2 1x � 2 2 2 � 8y � 24
x2 � 4x � 4 � 8y � 28 � 4
778 CHAPTER 10 Analytic Geometry
0 x
y
(2, 3)
F(2, 5)
y=1
Figure 4
x 2 � 4x � 8y � 28
Figure 5
Shifted hyperbolas
57050_10_ch10_p742-819.qxd 08/04/2008 11:47 AM Page 778

CHAPTER 10 Analytic Geometry 779
EXAMPLEA degenerate hyperbola:x2 - y2 - 4x - 2y + 3 = 03 (x - 2)2 - (y + 1)2 = 0
y
x0
2
1
1 3-1
-2
-3
(b) The shifted hyperbola has center and a horizontal transverse axis.
CENTER
Its graph will have the same shape as the unshifted hyperbola
Hyperbola with center at origin
Since a 2 � 16 and b 2 � 9, we have a � 4, b � 3, and . Thus, the foci lie 5 units to the left and to the right of the center,
and the vertices lie 4 units to either side of the center.
FOCI
VERTICES
The asymptotes of the unshifted hyperbola are , so the asymptotes ofthe shifted hyperbola are found as follows.
ASYMPTOTES
To help us sketch the hyperbola, we draw the central box; it extends 4 units leftand right from the center and 3 units upward and downward from the center.We then draw the asymptotes and complete the graph of the shifted hyperbolaas shown in Figure 6(a).
Figure 6
9x 2 � 72x � 16y 2 � 32y � 16
(c) To draw the graph using a graphing calculator, we need to solve for y. Thegiven equation is a quadratic equation in y, so we use the quadratic formula tosolve for y. Writing the equation in the form
16y2 � 32y � 9x 2 � 72x � 16 � 0
(a) (b)
13_5
_7
5
0x
y
(4, 2)
(4, _4)
(4, _1)F¤(9, _1)F⁄(_1, _1)
(0, _1) (8, _1)
y=_ x+234y= x-43
4
œ∑∑∑∑∑∑∑y = –1 + 0.75 x2 – 8x
œ∑∑∑∑∑∑∑y = –1 – 0.75 x2 – 8x
y � 34 x � 4 and y � �
34 x � 2
y � 1 � � 34 x 3
y � 1 � � 34 1x � 4 2y � �
34 x
10, �1 2 and 18, �1 21�1, �1 2 and 19, �1 2116 � 9 � 5
c � 2a2 � b2 �
x2
16�
y2
9� 1
14, �1 214, �1 2SECTION 10.4 Shifted Conics 779
57050_10_ch10_p742-819.qxd 08/04/2008 11:48 AM Page 779

780 CHAPTER 10 Analytic Geometry
ALTERNATE EXAMPLE 4The graph of the equation 49x2 - y2 + 196x + 28y = 0 is equivalent to a pair ofintersecting lines. Find theequations of these lines.
ANSWERy = 7x + 28, y = -7x
IN-CLASS MATERIALS
The text’s guide to the general equation of a shifted conic is important, but students should not memorizeit blindly. Point out that if they’ve learned the previous section, these rules of thumb should make perfectsense. Have them look at the three general formulas they have learned, generalizing them to allow for ashift:
y = 4p (x - h)2
(x - h) 2
a2 -(y - k) 2
b2 = 1
(x - h) 2
a2 +(y - k) 2
b2 = 1
we get
Quadratic formula
Expand
Simplify
To obtain the graph of the hyperbola, we graph the functions
as shown in Figure 6(b). ■
The General Equation of a Shifted Conic
If we expand and simplify the equations of any of the shifted conics illustrated in Figures 1, 3, and 5, then we will always obtain an equation of the form
where A and C are not both 0. Conversely, if we begin with an equation of this form,then we can complete the square in x and y to see which type of conic section theequation represents. In some cases, the graph of the equation turns out to be just a pair of lines, a single point, or there may be no graph at all. These cases are called degenerate conics. If the equation is not degenerate, then we can tell whether it rep-resents a parabola, an ellipse, or a hyperbola simply by examining the signs of A andC, as described in the following box.
Ax2 � Cy2 � Dx � Ey � F � 0
y � �1 � 0.75 2x2 � 8x and y � �1 � 0.75 2x2 � 8x
� �1 � 342x2 � 8x
Factor 576 from un-der the radical �
�32 � 242x2 � 8x
32
� �32 � 2576x2 � 4608x
32
y ��32 � 2322 � 4116 2 1�9x2 � 72x � 16 2
2116 2780 CHAPTER 10 Analytic Geometry
Johannes Kepler (1571–1630)was the first to give a correct de-scription of the motion of the plan-ets. The cosmology of his timepostulated complicated systems ofcircles moving on circles to de-scribe these motions. Keplersought a simpler and more harmo-nious description. As the officialastronomer at the imperial court inPrague, he studied the astronomi-cal observations of the Danish as-tronomer Tycho Brahe, whose datawere the most accurate available atthe time. After numerous attemptsto find a theory, Kepler made themomentous discovery that the or-bits of the planets are elliptical. Histhree great laws of planetary mo-tion are
1. The orbit of each planet is anellipse with the sun at one focus.
2. The line segment that joins the sun to a planet sweeps outequal areas in equal time (see the figure).
3. The square of the period ofrevolution of a planet is proportional to the cube of thelength of the major axis of its orbit.
His formulation of these laws isperhaps the most impressive de-duction from empirical data in thehistory of science.
General Equation of a Shifted Conic
The graph of the equation
where A and C are not both 0, is a conic or a degenerate conic. In the nondegenerate cases, the graph is
1. a parabola if A or C is 0
2. an ellipse if A and C have the same sign (or a circle if A � C)
3. a hyperbola if A and C have opposite signs
Ax2 � Cy2 � Dx � Ey � F � 0
Example 4 An Equation That Leads to a Degenerate Conic
Sketch the graph of the equation
Solution Because the coefficients of x 2 and y 2 are of opposite sign, this equationlooks as if it should represent a hyperbola (like the equation of Example 3). To see
9x2 � y2 � 18x � 6y � 0
57050_10_ch10_p742-819.qxd 08/04/2008 11:48 AM Page 780

CHAPTER 10 Analytic Geometry 781
whether this is in fact the case, we complete the squares:
Group terms and factor 9
Complete the square
Factor
Divide by 9
For this to fit the form of the equation of a hyperbola, we would need a nonzeroconstant to the right of the equal sign. In fact, further analysis shows that this is theequation of a pair of intersecting lines:
Take square roots
These lines are graphed in Figure 7. ■
Because the equation in Example 4 looked at first glance like the equation of a hy-perbola but, in fact, turned out to represent simply a pair of lines, we refer to its graphas a degenerate hyperbola. Degenerate ellipses and parabolas can also arise when wecomplete the square(s) in an equation that seems to represent a conic. For example, theequation
looks as if it should represent an ellipse, because the coefficients of x 2 and y 2 havethe same sign. But completing the squares leads to
which has no solution at all (since the sum of two squares cannot be negative). Thisequation is therefore degenerate.
10.4 Exercises
1x � 1 2 2 �1y � 1 2 2
4� �
1
4
4x2 � y2 � 8x � 2y � 6 � 0
y � 3x � 6 y � �3x
y � 31x � 1 2 � 3 or y � �31x � 1 2 � 3
y � 3 � � 31x � 1 2 1y � 3 2 2 � 91x � 1 2 2 1x � 1 2 2 �
1y � 3 2 29
� 0
91x � 1 2 2 � 1y � 3 2 2 � 0
91x2 � 2x � 1 2 � 1y2 � 6y � 9 2 � 0 � 9 # 1 � 9
91x2 � 2x 2 � 1y2 � 6y 2 � 0
SECTION 10.4 Shifted Conics 781
Figure 7
9x2 � y2 � 18x � 6y � 0
0 x
y
6
_2
1–4 ■ Find the center, foci, and vertices of the ellipse, and determine the lengths of the major and minor axes. Then sketchthe graph.
1. 2.
3. 4.
5–8 ■ Find the vertex, focus, and directrix of the parabola, andsketch the graph.
5. 6. 1y � 5 2 2 � �6x � 121x � 3 2 2 � 81y � 1 2
1x � 2 2 24
� y2 � 1x2
9�1y � 5 2 2
25� 1
1x � 3 2 216
� 1y � 3 2 2 � 11x � 2 2 2
9�1y � 1 2 2
4� 1
7. 8. y 2 � 16x � 8
9–12 ■ Find the center, foci, vertices, and asymptotes of the hyperbola. Then sketch the graph.
9.
10.
11.
12.1y � 1 2 2
25� 1x � 3 2 2 � 1
y2 �1x � 1 2 2
4� 1
1x � 8 2 2 � 1y � 6 2 2 � 1
1x � 1 2 29
�1y � 3 2 2
16� 1
�4Ax � 12B2 � y
57050_10_ch10_p742-819.qxd 08/04/2008 11:48 AM Page 781

782 CHAPTER 10 Analytic Geometry
0 x
y
_6
directrixy=_12
5
782 CHAPTER 10 Analytic Geometry
13–18 ■ Find an equation for the conic whose graph is shown.
13. 14.
15. 16.
17. 18.
19–30 ■ Complete the square to determine whether the equa-tion represents an ellipse, a parabola, a hyperbola, or a degener-ate conic. If the graph is an ellipse, find the center, foci, vertices,and lengths of the major and minor axes. If it is a parabola, findthe vertex, focus, and directrix. If it is a hyperbola, find the cen-ter, foci, vertices, and asymptotes. Then sketch the graph of theequation. If the equation has no graph, explain why.
19. 9x 2 � 36x � 4y 2 � 0 20.
21. x 2 � 4y 2 � 2x � 16y � 20
22. x 2 � 6x � 12y � 9 � 0
23. 4x 2 � 25y 2 � 24x � 250y � 561 � 0
24. 2x 2 � y 2 � 2y � 1
25. 16x 2 � 9y 2 � 96x � 288 � 0
26. 4x 2 � 4x � 8y � 9 � 0
27. 28.
29. 3x 2 � 4y 2 � 6x � 24y � 39 � 0
30. x 2 � 4y 2 � 20x � 40y � 300 � 0
x2 � y2 � 101x � y 2 � 1x2 � 16 � 41y2 � 2x 2
y2 � 41x � 2y 2
0 x
y
4
2_4
60 x
y
1
asymptotey=x+1
0 x
y
_3
2
F(8, 0)
4
0 x
y
10
_2 20 x
y
4
31–34 ■ Use a graphing device to graph the conic.
31. 2x 2 � 4x � y � 5 � 0
32. 4x 2 � 9y 2 � 36y � 0
33. 9x 2 � 36 � y 2 � 36x � 6y
34. x 2 � 4y 2 � 4x � 8y � 0
35. Determine what the value of F must be if the graph of theequation
is (a) an ellipse, (b) a single point, or (c) the empty set.
36. Find an equation for the ellipse that shares a vertex and a focus with the parabola x 2 � y � 100 and has its other focus at the origin.
37. This exercise deals with confocal parabolas, that is,families of parabolas that have the same focus.
(a) Draw graphs of the family of parabolas
for .
(b) Show that each parabola in this family has its focus atthe origin.
(c) Describe the effect on the graph of moving the vertexcloser to the origin.
Applications
38. Path of a Cannonball A cannon fires a cannonball asshown in the figure. The path of the cannonball is a parabolawith vertex at the highest point of the path. If the cannon-ball lands 1600 ft from the cannon and the highest point itreaches is 3200 ft above the ground, find an equation for the path of the cannonball. Place the origin at the location of the cannon.
39. Orbit of a Satellite A satellite is in an elliptical orbitaround the earth with the center of the earth at one focus.The height of the satellite above the earth varies between140 mi and 440 mi. Assume the earth is a sphere with radius
(feet)
y(feet)
3200
1600 x
p � �2, � 32, �1, �
12,
12, 1, 32, 2
x2 � 4p1y � p 2
4x2 � y2 � 41x � 2y 2 � F � 0
57050_10_ch10_p742-819.qxd 08/04/2008 11:48 AM Page 782

CHAPTER 10 Analytic Geometry 783
SUGGESTED TIME
AND EMPHASIS
class. Optional material.
POINTS TO STRESS
1. Rotation of axes formulas.2. Graphing a general quadratic
equation, including middleterms.
12 -1
IN-CLASS MATERIALS
Point out the progression of the past few sections. Write out Ax2 + Bxy + Cy2 + Dx + Ey + F = 0.When the course started we studied lines, which was just the case where A = B = C = 0. When wediscussed circles, that was the case where A = C, B = D = E = 0. Shifting the center of a circle allowedD and E to take on nonzero values. Our study of conic sections removed the restriction that A = C, so thissection really is the last step in a logical progression.
SECTION 10.5 Rotation of Axes 783
(b) Find equations of two different hyperbolas that havethese properties.
(c) Explain why only one parabola satisfies these proper-ties. Find its equation.
(d) Sketch the conics you found in parts (a), (b), and (c) onthe same coordinate axes (for the hyperbolas, sketch thetop branches only).
(e) How are the ellipses and hyperbolas related to theparabola?
0 x
y
1
3960 mi. Find an equation for the path of the satellite withthe origin at the center of the earth.
Discovery • Discussion
40. A Family of Confocal Conics Conics that share a focusare called confocal. Consider the family of conics that havea focus at and a vertex at the origin (see the figure).
(a) Find equations of two different ellipses that have theseproperties.
10, 1 2
440 mi 140 mi
10.5 Rotation of Axes
In Section 10.4 we studied conics with equations of the form
We saw that the graph is always an ellipse, parabola, or hyperbola with horizontal orvertical axes (except in the degenerate cases). In this section we study the most gen-eral second-degree equation
We will see that the graph of an equation of this form is also a conic. In fact, by rotating the coordinate axes through an appropriate angle, we can eliminate the term Bxy and then use our knowledge of conic sections to analyze the graph.
Rotation of Axes
In Figure 1 the x- and y-axes have been rotated through an acute angle f about theorigin to produce a new pair of axes, which we call the X- and Y-axes. A point P thathas coordinates in the old system has coordinates in the new system. Ifwe let r denote the distance of P from the origin and let u be the angle that the seg-ment OP makes with the new X-axis, then we can see from Figure 2 on the next page(by considering the two right triangles in the figure) that
x � r cos1u � f 2 y � r sin1u � f 2X � r cos u Y � r sin u
1X, Y 21x, y 2
Ax2 � Bxy � Cy2 � Dx � Ey � F � 0
Ax2 � Cy2 � Dx � Ey � F � 0
0
P(x, y)P(X, Y)
y
x
Y
X
ƒ
Figure 1
57050_10_ch10_p742-819.qxd 08/04/2008 11:48 AM Page 783

784 CHAPTER 10 Analytic Geometry
ALTERNATE EXAMPLE 1If the coordinate axes are rotated
through an angle of , find the
XY coordinates of the point withxy coordinates (1, 4).
ANSWER
ALTERNATE EXAMPLE 2Rotate the coordinate axesthrough 45o to show that xy = 4 isa hyperbola.
ANSWERRotation as in the text gives
X 2
8-
Y 2
8= 1.
a1 + 413
2, 4 - 13
2b
p
3
Using the addition formula for cosine, we see that
Similarly, we can apply the addition formula for sine to the expression for y to obtainy � X sin f � Y cos f. By treating these equations for x and y as a system of linearequations in the variables X and Y (see Exercise 33), we obtain expressions for X andY in terms of x and y, as detailed in the following box.
� X cos f � Y sin f
� 1r cos u 2 cos f � 1r sin u 2 sin f
� r 1cos u cos f � sin u sin f 2 x � r cos1u � f 2784 CHAPTER 10 Analytic Geometry
y
0
P
x
Y
X
Ĭ
yr
X
Y
x
Figure 2
Rotation of Axes Formulas
Suppose the x- and y-axes in a coordinate plane are rotated through the acuteangle f to produce the X- and Y-axes, as shown in Figure 1. Then the coordi-nates and of a point in the xy- and the XY-planes are related asfollows:
y � X sin f � Y cos f Y � �x sin f � y cos f
x � X cos f � Y sin f X � x cos f � y sin f
1X, Y 21x, y 2
Example 1 Rotation of Axes
If the coordinate axes are rotated through 30�, find the XY-coordinates of thepoint with xy-coordinates .
Solution Using the Rotation of Axes Formulas with x � 2, y � �4, and f � 30�, we get
The XY-coordinates are . ■
Example 2 Rotating a Hyperbola
Rotate the coordinate axes through 45� to show that the graph of the equation xy � 2 is a hyperbola.
Solution We use the Rotation of Axes Formulas with f � 45� to obtain
y � X sin 45° � Y cos 45° �X
12�
Y
12
x � X cos 45° � Y sin 45° �X
12�
Y
12
1�2 � 13, �1 � 213 2 Y � �2 sin 30° � 1�4 2 cos 30° � �2 a 1
2b � 4 a 13
2b � �1 � 213
X � 2 cos 30° � 1�4 2 sin 30° � 2 a 13
2b � 4 a 1
2b � 13 � 2
12, �4 2
57050_10_ch10_p742-819.qxd 08/04/2008 11:48 AM Page 784

CHAPTER 10 Analytic Geometry 785
Substituting these expressions into the original equation gives
We recognize this as a hyperbola with vertices in the XY-coordinate system.Its asymptotes are Y � �X, which correspond to the coordinate axes in the xy-system (see Figure 3).
■
General Equation of a Conic
The method of Example 2 can be used to transform any equation of the form
into an equation in X and Y that doesn’t contain an XY-term by choosing an appro-priate angle of rotation. To find the angle that works, we rotate the axes through anangle f and substitute for x and y using the Rotation of Axes Formulas:
If we expand this and collect like terms, we obtain an equation of the form
where
C¿ � A sin2f � B sin f cos f � C cos2f
B¿ � 21C � A 2 sin f cos f � B1cos2f � sin2f 2 A¿ � A cos2f � B sin f cos f � C sin2f
A¿X 2 � B¿XY � C¿Y 2 � D¿X � E¿Y � F¿ � 0
� E1X sin f � Y cos f 2 � F � 0
� C1X sin f � Y cos f 2 2 � D1X cos f � Y sin f 2 A1X cos f � Y sin f 2 2 � B1X cos f � Y sin f 2 1X sin f � Y cos f 2Ax2 � Bxy � Cy2 � Dx � Ey � F � 0
y
x0
XY
45*
Figure 3
xy � 2
1�2, 0 2 X 2
4�
Y 2
4� 1
X 2
2�
Y 2
2� 2
a X
12�
Y
12b a X
12�
Y
12b � 2
SECTION 10.5 Rotation of Axes 785
57050_10_ch10_p742-819.qxd 08/04/2008 11:48 AM Page 785

786 CHAPTER 10 Analytic Geometry
ALTERNATE EXAMPLE 3Use rotation of axes to eliminatethe xy-term in the equation
ANSWERRotation angle:
Transformation equations:
New equation:4X 2 + 16Y 2 = 16
y =1
2X +
13
2Y
x =13
2X -
1
2Y
f =p
6
cot 2f =123
7x2 - 613xy + 13y2 = 16.
IN-CLASS MATERIALS
This is a very good section to teach with the aid of a CAS, or even a good place to introduce such a device.A great deal of the work in graphing an arbitrary conic section is multiplying out long algebraic expres-sions, which a CAS can do easily.
To eliminate the XY-term, we would like to choose f so that B� � 0, that is,
Double-angle formulas for sine and cosine
Divide by B sin 2f
The preceding calculation proves the following theorem.
cot 2f �A � C
B
B cos 2f � 1A � C 2 sin 2f
1C � A 2 sin 2f � B cos 2f � 0
21C � A 2 sin f cos f � B1cos2f � sin2f 2 � 0
F¿ � F
E¿ � �D sin f � E cos f
D¿ � D cos f � E sin f
786 CHAPTER 10 Analytic Geometry
Simplifying the General Conic Equation
To eliminate the xy-term in the general conic equation
rotate the axes through the acute angle f that satisfies
cot 2f �A � C
B
Ax2 � Bxy � Cy2 � Dx � Ey � F � 0
Double-angle formulas
cos 2f � cos2f � sin2f
sin 2f � 2 sin f cos f
Example 3 Eliminating the xy-Term
Use a rotation of axes to eliminate the xy-term in the equation
Identify and sketch the curve.
Solution To eliminate the xy-term, we rotate the axes through an angle f thatsatisfies
Thus, 2f � 60� and hence f � 30�. With this value of f, we get
Rotation of Axes Formulas
Substituting these values for x and y into the given equation leads to
613 a X13
2�
Y
2b 2
� 6 a X13
2�
Y
2b a X
2�
Y13
2b � 413 a X
2�
Y13
2b 2
� 2113
cos f �132
, sin f � 12 y � X a 1
2b � Y a 13
2b
x � X a 13
2b � Y a 1
2b
cot 2f �A � C
B�
613 � 413
6�13
3
613x2 � 6xy � 413y2 � 2113
57050_10_ch10_p742-819.qxd 08/04/2008 11:48 AM Page 786

CHAPTER 10 Analytic Geometry 787
ALTERNATE EXAMPLE 4A conic has the equation
(a) Identify and sketch the graph.(b) Draw the graph using a
graphing device.
ANSWERS(a) As shown in Alternate
Example 3, this is a conicrotated by 30º with equation4X 2 + 16Y 2 = 16. Thesketch will be the ellipse
with axes
rotated by 30o.(b)
x2
4+ y2 = 1
7x2 - 613xy + 13y2 = 16.
y
x
X
Y
_2
_2
2
230*
Expanding and collecting like terms, we get
Divide by
This is the equation of an ellipse in the XY-coordinate system. The foci lie on the Y-axis. Because a2 � 7 and b2 � 3, the length of the major axis is , and thelength of the minor axis is . The ellipse is sketched in Figure 4. ■
In the preceding example we were able to determine fwithout difficulty, since weremembered that . In general, finding f is not quite so easy. The nextexample illustrates how the following half-angle formulas, which are valid for 0 � f � p/2, are useful in determining f (see Section 7.3):
Example 4 Graphing a Rotated Conic
A conic has the equation
(a) Use a rotation of axes to eliminate the xy-term.
(b) Identify and sketch the graph.
(c) Draw the graph using a graphing calculator.
Solution
(a) To eliminate the xy-term, we rotate the axes through an angle f that satisfies
In Figure 5 we sketch a triangle with . We see that
so, using the half-angle formulas, we get
The Rotation of Axes Formulas then give
Substituting into the given equation, we have
� 36A35 X � 4
5YB2 � 15A45 X � 3
5YB � 20A35 X � 4
5YB � 25 � 0
64A45 X � 3
5 YB2 � 96A45
X � 35 YB A35
X � 45 YB
x � 45 X � 3
5 Y and y � 3
5 X � 4
5 Y
sin f � B1 � 7
25
2� B
9
25�
3
5
cos f � B1 � 7
25
2� B
16
25�
4
5
cos 2f � 725
cot 2f � 724
cot 2f �A � C
B�
64 � 36
96�
7
24
64x2 � 96xy � 36y2 � 15x � 20y � 25 � 0
cos f � B1 � cos 2f
2 sin f � B
1 � cos 2f
2
cot 60° � 13/3
213217
2113 X 2
3�
Y 2
7� 1
713X 2 � 313Y 2 � 2113
SECTION 10.5 Rotation of Axes 787
7
2425
2ƒ
Figure 5
y
x
X
Y
30*
Figure 4
613x2 � 6xy � 413y2 � 2113
57050_10_ch10_p742-819.qxd 08/04/2008 11:48 AM Page 787

788 CHAPTER 10 Analytic Geometry
EXAMPLEThe rotated parabola x2 + 2xy + y2 + 2x - 4y = 0: . Now we have
.
After substituting, and a lot of algebra, we get . Completing the square,
(for sketching purposes).y =2 12
3ax -
12
8b2
-12
48L 0.9( x - 0.2) 2
8x2 - 212 x - 612y = 0
x = 12X - 12Y, y = 12X + 12Y
cot (2f) = 0 Q 2f =p
2 Q f = p
Expanding and collecting like terms, we get
Simplify
Divide by 4
(b) We recognize this as the equation of a parabola that opens along the negative Y-axis and has vertex in XY-coordinates. Since , we have
, so the focus is and the directrix is . Using
we sketch the graph in Figure 6(a).
(c) To draw the graph using a graphing calculator, we need to solve for y. Thegiven equation is a quadratic equation in y, so we can use the quadratic formulato solve for y. Writing the equation in the form
we get
Expand
Simplify
Simplify � �24x � 5 � 5215x � 10
18
� �96x � 20 � 20215x � 10
72
� �196x � 20 2 � 26000x � 4000
72
Quadraticformula y �
�196x � 20 2 � 2196x � 20 2 2 � 4136 2 164x2 � 15x � 25 22136 2
36y2 � 196x � 20 2y � 164x2 � 15x � 25 2 � 0
y
x
X
Y
ā37*
(0, 1)
(a) (b)
2_2
_2
2
y = (–24x – 5 – 5 15x + 10)/18
y = (–24x – 5 + 5 15x + 10)/18
f � cos�1 45 � 37°
Y � 1716A0,
1516Bp � �
116
4p � � 1410, 1 2
X 2 � � 14 1Y � 1 2 �4X 2 � Y � 1
100X 2 � 25Y � 25 � 0
788 CHAPTER 10 Analytic Geometry
Figure 6
15x � 20y � 25 � 064x2 � 96xy � 36y2 �
x
y
1
_1 0
57050_10_ch10_p742-819.qxd 08/04/2008 11:48 AM Page 788
CHAPTER 10 Analytic Geometry 789
To obtain the graph of the parabola, we graph the functions
as shown in Figure 6(b). ■
The Discriminant
In Examples 3 and 4 we were able to identify the type of conic by rotating the axes.The next theorem gives rules for identifying the type of conic directly from the equa-tion, without rotating axes.
y � A�24x � 5 � 5215x � 10B/18 and y � A�24x � 5 � 5215x � 10B/18
SECTION 10.5 Rotation of Axes 789
Identifying Conics by the Discriminant
The graph of the equation
is either a conic or a degenerate conic. In the nondegenerate cases, the graph is
1. a parabola if B2 � 4AC � 0
2. an ellipse if B2 � 4AC � 0
3. a hyperbola if B2 � 4AC � 0
The quantity B2 � 4AC is called the discriminant of the equation.
Ax2 � Bxy � Cy2 � Dx � Ey � F � 0
■ Proof If we rotate the axes through an angle f, we get an equation of the form
where A�, B�, C�, . . . are given by the formulas on pages 785–786. A straightfor-ward calculation shows that
Thus, the expression B 2 � 4AC remains unchanged for any rotation. In particular,if we choose a rotation that eliminates the xy-term , we get
In this case, B 2 � 4AC � �4A�C�. So B 2 � 4AC � 0 if either A� or C� is zero; B 2 � 4AC � 0 if A� and C� have the same sign; and B 2 � 4AC � 0 if A� and C�have opposite signs. According to the box on page 780, these cases correspond to the graph of the last displayed equation being a parabola, an ellipse, or a hyperbola,respectively. ■
In the proof we indicated that the discriminant is unchanged by any rotation; forthis reason, the discriminant is said to be invariant under rotation.
A¿X 2 � C¿Y
2 � D¿X � E¿Y � F¿ � 0
1B¿ � 0 21B¿ 2 2 � 4A¿C¿ � B2 � 4AC
A¿X 2 � B¿XY � C¿Y 2 � D¿X � E¿Y � F¿ � 0
57050_10_ch10_p742-819.qxd 08/04/2008 11:48 AM Page 789

790 CHAPTER 10 Analytic Geometry
ALTERNATE EXAMPLE 5A conic has the equation
(a) Use the discriminant toidentify the conic.
(b) Confirm your answer to part(a) by graphing the conic witha graphing calculator.
ANSWERS(a) B2 - 4AC = 196 > 0, so the
conic is a hyperbola.(b)
SAMPLE QUESTION
Text Question
If you are presented with theequation of a conic such as 3x2 +5xy - 2y2 + x - y + 4 = 0, howwould you go about finding if it isan ellipse, parabola, or hyperbola?
Answer
Evaluate the discriminant.
DRILL QUESTIONConsider the equation 3x2 + 5xy - 2y2 + x - y + 4 = 0.What shape is its graph?
Answer
It is a hyperbola.
17x2 - 48xy + 31y2 + 49 = 0.
Example 5 Identifying a Conic by the Discriminant
A conic has the equation
(a) Use the discriminant to identify the conic.
(b) Confirm your answer to part (a) by graphing the conic with a graphing calculator.
Solution
(a) Since A � 3, B � 5, and C � �2, the discriminant is
So the conic is a hyperbola.
(b) Using the quadratic formula, we solve for y to get
We graph these functions in Figure 7. The graph confirms that this is ahyperbola. ■
10.5 Exercises
3_3
_5
55y = (5x – 1 + œ49x2 – 2x + 33 )/4∑∑∑∑∑∑∑∑∑∑∑∑
y = (5x – 1 – œ49x2 – 2x + 33 )/4∑∑∑∑∑∑∑∑∑∑∑∑Figure 7
y �5x � 1 � 249x2 � 2x � 33
4
B2 � 4AC � 52 � 413 2 1�2 2 � 49 � 0
3x2 � 5xy � 2y2 � x � y � 4 � 0
790 CHAPTER 10 Analytic Geometry
1–6 ■ Determine the XY-coordinates of the given point if thecoordinate axes are rotated through the indicated angle.
1.
2.
3.
4.
5.
6. A12, 4 12B, f � 45°
10, 2 2 , f � 55°
12, 0 2 , f � 15°
A3, �13B, f � 60°
1�2, 1 2 , f � 30°
11, 1 2 , f � 45°
7–12 ■ Determine the equation of the given conic in XY-coordinates when the coordinate axes are rotated through the indicated angle.
7. x 2 � 3y 2 �4, f � 60�
8.
9.
10.
11.
12. xy � x � y, f � p/4
x2 � 2 13 xy � y2 � 4, f � 30°
x2 � 2y2 � 16, f � sin�1 35
x2 � y2 � 2y, f � cos�1 35
y � 1x � 1 2 2, f � 45°
2010_20 _10
20
10
_20
_10
x
y
57050_10_ch10_p742-819.qxd 08/04/2008 11:48 AM Page 790

CHAPTER 10 Analytic Geometry 791
IN-CLASS MATERIALS
If the students are going to be moving on to linear algebra in the future, Exercise 35 is an excellent one togo over in class. It addresses the idea of linear transformations, which will be a major topic in that course.
SECTION 10.5 Rotation of Axes 791
13–26 ■ (a) Use the discriminant to determine whether thegraph of the equation is a parabola, an ellipse, or a hyperbola.(b) Use a rotation of axes to eliminate the xy-term. (c) Sketch the graph.
13. xy � 8
14. xy � 4 � 0
15. x 2 � 2xy � y 2 � x � y � 0
16.
17.
18.
19. 11x 2 � 24xy � 4y 2 � 20 � 0
20. 25x 2 � 120xy � 144y 2 � 156x � 65y � 0
21.
22. 153x 2 � 192xy � 97y 2 � 225
23.
24.
25. 52x 2 � 72xy � 73y 2 � 40x � 30y � 75
26.
27–30 ■ (a) Use the discriminant to identify the conic. (b) Confirm your answer by graphing the conic using a graphingdevice.
27. 2x 2 � 4xy � 2y 2 � 5x � 5 � 0
28. x 2 � 2xy � 3y 2 � 8
29. 6x 2 � 10xy � 3y 2 � 6y � 36
30. 9x 2 � 6xy � y 2 � 6x � 2y � 0
31. (a) Use rotation of axes to show that the following equationrepresents a hyperbola:
(b) Find the XY- and xy-coordinates of the center, vertices,and foci.
(c) Find the equations of the asymptotes in XY- and xy-coordinates.
32. (a) Use rotation of axes to show that the following equationrepresents a parabola:
2 121x � y 2 2 � 7x � 9y
7x2 � 48xy � 7y2 � 200x � 150y � 600 � 0
17x � 24y 2 2 � 600x � 175y � 25
9x2 � 24xy � 16y2 � 1001x � y � 1 22 13 x2 � 6xy � 13 x � 3y � 0
13 x2 � 3xy � 3
21x2 � 10 13 xy � 31y2 � 144
x2 � 2 13 xy � y2 � 2 � 0
13x2 � 6 13 xy � 7y2 � 16
(b) Find the XY- and xy-coordinates of the vertex and focus.
(c) Find the equation of the directrix in XY- and xy-coordinates.
33. Solve the equations:
for X and Y in terms of x and y. [Hint: To begin, multiply thefirst equation by cos f and the second by sin f, and thenadd the two equations to solve for X.]
34. Show that the graph of the equation
is part of a parabola by rotating the axes through an angle of45�. [Hint: First convert the equation to one that does not involve radicals.]
Discovery • Discussion
35. Matrix Form of Rotation of Axes Formulas
Let Z, Z�, and R be the matrices
Show that the Rotation of Axes Formulas can be written as
36. Algebraic Invariants A quantity is invariant under rota-tion if it does not change when the axes are rotated. It wasstated in the text that for the general equation of a conic, thequantity B 2 � 4AC is invariant under rotation.
(a) Use the formulas for A�, B�, and C� on page 785 toprove that the quantity B 2 � 4AC is invariant under rotation; that is, show that
(b) Prove that A � C is invariant under rotation.
(c) Is the quantity F invariant under rotation?
37. Geometric Invariants Do you expect that the distancebetween two points is invariant under rotation? Prove youranswer by comparing the distance and where P� and Q� are the images of P and Q under a rotationof axes.
d1P¿, Q¿ 2d1P, Q 2
B2 � 4AC � B¿2 � 4A¿C¿
Z � RZ¿ and Z¿ � R�1Z
R � c cos f �sin f
sin f cos fd
Z � c xyd Z¿ � cX
Yd
1x � 1y � 1
y � X sin f � Y cos f
x � X cos f � Y sin f
57050_10_ch10_p742-819.qxd 08/04/2008 11:48 AM Page 791
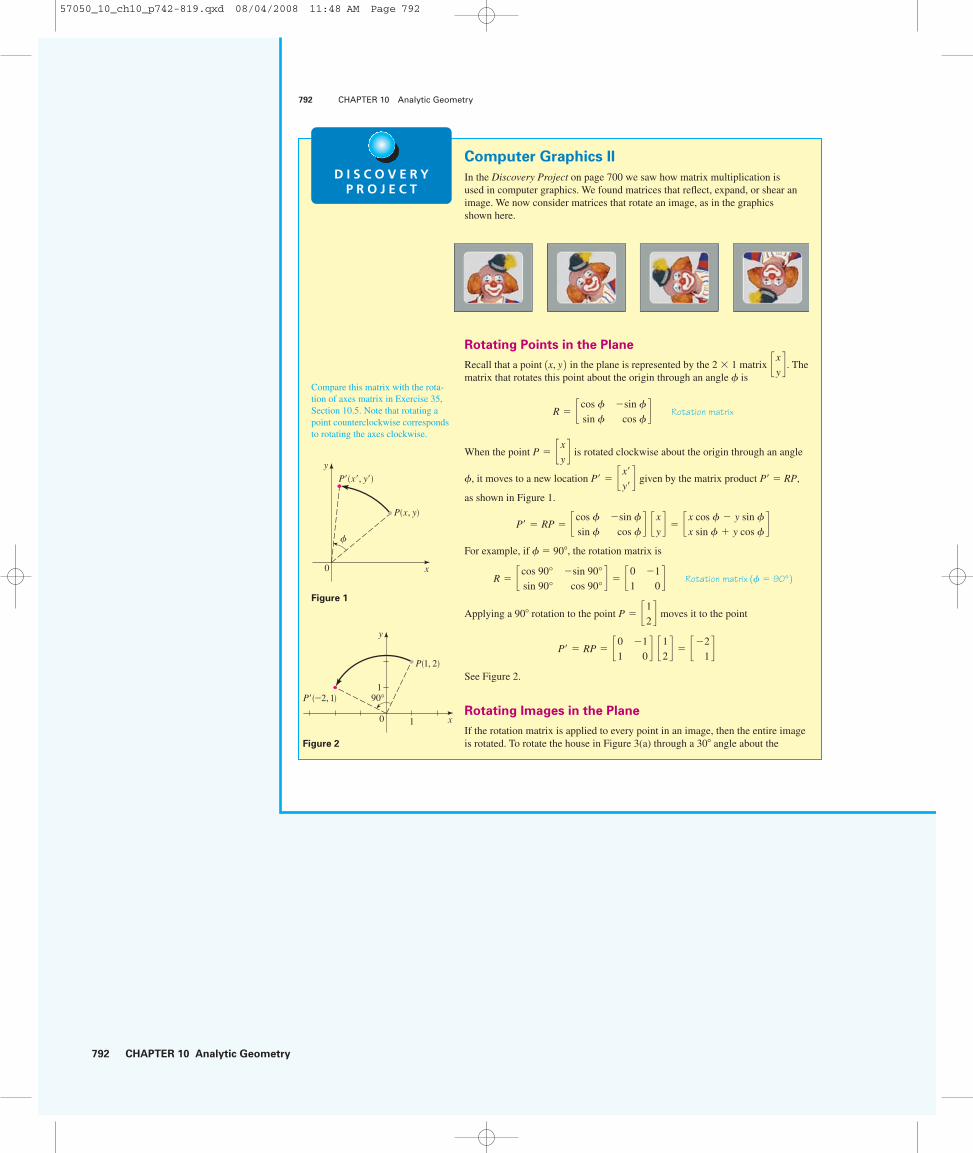
792 CHAPTER 10 Analytic Geometry
Computer Graphics II
In the Discovery Project on page 700 we saw how matrix multiplication is used in computer graphics. We found matrices that reflect, expand, or shear animage. We now consider matrices that rotate an image, as in the graphics shown here.
Rotating Points in the Plane
Recall that a point in the plane is represented by the 2 1 matrix . Thematrix that rotates this point about the origin through an angle f is
Rotation matrix
When the point is rotated clockwise about the origin through an angle
f, it moves to a new location given by the matrix product P� � RP,
as shown in Figure 1.
For example, if f � 90�, the rotation matrix is
Rotation matrix
Applying a 90� rotation to the point moves it to the point
See Figure 2.
Rotating Images in the Plane
If the rotation matrix is applied to every point in an image, then the entire imageis rotated. To rotate the house in Figure 3(a) through a 30� angle about the
P¿ � RP � c0 �1
1 0d c1
2d � c�2
1d
P � c12d
1f � 90° 2R � c cos 90° �sin 90°
sin 90° cos 90°d � c0 �1
1 0d
P¿ � RP � c cos f �sin f
sin f cos fd c x
yd � c x cos f � y sin f
x sin f � y cos fd
P¿ � c x¿y¿dP � c x
yd
R � c cos f �sin f
sin f cos fd
c xyd1x, y 2
792 CHAPTER 10 Analytic Geometry
D I S C O V E R YP R O J E C T
P�(x�, y�)
P(x, y)
ƒ
0
y
x
Figure 1
Figure 2
P�(_2, 1)
P(1, 2)
90*
0 1
1
y
x
Compare this matrix with the rota-tion of axes matrix in Exercise 35,Section 10.5. Note that rotating apoint counterclockwise correspondsto rotating the axes clockwise.
57050_10_ch10_p742-819.qxd 08/04/2008 11:48 AM Page 792

CHAPTER 10 Analytic Geometry 793
SECTION 10.5 Rotation of Axes 793
origin, we multiply its data matrix (described on page 701) by the rotation ma-trix that has f � 30�.
The new data matrix RD represents the rotated house in Figure 3(b).
The Discovery Project on page 702 describes a TI-83 program that draws theimage corresponding to a given data matrix. You may find it convenient to usethis program in some of the following activities.
1. Use a rotation matrix to find the new coordinates of the given point when it isrotated through the given angle.
(a) (b)(c) (d)
2. Find a data matrix for the line drawing in the figure shown in the margin.Multiply the data matrix by a suitable rotation matrix to rotate the imageabout the origin by f � 120�. Sketch the rotated image given by the new datamatrix.
3. Sketch the image represented by the data matrix D.
Find the rotation matrix R that corresponds to a 45� rotation, and the transfor-mation matrix T that corresponds to an expansion by a factor of 2 in the x-direction (see page 701). How does multiplying the data matrix by RTchange the image? How about multiplying by TR? Calculate the productsRTD and TRD, and sketch the corresponding images to confirm your answers.
4. Let R be the rotation matrix for the angle f. Show that R�1 is the rotationmatrix for the angle �f.
D � c2 3 3 4 4 1 1 2 2
1 1 3 3 4 4 3 3 1d
17, 3 2 , f � �60°1�2, �2 2 , f � 135°
1�2, 1 2 , f � 60°11, 4 2 , f � 90°
1
10
y
x
(a)
1
10
y
x
(b)Figure 3
� c1.73 0 �1.50 �0.77 1.96 3.46 2.60 1.60 0.73 1.73 2.60
1 0 2.60 5.33 4.60 2 1.50 3.23 2.73 1 1.50d
RD � c 132 �
12
12
132
d c2 0 0 2 4 4 3 3 2 2 3
0 0 3 5 3 0 0 2 2 0 0d
1
10
y
x
57050_10_ch10_p742-819.qxd 08/04/2008 11:48 AM Page 793

794 CHAPTER 10 Analytic Geometry
5. To translate an image by , we add h to each x-coordinate and k to each y-coordinate of each point in the image (see the figure in the margin). This can be done by adding an appropriate matrix M to D, but thedimension of M would change depending on the dimension of D. In practice,translation is accomplished by matrix multiplication. To see how this is done,we introduce homogeneous coordinates; that is, we represent the point
by a 3 1 matrix:
(a) Let T be the matrix
Show that T translates the point to the point by verifying the following matrix multiplication.
(b) Find T�1 and describe how T�1 translates points.
(c) Verify that multiplying by the following matrices has the indicated
effects on a point represented by its homogeneous coordinates .
Reflection Expansion (or Shear in Rotation about the in x-axis contraction) x-direction origin by
in x-direction the angle f
(d) Sketch the image represented (in homogeneous coordinates) by this datamatrix:
Find a matrix T that translates the image by and a matrix Rthat rotates the image by 45�. Sketch the images represented by the datamatrices TD, RTD, and T�1RTD. Describe how an image is changedwhen its data matrix is multiplied by T, by RT, and by T�1RT.
1�6, �8 2D � £3 5 5 7 7 9 9 7 7 5 5 3 3
7 7 5 5 7 7 9 9 11 11 9 9 7
1 1 1 1 1 1 1 1 1 1 1 1 1
§
£1 0 0
0 �1 0
0 0 1
§ £ c 0 0
0 1 0
0 0 1
§ £1 c 0
0 1 0
0 0 1
§ £ cos f �sin f 0
sin f cos f 0
0 0 1
§£ xy
1
§1x, y 2
£1 0 h
0 1 k
0 0 1
§ £ x
y
1
§ � £ x � h
y � k
1
§1x � h, y � h 21x, y 2
T � £1 0 h
0 1 k
0 0 1
§
1x, y 2 4 £ x
y
1
§1x, y 2
1h, k 2794 CHAPTER 10 Analytic Geometry
0
y
x
(x, y)
(x+h, y+k)
h
k
57050_10_ch10_p742-819.qxd 08/04/2008 11:48 AM Page 794

CHAPTER 10 Analytic Geometry 795
SUGGESTED TIME
AND EMPHASIS
1 class. Optional material.
POINTS TO STRESS
1. Expressing conic sections inpolar form.
2. Rotating conic sections in para-metric form.
3. The eccentricity of a conic.
SAMPLE QUESTION
Text Question
State a reason that we would want to express a conic in polar form.
Answer
Answers will vary. One reason is that they are easier to rotate when expressed in polar form.
10.6 Polar Equations of Conics
Earlier in this chapter we defined a parabola in terms of a focus and directrix, but wedefined the ellipse and hyperbola in terms of two foci. In this section we give a moreunified treatment of all three types of conics in terms of a focus and directrix. If weplace the focus at the origin, then a conic section has a simple polar equation. More-over, in polar form, rotation of conics becomes a simple matter. Polar equations of ellipses are crucial in the derivation of Kepler’s Laws (see page 780).
SECTION 10.6 Polar Equations of Conics 795
Equivalent Description of Conics
Let F be a fixed point (the focus), / a fixed line (the directrix), and e a fixedpositive number (the eccentricity). The set of all points P such that the ratioof the distance from P to F to the distance from P to / is the constant e is aconic. That is, the set of all points P such that
is a conic. The conic is a parabola if e � 1, an ellipse if e � 1, or a hyperbolaif e � 1.
d1P, F 2d1P, / 2 � e
■ Proof If e � 1, then , and so the given condition becomes thedefinition of a parabola as given in Section 10.1.
Now, suppose e 1. Let’s place the focus F at the origin and the directrix paral-lel to the y-axis and d units to the right. In this case the directrix has equation x � dand is perpendicular to the polar axis. If the point P has polar coordinates , wesee from Figure 1 that and . Thus, the condition
, or , becomes
If we square both sides of this polar equation and convert to rectangular coordinates,we get
Expand and simplify
Divide by 1 � e2 and completethe square
If e � 1, then dividing both sides of this equation by gives anequation of the form
where
h ��e2d
1 � e2 a2 �e2d 211 � e2 2 2 b2 �
e2d 2
1 � e2
1x � h 2 2a2 �
y2
b2 � 1
e2d 2/ 11 � e2 2 2a x �
e2d
1 � e2 b 2
�y2
1 � e2 �e2d 211 � e2 2 2
11 � e2 2x2 � 2de2x � y2 � e2d 2
x2 � y2 � e21d � x 2 2r � e1d � r cos u 2d1P, F 2 � e # d1P, / 2d1P, F 2 /d1P, / 2 � e
d1P, / 2 � d � r cos ud1P, F 2 � r1r, u 2
d1P, F 2 � d1P, / 2
r ç ¨
y
xF
� (directrix)
x=d
P
¨
r
d
Figure 1
57050_10_ch10_p742-819.qxd 08/04/2008 11:48 AM Page 795

796 CHAPTER 10 Analytic Geometry
EXAMPLEIdentify and graph conic section.
is a parabola.
=2
1 + cos au -p
6b
r =6
3 + 3 cos au -p
6b
IN-CLASS MATERIALS
Notice the advantages of working with conics in polar form. They are easier to rotate, for example. It isalso easier to identify a conic as an ellipse, parabola, or hyperbola by inspection. After some practice,we can even look at such an equation and have a good idea of what the graph will look like, again byinspection.
This is the equation of an ellipse with center . In Section 10.2 we found that thefoci of an ellipse are a distance c from the center, where c2 � a2 � b2. In our case
Thus, , which confirms that the focus defined in the theorem is the same as the focus defined in Section 10.2. It also follows that
If e � 1, a similar proof shows that the conic is a hyperbola with e � c/a, wherec 2 � a 2 � b 2. ■
In the proof we saw that the polar equation of the conic in Figure 1 is. Solving for r, we get
If the directrix is chosen to be to the left of the focus , then we get the equation . If the directrix is parallel to the polar axis
, then we get sin u instead of cos u in the equation. These obser-vations are summarized in the following box and in Figure 2.1y � d or y � �d 2
r � ed/ 11 � e cos u 21x � �d 2
r �ed
1 � e cos u
r � e1d � r cos u 2
c � e2d/ 11 � e2 2 � �h
c2 � a2 � b2 �e4d 2
11 � e2 2 2
1h, 0 2
796 CHAPTER 10 Analytic Geometry
(a) r= ed1+e ç ¨ (b) r= ed
1-e ç ¨ (c) r= ed1+e ß ¨ (d) r= ed
1-e ß ¨
y
xF
x=ddirectrix
axisF
x=_ddirectrix
y
xaxis F
y=d directrixy
x
axis y=_d directrix
F
y
x
axis
Figure 2
The form of the polar equation of a conic indicates the location of the directrix.
Polar Equations of Conics
A polar equation of the form
represents a conic with one focus at the origin and with eccentricity e. Theconic is
1. a parabola if e � 1
2. an ellipse if 0 � e � 1
3. a hyperbola if e � 1
r �ed
1 � e cos u or r �
ed
1 � e sin u
e �ca
_4
_2
2
4
_4 _2 2 4 x
y
0
57050_10_ch10_p742-819.qxd 08/04/2008 06:10 PM Page 796
CHAPTER 10 Analytic Geometry 797
DRILL QUESTION
Identify the conic:
Answer
It is a hyperbola.
ALTERNATE EXAMPLE 1Find a polar equation for theparabola that has its focus at theorigin and whose directrix is theline
ANSWER
ALTERNATE EXAMPLE 2 A conic is given by the polarequation:
Identify the conic. If the conic isan ellipse or a hyperbola, find thedistances a and b. If the conic is aparabola, find the focus and theequation of the directrix.
ANSWEREllipse, 15, 11.18
EXAMPLEIdentify and graph conicsection:
is a hyperbola, rotated 30º fromstandard position, witheccentricity 3.
r =6
1 + 3 cos au -p
6b
r =25
3 - 2 cos u
r =5
1 - sin (u)
y = -5.
r =6
1 ; 3 cos u
_4
_2
2
4
_4 _2 2 4 x
y
0
To graph the polar equation of a conic, we first determine the location of the di-rectrix from the form of the equation. The four cases that arise are shown in Figure 2.(The figure shows only the parts of the graphs that are close to the focus at the origin.The shape of the rest of the graph depends on whether the equation represents a parabola, an ellipse, or a hyperbola.) The axis of a conic is perpendicular to the directrix—specifically we have the following:
1. For a parabola, the axis of symmetry is perpendicular to the directrix.
2. For an ellipse, the major axis is perpendicular to the directrix.
3. For a hyperbola, the transverse axis is perpendicular to the directrix.
Example 1 Finding a Polar Equation
for a Conic
Find a polar equation for the parabola that has its focus at the origin and whose directrix is the line y � �6.
Solution Using e � 1 and d � 6, and using part (d) of Figure 2, we see that thepolar equation of the parabola is
■
To graph a polar conic, it is helpful to plot the points for which u � 0, p/2, p,and 3p/2. Using these points and a knowledge of the type of conic (which we obtainfrom the eccentricity), we can easily get a rough idea of the shape and location of thegraph.
Example 2 Identifying and Sketching
a Conic
A conic is given by the polar equation
(a) Show that the conic is an ellipse and sketch the graph.
(b) Find the center of the ellipse, and the lengths of the major and minor axes.
Solution
(a) Dividing the numerator and denominator by 3, we have
Since , the equation represents an ellipse. For a rough graph we plotthe points for which u � 0, p/2, p, 3p/2 (see Figure 3 on the next page).
(b) Comparing the equation to those in Figure 2, we see that the major axis is horizontal. Thus, the endpoints of the major axis are and . V212, p 2V1110, 0 2
e � 23 � 1
r �103
1 � 23 cos u
r �10
3 � 2 cos u
r �6
1 � sin u
SECTION 10.6 Polar Equations of Conics 797
57050_10_ch10_p742-819.qxd 08/04/2008 11:48 AM Page 797

798 CHAPTER 10 Analytic Geometry
EXAMPLEIdentify and graph conic section.
is an ellipse.
ALTERNATE EXAMPLE 3A conic is given by the polarequation:
Identify the conic. If the conic isan ellipse or a hyperbola, find thedistances a and b. If the conic is aparabola, find the focus and theequation of the directrix.
ANSWERHyperbola, 3, 5.20
r =36
4 + 8 sin u
=1
1 +1
2 cos au -
p
6b
r =6
6 + 3 cos au -p
6b
The distance between the vertices V1 and V2 is 12; thus, the length of the ma-jor axis is 2a � 12, and so a � 6. To determine the length of the minor axis, weneed to find b. From page 796 we have , so
Thus, , and the length of the minor axis is. ■
Example 3 Identifying and Sketching a Conic
A conic is given by the polar equation
(a) Show that the conic is a hyperbola and sketch the graph.
(b) Find the center of the hyperbola and sketch the asymptotes.
Solution
(a) Dividing the numerator and denominator by 2, we have
Since e � 2 � 1, the equation represents a hyperbola. For a rough graph weplot the points for which u � 0, p/2, p, 3p/2 (see Figure 4).
(b) Comparing the equation to those in Figure 2, we see that the transverse axis isvertical. Thus, the endpoints of the transverse axis (the vertices of the hyper-bola) are and . So the center of the hyperbola is , the midpoint of V1V2.
To sketch the asymptotes, we need to find a and b. The distance between V1
and V2 is 4; thus, the length of the transverse axis is 2a � 4, and so a � 2. Tofind b, we first find c. From page 796 we have c � ae � 2 �2 � 4, so
b2 � c2 � a2 � 42 � 22 � 12
C14, p/2 2V21�6, 3p/2 2 � V216, p/2 2V112, p/2 2
r �6
1 � 2 sin u
r �12
2 � 4 sin u
2b � 4 15 � 8.94b � 120 � 2 15 � 4.47
b2 � a2 � c2 � 62 � 42 � 20
c � ae � 6A23B � 4
798 CHAPTER 10 Analytic Geometry
u r
0 10
p/2p 2
3p/2 103
103
00V⁄VV (10, 0)
VV¤¤VVVV ππ))
focusfocus
2œ∑œœ Å4.47
!! 101033
!! 101033
π4
3π4
5π4
7π4
Figure 3
r �10
3 � 2 cos u
u r
0 6p/2 2p 6
3p/2 �6
(6, 0)focus
0(6, π)
V¤ !_6, @3π2
V⁄ !2, @π2
π6
5π6
5π4
7π4
Figure 4
r �12
2 � 4 sin u
So the center of the ellipse is at , the midpoint of V1V2.C14, 0 2
_2
_1
1
2
_2 _1 1 x
y
0
57050_10_ch10_p742-819.qxd 4/10/08 11:10 PM Page 798

CHAPTER 10 Analytic Geometry 799
ALTERNATE EXAMPLE 4Suppose the ellipse
is rotated
through the angle about the
origin. Find a polar equation forthe resulting ellipse.
ANSWER
IN-CLASS MATERIALS
It is good to go through an exam-ple like Example 4 with the class,having them use their calculatorsto vary the eccentricity e of agiven conic section, and see howit affects the graph. Most graphiccalculators have a mode for graph-ing polar functions as well.
r =8
4 - 3 cos au - p
4b
p
4
r =8
4 - 3 cos u
IN-CLASS MATERIALS
We have called a circle a “degenerate ellipse.” The text notes that when e is close to zero, the resultantellipse is close to circular. Examine the equation of a conic when e = 0 to see how it is undefined forthat value of e.
Thus, . Knowing a and b allows us to sketch the cen-tral box, from which we obtain the asymptotes shown in Figure 4. ■
When we rotate conic sections, it is much more convenient to use polar equationsthan Cartesian equations. We use the fact that the graph of is the graphof rotated counterclockwise about the origin through an angle a (see Exercise 55 in Section 8.2).
Example 4 Rotating an Ellipse
Suppose the ellipse of Example 2 is rotated through an angle p/4 about the origin.Find a polar equation for the resulting ellipse, and draw its graph.
Solution We get the equation of the rotated ellipse by replacing u with u � p/4in the equation given in Example 2. So the new equation is
We use this equation to graph the rotated ellipse in Figure 5. Notice that the ellipsehas been rotated about the focus at the origin. ■
In Figure 6 we use a computer to sketch a number of conics to demonstrate the ef-fect of varying the eccentricity e. Notice that when e is close to 0, the ellipse is nearlycircular and becomes more elongated as e increases. When e � 1, of course, the conicis a parabola. As e increases beyond 1, the conic is an ever steeper hyperbola.
Figure 6
10.6 Exercises
e=0.86e=0.5 e=1 e=1.4 e=4
r �10
3 � 2 cos1u � p/4 2
r � f1u 2 r � f1u � a 2b � 112 � 2 13 � 3.46
SECTION 10.6 Polar Equations of Conics 799
11
_6
_5 15
r= 103-2 ç(¨ _ π/4)
r= 103-2 ç ¨
Figure 5
1–8 ■ Write a polar equation of a conic that has its focus at theorigin and satisfies the given conditions.
1. Ellipse, eccentricity , directrix x � 3
2. Hyperbola, eccentricity , directrix x � �3
3. Parabola, directrix y � 2
43
23
4. Ellipse, eccentricity , directrix y � �4
5. Hyperbola, eccentricity 4, directrix r � 5 sec u
6. Ellipse, eccentricity 0.6, directrix r � 2 csc u
7. Parabola, vertex at
8. Ellipse, eccentricity 0.4, vertex at 12, 0 215, p/2 212
57050_10_ch10_p742-819.qxd 08/04/2008 11:48 AM Page 799

800 CHAPTER 10 Analytic Geometry
800 CHAPTER 10 Analytic Geometry
9–14 ■ Match the polar equations with the graphs labeled I–VI. Give reasons for your answer.
9. 10. r �2
2 � cos ur �
6
1 � cos u
11. 12.
13. 14. r �12
2 � 3 cos ur �
12
3 � 2 sin u
r �5
3 � 3 sin ur �
3
1 � 2 sin u
π2
3π2
π1
I
IV
II
V
III
VI
1
π2
3π2
π
π2
3π2
π1
π2
3π2
π5 10
π2
π
3π2
7 15
π2
3π2
π1
rr
r r
r
r
15–22 ■ (a) Find the eccentricity and identify the conic. (b) Sketch the conic and label the vertices.
15. 16.
17. 18.
19. 20.
21. 22.
23. (a) Find the eccentricity and directrix of the conicand graph the conic and its
directrix.
(b) If this conic is rotated about the origin through an anglep/3, write the resulting equation and draw its graph.
r � 1/ 14 � 3 cos u 2r �
8
3 � cos ur �
7
2 � 5 sin u
r �5
2 � 3 sin ur �
6
2 � sin u
r �10
3 � 2 sin ur �
2
1 � cos u
r �8
3 � 3 cos ur �
4
1 � 3 cos u
24. Graph the parabola and its directrix.Also graph the curve obtained by rotating this parabolaabout its focus through an angle p/6.
25. Graph the conics with e � 0.4, 0.6, 0.8,and 1.0 on a common screen. How does the value of e affectthe shape of the curve?
26. (a) Graph the conics
for e � 1 and various values of d. How does the valueof d affect the shape of the conic?
(b) Graph these conics for d � 1 and various values of e.How does the value of e affect the shape of the conic?
r �ed11 � e sin u 2
r � e/ 11 � e cos u 2r � 5/ 12 � 2 sin u 2
57050_10_ch10_p742-819.qxd 08/04/2008 11:48 AM Page 800

CHAPTER 10 Analytic Geometry 801
SUGGESTED TIME
AND EMPHASIS
1 class. Recommended material.
POINTS TO STRESS
1. Definition of parametricequations.
2. Sketching parametric curves.3. Eliminating the parameter.4. Polar equations in parametric
form.
SAMPLE QUESTION
Text Question
What is the difference between a function and a parametric curve?
Answer
Many answers are possible. The graph of a function can be made into a parametric curve, but notnecessarily the other way around. A function has to pass the vertical line test and a parametric curvedoes not.
SECTION 10.7 Plane Curves and Parametric Equations 801
Applications
27. Orbit of the Earth The polar equation of an ellipse canbe expressed in terms of its eccentricity e and the length aof its major axis.
(a) Show that the polar equation of an ellipse with directrixx � �d can be written in the form
[Hint: Use the relation given in theproof on page 795.]
(b) Find an approximate polar equation for the elliptical orbit of the earth around the sun (at one focus) giventhat the eccentricity is about 0.017 and the length of themajor axis is about 2.99 108 km.
28. Perihelion and Aphelion The planets move around thesun in elliptical orbits with the sun at one focus. The posi-tions of a planet that are closest to, and farthest from, thesun are called its perihelion and aphelion, respectively.
aphelionperihelionsun
planet
¨
r
a2 � e2d 2/ 11 � e2 2 2r �a11 � e2 2
1 � e cos u
(a) Use Exercise 27(a) to show that the perihelion distancefrom a planet to the sun is and the apheliondistance is .
(b) Use the data of Exercise 27(b) to find the distancesfrom the earth to the sun at perihelion and at aphelion.
29. Orbit of Pluto The distance from the planet Pluto to thesun is 4.43 109 km at perihelion and 7.37 109 km ataphelion. Use Exercise 28 to find the eccentricity of Pluto’s orbit.
Discovery • Discussion
30. Distance to a Focus When we found polar equations forthe conics, we placed one focus at the pole. It’s easy to findthe distance from that focus to any point on the conic. Explain how the polar equation gives us this distance.
31. Polar Equations of Orbits When a satellite orbits theearth, its path is an ellipse with one focus at the center of theearth. Why do scientists use polar (rather than rectangular)coordinates to track the position of satellites? [Hint: Youranswer to Exercise 30 is relevant here.]
a11 � e 2 a11 � e 2
10.7 Plane Curves and Parametric Equations
So far we’ve described a curve by giving an equation (in rectangular or polar coordi-nates) that the coordinates of all the points on the curve must satisfy. But not allcurves in the plane can be described in this way. In this section we study parametricequations, which are a general method for describing any curve.
Plane Curves
We can think of a curve as the path of a point moving in the plane; the x- and y-coordinates of the point are then functions of time. This idea leads to the followingdefinition.
Plane Curves and Parametric Equations
If f and g are functions defined on an interval I, then the set of pointsis a plane curve. The equations
where t � I, are parametric equations for the curve, with parameter t.
x � f 1t 2 y � g1t 21f 1t 2 , g1t 22
57050_10_ch10_p742-819.qxd 08/04/2008 11:48 AM Page 801
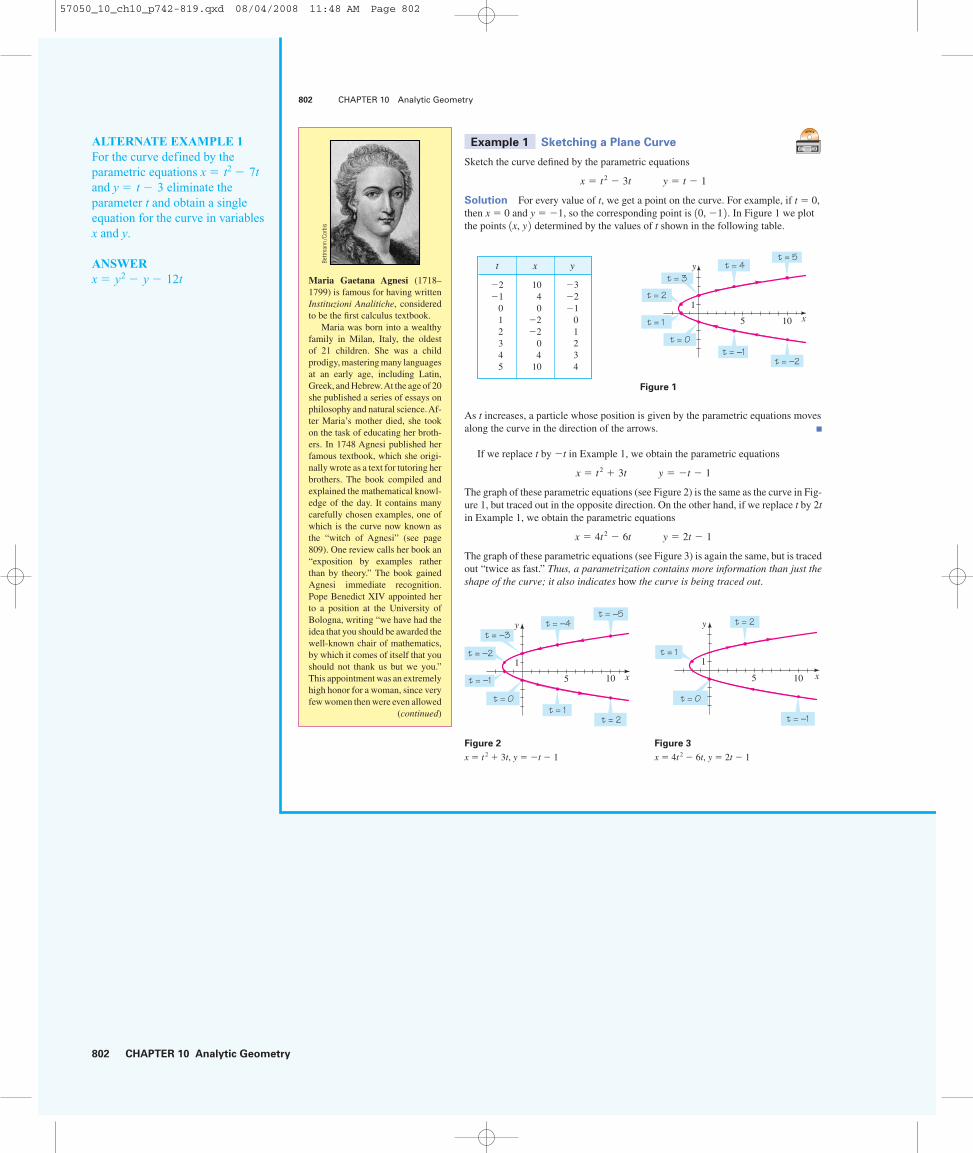
802 CHAPTER 10 Analytic Geometry
ALTERNATE EXAMPLE 1For the curve defined by theparametric equations x = t2 - 7tand y = t - 3 eliminate theparameter t and obtain a singleequation for the curve in variablesx and y.
ANSWERx = y2 - y - 12t
Example 1 Sketching a Plane Curve
Sketch the curve defined by the parametric equations
Solution For every value of t, we get a point on the curve. For example, if t � 0,then x � 0 and y � �1, so the corresponding point is . In Figure 1 we plotthe points determined by the values of t shown in the following table.
Figure 1
As t increases, a particle whose position is given by the parametric equations movesalong the curve in the direction of the arrows. ■
If we replace t by �t in Example 1, we obtain the parametric equations
The graph of these parametric equations (see Figure 2) is the same as the curve in Fig-ure 1, but traced out in the opposite direction. On the other hand, if we replace t by 2tin Example 1, we obtain the parametric equations
The graph of these parametric equations (see Figure 3) is again the same, but is tracedout “twice as fast.” Thus, a parametrization contains more information than just theshape of the curve; it also indicates how the curve is being traced out.
Figure 2 Figure 3
x � t 2 � 3t, y � �t � 1 x � 4t 2 � 6t, y � 2t � 1
t = −1
t = 0
t = 2
t = 1
y
x1
5 10
t = 2
t = −5
t = 1t = 0
t = −4t = −3
t = −2
t = −1
y
x1
5 10
x � 4t2 � 6t y � 2t � 1
x � t2 � 3t y � �t � 1
y
x1
5 10
t = −2
t = 5
t = −1
t = 4t = 3
t = 2
t = 1
t = 0
1x, y 2 10, �1 2x � t2 � 3t y � t � 1
802 CHAPTER 10 Analytic Geometry
t x y
�2 10 �3�1 4 �2
0 0 �11 �2 02 �2 13 0 24 4 35 10 4
Maria Gaetana Agnesi (1718–1799) is famous for having writtenInstituzioni Analitiche, consideredto be the first calculus textbook.
Maria was born into a wealthyfamily in Milan, Italy, the oldestof 21 children. She was a childprodigy, mastering many languagesat an early age, including Latin,Greek, and Hebrew.At the age of 20she published a series of essays onphilosophy and natural science.Af-ter Maria’s mother died, she tookon the task of educating her broth-ers. In 1748 Agnesi published herfamous textbook, which she origi-nally wrote as a text for tutoring herbrothers. The book compiled andexplained the mathematical knowl-edge of the day. It contains manycarefully chosen examples, one ofwhich is the curve now known asthe “witch of Agnesi” (see page809). One review calls her book an“exposition by examples ratherthan by theory.” The book gainedAgnesi immediate recognition.Pope Benedict XIV appointed herto a position at the University ofBologna, writing “we have had theidea that you should be awarded thewell-known chair of mathematics,by which it comes of itself that youshould not thank us but we you.”This appointment was an extremelyhigh honor for a woman, since veryfew women then were even allowed
(continued)
Bettm
ann/
Corb
is
57050_10_ch10_p742-819.qxd 08/04/2008 11:48 AM Page 802

CHAPTER 10 Analytic Geometry 803
DRILL QUESTION
Sketch the parametric curvex(t) = sin t y(t) = t2,
Is the point on this curve?
Answer
is not on the curve.
ALTERNATE EXAMPLE 3Eliminate the parameter t toobtain a single equation for thecurve x = 5 cos t, y = 5 sin t inthe variables x and y.
ANSWER
ALTERNATE EXAMPLE 4For the graph of a curve definedby the parametric equations x = sin t and y = 7 - cos 2t finda single equation and its domain.
ANSWER y = 6 + x2, x H 3 -1, 14
x2 + y2 = 25
a1, p
4b
a1, p
4b
0 … t … p.
IN-CLASS MATERIALS
Give an example of a curve such as x(t) = cos (et), y(t) = sin . This curve essentially fills the squarein that the curve gets arbitrarily close to any point in the square. (It is not what
mathematicians call a “space filling curve” because it does not actually hit every point in the square.) Itcan be simulated using a graphing calculator with the approximations and . Therange should be sufficient to convey this property to the students. Next, describe the familyof functions x(t) = a cos (et), y(t) = b sin If the students are following well, perhaps consider thefamily x(t) = cos (at), y(t) = sin . The students might be tempted to conclude that all these curvesbehave the same way, but they do not for some values of a, such as .a = 213
(13t)(13t).
0 … t … 20023 L 1.7321e L 2.7183
-1 … x … 1, -1 … y … 1(13t)
Eliminating the Parameter
Often a curve given by parametric equations can also be represented by a single rect-angular equation in x and y. The process of finding this equation is called eliminatingthe parameter. One way to do this is to solve for t in one equation, then substitute intothe other.
Example 2 Eliminating the Parameter
Eliminate the parameter in the parametric equations of Example 1.
Solution First we solve for t in the simpler equation, then we substitute into theother equation. From the equation y � t � 1, we get t � y � 1. Substituting intothe equation for x, we get
Thus, the curve in Example 1 has the rectangular equation x � y 2 � y � 2, so it is aparabola. ■
Eliminating the parameter often helps us identify the shape of a curve, as we seein the next two examples.
Example 3 Eliminating the Parameter
Describe and graph the curve represented by the parametric equations
Solution To identify the curve, we eliminate the parameter. Since cos2 t � sin2 t � 1 and since x � cos t and y � sin t for every point on the curve, we have
This means that all points on the curve satisfy the equation x 2 � y 2 � 1, so thegraph is a circle of radius 1 centered at the origin. As t increases from 0 to 2p, thepoint given by the parametric equations starts at and moves counterclockwiseonce around the circle, as shown in Figure 4. Notice that the parameter t can be interpreted as the angle shown in the figure. ■
Example 4 Sketching a Parametric Curve
Eliminate the parameter and sketch the graph of the parametric equations
Solution To eliminate the parameter, we first use the trigonometric identity cos2 t � 1 � sin2 t to change the second equation:
Now we can substitute sin t � x from the first equation to get
y � 1 � x2
y � 2 � cos2t � 2 � 11 � sin2t 2 � 1 � sin2t
x � sin t y � 2 � cos2t
11, 0 2x2 � y2 � 1cos t 2 2 � 1sin t 2 2 � 1
1x, y 2x � cos t y � sin t 0 � t � 2p
x � t2 � 3t � 1y � 1 2 2 � 31y � 1 2 � y2 � y � 2
SECTION 10.7 Plane Curves and Parametric Equations 803
3π2t=
π2t=
0 xt
t=0
(1, 0)
(ç t, ß t)
t=2π
t=π
y
Figure 4
to attend university. Just two yearslater, Agnesi’s father died and sheleft mathematics completely. Shebecame a nun and devoted the restof her life and her wealth to caringfor sick and dying women, herselfdying in poverty at a poorhouse ofwhich she had once been director.
0
2
4
68
10
0.2 0.4 0.6 0.8 1 x
y
57050_10_ch10_p742-819.qxd 08/04/2008 11:48 AM Page 803
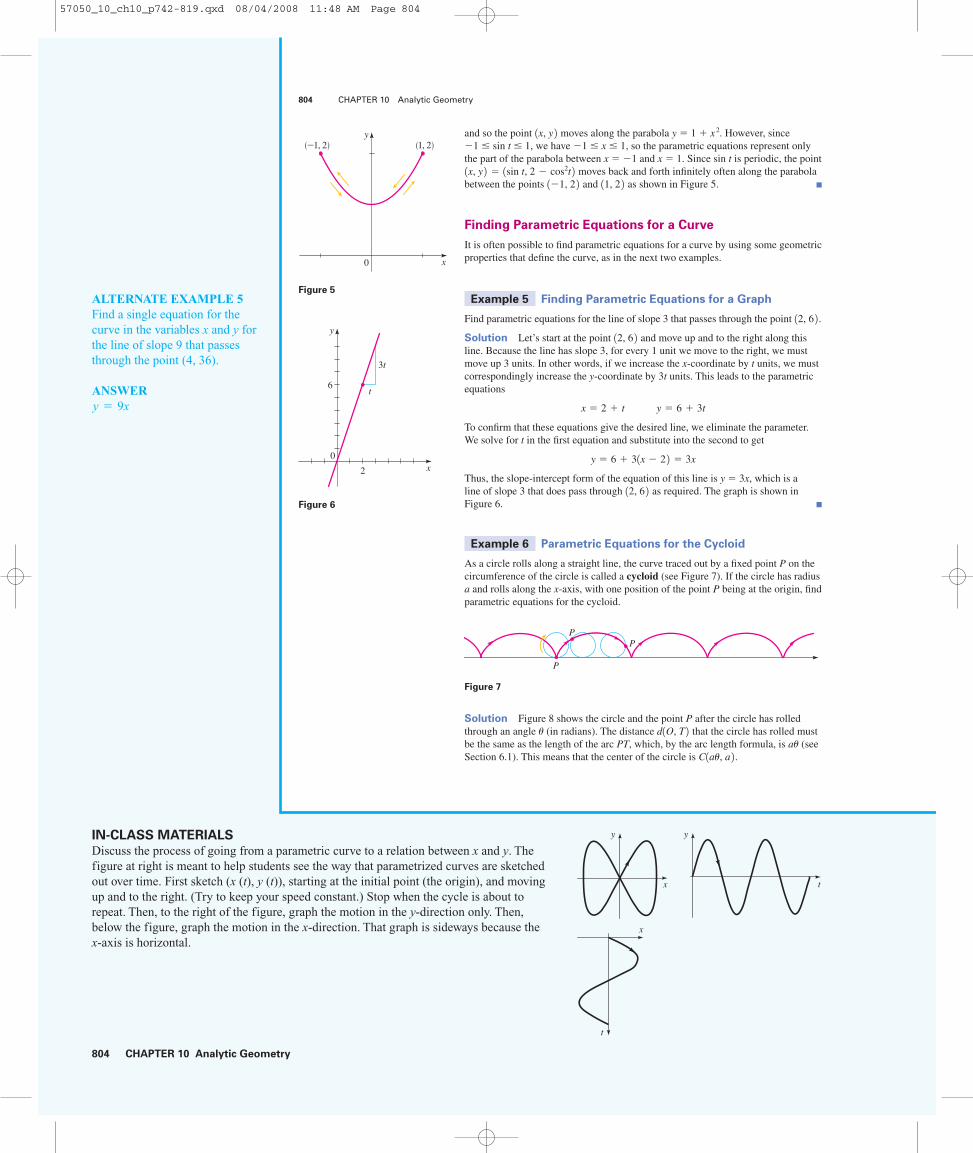
804 CHAPTER 10 Analytic Geometry
ALTERNATE EXAMPLE 5Find a single equation for thecurve in the variables x and y forthe line of slope 9 that passesthrough the point (4, 36).
ANSWERy = 9x
IN-CLASS MATERIALS
Discuss the process of going from a parametric curve to a relation between x and y. Thefigure at right is meant to help students see the way that parametrized curves are sketchedout over time. First sketch (x (t), y (t)), starting at the initial point (the origin), and movingup and to the right. (Try to keep your speed constant.) Stop when the cycle is about torepeat. Then, to the right of the figure, graph the motion in the y-direction only. Then,below the figure, graph the motion in the x-direction. That graph is sideways because the x-axis is horizontal.
and so the point moves along the parabola y � 1 � x 2. However, since �1 � sin t � 1, we have �1 � x � 1, so the parametric equations represent onlythe part of the parabola between x � �1 and x � 1. Since sin t is periodic, the point
moves back and forth infinitely often along the parabolabetween the points and as shown in Figure 5. ■
Finding Parametric Equations for a Curve
It is often possible to find parametric equations for a curve by using some geometricproperties that define the curve, as in the next two examples.
Example 5 Finding Parametric Equations for a Graph
Find parametric equations for the line of slope 3 that passes through the point .
Solution Let’s start at the point and move up and to the right along thisline. Because the line has slope 3, for every 1 unit we move to the right, we mustmove up 3 units. In other words, if we increase the x-coordinate by t units, we mustcorrespondingly increase the y-coordinate by 3t units. This leads to the parametricequations
To confirm that these equations give the desired line, we eliminate the parameter.We solve for t in the first equation and substitute into the second to get
Thus, the slope-intercept form of the equation of this line is y � 3x, which is a line of slope 3 that does pass through as required. The graph is shown in Figure 6. ■
Example 6 Parametric Equations for the Cycloid
As a circle rolls along a straight line, the curve traced out by a fixed point P on thecircumference of the circle is called a cycloid (see Figure 7). If the circle has radiusa and rolls along the x-axis, with one position of the point P being at the origin, findparametric equations for the cycloid.
Figure 7
Solution Figure 8 shows the circle and the point P after the circle has rolledthrough an angle u (in radians). The distance that the circle has rolled mustbe the same as the length of the arc PT, which, by the arc length formula, is au (seeSection 6.1). This means that the center of the circle is .C1au, a 2d1O, T 2
P
P
P
12, 6 2y � 6 � 31x � 2 2 � 3x
x � 2 � t y � 6 � 3t
12, 6 2 12, 6 2
11, 2 21�1, 2 21x, y 2 � 1sin t, 2 � cos2t 21x, y 2
804 CHAPTER 10 Analytic Geometry
y
x0
6 t
3t
2
Figure 6
x0
y(1, 2)(_1, 2)
Figure 5
y
x t
y
x
t
57050_10_ch10_p742-819.qxd 08/04/2008 11:48 AM Page 804

CHAPTER 10 Analytic Geometry 805
EXAMPLEConstruction of an ellipse withcenter (-1, -2) and axis lengths 2 and 3: We start with the circle x = cos u, y = sin u. We stretch itinto shape: x = 2 cos u, y = 3 sin u.Then we move it into position: x = 2cos u - 1, y = 3 sin u - 2.
ALTERNATE EXAMPLE 7Use a graphing device to drawthe following parametric curves.Compare the two curves.
(a)
(b)
ANSWERS
The first curve is a circle. Thesecond one stretches the x- and y-coordinates by different factors,resulting in an ellipse.
y = 4 sin t x = 2 cos t
y = sin t x = cos t
IN-CLASS MATERIALS
Show how reversing the functions x(t) and y(t) yields the inverse of a given relation. For example,
is the sine function, so is the general arcsine function. Display an inverse
for f (x) = x3 + x + 2 graphically using parametric equations. Explain the difficulties with the algebraicapproach.
e x(t) = sin t
y(t) = te x(t) = t
y(t) = sin t
1
10
-1
-1
4
20
-4
-2
Let the coordinates of P be . Then from Figure 8 (which illustrates the case0 � u � p/2), we see that
so parametric equations for the cycloid are
■
The cycloid has a number of interesting physical properties. It is the “curve ofquickest descent” in the following sense. Let’s choose two points P and Q that are notdirectly above each other, and join them with a wire. Suppose we allow a bead to slidedown the wire under the influence of gravity (ignoring friction). Of all possibleshapes that the wire can be bent into, the bead will slide from P to Q the fastest whenthe shape is half of an arch of an inverted cycloid (see Figure 9). The cycloid is alsothe “curve of equal descent” in the sense that no matter where we place a bead B ona cycloid-shaped wire, it takes the same time to slide to the bottom (see Figure 10).These rather surprising properties of the cycloid were proved (using calculus) in the17th century by several mathematicians and physicists, including Johann Bernoulli,Blaise Pascal, and Christiaan Huygens.
Figure 9 Figure 10
Using Graphing Devices to Graph Parametric Curves
Most graphing calculators and computer graphing programs can be used to graphparametric equations. Such devices are particularly useful when sketching compli-cated curves like the one shown in Figure 11.
Example 7 Graphing Parametric Curves
Use a graphing device to draw the following parametric curves. Discuss their simi-larities and differences.
(a) x � sin 2t (b) x � sin 3ty � 2 cos t y � 2 cos t
Solution In both parts (a) and (b), the graph will lie inside the rectangle given by �1 � x � 1, �2 � y � 2, since both the sine and the cosine of any number willbe between �1 and 1. Thus, we may use the viewing rectangle by
.3�2.5, 2.5 4 3�1.5, 1.5 4
B
B
B
P
Qcycloid
x � a1u � sin u 2 y � a11 � cos u 2 y � d1T, C 2 � d1Q, C 2 � a � a cos u � a11 � cos u 2 x � d1O, T 2 � d1P, Q 2 � au � a sin u � a1u � sin u 2
1x, y 2SECTION 10.7 Plane Curves and Parametric Equations 805
8
_8
_6.5 6.5
Figure 11
x � t � 2 sin 2t, y � t � 2 cos 5t
P
x0
y
T
C (a¨, a)a ¨
xy
a¨
Q
Figure 8
57050_10_ch10_p742-819.qxd 08/04/2008 11:48 AM Page 805

806 CHAPTER 10 Analytic Geometry
ALTERNATE EXAMPLE 8aExpress the equation in parametricform:
ANSWER
y = 3 ln (t) # sin (t)
x = 3 ln (t) # cos (t),
r = 3 ln u
IN-CLASS MATERIALS
Have the students get into groups, and have each group try to come up with the most interesting looking parametric curve. After displaying theirbest ones, perhaps show them the following examples:
(a) Since 2 cos t is periodic with period 2p (see Section 5.3), and since sin 2t hasperiod p, letting t vary over the interval 0 � t � 2p gives us the completegraph, which is shown in Figure 12(a).
(b) Again, letting t take on values between 0 and 2p gives the complete graphshown in Figure 12(b).
Both graphs are closed curves, which means they form loops with the samestarting and ending point; also, both graphs cross over themselves. However, thegraph in Figure 12(a) has two loops, like a figure eight, whereas the graph inFigure 12(b) has three loops. ■
The curves graphed in Example 7 are called Lissajous figures. A Lissajous figureis the graph of a pair of parametric equations of the form
where A, B, v1, and v2 are real constants. Since sin v1t and cos v2t are both between�1 and 1, a Lissajous figure will lie inside the rectangle determined by �A � x � A,�B � y � B. This fact can be used to choose a viewing rectangle when graphing aLissajous figure, as in Example 7.
Recall from Section 8.1 that rectangular coordinates and polar coordinatesare related by the equations x � r cos u, y � r sin u. Thus, we can graph the
polar equation by changing it to parametric form as follows:
Since
Replacing u by the standard parametric variable t, we have the following result.
y � r sin u � f 1u 2 sin u
r � f 1u 2 x � r cos u � f 1u 2 cos u
r � f1u 21r, u 2 1x, y 2
x � A sin v1t y � B cos v2t
806 CHAPTER 10 Analytic Geometry
(a) x=ß 2t, y=2 ç t
2.5
_2.5
_1.5 1.5
(b) x=ß 3t, y=2 ç t
2.5
_2.5
_1.5 1.5
Figure 12
Polar Equations in Parametric Form
The graph of the polar equation is the same as the graph of the parametric equations
x � f 1t 2 cos t y � f 1t 2 sin t
r � f 1u 2
Example 8 Parametric Form of a Polar Equation
Consider the polar equation r � u, 1 � u � 10p.
(a) Express the equation in parametric form.
(b) Draw a graph of the parametric equations from part (a).
Solution
(a) The given polar equation is equivalent to the parametric equations
(b) Since 10p� 31.42, we use the viewing rectangle by ,and we let t vary from 1 to 10p. The resulting graph shown in Figure 13 is a spiral. ■
3�32, 32 43�32, 32 4x � t cos t y � t sin t
32
_32
_32 32
Figure 13
x � t cos t, y � t sin t
57050_10_ch10_p742-819.qxd 08/04/2008 11:48 AM Page 806

CHAPTER 10 Analytic Geometry 807
SECTION 10.7 Plane Curves and Parametric Equations 807
1–22 ■ A pair of parametric equations is given.
(a) Sketch the curve represented by the parametric equations.
(b) Find a rectangular-coordinate equation for the curve byeliminating the parameter.
1. x � 2t, y � t � 6
2. x � 6t � 4, y � 3t, t � 0
3. x � t 2, y � t � 2, 2 � t � 4
4. x � 2t � 1,
5. , y � 1 � t
6. x � t 2, y � t 4 � 1
7.
8.
9. x � 4t 2, y � 8t 3
10.
11. x � 2 sin t, y � 2 cos t, 0 � t � p
12. x � 2 cos t, y � 3 sin t, 0 � t � 2p
13. x � sin2 t, y � sin4 t 14. x � sin2 t, y � cos t
15. x � cos t, y � cos 2t
16. x � cos 2t, y � sin 2t
17 x � sec t, y � tan t, 0 � t � p/2
18 x � cot t, y � csc t, 0 � t � p
19 x � tan t, y � cot t, 0 � t � p/2
20. x � sec t, y � tan2t, 0 � t � p/2
21. x � cos2t, y � sin2t
22. x � cos3t, y � sin3t, 0 � t � 2p
23–26 ■ Find parametric equations for the line with the givenproperties.
23. Slope , passing through
24. Slope �2, passing through
25. Passing through and
26. Passing through and the origin
27. Find parametric equations for the circle x 2 � y 2 � a 2.
28. Find parametric equations for the ellipse
x2
a2 �y2
b2 � 1
112, 7 2 17, 8 216, 7 2 1�10, �20 214, �1 212
x � 0 t 0 , y � 0 1 � 0 t 0 0x � t � 1, y �
t
t � 1
x �1
t, y � t � 1
x � 1t
y � At � 12B2
29. Show by eliminating the parameter u that the followingparametric equations represent a hyperbola:
30. Show that the following parametric equations represent apart of the hyperbola of Exercise 29:
31–34 ■ Sketch the curve given by the parametric equations.
31. x � t cos t, y � t sin t, t � 0
32. x � sin t, y � sin 2t
33.
34. x � cot t, y � 2 sin2 t, 0 � t � p
35. If a projectile is fired with an initial speed of √0 ft/s at an angle a above the horizontal, then its position after t seconds is given by the parametric equations
(where x and y are measured in feet). Show that the path ofthe projectile is a parabola by eliminating the parameter t.
36. Referring to Exercise 35, suppose a gun fires a bullet intothe air with an initial speed of 2048 ft/s at an angle of 30� tothe horizontal.
(a) After how many seconds will the bullet hit the ground?
(b) How far from the gun will the bullet hit the ground?
(c) What is the maximum height attained by the bullet?
37–42 ■ Use a graphing device to draw the curve representedby the parametric equations.
37. x � sin t, y � 2 cos 3t
38. x � 2 sin t, y � cos 4t
39. x � 3 sin 5t, y � 5 cos 3t
40. x � sin 4t, y � cos 3t
41.
42. x � 2 cos t � cos 2t, y � 2 sin t � sin 2t
43–46 ■ A polar equation is given.
(a) Express the polar equation in parametric form.
(b) Use a graphing device to graph the parametric equationsyou found in part (a).
43. r � 2u/12, 0 � u � 4p 44. r � sin u � 2 cos u
45. 46. r � 2sin ur �4
2 � cos u
x � sin1cos t 2 , y � cos1t3/2 2 , 0 � t � 2p
x � 1√0 cos a 2 t y � 1√0 sin a 2 t � 16t2
x �3t
1 � t3 , y �3t2
1 � t3
x � a1t y � b2t � 1
x � a tan u y � b sec u
10.7 Exercises
57050_10_ch10_p742-819.qxd 08/04/2008 11:48 AM Page 807

808 CHAPTER 10 Analytic Geometry
808 CHAPTER 10 Analytic Geometry
47–50 ■ Match the parametric equations with the graphs labeled I–IV. Give reasons for your answers.
47. x � t 3 � 2t, y � t 2 � t
48. x � sin 3t, y � sin 4t
49. x � t � sin 2t, y � t � sin 3t
50.
51. (a) In Example 6 suppose the point P that traces out thecurve lies not on the edge of the circle, but rather at afixed point inside the rim, at a distance b from the center(with b � a). The curve traced out by P is called a cur-tate cycloid (or trochoid). Show that parametric equa-tions for the curtate cycloid are
(b) Sketch the graph using a � 3 and b � 2.
52. (a) In Exercise 51 if the point P lies outside the circle at a distance b from the center (with b � a), then thecurve traced out by P is called a prolate cycloid. Show that parametric equations for the prolate cycloid are the same as the equations for the curtate cycloid.
(b) Sketch the graph for the case where a � 1 and b � 2.
53. A circle C of radius b rolls on the inside of a larger circle ofradius a centered at the origin. Let P be a fixed point on thesmaller circle, with initial position at the point as1a, 0 2
x � au � b sin u y � a � b cos u
0 x
y
0 x
yI II
0 x
y
0 x
yIII IV
x � sin1t � sin t 2 , y � cos1t � cos t 2
shown in the figure. The curve traced out by P is called ahypocycloid.
(a) Show that parametric equations for the hypocycloid are
(b) If a � 4b, the hypocycloid is called an astroid. Showthat in this case the parametric equations can be reduced to
Sketch the curve. Eliminate the parameter to obtain anequation for the astroid in rectangular coordinates.
54. If the circle C of Exercise 53 rolls on the outside of thelarger circle, the curve traced out by P is called an epicycloid. Find parametric equations for the epicycloid.
55. In the figure, the circle of radius a is stationary and, forevery u, the point P is the midpoint of the segment QR. Thecurve traced out by P for 0 � u � p is called the longbowcurve. Find parametric equations for this curve.
P
Q
¨x0
y
a
2a Ry=2a
x � a cos3u y � a sin3u
y � 1a � b 2 sin u � b sin a a � b
b u b
x � 1a � b 2 cos u � b cos a a � b
b u b
b
C
P (a, 0)¨x0
y
57050_10_ch10_p742-819.qxd 08/04/2008 11:48 AM Page 808

CHAPTER 10 Analytic Geometry 809
SECTION 10.7 Plane Curves and Parametric Equations 809
56. Two circles of radius a and b are centered at the origin, asshown in the figure. As the angle u increases, the point Ptraces out a curve that lies between the circles.
(a) Find parametric equations for the curve, using u as theparameter.
(b) Graph the curve using a graphing device, with a � 3and b � 2.
(c) Eliminate the parameter and identify the curve.
57. Two circles of radius a and b are centered at the origin, asshown in the figure.
(a) Find parametric equations for the curve traced out bythe point P, using the angle u as the parameter. (Notethat the line segment AB is always tangent to the largercircle.)
(b) Graph the curve using a graphing device, with a � 3and b � 2.
58. A curve, called a witch of Maria Agnesi, consists of allpoints P determined as shown in the figure.
(a) Show that parametric equations for this curve can bewritten as
x � 2a cot u y � 2a sin2u
¨x0
y
ab P
A
B
¨x0
y
ab P
(b) Graph the curve using a graphing device, with a � 3.
59. Eliminate the parameter u in the parametric equations forthe cycloid (Example 6) to obtain a rectangular coordinateequation for the section of the curve given by 0 � u � p.
Applications
60. The Rotary Engine The Mazda RX-8 uses an unconventional engine (invented by Felix Wankel in 1954)in which the pistons are replaced by a triangular rotor thatturns in a special housing as shown in the figure. The vertices of the rotor maintain contact with the housing at alltimes, while the center of the triangle traces out a circle ofradius r, turning the drive shaft. The shape of the housing isgiven by the parametric equations below (where R is the distance between the vertices and center of the rotor).
(a) Suppose that the drive shaft has radius r � 1. Graph the curve given by the parametric equations for the following values of R: 0.5, 1, 3, 5.
(b) Which of the four values of R given in part (a) seems tobest model the engine housing illustrated in the figure?
x � r cos 3u � R cos u y � r sin 3u � R sin u
¨
x0
y
a
y=2a
PA
C
57050_10_ch10_p742-819.qxd 08/04/2008 11:48 AM Page 809

810 CHAPTER 10 Analytic Geometry
810 CHAPTER 10 Analytic Geometry
61. Spiral Path of a Dog A dog is tied to a circular tree trunk of radius 1 ft by a long leash. He has managed to wrapthe entire leash around the tree while playing in the yard,and finds himself at the point in the figure. Seeing asquirrel, he runs around the tree counterclockwise, keepingthe leash taut while chasing the intruder.
(a) Show that parametric equations for the dog’s path(called an involute of a circle) are
[Hint: Note that the leash is always tangent to the tree,so OT is perpendicular to TD.]
(b) Graph the path of the dog for 0 � u � 4p.
Discovery • Discussion
62. More Information in Parametric Equations In thissection we stated that parametric equations contain more
D
T
O¨
x
y
1
1
1
x � cos u � u sin u y � sin u � u cos u
11, 0 2information than just the shape of a curve. Write a short paragraph explaining this statement. Use the following example and your answers to parts (a) and (b) below in your explanation.
The position of a particle is given by the parametric equations
where t represents time. We know that the shape of the pathof the particle is a circle.
(a) How long does it take the particle to go once around thecircle? Find parametric equations if the particle movestwice as fast around the circle.
(b) Does the particle travel clockwise or counterclockwisearound the circle? Find parametric equations if the particle moves in the opposite direction around thecircle.
63. Different Ways of Tracing Out a Curve The curves C,D, E, and F are defined parametrically as follows, where theparameter t takes on all real values unless otherwise stated:
(a) Show that the points on all four of these curves satisfythe same rectangular coordinate equation.
(b) Draw the graph of each curve and explain how thecurves differ from one another.
F: x � 3t, y � 32t
E: x � sin t, y � sin2 t
D: x � 1t, y � t, t � 0
C: x � t, y � t2
x � sin t y � cos t
10 Review
Concept Check
1. (a) Give the geometric definition of a parabola. What arethe focus and directrix of the parabola?
(b) Sketch the parabola x2 � 4py for the case p � 0. Iden-tify on your diagram the vertex, focus, and directrix.What happens if p � 0?
(c) Sketch the parabola y2 � 4px, together with its vertex,focus, and directrix, for the case p � 0. What happens ifp � 0?
2. (a) Give the geometric definition of an ellipse. What are thefoci of the ellipse?
(b) For the ellipse with equation
where a � b � 0, what are the coordinates of the ver-tices and the foci? What are the major and minor axes?Illustrate with a graph.
(c) Give an expression for the eccentricity of the ellipse inpart (b).
(d) State the equation of an ellipse with foci on the y-axis.
x2
a2 �y2
b2 � 1
57050_10_ch10_p742-819.qxd 08/04/2008 11:49 AM Page 810

CHAPTER 10 Analytic Geometry 811
CHAPTER 10 Review 811
3. (a) Give the geometric definition of a hyperbola. What arethe foci of the hyperbola?
(b) For the hyperbola with equation
what are the coordinates of the vertices and foci? What are the equations of the asymptotes? What is thetransverse axis? Illustrate with a graph.
(c) State the equation of a hyperbola with foci on the y-axis.
(d) What steps would you take to sketch a hyperbola with agiven equation?
4. Suppose h and k are positive numbers. What is the effect onthe graph of an equation in x and y if
(a) x is replaced by x � h? By x � h?
(b) y is replaced by y � k? By y � k?
5. How can you tell whether the following nondegenerateconic is a parabola, an ellipse, or a hyperbola?
Ax2 � Cy2 � Dx � Ey � F � 0
x2
a2 �y2
b2 � 1
6. Suppose the x- and y-axes are rotated through an acute anglef to produce the X- and Y-axes. Write equations that relatethe coordinates and of a point in the xy-planeand XY-plane, respectively.
7. (a) How do you eliminate the xy-term in this equation?
(b) What is the discriminant of the conic in part (a)? How can you use the discriminant to determine whether the conic is a parabola, an ellipse, or a hyperbola?
8. (a) Write polar equations that represent a conic with eccentricity e.
(b) For what values of e is the conic an ellipse? A hyperbola? A parabola?
9. A curve is given by the parametric equations.
(a) How do you sketch the curve?
(b) How do you eliminate the parameter?
x � f 1t 2 , y � g1t 2
Ax2 � Bxy � Cy2 � Dx � Ey � F � 0
1X, Y 21x, y 2
Exercises
1–8 ■ Find the vertex, focus, and directrix of the parabola, andsketch the graph.
1. y 2 � 4x 2.
3. x 2 � 8y � 0 4. 2x � y 2 � 0
5. x � y 2 � 4y � 2 � 0 6. 2x 2 � 6x � 5y � 10 � 0
7. 8.
9–16 ■ Find the center, vertices, foci, and the lengths of themajor and minor axes of the ellipse, and sketch the graph.
9. 10.
11. x 2 � 4y 2 � 16 12. 9x 2 � 4y 2 � 1
13. 14.
15. 4x 2 � 9y 2 � 36y 16.
17–24 ■ Find the center, vertices, foci, and asymptotes of thehyperbola, and sketch the graph.
17. 18.
19. x 2 � 2y 2 � 16 20. x 2 � 4y 2 � 16 � 0
x2
49�
y2
32� 1�
x2
9�
y2
16� 1
2x2 � y2 � 2 � 41x � y 21x � 2 2 2
25�1y � 3 2 2
16� 1
1x � 3 2 29
�y2
16� 1
x2
49�
y2
9� 1
x2
9�
y2
25� 1
x2 � 31x � y 212 x2 � 2x � 2y � 4
x � 112 y2
21. 22.
23. 9y 2 � 18y � x 2 � 6x � 18 24. y 2 � x 2 � 6y
25–30 ■ Find an equation for the conic whose graph is shown.
25.
26.
0 x
y
5
_12_5
12
0 x
y
2 F(2, 0)
1x � 2 2 28
�1y � 2 2 2
8� 1
1x � 4 2 216
�y2
16� 1
57050_10_ch10_p742-819.qxd 08/04/2008 11:49 AM Page 811

812 CHAPTER 10 Analytic Geometry
812 CHAPTER 10 Analytic Geometry
27.
28.
29.
30.
31–42 ■ Determine the type of curve represented by the equation. Find the foci and vertices (if any), and sketch thegraph.
31.
32.
33. x 2 � y 2 � 144 � 0
x2
12�
y2
144�
y
12
x2
12� y � 1
0 x
y
1
1 2
0 x
y
2
4
0 x
y
V(4, 4)
4
8
0 x
y
F(0, 5)4
_4
34. x 2 � 6x � 9y 2
35.
36.
37. x � y 2 � 16y
38. 2x 2 � 4 � 4x � y 2
39. 2x 2 � 12x � y 2 � 6y � 26 � 0
40. 36x 2 � 4y 2 � 36x � 8y � 31
41. 9x 2 � 8y 2 � 15x � 8y � 27 � 0
42. x 2 � 4y 2 � 4x � 8
43–50 ■ Find an equation for the conic section with the givenproperties.
43. The parabola with focus and directrix y � �1
44. The ellipse with center , foci and ,and major axis of length 10
45. The hyperbola with vertices and asymptotes
46. The hyperbola with center , foci and, and vertices and
47. The ellipse with foci and , and with one vertex on the x-axis
48. The parabola with vertex and directrix the y-axis
49. The ellipse with vertices and , and passing through the point
50. The parabola with vertex and horizontal axis ofsymmetry, and crossing the y-axis at y � 2
51. The path of the earth around the sun is an ellipse with thesun at one focus. The ellipse has major axis 186,000,000 miand eccentricity 0.017. Find the distance between the earthand the sun when the earth is (a) closest to the sun and (b) farthest from the sun.
52. A ship is located 40 mi from a straight shoreline. LORANstations A and B are located on the shoreline, 300 mi apart.From the LORAN signals, the captain determines that hisship is 80 mi closer to A than to B. Find the location of the
186,000,000 mi
V1�1, 0 2P11, 8 2 V217, �8 2V117, 12 2V15, 5 2F211, 3 2F111, 1 2 V212, 2 2V112, 6 2F212, 7 2 F112, 1 2C12, 4 2y � �
12 x
V10, �2 2F210, 8 2F110, 0 2C10, 4 2F10, 1 2
3x2 � 61x � y 2 � 10
4x2 � y2 � 81x � y 2
57050_10_ch10_p742-819.qxd 08/04/2008 11:49 AM Page 812

CHAPTER 10 Analytic Geometry 813
CHAPTER 10 Review 813
ship. (Place A and B on the y-axis with the x-axis halfwaybetween them. Find the x- and y-coordinates of the ship.)
53. (a) Draw graphs of the following family of ellipses for k � 1, 2, 4, and 8.
(b) Prove that all the ellipses in part (a) have the same foci.
54. (a) Draw graphs of the following family of parabolas for, 1, 2, and 4.
(b) Find the foci of the parabolas in part (a).
(c) How does the location of the focus change as k increases?
55–58 ■ An equation of a conic is given.
(a) Use the discriminant to determine whether the graph of theequation is a parabola, an ellipse, or a hyperbola.
(b) Use a rotation of axes to eliminate the xy-term.
(c) Sketch the graph.
55. x 2 � 4xy � y 2 � 1
56. 5x 2 � 6xy � 5y 2 � 8x � 8y � 8 � 0
57.
58. 9x 2 � 24xy � 16y 2 � 25
59–62 ■ Use a graphing device to graph the conic. Identify thetype of conic from the graph.
59. 5x 2 � 3y 2 � 60
60. 9x 2 � 12y 2 � 36 � 0
61. 6x � y 2 � 12y � 30
62. 52x 2 � 72xy � 73y 2 � 100
7x2 � 6 13 xy � 13y2 � 4 13 x � 4y � 0
y � kx2
k � 12
x2
16 � k2 �y2
k2 � 1
300 mi
40 mi
A
B
63–66 ■ A polar equation of a conic is given.
(a) Find the eccentricity and identify the conic.
(b) Sketch the conic and label the vertices.
63.
64.
65.
66.
67–70 ■ A pair of parametric equations is given.
(a) Sketch the curve represented by the parametric equations.
(b) Find a rectangular-coordinate equation for the curve byeliminating the parameter.
67. x � 1 � t 2, y � 1 � t
68. x � t 2 � 1, y � t 2 � 1
69. x � 1 � cos t, y � 1 � sin t, 0 � t � p/2
70.
71–72 ■ Use a graphing device to draw the parametric curve.
71. x � cos 2t, y � sin 3t
72.
73. In the figure the point P is the midpoint of the segment QRand 0 � u � p/2. Using u as the parameter, find a para-metric representation for the curve traced out by P.
P
¨x0
y
1R
Q
1
x � sin1t � cos 2t 2 , y � cos1t � sin 3t 2
x �1
t� 2, y �
2
t2, 0 � t � 2
r �12
1 � 4 cos u
r �4
1 � 2 sin u
r �2
3 � 2 sin u
r �1
1 � cos u
57050_10_ch10_p742-819.qxd 08/04/2008 11:49 AM Page 813

814 CHAPTER 10 Analytic Geometry
10 Test
1. Find the focus and directrix of the parabola x 2 � �12y, and sketch its graph.
2. Find the vertices, foci, and the lengths of the major and minor axes for the ellipse
. Then sketch its graph.
3. Find the vertices, foci, and asymptotes of the hyperbola . Then sketch itsgraph.
4–6 ■ Find an equation for the conic whose graph is shown.
4. 5.
6.
7–9 ■ Sketch the graph of the equation.
7. 16x 2 � 36y 2 � 96x � 36y � 9 � 0
8. 9x 2 � 8y 2 � 36x � 64y � 164
9. 2x � y 2 � 8y � 8 � 0
10. Find an equation for the hyperbola with foci and with asymptotes .
11. Find an equation for the parabola with focus and directrix the x-axis.
12. A parabolic reflector for a car headlight forms a bowl shape that is 6 in. wide at its opening and 3 in. deep, as shown in the figure at the left. How far from the vertex shouldthe filament of the bulb be placed if it is to be located at the focus?
12, 4 2 y � �34 x10, �5 2
0 x
y
1
1 F(4, 0)
2
2
(4, 3)
0 x
y(_4, 2)
1
_1 0 x
y
y2
9�
x2
16� 1
x2
16�
y2
4� 1
814 CHAPTER 10 Test
3 in.
6 in.
57050_10_ch10_p742-819.qxd 08/04/2008 11:49 AM Page 814

CHAPTER 10 Analytic Geometry 815
13. (a) Use the discriminant to determine whether the graph of this equation is a parabola,an ellipse, or a hyperbola:
(b) Use rotation of axes to eliminate the xy-term in the equation.
(c) Sketch the graph of the equation.
(d) Find the coordinates of the vertices of this conic (in the xy-coordinate system).
14. (a) Find the polar equation of the conic that has a focus at the origin, eccentricity ,and directrix x � 2. Sketch the graph.
(b) What type of conic is represented by the following equation? Sketch its graph.
15. (a) Sketch the graph of the parametric curve
(b) Eliminate the parameter u in part (a) to obtain an equation for this curve in rectangular coordinates.
x � 3 sin u � 3 y � 2 cos u 0 � u � p
r �3
2 � sin u
e � 12
5x2 � 4xy � 2y2 � 18
CHAPTER 10 Test 815
57050_10_ch10_p742-819.qxd 08/04/2008 11:49 AM Page 815

816 CHAPTER 10 Analytic Geometry
Modeling motion is one of the most important ideas in both classical and modernphysics. Much of Isaac Newton’s work dealt with creating a mathematical model forhow objects move and interact—this was the main reason for his invention of calcu-lus. Albert Einstein developed his Special Theory of Relativity in the early 1900s torefine Newton’s laws of motion.
In this section we use coordinate geometry to model the motion of a projectile,such as a ball thrown upward into the air, a bullet fired from a gun, or any other sortof missile. A similar model was created by Galileo, but we have the advantage of us-ing our modern mathematical notation to make describing the model much easierthan it was for Galileo!
Parametric Equations for the Path of a Projectile
Suppose that we fire a projectile into the air from ground level, with an initial speed√0 and at an angle u upward from the ground. The initial velocity of the projectile is avector (see Section 8.4) with horizontal component √0 cos u and vertical component√0 sin u, as shown in Figure 1.
If there were no gravity (and no air resistance), the projectile would just keep moving indefinitely at the same speed and in the same direction. Since distance �speed time, the projectile’s position at time t would therefore be given by the fol-lowing parametric equations (assuming the origin of our coordinate system is placedat the initial location of the projectile):
No gravity
But, of course, we know that gravity will pull the projectile back to ground level.Using calculus, it can be shown that the effect of gravity can be accounted for by subtracting from the vertical position of the projectile. In this expression, g is the gravitational acceleration: g � 32 ft/s2 � 9.8 m/s2. Thus, we have the following parametric equations for the path of the projectile:
With gravity
Example The Path of a Cannonball
Find parametric equations that model the path of a cannonball fired into the air withan initial speed of 150.0 m/s at a 30� angle of elevation. Sketch the path of the cannonball.
x � 1√0 cos u 2 t y � 1√0 sin u 2 t � 12 gt2
12 gt2
x � 1√0 cos u 2 t y � 1√0 sin u 2 t
x
y
0
√‚
¨√‚ ç ¨
√‚ ß ¨
Figure 1
816
Focus on Modeling
The Path of a Projectile
57050_10_ch10_p742-819.qxd 08/04/2008 11:49 AM Page 816

CHAPTER 10 Analytic Geometry 817
Solution Substituting the given initial speed and angle into the general paramet-ric equations of the path of a projectile, we get
Substitute √0 � 150.0, u � 30�
Simplify
This path is graphed in Figure 2.
■
Range of a Projectile
How can we tell where and when the cannonball of the above example hits theground? Since ground level corresponds to y � 0, we substitute this value for y andsolve for t.
Set y � 0
Factor
Solve for t
The first solution, t � 0, is the time when the cannon was fired; the second solutionmeans that the cannonball hits the ground after 15.3 s of flight. To see where this hap-pens, we substitute this value into the equation for x, the horizontal location of thecannonball.
The cannonball travels almost 2 km before hitting the ground.Figure 3 shows the paths of several projectiles, all fired with the same initial speed
but at different angles. From the graphs we see that if the firing angle is too high ortoo low, the projectile doesn’t travel very far.
Let’s try to find the optimal firing angle—the angle that shoots the projectile as faras possible. We’ll go through the same steps as we did in the preceding example, but
¨=85*¨=75*¨=60*¨=45*¨=30*¨=15*¨=5*
y
x0Figure 3
Paths of projectiles
x � 129.9115.3 2 � 1987.5 m
t � 0 or t �75.0
4.9� 15.3
0 � t175.0 � 4.9t 2 0 � 75.0t � 4.9t2
y
500 x(meters)
Figure 2
Path of a cannonball
y � 75.0t � 4.9t2 x � 129.9t
y � 1150.0 sin 30° 2 t � 12 19.8 2 t2 x � 1150.0 cos 30° 2 t
The Path of a Projectile 817
Galileo Galilei (1564–1642) wasborn in Pisa, Italy. He studied med-icine, but later abandoned this infavor of science and mathematics.At the age of 25 he demonstratedthat light objects fall at the samerate as heavier ones, by droppingcannonballs of various sizes fromthe Leaning Tower of Pisa. Thiscontradicted the then-acceptedview of Aristotle that heavier ob-jects fall more quickly. He alsoshowed that the distance an objectfalls is proportional to the square of the time it has been falling, andfrom this was able to prove that thepath of a projectile is a parabola.
Galileo constructed the first tel-escope, and using it, discovered themoons of Jupiter. His advocacy ofthe Copernican view that the earthrevolves around the sun (ratherthan being stationary) led to his be-ing called before the Inquisition.By then an old man, he was forcedto recant his views, but he is said tohave muttered under his breath “theearth nevertheless does move.”Galileo revolutionized science byexpressing scientific principles inthe language of mathematics. Hesaid, “The great book of nature iswritten in mathematical symbols.”
The
Gran
ger C
olle
ctio
n
57050_10_ch10_p742-819.qxd 08/04/2008 11:49 AM Page 817

818 CHAPTER 10 Analytic Geometry
818 Focus on Modeling
we’ll use the general parametric equations instead. First, we solve for the time whenthe projectile hits the ground by substituting y � 0.
Substitute y � 0
Factor
Set second factor equal to 0
Solve for t
Now we substitute this into the equation for x to see how far the projectile has trav-eled horizontally when it hits the ground.
Parametric equation for x
Substitute
Simplify
Use identity sin 2u � 2 sin u cos u
We want to choose u so that x is as large as possible. The largest value that the sineof any angle can have is 1, the sine of 90�. Thus, we want 2u� 90�, or u� 45�. So tosend the projectile as far as possible, it should be shot up at an angle of 45�. From thelast equation in the preceding display, we can see that it will then travel a distance x � √2
0 / g.
Problems
1. Trajectories are Parabolas From the graphs in Figure 3 the paths of projectiles appear to be parabolas that open downward. Eliminate the parameter t from the generalparametric equations to verify that these are indeed parabolas.
2. Path of a Baseball Suppose a baseball is thrown at 30 ft/s at a 60� angle to the horizontal, from a height of 4 ft above the ground.
(a) Find parametric equations for the path of the baseball, and sketch its graph.
(b) How far does the baseball travel, and when does it hit the ground?
3. Path of a Rocket Suppose that a rocket is fired at an angle of 5� from the vertical,with an initial speed of 1000 ft/s.
(a) Find the length of time the rocket is in the air.
(b) Find the greatest height it reaches.
(c) Find the horizontal distance it has traveled when it hits the ground.
(d) Graph the rocket’s path.
4. Firing a Missile The initial speed of a missile is 330 m/s.
(a) At what angle should the missile be fired so that it hits a target 10 km away? (Youshould find that there are two possible angles.) Graph the missile paths for both angles.
(b) For which angle is the target hit sooner?
� √
20 sin 2u
g
�2√
20 sin u cos u
g
t � 12√0 sin u 2 /g � 1√0 cos u 2 a 2√0 sin u
g b x � 1√0 cos u 2 t t �
2√0 sin u
g
0 � √0 sin u � 12 gt
0 � t1√0 sin u � 12 gt 2 0 � 1√0 sin u 2 t � 1
2 gt2
57050_10_ch10_p742-819.qxd 08/04/2008 11:49 AM Page 818

CHAPTER 10 Analytic Geometry 819
5. Maximum Height Show that the maximum height reached by a projectile as a func-tion of its initial speed √0 and its firing angle u is
6. Shooting into the Wind Suppose that a projectile is fired into a headwind thatpushes it back so as to reduce its horizontal speed by a constant amount „. Find parametric equations for the path of the projectile.
7. Shooting into the Wind Using the parametric equations you derived in Problem 6,draw graphs of the path of a projectile with initial speed √0 � 32 ft/s, fired into a headwind of „ � 24 ft/s, for the angles u � 5�, 15�, 30�, 40�, 45�, 55�, 60�, and 75�. Is itstill true that the greatest range is attained when firing at 45�? Draw some more graphsfor different angles, and use these graphs to estimate the optimal firing angle.
8. Simulating the Path of a Projectile The path of a projectile can be simulated on a graphing calculator. On the TI-83 use the “Path” graph style to graph the general parametric equations for the path of a projectile and watch as the circular cursor moves,simulating the motion of the projectile. Selecting the size of the Tstep determines thespeed of the “projectile.”
(a) Simulate the path of a projectile. Experiment with various values of u. Use √0 � 10 ft/s and Tstep � 0.02. Part (a) of the figure below shows one such path.
(b) Simulate the path of two projectiles, fired simultaneously, one at u � 30� and theother at u� 60�. This can be done on the TI-83 using Simul mode (“simultaneous”mode). Use √0 � 10 ft/s and Tstep � 0.02. See part (b) of the figure. Where dothe projectiles land? Which lands first?
(c) Simulate the path of a ball thrown straight up . Experiment with values of √0 between 5 and 20 ft/s. Use the “Animate” graph style and Tstep � 0.02. Simulate the path of two balls thrown simultaneously at different speeds. To bet-ter distinguish the two balls, place them at different x-coordinates (for example,x � 1 and x � 2). See part (c) of the figure. How does doubling √0 change the maximum height the ball reaches?
1u � 90° 2
y �√2
0 sin2 u
2g
The Path of a Projectile 819
(a) (b) (c)
2
0 3
2
0 3
2
0 3
57050_10_ch10_p742-819.qxd 08/04/2008 11:49 AM Page 819


