Page 1
WMO Aeronautical Meteorology Scientific Conference 2017
6 - 10 November 2017
Centre International de Conférences - Météo-France - Toulouse - France
Session 1 – Science underpinning meteorological observations, forecasts, advisories and warnings
1.4 – Space Weather Research
Space weather observations, analyses and generation output data messages for aviation in Russia.
Burov V.A., Institute of Applied Geophysics, Rostokinskaya 9, Moscow, Russia.,
[email protected]
--------------------------------
co-authors: Aleshin I.M., Ochelkov Y.P.
--------------------------------
speaker: Burov V.A.,
Logic of the air service evolution brings ICAO to include information about space
weather into the Annex 3 — Meteorological Service for International Air Navigation. At the
fourth session of ICTSW (November 2013) the ICAO representative invited the ICTSW to
provide advice on the draft SARPs and the establishment of regional centers for space weather,
the provision of space weather information services by designated centers with a focus on the
impacts of space weather events on: 1) HF communications; 2) satellite navigation,
communication, and surveillance; and, 3) radiation exposure. Now, four year later, 18 states
received official letter from ICAO with invitation to tender for the selection Space Weather
centers for aviation. And Russia (Institute of Applied Geophysics) will take part in this tender. I
would like to give an account of Space weather observations, analyses and generation output
data messages for aviation in the Institute of Applied Geophysics.
Institute of Applied Geophysics (Moscow) – the forecasting center unites activities of
the National Heliogeophysics Service of Russia and the Regional Warning Center of ISES.
Nowadays the centre operates and fulfils numerous functions such as space weather
monitoring, collecting, working and handing out the data to both Russian and foreign
customers, compiling and spreading various kinds of the space weather conditions forecasts.
The first regular space weather forecast is known to have been issued on June 07, 1974. Since
then this kind of activity has been processed and issued permanently 7 days a week. We issue
the short-term forecasts for parameters of ionosphere, for radio wave propagation, for
characteristics of the magnetic activities, and we produce the information concerning the time
of the beginning and the end of the space weather disturbances. Totally, there have been
issued over 20 000 daily informative materials per year, for more than one hundred
organizations.
The data received by the activities are sent out in the form of the textual issues, as
coded telegrams, alerts, circulated messages and by the open access for real time space
weather information via the bilingual site: www.space-weather.ru, and www.ipg.geospace.ru.
Our observational tools include:
- low-orbital satellites («Meteor»)
- high-orbital (GEO) satellites (“Electro”)
- low orbital radio tomography net
- high orbital radio tomography net (GPS/GLONASS receiving stations)
- network of the ground ionospheric stations (see Figure 1)
- network of magnetic observatories
- network of riometers
- network of solar observatories
Page 2
WMO Aeronautical Meteorology Scientific Conference 2017
6 - 10 November 2017
Centre International de Conférences - Météo-France - Toulouse - France
Сеть позволит выполнить непрерывный мониторинг состояния ионосферы над территорией
России, включая мерцания ионосферы.
- пункты, где в н.в. возможно проведение
мониторинга ионосферных мерцаний
- пункты, где целесообразно проведение
мониторинга ионосферных мерцаний
Ground observation net)
Figure 1 - Ground observation net
Our magnetic observatories: Sant Petersburg (33603), Amderma (36701), Dikson
(38701), Tiksi (43701), Murmansk (33702), Novosibirsk (3805), Khabarovsk (4305),Moskow
(34503) and Moscow (34504) allow for notification that geomagnetic storm conditions have
been measured at ground level.
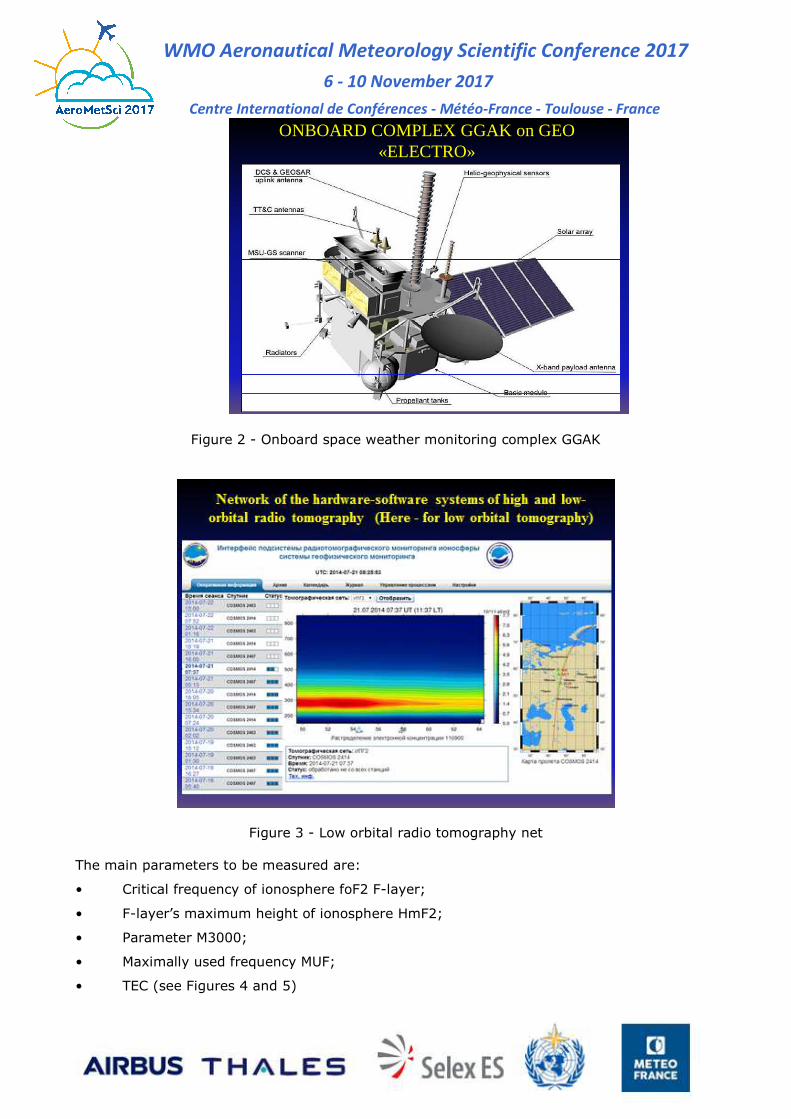
We have identical space weather monitoring complex (GGAK) on board of the GEO
“Electro” and LEO “Meteor” (see Figure 2). Low orbital radio tomography net on the base of the
LEO satellites “Cosmos” provided with 3D chart of the ionosphere in the west and east part of
Russia. (see Figure 3) We provide 3D tomography with the help of a network of
GLONASS/GPS/Galileo receivers.
Page 3
WMO Aeronautical Meteorology Scientific Conference 2017
6 - 10 November 2017
Centre International de Conférences - Météo-France - Toulouse - France
ONBOARD COMPLEX GGAK on GEO «ELECTRO»
Figure 2 - Onboard space weather monitoring complex GGAK
Figure 3 - Low orbital radio tomography net
The main parameters to be measured are:
• Critical frequency of ionosphere foF2 F-layer;
• F-layer’s maximum height of ionosphere HmF2;
• Parameter M3000;
• Maximally used frequency MUF;
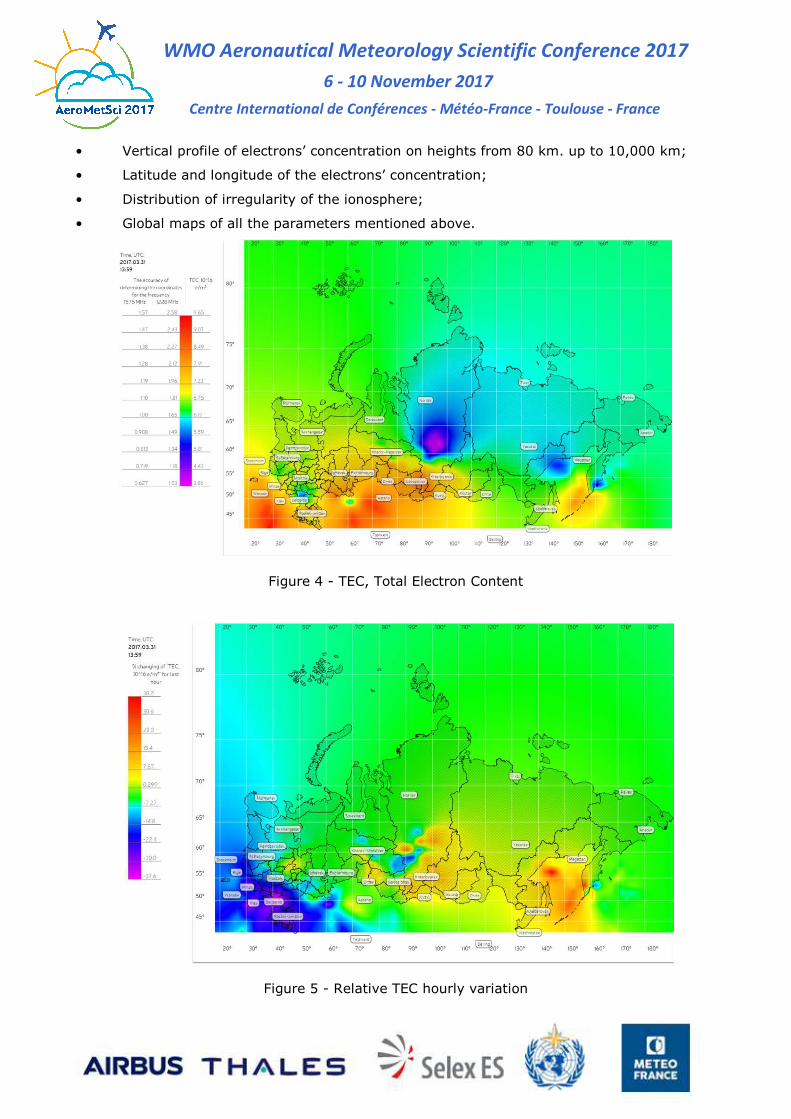
• TEC (see Figures 4 and 5)
Page 4
WMO Aeronautical Meteorology Scientific Conference 2017
6 - 10 November 2017
Centre International de Conférences - Météo-France - Toulouse - France
• Vertical profile of electrons’ concentration on heights from 80 km. up to 10,000 km;
• Latitude and longitude of the electrons’ concentration;
• Distribution of irregularity of the ionosphere;
• Global maps of all the parameters mentioned above.
Figure 4 - TEC, Total Electron Content
Figure 5 - Relative TEC hourly variation
Page 5
WMO Aeronautical Meteorology Scientific Conference 2017
6 - 10 November 2017
Centre International de Conférences - Météo-France - Toulouse - France
We use our original model for the calculations ionosphere parameters (IRI type) –
SIMP, and its modification - SIMP-2 (System of Ionosphere Monitoring and Prediction – see
Figure 6).The program has been designed for evaluating ionosphere’s current status and short-
term forecasts of the ionosphere and radio wave propagation. This technique is based on the
ground and space board data and the correcting ionosphere models.
Figure 6 - Model for the calculations ionosphere parameters SIMP-2
(System of Ionosphere Monitoring and Prediction)
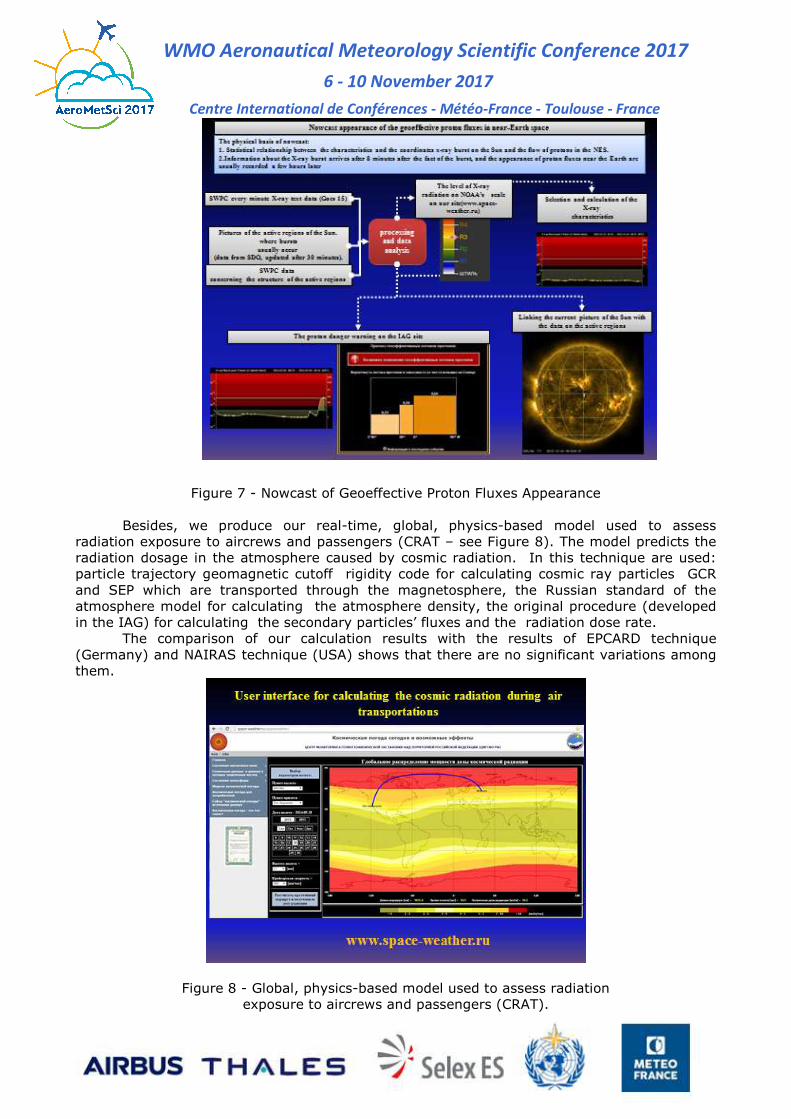
We use our original technique of the nowcast appearance of the geo-effective proton
fluxes in near-Earth space (see Figure 7). In this technique we mean the appearance in near-
Earth space the solar proton fluxes with energy greater than 10 MeV and intensities sufficiently
greater than phone ones. The technique proposed is based on the permanent control in real
time of the solar X-ray radiation combined with localization of the solar proton injection source.
Page 6
WMO Aeronautical Meteorology Scientific Conference 2017
6 - 10 November 2017
Centre International de Conférences - Météo-France - Toulouse - France
Figure 7 - Nowcast of Geoeffective Proton Fluxes Appearance
Besides, we produce our real-time, global, physics-based model used to assess
radiation exposure to aircrews and passengers (CRAT – see Figure 8). The model predicts the
radiation dosage in the atmosphere caused by cosmic radiation. In this technique are used:
particle trajectory geomagnetic cutoff rigidity code for calculating cosmic ray particles GCR
and SEP which are transported through the magnetosphere, the Russian standard of the
atmosphere model for calculating the atmosphere density, the original procedure (developed
in the IAG) for calculating the secondary particles’ fluxes and the radiation dose rate.
The comparison of our calculation results with the results of EPCARD technique
(Germany) and NAIRAS technique (USA) shows that there are no significant variations among
them.
Figure 8 - Global, physics-based model used to assess radiation
exposure to aircrews and passengers (CRAT).
Page 7
WMO Aeronautical Meteorology Scientific Conference 2017
6 - 10 November 2017
Centre International de Conférences - Météo-France - Toulouse - France
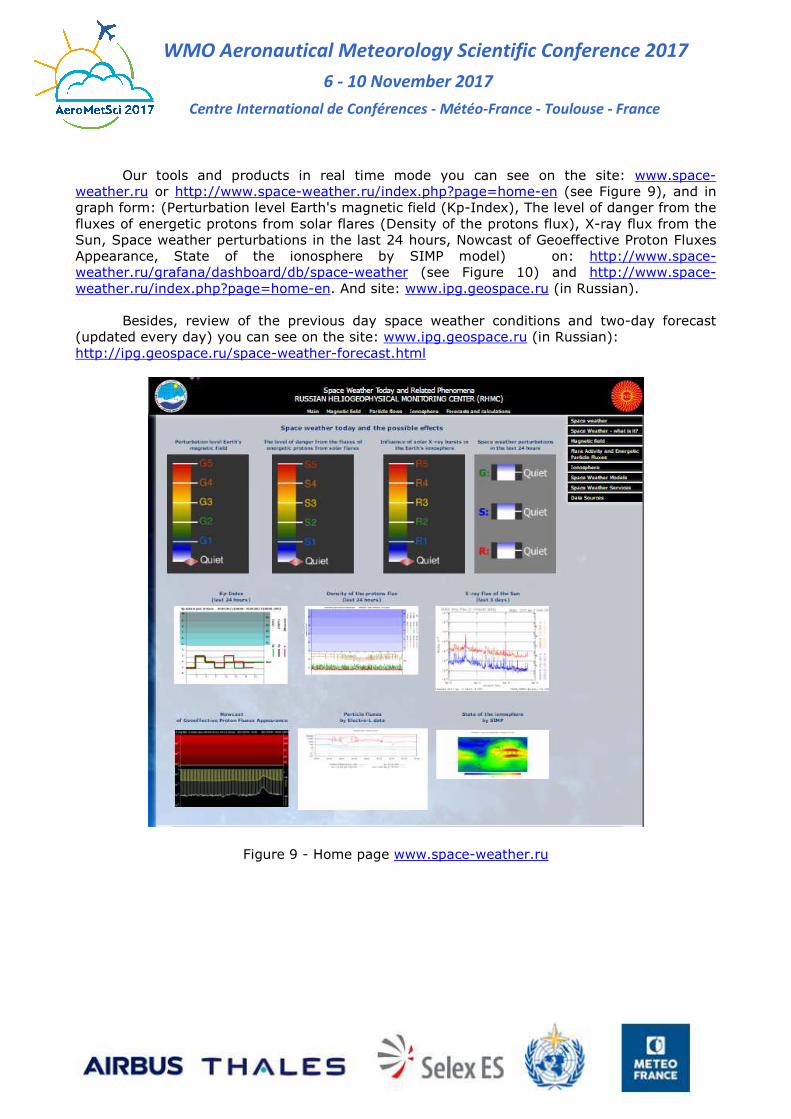
Our tools and products in real time mode you can see on the site: www.space-
weather.ru or http://www.space-weather.ru/index.php?page=home-en (see Figure 9), and in
graph form: (Perturbation level Earth's magnetic field (Kp-Index), The level of danger from the
fluxes of energetic protons from solar flares (Density of the protons flux), X-ray flux from the
Sun, Space weather perturbations in the last 24 hours, Nowcast of Geoeffective Proton Fluxes
Appearance, State of the ionosphere by SIMP model) on: http://www.space-
weather.ru/grafana/dashboard/db/space-weather (see Figure 10) and http://www.space-
weather.ru/index.php?page=home-en. And site: www.ipg.geospace.ru (in Russian).
Besides, review of the previous day space weather conditions and two-day forecast
(updated every day) you can see on the site: www.ipg.geospace.ru (in Russian):
http://ipg.geospace.ru/space-weather-forecast.html
Figure 9 - Нome page www.space-weather.ru
Page 8
WMO Aeronautical Meteorology Scientific Conference 2017
6 - 10 November 2017
Centre International de Conférences - Météo-France - Toulouse - France
Figure 10 - Graph form (grafana) real-time data.
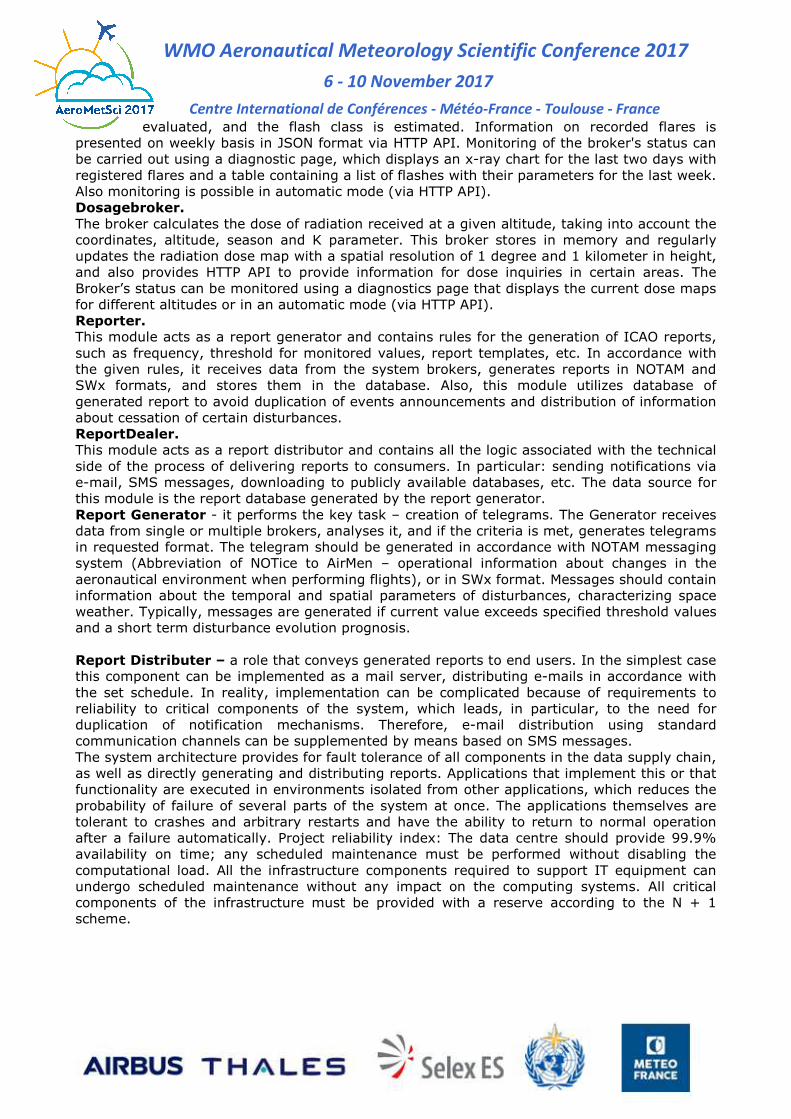
Procedures of analyses and output data messages generation for aviation consist of
several components based on a redundant data-driven multi-agent system (see Figures 11 to
13). We used two kinds of agents: brokers (Hortbroker, Fluxbroker, X-raybroker,
Dosagebroker, Reporter, Reportdealer) and public (foreign exchange) distribution agents. We
utilize JSON as our primary data format alongside with RESTful HTTP as exchange protocol.
It is assumed that the output data format is fixed, regardless of the possible changes in the in
the input data format from external sources. To solve this problem, broker can receive data
from one or multiple sources, convert, temporarily store, and transmit on demand from
another broker or generator.
Hortbroker.
The Broker ensures the distribution of total electron content over the territory of the Russian
Federation, calculated by the method of high orbit tomography. The calculations are made
every five minutes, and sectional image of ionosphere and its integral convolution in height are
placed into database. Having access to the corresponding data base fields, the broker receives
actual data via local IAG network (IAG – Institute of Applied Geophysics) according to HTTP
protocol. As a result, the TEC allocation becomes available in JSON format.
Fluxbroker.
The broker provides data on the particle counters received from GOES and Electro-L No.2
satellites, as well as the GOES X-ray detector. GOES data is uploaded via internet from two
independent sources to provide hardware fault tolerance. Electro-L No.2 data gets placed on
IAG ftp-server, where it is received directly from the satellite. The Broker performs data
caching and delivery according to HTTP protocol. Data is provided in JSON format. The broker's
status can be monitored using a diagnostic page or in automatic mode via the HTTP API).
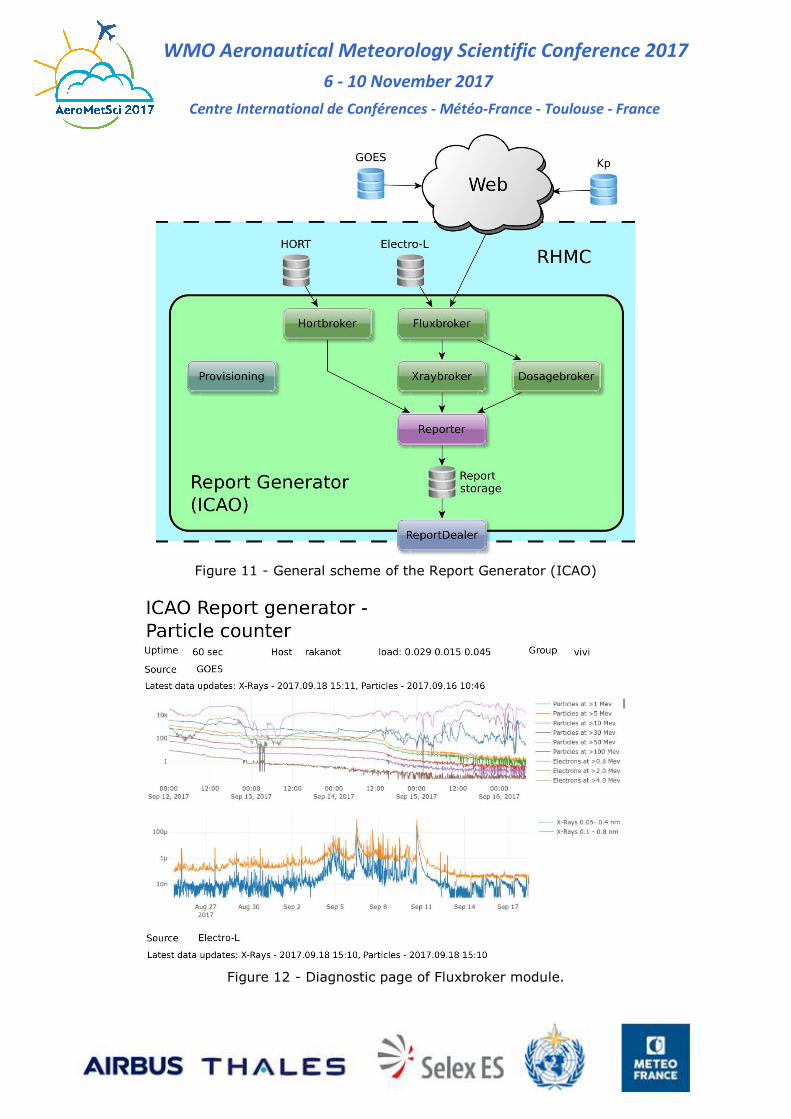
X-Ray Broker.
This broker provides data on fixed x-ray flares based on data received from Fluxbroker. Flare
detection is based on a specific pattern in detector readings, showing sharp increase in high
energy X-rays. Then, the corresponding peak in the soft x-ray is searched, the maximum flux
and the rise time are determined. Based on these parameters, the flash proton strength is
Page 9
WMO Aeronautical Meteorology Scientific Conference 2017
6 - 10 November 2017
Centre International de Conférences - Météo-France - Toulouse - France
evaluated, and the flash class is estimated. Information on recorded flares is
presented on weekly basis in JSON format via HTTP API. Monitoring of the broker's status can
be carried out using a diagnostic page, which displays an x-ray chart for the last two days with
registered flares and a table containing a list of flashes with their parameters for the last week.
Also monitoring is possible in automatic mode (via HTTP API).
Dosagebroker.
The broker calculates the dose of radiation received at a given altitude, taking into account the
coordinates, altitude, season and K parameter. This broker stores in memory and regularly
updates the radiation dose map with a spatial resolution of 1 degree and 1 kilometer in height,
and also provides HTTP API to provide information for dose inquiries in certain areas. The
Broker’s status can be monitored using a diagnostics page that displays the current dose maps
for different altitudes or in an automatic mode (via HTTP API).
Reporter.
This module acts as a report generator and contains rules for the generation of ICAO reports,
such as frequency, threshold for monitored values, report templates, etc. In accordance with
the given rules, it receives data from the system brokers, generates reports in NOTAM and
SWx formats, and stores them in the database. Also, this module utilizes database of
generated report to avoid duplication of events announcements and distribution of information
about cessation of certain disturbances.
ReportDealer.
This module acts as a report distributor and contains all the logic associated with the technical
side of the process of delivering reports to consumers. In particular: sending notifications via
e-mail, SMS messages, downloading to publicly available databases, etc. The data source for
this module is the report database generated by the report generator.
Report Generator - it performs the key task – creation of telegrams. The Generator receives
data from single or multiple brokers, analyses it, and if the criteria is met, generates telegrams
in requested format. The telegram should be generated in accordance with NOTAM messaging
system (Abbreviation of NOTice to AirMen – operational information about changes in the
aeronautical environment when performing flights), or in SWx format. Messages should contain
information about the temporal and spatial parameters of disturbances, characterizing space
weather. Typically, messages are generated if current value exceeds specified threshold values
and a short term disturbance evolution prognosis.
Report Distributer – a role that conveys generated reports to end users. In the simplest case
this component can be implemented as a mail server, distributing e-mails in accordance with
the set schedule. In reality, implementation can be complicated because of requirements to
reliability to critical components of the system, which leads, in particular, to the need for
duplication of notification mechanisms. Therefore, e-mail distribution using standard
communication channels can be supplemented by means based on SMS messages.
The system architecture provides for fault tolerance of all components in the data supply chain,
as well as directly generating and distributing reports. Applications that implement this or that
functionality are executed in environments isolated from other applications, which reduces the
probability of failure of several parts of the system at once. The applications themselves are
tolerant to crashes and arbitrary restarts and have the ability to return to normal operation
after a failure automatically. Project reliability index: The data centre should provide 99.9%
availability on time; any scheduled maintenance must be performed without disabling the
computational load. All the infrastructure components required to support IT equipment can
undergo scheduled maintenance without any impact on the computing systems. All critical
components of the infrastructure must be provided with a reserve according to the N + 1
scheme.
Page 10
WMO Aeronautical Meteorology Scientific Conference 2017
6 - 10 November 2017
Centre International de Conférences - Météo-France - Toulouse - France
Figure 11 - General scheme of the Report Generator (ICAO)
Figure 12 - Diagnostic page of Fluxbroker module.
Page 11
WMO Aeronautical Meteorology Scientific Conference 2017
6 - 10 November 2017
Centre International de Conférences - Météo-France - Toulouse - France
Figure 13 - X-ray fluxes and recorded events for September 7-8, 2017.