ENVIRONMENTAL ASSESSMENT REPORT FOR THE PHASE 1 NEW TRANSMISSION LINE TO PICKLE LAKE PROJECT SECTION 6.0: BIOLOGICAL ENVIRONMENT BASE CASE AND EFFECTS ASSESSMENT 6.0 BIOLOGICAL ENVIRONMENT BASE CASE AND EFFECTS ASSESSMENT The biological environment base case and effects assessment seeks to understand and characterize potential effects of the Project and other past, present, and reasonably foreseeable developments on the biological environment. The following subsections present the assessment of the biological environment through assessment of vegetation and wetlands, fish and fish habitat, and wildlife. 6.1 Vegetation and Wetlands This section assesses and characterizes the environmental effects of the New Transmission line to Pickle Lake (the Project) on vegetation and wetlands. The assessment follows the general approach described in Section 4.0. 6.1.1 Input from Engagement Issues pertaining to vegetation and wetlands that were raised by Aboriginal communities, Aboriginal groups and stakeholders during engagement and how they are addressed in the environmental assessment (EA) are listed in Table 6.1-1. Comments, responses and follow-up actions are provided in Appendix 2.3A Aboriginal Engagement Summary Report and Appendix 2.4A Stakeholder Engagement Summary Report. June 2017 Project No. 1535751 6-1
Transcript
ENVIRONMENTAL ASSESSMENT REPORT FOR THE PHASE 1 NEW TRANSMISSION LINE TO PICKLE LAKE PROJECT SECTION 6.0: BIOLOGICAL ENVIRONMENT BASE CASE AND EFFECTS ASSESSMENT
6.0 BIOLOGICAL ENVIRONMENT BASE CASE AND EFFECTS ASSESSMENT
The biological environment base case and effects assessment seeks to understand and characterize potential effects of the Project and other past, present, and reasonably foreseeable developments on the biological environment. The following subsections present the assessment of the biological environment through assessment of vegetation and wetlands, fish and fish habitat, and wildlife.
6.1 Vegetation and Wetlands This section assesses and characterizes the environmental effects of the New Transmission line to Pickle Lake (the Project) on vegetation and wetlands. The assessment follows the general approach described in Section 4.0.
6.1.1 Input from Engagement Issues pertaining to vegetation and wetlands that were raised by Aboriginal communities, Aboriginal groups and stakeholders during engagement and how they are addressed in the environmental assessment (EA) are listed in Table 6.1-1. Comments, responses and follow-up actions are provided in Appendix 2.3A Aboriginal Engagement Summary Report and Appendix 2.4A Stakeholder Engagement Summary Report.
June 2017 Project No. 1535751 6-1
ENVIRONMENTAL ASSESSMENT REPORT FOR THE PHASE 1 NEW TRANSMISSION LINE TO PICKLE LAKE PROJECT SECTION 6.0: BIOLOGICAL ENVIRONMENT BASE CASE AND EFFECTS ASSESSMENT
Table 6.1-1: Summary of Issues Raised during Engagement Related to Vegetation and Wetlands
Issue How addressed in the Environmental Assessment Aboriginal Community or Aboriginal Group /
Stakeholder
Eagle Lake First Nation identified fringed gentian as a locally rare species in the area. It grows along the highway in Sioux Lookout but does not grow along the proposed corridors. Concern for rare species.
Potential effects of the Project to rare plants species were assessed as part of the ecosystem composition measurement indicator and field surveys were conducted within the Preliminary Proposed Corridor. Fringed gentian was not observed during field surveys. Site-specific features (e.g., rare vegetation community, wetland, significant wildlife habitat) will be clearly marked. In the event that a rare plant species or a rare vegetation community are suspected or encountered unexpectedly, or cannot be avoided, implement the Rare Plant Management Plan (Section 9.3.1.6)
Traditional Land and Resource Use (TLRU) Interviews with Eagle Lake First Nation community members
Eagle Lake stated that yellow birch is locally rare. If it grows along the proposed line, it should be avoided.
Potential effects of the Project to rare plants species were assessed as part of the ecosystem composition measurement indicator and field surveys were conducted within the Preliminary Proposed Corridor. Yellow birch was not observed during field surveys. Site-specific features (e.g., rare vegetation community, wetland, significant wildlife habitat) will be clearly marked. In the event that a rare plant species or a rare vegetation community are suspected or encountered unexpectedly, or cannot be avoided, implement the Rare Plant Management Plan (Section 9.3.1.6)
TLRU Interviews with Eagle Lake First Nation community members
The use of herbicides for vegetation management. Vegetation will be cleared manually. As per the Wataynikaneyap Chief’s directive, there will be no use of herbicides for vegetation management.
Round 3 Part 1 Engagement with Wabigoon Lake First Nation
June 2017 Project No. 1535751 6-2
ENVIRONMENTAL ASSESSMENT REPORT FOR THE PHASE 1 NEW TRANSMISSION LINE TO PICKLE LAKE PROJECT SECTION 6.0: BIOLOGICAL ENVIRONMENT BASE CASE AND EFFECTS ASSESSMENT
Table 6.1-1: Summary of Issues Raised during Engagement Related to Vegetation and Wetlands
Issue How addressed in the Environmental Assessment Aboriginal Community or Aboriginal Group /
Stakeholder
Concern that animals and plant life will be chased away from line area. Those areas won't be the same. If that does happen, the animals and plants will never come back or grow in that area again. People might lose some hunting grounds. May not be a huge impact but it may affect wildlife who may be forced to move during construction.
Potential effects of the Project on the terrestrial environment, including animals and plants, are addressed in this section and Section 6.3 Wildlife. Vegetation clearing will be limited to Project footprint and temporary construction areas will be reclaimed with native vegetation. Compatible vegetation will be allowed to regrow in the ROW to a height of 2 m and mitigation provided in the Invasive Species Management Plan (Section 9.3.1.5) will be implemented to reduce the risk of introducing invasive plants. Selective clearing and retention of shrub vegetation, trees, wildlife trees, and coarse woody debris in environmentally sensitive areas as much as practicable. Impact management measures to minimize sensory disturbance to wildlife includes using existing access roads to avoid new clearing of vegetation as much as possible and selective clearing and retention of shrubs, trees and wildlife trees. Impact management measures are identified to reduce or avoid the identified potential effects.
Potential effects on land and resource use, including hunting grounds, are addressed in Section 7.4 Non-Aboriginal Land and Resource Use.
Potential effects to fish and fish habitat are addressed in the Section 6.2 Fish and Fish Habitat.
Engagement with Cat Lake First Nation on the Terms of Reference (ToR)
June 2017 Project No. 1535751 6-3
ENVIRONMENTAL ASSESSMENT REPORT FOR THE PHASE 1 NEW TRANSMISSION LINE TO PICKLE LAKE PROJECT SECTION 6.0: BIOLOGICAL ENVIRONMENT BASE CASE AND EFFECTS ASSESSMENT
Table 6.1-1: Summary of Issues Raised during Engagement Related to Vegetation and Wetlands
Issue How addressed in the Environmental Assessment Aboriginal Community or Aboriginal Group /
Stakeholder
Concerned about the effects on waterways, swampy areas, medicinal plants, wildlife habitat, such as moose, beaver, etc.
Potential effects to vegetation, including wetlands and plants used for medicinal purposes identified by the community, was addressed in this section. With the implementation of impact management measures, no significant effects of the Project are predicted on vegetation and wetlands.
See Section 6.3 Wildlife and Section 8.0 Aboriginal and Treaty Rights and Interests for additional information on use of medicinal plants.
Engagement with Lac Seul First Nation on the ToR
Concerned about the loss of trees. Potential effects to vegetation, including trees, are addressed in this section. Impact management measures have been identified to reduce or avoid the identified potential effects. Wataynikaneyap will work with both Aboriginal communities and forest management units to dispose of merchantable timber cleared by the Project. No significant effects to vegetation and wetlands from the Project are predicted.
Engagement with Slate Falls First Nation on the ToR
Living so close to a transmission line now which has access for hydro workers through our property I am concerned about the following issues for the natural environment: the line is sprayed (herbicides) frequently (1x/year), people use the hydro line to access hunting/fishing areas legally or illegally; invasive species are brought in by travel and construction work on line.
Spraying affects berry harvesting, may affect wildlife that is consumed for food. If workers on the transmission line need to go through private land (such as mine) to get into the construction servicing/maintenance of the line – there must be compensation or some other arrangement
Vegetation will be cleared manually. As per the Wataynikaneyap Chief’s directive, there will be no use of herbicides for vegetation clearing.
An Invasive Species Management Plan will be implemented by Wataynikaneyap to control the potential for introduction of invasive species. The details of this plan are provided in Section 9.3.1.7 of the Environmental and Social Management Plan.
Potential effects of increased access are addressed in Section 7.4 Non-Aboriginal Land and Resource Use.
Engagement with City of Dryden on the ToR
June 2017 Project No. 1535751 6-4
ENVIRONMENTAL ASSESSMENT REPORT FOR THE PHASE 1 NEW TRANSMISSION LINE TO PICKLE LAKE PROJECT SECTION 6.0: BIOLOGICAL ENVIRONMENT BASE CASE AND EFFECTS ASSESSMENT
Table 6.1-1: Summary of Issues Raised during Engagement Related to Vegetation and Wetlands
Issue How addressed in the Environmental Assessment Aboriginal Community or Aboriginal Group /
Stakeholder
Trees are an important part of the natural environment. Wildlife is an important part of the natural environment
Potential effects to vegetation, including trees, are addressed in this section. Impact management measures have been identified to reduce or avoid the identified potential effects. No significant effects to vegetation and wetlands from the Project were predicted.
See Section 6.3 Wildlife for how potential effects of the Project on wildlife are addressed.
Engagement with the Township of Pickle Lake on the ToR
Note: EA = environmental assessment; ROW = right-of-way; TLRU = Traditional Land and Resource Use; ToR = Terms of Reference; m = metre.
June 2017 Project No. 1535751 6-5
ENVIRONMENTAL ASSESSMENT REPORT FOR THE PHASE 1 NEW TRANSMISSION LINE TO PICKLE LAKE PROJECT SECTION 6.0: BIOLOGICAL ENVIRONMENT BASE CASE AND EFFECTS ASSESSMENT
6.1.2 Information Sources Information for the vegetation and wetlands baseline was collected from review of the following sources:
Project Description (Section 3.0);
Traditional ecological knowledge provided by Aboriginal communities through existing reports and through engagement activities;
Environmental Baseline Terrestrial Ecology New Transmission Line to Pickle Lake Project report (Golder 2016; Appendix 6.1B);
studies published in scientific journals and reports;
other EA reports for developments in northwestern Ontario;
Forest Management Plans (FMPs);
Integrated Range Assessments (IRAs) for woodland caribou and their habitat (MNRF 2014);
Forest Resource Inventory (FRI) data (MNRF 2016a); electronic data obtained from the Ontario Ministry of Natural Resources and Forestry (MNRF) through Land Information Ontario (LIO) (MNRF 2016b); and the Natural Heritage Information Centre (NHIC 2017);
Provincial Land Cover 2000 (Spectranalysis Inc. 2004);
Natural Heritage Reference Manual for Natural Heritage Policies of the Provincial Policy Statement, 2005 (MNR 2010);
legislation and guidance provided by federal (e.g., Committee on the Status of Endangered Wildlife in Canada [COSEWIC 2016], Species at Risk Act [SARA], and provincial governments (e.g., Endangered Species Act, 2007 [Government of Ontario 2007] under the Species At Risk in Ontario list developed by the Committee on the Status of Species at Risk in Ontario [COSSARO] [Government of Ontario 2017], NHIC species of conservation concern [NHIC 2017] authorities and expert committees);
Environment and Climate Change Canada’s (ECCC) SARA Public Registry (Government of Canada 2017); and
Natural Resource Values Information System (NRVIS) (MNR 2011).
Some of these sources were also used to identify the locations of natural heritage features such as:
provincially significant wetlands (PSW) (MNRF 2016b); and
Areas of Natural and Scientific Interest (ANSI).
Additional information provided by MNRF included:
locations of critical landform/vegetation associations; and
guidance on identifying rare vegetation communities.
For the purposes of the EA, sufficient information was deemed to be available from the references listed above to assess the potential effects of the Preliminary Proposed Corridor and corridor alternatives on vegetation and wetlands.
June 2017 Project No. 1535751 6-6
ENVIRONMENTAL ASSESSMENT REPORT FOR THE PHASE 1 NEW TRANSMISSION LINE TO PICKLE LAKE PROJECT SECTION 6.0: BIOLOGICAL ENVIRONMENT BASE CASE AND EFFECTS ASSESSMENT
6.1.3 Criteria, Indicators, and Assessment Endpoints The criteria, indicators, and endpoints selected for the assessment of Project effects on vegetation and wetlands, and the rationale for their selection, are provided in Table 6.1-2.
Table 6.1-2 Vegetation and Wetlands Criteria, Indicators and Assessment Endpoints
Main component of the naturally-occurring vegetation in the study areas
Basis for many local biological processes
Habitat for wildlife Assessment is applicable to most
wildlife species (including upland breeding water birds)
Aboriginal current community use of vegetation associated with this ecosystem
Ecosystem availability
Ecosystem distribution
Ecosystem composition
Maintenance of self-sustaining and ecologically effective upland ecosystems(b)
Wetland ecosystems
Conservation concern and sensitivity to development
High aesthetic value and social importance
Ecosystem and landscape level biodiversity
Performs hydrologic and biochemical cycling functions
Assessment is applicable to wetland-dependent wildlife species (e.g., caribou, moose, beaver, marsh birds, amphibians and snapping turtle)
Aboriginal current community use of vegetation associated with this ecosystem
Ecosystem availability
Ecosystem distribution
Ecosystem composition
Maintenance of self-sustaining and ecologically effective wetland ecosystems(b)
June 2017 Project No. 1535751 6-7
ENVIRONMENTAL ASSESSMENT REPORT FOR THE PHASE 1 NEW TRANSMISSION LINE TO PICKLE LAKE PROJECT SECTION 6.0: BIOLOGICAL ENVIRONMENT BASE CASE AND EFFECTS ASSESSMENT
Table 6.1-2 Vegetation and Wetlands Criteria, Indicators and Assessment Endpoints
Conservation concern (limited distribution in comparison with upland and wetland ecosystems)
Social importance Sensitive to development Ecosystem and landscape level
biodiversity Performs hydrologic functions Assessment is applicable to most
wildlife species with respect to providing regional movement corridors
Aboriginal current community use of vegetation associated with this ecosystem
Ecosystem availability
Ecosystem distribution
Ecosystem composition
Maintenance of self-sustaining and ecologically effective riparian ecosystems(b)
Notes: A vegetation inventory by ecosite type is provided in Annex F of the Terrestrial Ecology Baseline Report (Appendix 6.1B). a) Riparian habitat is a transition zone between aquatic and terrestrial ecosystems (Austin et al. 2008) b) Self-sustaining ecosystems are healthy, functioning, and robust entities that are capable of withstanding environmental change and accommodating stochastic processes. Ecologically effective ecosystems are those that can support the range of native species and ecological and evolutionary processes normally provided by the ecosystem (Noss 1990).
Criteria are components of the environment that are considered to have economic, social, biological, conservation, aesthetic or ethical value (Section 4.1). The selection of criteria was based on the following factors:
Traditional ecological knowledge provided by Aboriginal communities through existing reports and through engagement activities;
Amended Terms of Reference (ToR) for the Project;
ecological, cultural and socio-economic value to Aboriginal communities, government agencies, and the public;
presence, abundance, and distribution within, or relevance to, the area associated with the Project;
potential for interaction with the Project and sensitivity to effects;
representing a broad range of potential effects;
providing a level of ecological and assessment redundancy with other criteria; and
previous EA reports for projects in similar environments.
The selection of vegetation and wetlands criteria considered a ‘coarse filter’ approach to the assessment, which examines biodiversity of the region at the broadest level (Table 6.1-2). Ecosystems can be conceptually defined as the complex of interactions and fluxes of matter and energy among living (plants, animals, micro-organisms) and non-living (minerals, water, air) components of an environment acting as a functional unit (Waring 1989, Austin et al. 2008). Assessing and managing biodiversity at the vegetation and wetlands
June 2017 Project No. 1535751 6-8
ENVIRONMENTAL ASSESSMENT REPORT FOR THE PHASE 1 NEW TRANSMISSION LINE TO PICKLE LAKE PROJECT SECTION 6.0: BIOLOGICAL ENVIRONMENT BASE CASE AND EFFECTS ASSESSMENT
ecosystems level means that large numbers of biodiversity elements are addressed together. This approach to selecting criteria for vegetation and wetlands captures the availability and composition of ecosites that contain listed species. In addition, the amount and distribution of rare vegetation communities, identified listed plants, and critical landform/vegetation associations that can support listed species are also assessed. For example, wildlife guilds (group of species using a common resource in a similar manner) and plant communities dependent on old live trees, standing dead trees, coarse woody debris, and natural disturbance processes (fire, insects and disease) found in upland mature and older forests will be captured by the ecosystem level assessment. Similarly, analysis of the availability, distribution, and function of wetland and riparian ecosystems provides an assessment of wetland plant species, amphibians, birds, and mammals. Assessment of riparian habitats also helps to determine effects on potential movement corridors connecting habitats across the landscape. Assessment of surface water quality, flows, and levels also provides an understanding of potential effects to plants and animals (and humans) that have life histories strongly tied to wetland and riparian ecosystems.
Accordingly, rather than select a number of plant species or communities as criteria for vegetation and wetlands, criteria were selected to provide an assessment of the broad-scale ecosystems that are likely to be influenced by the Preliminary Proposed Corridor and corridor alternatives. A vegetation inventory by ecosite type is provided in Annex F of the Terrestrial Ecology Baseline Report (Appendix 6.1B).
The criteria are:
Upland ecosystems: open, shrub and treed communities containing mainly facultative upland (i.e., species that can grow in either upland ecosystems or other habitats), and obligate upland plant species (i.e., species that grow in upland ecosystems only). The water table is rarely above the substrate surface and pooling in spring is minimal. Substrates consist of parent mineral material, mineral soil, rock, bedrock, and organic material less than 40 centimetres (cm) in depth. Moisture regime refers to the available moisture supply for plant growth estimated in relative or absolute terms. The moisture regime of uplands is typically dry to moist, while less commonly wet (MNR 2001).
Wetland ecosystems: open, shrub, and treed communities consisting of mainly facultative and obligate wetland plant species. The water table is seasonally or permanently at, near or above the substrate surface. The substrate consists of flooded bedrock, hydric mineral soil, or organic materials greater than 40 cm in depth for peatlands or less than 40 cm for mineral wetlands (MNR 2001).
Riparian ecosystems: A two-tiered approach was used to classify riparian ecosystems based on stream order. Ordering streams is a method of assigning a number to links in a stream network and assists in classifying stream types and their number of tributaries. The most upstream segment of a stream order network begins with an order of one. Each time stream orders of the same order intersect, the stream order increases. For stream orders 5 and above, riparian ecosystems consist of the vegetative assemblage within 60 metres (m) of the stream edge. For stream orders less than 5, riparian ecosystems were defined as the vegetative assemblage within 30 m of the stream edge.
Importantly, ecological attributes or features such as traditional use and plant species of concern, rare vegetation communities (e.g., bur oak), and critical landform/vegetation associations are included in the assessment through the analysis of indicators. For example, if bur oak communities will be disturbed by the Project, the assessment quantitatively and/or qualitatively evaluated the changes in availability, distribution and composition of this feature as part of effects to upland and wetland ecosystems (refer to the definitions of indicators below).
June 2017 Project No. 1535751 6-9
ENVIRONMENTAL ASSESSMENT REPORT FOR THE PHASE 1 NEW TRANSMISSION LINE TO PICKLE LAKE PROJECT SECTION 6.0: BIOLOGICAL ENVIRONMENT BASE CASE AND EFFECTS ASSESSMENT
Assessment endpoints represent the key properties of a criterion that should be protected (Section 4.1). Maintenance of self-sustaining and ecologically effective ecosystems represent the assessment endpoints for vegetation and wetlands criteria (Table 6.1-2). Self-sustaining ecosystems are healthy, functioning, and robust entities that are capable of withstanding environmental change and accommodating stochastic processes. Ecologically effective ecosystems are those that can support the range of native species and ecological and evolutionary processes normally provided by the ecosystem (Noss 1990). These processes vary by ecosystem type and are not easily quantified.
Indicators represent attributes of the environment that can be used to characterize changes to criteria and the assessment endpoints in a meaningful way. The indicators for the vegetation and wetlands criteria are defined as follows:
Ecosystem availability: the amount of the ecosystem present for each criterion. Ecosystem availability is primarily affected by physical changes (e.g., mechanical vegetation clearing). Ecosystem availability is represented as the amount of area (i.e., hectares) of each ecosystem type.
Ecosystem distribution: the way each ecosystem type is distributed on the landscape. Ecosystem availability and distribution are linked. Distribution focuses on the spatial configuration (or arrangement) and connectivity of ecosystems, whereas availability focuses on the amount of those ecosystems. Linear feature density (e.g., roads) was used to help inform changes in distribution and connectivity.
Ecosystem composition: refers to species richness (or diversity) and abundance. Ecosystem composition is primarily affected by changes in the amount of moisture and sunlight, competition with invasive species, and dust deposition.
During the engagement process, the MNRF requested that changes in CLVAs be specifically assessed as they represent key elements of biodiversity (Appendix 2.4A). Landform/Vegetation Associations (LVAs) are areas identified as unique habitat because of the combination of unique landforms and specific vegetation communities. Landform/Vegetation Associations are managed on an ecodistrict scale, whereby the minimum conservation targets are 1% or 50 ha of each LVA type (Davis et al. 2006). Landform/Vegetation Association types that do not achieve this minimum target are referred to as “gaps” if they are identified outside of provincial parks and other conservation areas. Landform/Vegetation Associations that do not achieve this minimum target, but that are located within provincial parks and other conservation areas are referred to as Critical Landform/Vegetation Associations (CLVAs). Gaps have no legislative protection. However, CLVAs are generally protected within the framework of the Provincial Parks and Conservation Reserves Act. In the assessment, CLVA, types were assigned as either upland or wetland, depending on their vegetation type.
Unlike other terrestrial features assessed in the criteria, CLVAs are assessed at the ecodistrict scale in which they are managed. Given the large size of the area, CLVAs are assessed at a Base Case that is based on raw data received from MNRF, and therefore disturbances are not buffered as they are when developing Base Case for other terrestrial features. As well, there is no assessment of the cumulative effects on the CLVA because of the large area encompassed by the ecodistricts that intersect with the LSA, which would result in a false representation of the RFD projects included in the cumulative effects assessment.
June 2017 Project No. 1535751 6-10
ENVIRONMENTAL ASSESSMENT REPORT FOR THE PHASE 1 NEW TRANSMISSION LINE TO PICKLE LAKE PROJECT SECTION 6.0: BIOLOGICAL ENVIRONMENT BASE CASE AND EFFECTS ASSESSMENT
The following parameters were used to determine changes in CLVA and were assessed as part of the ecosystem availability and ecosystem distribution indicators:
CLVA availability: measured quantitatively (i.e., hectares) as the change in the availability (amount) of the feature in the ecodistricts that intersect with the local study area (LSA) due to physical disturbance from the Preliminary Proposed Corridor and corridor alternatives.
CLVA distribution: measured qualitatively as the change in spatial arrangement of the feature in the ecodistricts that intersect with the LSA due to the Preliminary Proposed Corridor and corridor alternatives.
6.1.4 Assessment Boundaries 6.1.4.1 Temporal Boundaries The Project is planned to occur during two stages:
Construction stage: the period from the start of construction to the start of operation (approximately 18 to 24 months); and,
Operation and maintenance stage: encompasses operation and maintenance activities throughout the life of the Project.
The assessment of the Project on upland, wetland, and riparian ecosystems considers effects that occur during the construction and operation and maintenance stages. These periods are sufficient to capture the effects of the Project.
6.1.4.2 Spatial Boundaries Spatial boundaries for the assessment of the Project are provided in Table 6.1-3 and shown on Figure 6.1-1.
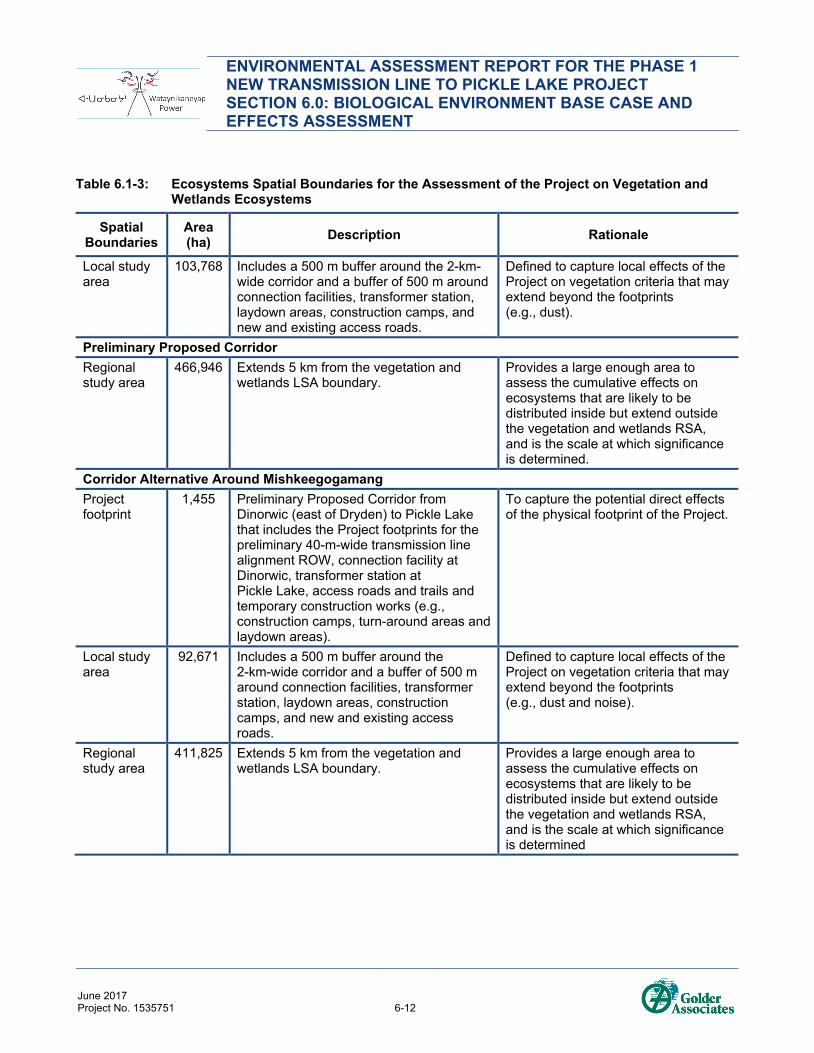
Table 6.1-3: Ecosystems Spatial Boundaries for the Assessment of the Project on Vegetation and Wetlands Ecosystems
Spatial Boundaries
Area (ha) Description Rationale
Preliminary Proposed Corridor Project footprint
1,630 Preliminary Proposed Corridor from Dinorwic (east of Dryden) to Pickle Lake that includes the Project footprints for the preliminary 40-m-wide transmission line alignment ROW, connection facility at Dinorwic, transformer station at Pickle Lake, access roads and trails and temporary construction works (e.g., construction camps, turn-around areas and laydown areas)
To capture the potential direct effects of the physical footprint of the Project.
June 2017 Project No. 1535751 6-11
ENVIRONMENTAL ASSESSMENT REPORT FOR THE PHASE 1 NEW TRANSMISSION LINE TO PICKLE LAKE PROJECT SECTION 6.0: BIOLOGICAL ENVIRONMENT BASE CASE AND EFFECTS ASSESSMENT
Table 6.1-3: Ecosystems Spatial Boundaries for the Assessment of the Project on Vegetation and Wetlands Ecosystems
Spatial Boundaries
Area (ha) Description Rationale
Local study area
103,768 Includes a 500 m buffer around the 2-km-wide corridor and a buffer of 500 m around connection facilities, transformer station, laydown areas, construction camps, and new and existing access roads.
Defined to capture local effects of the Project on vegetation criteria that may extend beyond the footprints (e.g., dust).
Preliminary Proposed Corridor Regional study area
466,946 Extends 5 km from the vegetation and wetlands LSA boundary.
Provides a large enough area to assess the cumulative effects on ecosystems that are likely to be distributed inside but extend outside the vegetation and wetlands RSA, and is the scale at which significance is determined.
Corridor Alternative Around Mishkeegogamang Project footprint
1,455 Preliminary Proposed Corridor from Dinorwic (east of Dryden) to Pickle Lake that includes the Project footprints for the preliminary 40-m-wide transmission line alignment ROW, connection facility at Dinorwic, transformer station at Pickle Lake, access roads and trails and temporary construction works (e.g., construction camps, turn-around areas and laydown areas).
To capture the potential direct effects of the physical footprint of the Project.
Local study area
92,671 Includes a 500 m buffer around the 2-km-wide corridor and a buffer of 500 m around connection facilities, transformer station, laydown areas, construction camps, and new and existing access roads.
Defined to capture local effects of the Project on vegetation criteria that may extend beyond the footprints (e.g., dust and noise).
Regional study area
411,825 Extends 5 km from the vegetation and wetlands LSA boundary.
Provides a large enough area to assess the cumulative effects on ecosystems that are likely to be distributed inside but extend outside the vegetation and wetlands RSA, and is the scale at which significance is determined
June 2017 Project No. 1535751 6-12
ENVIRONMENTAL ASSESSMENT REPORT FOR THE PHASE 1 NEW TRANSMISSION LINE TO PICKLE LAKE PROJECT SECTION 6.0: BIOLOGICAL ENVIRONMENT BASE CASE AND EFFECTS ASSESSMENT
Table 6.1-3: Ecosystems Spatial Boundaries for the Assessment of the Project on Vegetation and Wetlands Ecosystems
Spatial Boundaries
Area (ha) Description Rationale
Corridor Alternative Through Mishkeegogamang Project footprint
1,445 Preliminary Proposed Corridor from Dinorwic (east of Dryden) to Pickle Lake that includes the Project footprints for the preliminary 40-m-wide transmission line alignment ROW, connection facility at Dinorwic, transformer station at Pickle Lake, access roads and trails and temporary construction works (e.g., construction camps, turn-around areas and laydown areas).
To capture the potential direct effects of the physical footprint of the Project.
Local study area
91,182 Includes a 500 m buffer around the 2-km-wide corridor and a buffer of 500 m around connection facilities, transformer station, laydown areas, construction camps, and new and existing access roads.
Defined to capture local effects of the Project on vegetation criteria that may extend beyond the footprints (e.g., dust and noise)
Regional study area
399,220 Extends 5 km from the vegetation and wetlands LSA boundary.
Provides a large enough area to assess the cumulative effects on ecosystems that are likely to be distributed inside but extend outside the vegetation and wetlands RSA, and is the scale at which significance is determined
Note: LSA = local study area; RSA = regional study area; km= kilometre; m = metre; ha = hectare.
June 2017 Project No. 1535751 6-13
ENVIRONMENTAL ASSESSMENT REPORT FOR THE PHASE 1 NEW TRANSMISSION LINE TO PICKLE LAKE PROJECT SECTION 6.0: BIOLOGICAL ENVIRONMENT BASE CASE AND EFFECTS ASSESSMENT
") First Nation CommunityRailwayRoadHighwayWaterbodyProvincial ParkConservation ReserveFirst Nations Reserve
Utility LinesExisting ElectricalTransmission LineNatural Gas Pipeline
Vegetation and WetlandsLocal Study AreaVegetation and WetlandsRegional Study AreaForest Management Unit PHASE 1 NEW TRANSMISSION LINE TO PICKLE LAKE PROJECT
1. THIS FIGURE IS TO BE READ IN CONJUNCTION WITH ACCOMPANYING TEXT.2. ALL LOCATIONS ARE APPROXIMATE.3. NOT FOR ENGINEERING PURPOSES.
NOTE(S)
DRAFT
ENVIRONMENTAL ASSESSMENT REPORT FOR THE PHASE 1 NEW TRANSMISSION LINE TO PICKLE LAKE PROJECT SECTION 6.0: BIOLOGICAL ENVIRONMENT BASE CASE AND EFFECTS ASSESSMENT
This page intentionally left blank
June 2017 Project No. 1535751 6-16
ENVIRONMENTAL ASSESSMENT REPORT FOR THE PHASE 1 NEW TRANSMISSION LINE TO PICKLE LAKE PROJECT SECTION 6.0: BIOLOGICAL ENVIRONMENT BASE CASE AND EFFECTS ASSESSMENT
6.1.5 Description of the Existing Environment (Base Case) 6.1.5.1 Methods For each vegetation and wetlands criterion and the Preliminary Proposed Corridor and corridor alternatives, a description of the existing environment was used to provide context for the assessment. Existing conditions identified in the Base Case are the outcome of past and present developments and activities, and natural factors that cause environmental change (Section 4.4). Consequently, the Base Case describes the current environmental conditions of each criterion given the cumulative effects of past and present developments and activities.
The Base Case considered each indicator for each criterion. The importance of cumulative changes from past and present developments depends on how they have affected the integrity of each ecosystem. The Base Case assessment seeks to understand the status of upland, riparian and wetland ecosystems in the regional study area (RSA), which provides context for understanding the sensitivity of each criterion to future development. The status of each criterion was considered using the known or inferred ability of the criterion to tolerate disturbance.
The ability of a criterion to accommodate disturbance was evaluated using the concept of ecological resilience. Ecosystem resilience is the capacity of an ecosystem to cope with disturbances without shifting into a qualitatively different state (Holling 1973). A resilient ecosystem can tolerate change and, if disturbed, can renew itself. This renewal can be accelerated with reclamation practices if biodiversity is considered during the planning process. If an ecosystem has limited resilience, it is vulnerable to the effects of disturbance such that it may shift into a different state and become functionally different (Folke et al. 2004). Ecosystem resilience can vary by criterion and this variation has important implications for assessing effects on ecosystem function (Elmqvist et al. 2003, Folke et al. 2004, Peterson et al. 1998).
Most ecosystems can adapt to or otherwise accommodate some changes without effects on the functional state of the system, and some changes to ecosystem availability, distribution, or composition would have little effect on self-sustaining and ecologically effective ecosystems (Swift and Hannon 2010). For example, ecosystem function could be maintained with the loss of species (i.e., substantial effect on the species), if there is redundancy in the contribution that species makes to the system (i.e., compensation by other members of a functional group) (Folke et al. 2004, Peterson et al. 1998). Changes to other species may have strong effects on ecosystem structure and function (Elmqvist et al. 2003, Folke et al. 2004, and Soulé et al. 2003). Potential Project effects on species of use by Aboriginal communities is discussed in further detail in Section 8.0 Aboriginal and Treaty Rights and Interests. While, no protected vegetation species (i.e., species designated as either threatened or endangered under the provisions of the Endangered Species Act) have been identified as having potential to occur in the RSA, impact management measures have been identified to help avoid or minimize Project effects to rare species, such as tinged sedge (Carex tincta). Section 9.3.1.6 of the draft ESMP provides details on these impact management measures.
Ideally, effect threshold values and resilience limits of an ecosystem are known, and changes in indicators can be quantified accurately with a high degree of confidence to evaluate whether or not a threshold has been exceeded. However, critical thresholds such as amount or distribution of ecosystems required to maintain function, or the ability of an ecosystem to accommodate changes in composition, are rarely available for ecosystem criteria. Moreover, ecological thresholds vary by species, landscape type, and spatial scale (Environment Canada 2013, Swift and Hannon 2010). Consequently, a detailed and transparent account of predicted effects associated with
June 2017 Project No. 1535751 6-17
ENVIRONMENTAL ASSESSMENT REPORT FOR THE PHASE 1 NEW TRANSMISSION LINE TO PICKLE LAKE PROJECT SECTION 6.0: BIOLOGICAL ENVIRONMENT BASE CASE AND EFFECTS ASSESSMENT
estimated combined changes to each indicator were provided for each criterion in the Base Case using available scientific literature, data collected in the RSAs, and logical reasoning (i.e., a weight of evidence, or reasoned narrative approach).
6.1.5.1.1 Baseline Field Surveys and Regional Data Collection Existing conditions are characterized using baseline field surveys, data available from the MNRF, FMPs, caribou IRAs, Land Cover 2000 mapping, FRI mapping, and through available literature relevant to upland, wetland and riparian ecosystems in the LSA and RSA (e.g., FMPs). Baseline field surveys were conducted on the Preliminary Proposed Corridor and LSA (Appendix 6.1B). The following field programs were completed: aerial reconnaissance surveys in April 2012, ground reconnaissance surveys in June 2012, and detailed vegetation community and rare plant surveys in September 2012. Data collected during the 2012 field programs were extrapolated to provide an understanding of conditions present along the corridor alternatives. Using this approach provides a coarse filter with which to select the most appropriate route. This limitation is considered in the Prediction Confidence Section 6.1.11 below.
6.1.5.1.1.1 Previous and Existing Disturbances Total disturbance (area and percentage) in the LSA and RSAs for the Preliminary Proposed Corridor and corridor alternatives were calculated from a disturbance layer that was created using available data from the MNRF, MNDM (Ministry of Northern Development and Mines), FRI, and Land Cover 2000. Disturbances were classified as either linear (e.g., roads, transmission lines, rail lines), polygonal (e.g., cutblocks, urban development), or points (e.g., exploration drill holes). Point and linear anthropogenic disturbances were buffered in a Geographic Information System (GIS) to create footprints for each disturbance and to calculate the area and percentage of human disturbance in the RSAs and LSAs.
Table 6.1-4: Footprints for Developments in the Vegetation and Wetlands Local and Regional Study Areas
Type of Development Feature Type
Footprint Radius or Corridor(a)
(m)
Rural freeway, 4-lane divided highway linear 100 Rural arterial undivided highway linear 60 Rural collector undivided road, ramp linear 46 Rural local undivided road, street linear 20 Rural resource road linear 20 Recreation road linear 20 Service road linear 20 Forestry road linear 20 Winter road linear 20 Existing access road linear 20 Railway linear 7.5 Pipeline linear 12 Settlement/infrastructure polygon actual footprint
June 2017 Project No. 1535751 6-18
ENVIRONMENTAL ASSESSMENT REPORT FOR THE PHASE 1 NEW TRANSMISSION LINE TO PICKLE LAKE PROJECT SECTION 6.0: BIOLOGICAL ENVIRONMENT BASE CASE AND EFFECTS ASSESSMENT
Table 6.1-4: Footprints for Developments in the Vegetation and Wetlands Local and Regional Study Areas
Type of Development Feature Type
Footprint Radius or Corridor(a)
(m)
Unclassified polygon actual Mineral exploration – drill holes point 12.5 Aggregate site (active and inactive) polygon actual footprint Mine polygon actual footprint Airport polygon actual footprint Building, cottage, residential site, recreation camp polygon actual footprint Recreation point, trapper cabin point 5 Building, cottage, residential site polygon actual footprint Tourism establishment area polygon actual footprint Communication/fire tower point 21 Transmission line connection facility or transformer station point 77 Transmission line linear 40 Power generation station point 37 Work camp point 100 Tank polygon actual footprint Waste management site polygon actual footprint Forest processing facility point 310 Recent harvested (logged) area polygon actual footprint Dam/barrier point 50 Thermal facility polygon actual footprint
Notes: A radius was applied to point features and a corridor was applied to line features. m = metres.
6.1.5.1.2 Ecosystem Mapping Upland Ecosystem Mapping Upland ecosystems (or land cover classes) were mapped as polygons using Land Cover 2000 data provided by the MNRF that were available across the LSAs and RSAs. Definitions and descriptions of the soils and vegetation associated with land cover class codes are found in Appendix 6.1C. Below is a list of land cover classes (and soil types) associated with upland ecosystems:
Bedrock;
Forest - dense coniferous (Podzols and Brunisols);
Forest - dense deciduous (Luvisols);
Forest - dense mixed (Luvisols and Podzols);
June 2017 Project No. 1535751 6-19
ENVIRONMENTAL ASSESSMENT REPORT FOR THE PHASE 1 NEW TRANSMISSION LINE TO PICKLE LAKE PROJECT SECTION 6.0: BIOLOGICAL ENVIRONMENT BASE CASE AND EFFECTS ASSESSMENT
Forest - regenerating depletion; and
Coniferous Forest (Luvisols and Podzols).
Wetland Ecosystem Mapping Wetland ecosystems (or land cover classes) were mapped as polygons using Land Cover 2000 data provided by the MNRF that were available across the Preliminary Proposed Corridor and corridor alternative LSAs and RSAs. Definitions and descriptions of the soils and vegetation associated with land cover class codes are found in Appendix 6.1C.
Wetlands in the study area were mapped as either bogs or fens. It is likely that mineral wetlands also exist in the study areas; however, due to the Land Cover 2000 scale of mapping, small mineral wetlands are not discernible in the mapped landscape. This uncertainty is inherent in the assessment (i.e., low level of confidence regarding predicted effects to particular wetland types), but can be reduced during construction monitoring (i.e., wetlands confirmed to be disturbed by the Project can be field-verified as peat or mineral wetlands). Below is a list of land cover classes (and soil types) associated with wetland ecosystems:
Bog – open (Mesisols);
Bog – treed (Mesisols);
Fen – open (Mesisols); and
Fen – treed (Mesisols).
Riparian Ecosystem Mapping Riparian habitat is a transition zone between aquatic and terrestrial ecosystems (Austin et al. 2008) and is defined as areas adjacent to rivers and lakes, or ephemeral, intermittent, or perennial streams that differ from surrounding uplands in plant and animal diversity and productivity (Environment Canada 2013). Riparian areas support important biodiversity functions as they provide unique habitat for plants, invertebrates, fish, amphibians, birds (e.g., ducks and geese) and mammals. Riparian zones often function as regional wildlife movement corridors linking otherwise unconnected habitats. While these areas represent a small portion of a given watershed and are not listed as a specific fish habitat, they provide "natural features, functions and conditions that support fish life processes and protect fish habitat as defined by the Fisheries Act" (MNR 2010).
The Natural Heritage Reference Manual for Natural Heritage Policies of the Provincial Policy Statement recommends a minimum distance of 15 to 30 m of naturally vegetated cover adjacent to fish habitat to maintain ecosystem function (MNR 2010). Similarly, Environment Canada (2013) recommends that streams be buffered by 30 m of naturally vegetated riparian area on both sides. In these buffers, vegetation communities maintain aquatic ecosystems by moderating temperature through shading, filtering sediments and nutrients, providing food through leaf litter and organic matter, and influence the structure of watercourses and waterbodies through fallen woody material (Environment Canada 2013). Riparian habitat wider than 30 m may be required for the protection of movement corridors for certain wildlife species (Environment Canada 2013).
Stream order is a measure of the relative size of a natural watercourse. The smallest watercourse is referred to as a first order stream and generally comprises the headwaters of a river system. The stream order increases in the downstream direction as a one watercourse joins another in a river system. For this assessment, riparian areas
June 2017 Project No. 1535751 6-20
ENVIRONMENTAL ASSESSMENT REPORT FOR THE PHASE 1 NEW TRANSMISSION LINE TO PICKLE LAKE PROJECT SECTION 6.0: BIOLOGICAL ENVIRONMENT BASE CASE AND EFFECTS ASSESSMENT
were defined as all naturally vegetated areas within a 30 m buffer of the edges of watercourses of stream order 1, 2, 3, 4 and lakes. For stream orders 5 and 6, riparian buffers of 60 m were applied. The 30 m buffer criteria was assumed to represent an appropriate riparian zone width and is consistent with scientific literature and recommendations outlined by MNR (2010) and Environment Canada (2013). Because stream orders 5 and 6 are wider, a larger buffer was used to capture the expected riparian areas associated with these streams and potential wildlife movement corridors.
Potential riparian habitat was mapped across the LSAs and RSAs for the Preliminary Proposed Corridor and corridor alternatives using available MNRF data and applying 30 m and 60 m buffers, as described above. All watercourses (i.e., rivers and streams) and lakes available from the MNRF waterbody dataset were buffered at the centerline of watercourses and the edge of lakes using the applicable buffer widths. The buffer zone was then overlaid onto the RSA and LSA Land Cover 2000 map. All naturally vegetated land cover classes within the buffer zone were classified as having riparian habitat potential. Below is a list of the land cover classes with potential to be riparian habitat:
Forest – dense coniferous;
Forest – dense deciduous;
Forest – dense mixed;
Forest – regenerating depletion;
Coniferous Forest;
Bog – open;
Bog – treed;
Fen – open; and
Fen – treed.
Some areas with low amounts of disturbance would likely provide some riparian function in buffers. For the purposes of the assessment, Developed Agricultural Land and road ROW codes were conservatively classified as non-riparian. In reality these areas of the landscape would provide some riparian function, such as water filtration and erosion control along streambanks.
6.1.5.1.3 Regional-Level Description of Existing Soils Substrates are generally poorly developed and varied in RSAs for the Preliminary Proposed Corridor and corridor alternatives. Steep terrain yields rock outcrops with poor or no substrate development, with colluvium deposits located at toe slopes. Where rock is covered by a discontinuous layer of drift (alluvial, fluvial and glaciofluvial), soils are usually dominated by podzols (humo-ferric podzols) and brunisols (dystric and base-rich eutric brunisols). In neutral to calcareous areas, fine-textured materials (glaciolacustrine) and luvisols dominate. Organic peats (mesisols, and cryosols and fibrisols) and gleysols are found in poorly-drained sites and bedrock depressions (Crins et al. 2009).
Drainage ranges from rapidly drained bedrock through well-drained, coarse-textured soils to poorly and very poorly-drained organic soils in lower slope positions. Coarse-textured fluvial and glaciofluvial soils, with higher
June 2017 Project No. 1535751 6-21
ENVIRONMENTAL ASSESSMENT REPORT FOR THE PHASE 1 NEW TRANSMISSION LINE TO PICKLE LAKE PROJECT SECTION 6.0: BIOLOGICAL ENVIRONMENT BASE CASE AND EFFECTS ASSESSMENT
initial total porosity, are relatively resistant to compaction compared to finer textured soils found in other geographies (Carr et al. 1991). However, these soils are prone to wind erosion. Sandy textured soils typically do not have a well-developed soil structure. The lack of soil structure is due to limited soil aggregation or adhesion of the soil particles and therefore, does not form larger and more stable soil aggregates. Aggregated soil particles are less likely to be moved by wind. Soil erosion risk is a concern for disturbed soils because the sparse vegetation cover exposes soil materials to the elements (e.g., wind and water). A substantial proportion of the substrates in the RSAs exhibit a low to moderate ability to buffer the effects of acidic inputs because they originate from igneous rock, which has a low buffering capacity (Crins et al. 2009; Scott 1995).
6.1.5.2 Results 6.1.5.2.1 Upland Ecosystems 6.1.5.2.1.1 Ecosystem Availability Upland ecosystems provide a diversity of ecological structure and function for plants and wildlife occupying the landscape. The majority of the landscape across the LSAs and RSAs for the Preliminary Proposed Corridor and corridor alternatives is composed of coniferous, hardwood and mixed-wood forests, and smaller amounts of scattered bedrock. Coniferous forests are typically dominated by black spruce (Picea mariana), Jack pine (Pinus banksiana) and white spruce (Picea glauca) (Crins et al. 2009, MNRF 2014). Deciduous forests are composed primarily of trembling aspen (Populus tremuloides) and sometimes balsam poplar (Populus balsamifera) in richer lowland areas (Crins et al. 2009, MNRF 2014). Other tree species found within the region but less commonly include white cedar (Thuja occidentalis), balsam fir (Abies balsamnea), black ash (Fraxinus nigra), red pine (Pinus resinosa), white pine (Pinus strobus), white birch (Betula papyrifera) and tamarack (Larix laricina). The areas of land cover classes in the upland ecosystem in the Base Case are provided in Appendix 6.1D. A summary of upland ecosystem availability for each of the proposed routing options is provided in Table 6.1-5 and upland ecosystem features are summarized in Table 6.1-6, below.
June 2017 Project No. 1535751 6-22
ENVIRONMENTAL ASSESSMENT REPORT FOR THE PHASE 1 NEW TRANSMISSION LINE TO PICKLE LAKE PROJECT SECTION 6.0: BIOLOGICAL ENVIRONMENT BASE CASE AND EFFECTS ASSESSMENT
Table 6.1-5: Upland Ecosystems Availability in the Base Case Local and Regional Study Areas by Corridor
Upland Type
Preliminary Proposed Corridor Corridor Alternative Around Mishkeegogamang
Corridor Alternative Through Mishkeegogamang
Local Study Area Regional Study Area Local Study Area Regional Study Area Local Study Area Regional Study Area
Total 77,579 74.8 340,753 73.0 66,868 72.2 282,738 68.7 64,759 71.0 274,067 68.7 Note: Some numbers are rounded for presentation purposes. Therefore, it may appear that the totals do not equal the sum of the individual values. Cutblocks and burns are less than or equal to 40 years of age. ha = hectare; % = percent.
June 2017 Project No. 1535751 6-23
ENVIRONMENTAL ASSESSMENT REPORT FOR THE PHASE 1 NEW TRANSMISSION LINE TO PICKLE LAKE PROJECT SECTION 6.0: BIOLOGICAL ENVIRONMENT BASE CASE AND EFFECTS ASSESSMENT
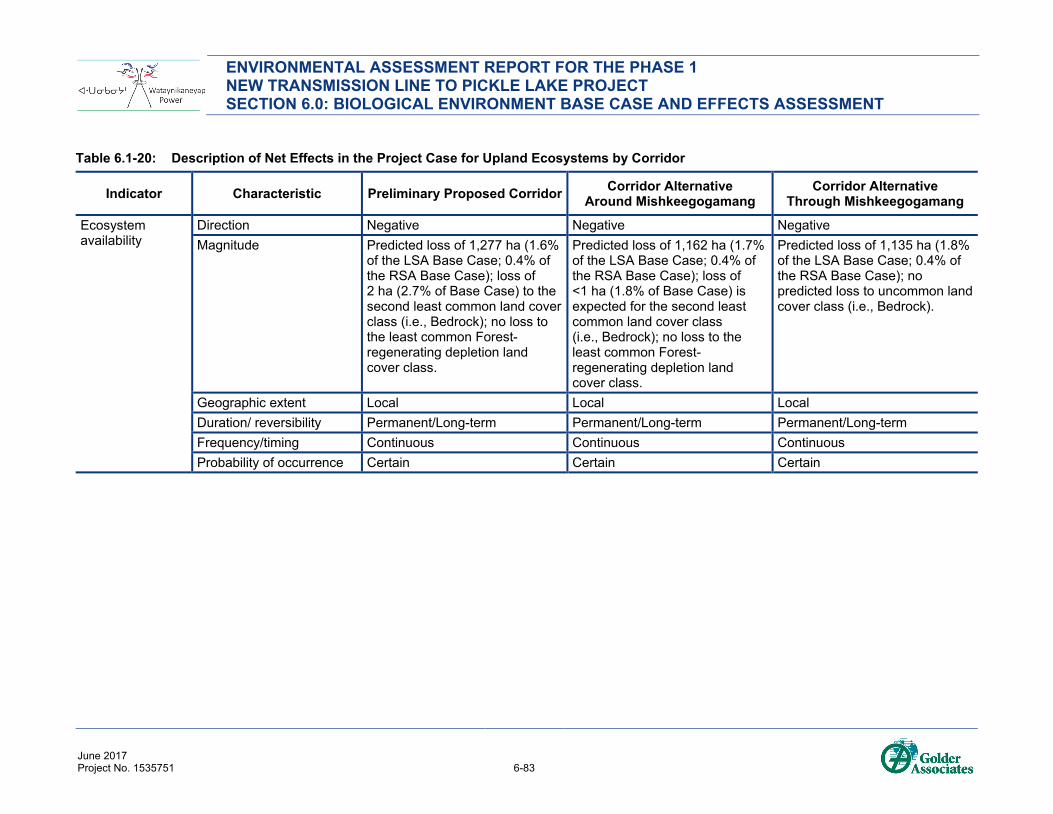
Table 6.1-6: Summary of Upland Ecosystem Features for the Preliminary Proposed Corridor, Corridor Alternative Around Mishkeegogamang and Corridor Alternative Through Mishkeegogamang
Feature Preliminary Proposed Corridor Corridor Alternative Around
Mishkeegogamang Corridor Alternative Through
Mishkeegogamang
LSA RSA LSA RSA LSA RSA
Upland Ecosystem Availability (% of study area)
74.8 73.0 72.2 68.7 71.0 68.7
Most Common Upland Class
Forest – dense coniferous
Forest – dense coniferous
Forest – dense coniferous
Forest – dense coniferous
Forest – dense coniferous
Forest – dense coniferous
Least Common Upland Class
Forest – regenerating
depletion Bedrock
Forest – regenerating
depletion Bedrock Bedrock Bedrock
Proportion of upland ecosystems made up of forested areas (% of upland areas)
Most common age(b) Mature Mature Mature Mature Mature Mature Least common age(b) Pre-sapling Pre-sapling Pre-sapling Pre-sapling Pre-sapling Pre-sapling Rare upland vegetation communities (%)(c) <0.1 <0.1 n/a n/a n/a n/a
ANSIs n/a n/a n/a n/a n/a n/a Notes: a) Excludes cutblocks. b) Mature = 81 to 110 years; pre-sapling = 0 to 10 years. c) NW30 was the only rare upland vegetation community identified. ANSI = Area of Natural and Scientific Interest; LSA = local study area; n/a = not present; RSA = regional study area; TBD = to be determined; < = less than.
June 2017 Project No. 1535751 6-24
ENVIRONMENTAL ASSESSMENT REPORT FOR THE PHASE 1 NEW TRANSMISSION LINE TO PICKLE LAKE PROJECT SECTION 6.0: BIOLOGICAL ENVIRONMENT BASE CASE AND EFFECTS ASSESSMENT
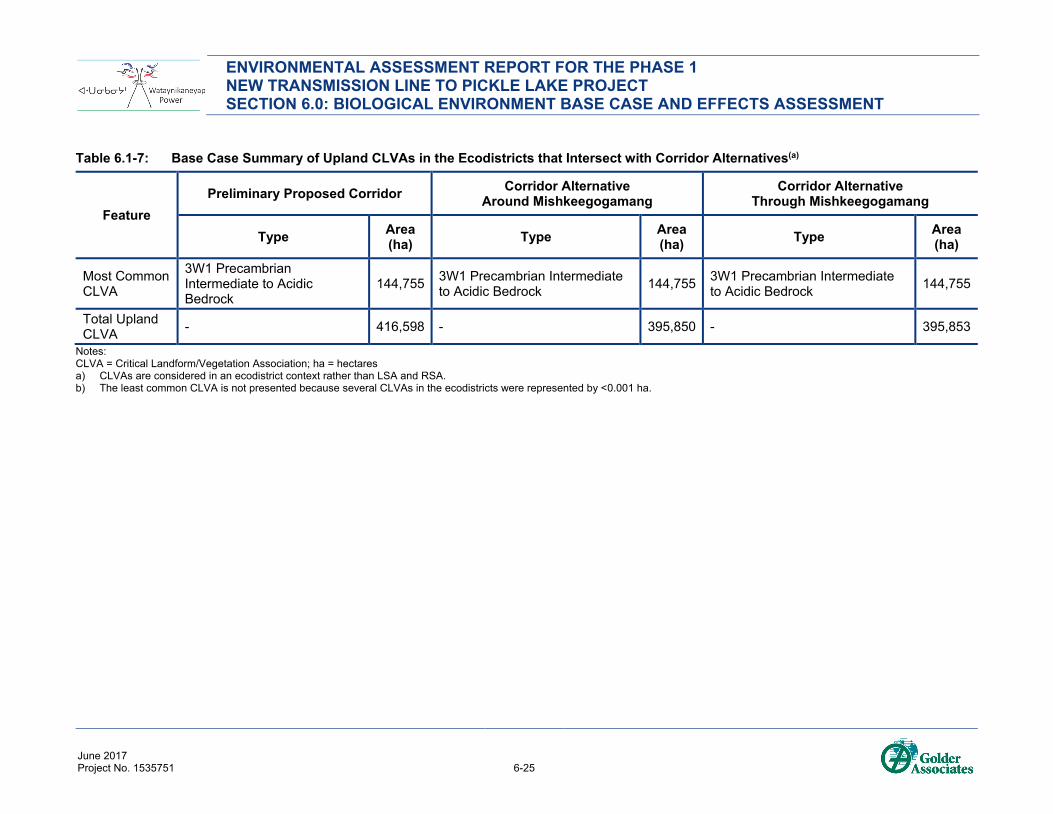
Table 6.1-7: Base Case Summary of Upland CLVAs in the Ecodistricts that Intersect with Corridor Alternatives(a)
Feature Preliminary Proposed Corridor Corridor Alternative
Notes: CLVA = Critical Landform/Vegetation Association; ha = hectares a) CLVAs are considered in an ecodistrict context rather than LSA and RSA. b) The least common CLVA is not presented because several CLVAs in the ecodistricts were represented by <0.001 ha.
June 2017 Project No. 1535751 6-25
ENVIRONMENTAL ASSESSMENT REPORT FOR THE PHASE 1 NEW TRANSMISSION LINE TO PICKLE LAKE PROJECT SECTION 6.0: BIOLOGICAL ENVIRONMENT BASE CASE AND EFFECTS ASSESSMENT
Preliminary Proposed Corridor
Below is a summary of availability of upland ecosystems in the LSA and RSA (Table 6.1-6; Figure 6.1-2 to Figure 6.1-5, Appendix 6.1A: Figures 6.1A-1, Appendix 6.1D):
Total uplands in the LSA – 77,579 ha (74.8%) composed of 58,606 ha (56.5%) of undisturbed, 5,436 ha (5.2%) burned and 13,537 ha (13.0%) cutblocks.
Total uplands in the RSA – 340,753 ha (73.0%) composed of 271,646 ha (58.2%) of undisturbed, 20,738 ha (4.4%) burned and 48,369 ha (10.4%) cutblocks.
Most common class – Forest – dense coniferous at 36,350 ha (35.0%) in the LSA and 154,404 ha (33.1%) in the RSA.
Least common classes – Forest – regenerating depletion at 6 ha (<0.1%) in the LSA and 10 ha (<0.1%) in the RSA; Bedrock at 64 ha (0.1%) in the LSA and 130 ha (<0.1%) in the RSA.
Forested upland areas account for 340,623 ha (>99.9% of upland ecosystems), while non-forested areas (i.e., bedrock) account for 130 ha (<0.1% of uplands) of the RSA.
Existing anthropogenic disturbance (e.g., roads, utility lines, mines, agriculture and urban settlements), excluding cutblocks, in the LSA is 2,836 ha (2.7%) and 9,818 ha (2.1%) in the RSA.
Figure 6.1-2: Aerial Photo of Regeneration After
Forest Harvesting Operations Along the Preliminary Proposed Corridor (Golder 2012)
Figure 6.1-3: Aerial Photo of Forest Harvesting Operations Which Experience Forest Fire Along the Preliminary Proposed Corridor (Golder 2012)
June 2017 Project No. 1535751 6-26
ENVIRONMENTAL ASSESSMENT REPORT FOR THE PHASE 1 NEW TRANSMISSION LINE TO PICKLE LAKE PROJECT SECTION 6.0: BIOLOGICAL ENVIRONMENT BASE CASE AND EFFECTS ASSESSMENT
Figure 6.1-4: Aerial Photo of Forestry Harvesting
Operations Along the Preliminary Proposed Corridor (Golder 2012)
Figure 6.1-5: Aerial Photo of Forestry Harvesting Operations Along the Preliminary Proposed Corridor (Golder 2012)
Corridor Alternative Around Mishkeegogamang
Below is a summary of availability of upland ecosystems in the LSA and RSA (Table 6.1-6; Appendix 6.1A, Figures 6.1A-2; Appendix 6.1D):
Total in the LSA – 66,868 ha (72.2%) composed of 45,628 ha (49.2%) of undisturbed, 13,457 ha (14.5%) burned and 7,782 ha (8.4%) cutblocks.
Total in the RSA – 282,738 ha (68.7%) composed of 202,659 ha (49.2%) of undisturbed, 47,224 ha (11.5%) burned and 32,855 ha (8.0%) cutblocks.
Most common class – Forest – dense coniferous at 30,568 ha (33.0%) in the LSA and 131,319 ha (31.9%) in the RSA.
Least common classes – Forest – regenerating depletion at 8 ha (<0.1%) in the LSA and 155 ha (<0.1%) in the RSA; Bedrock at 24 ha (<0.1%) in the LSA and 149 ha (<0.1%) in the RSA.
Forested upland areas account for 282,589 ha (99.9% of upland ecosystems), while non-forested areas (i.e., bedrock) account for 149 ha (0.1% of uplands) of the RSA.
Existing anthropogenic disturbance (e.g., roads, utility lines, mines and urban settlements), excluding cutblocks, in the LSA is 4,262 ha (4.6%) and in the RSA is 9,736 ha (2.4%).
June 2017 Project No. 1535751 6-27
ENVIRONMENTAL ASSESSMENT REPORT FOR THE PHASE 1 NEW TRANSMISSION LINE TO PICKLE LAKE PROJECT SECTION 6.0: BIOLOGICAL ENVIRONMENT BASE CASE AND EFFECTS ASSESSMENT
Corridor Alternative Through Mishkeegogamang
Below is a summary of availability of upland ecosystems in the LSA and RSA (Table 6.1-6; Appendix 6.1A, Figures 6.1A-3; Appendix 6.1D):
Total in the LSA – 64,759 ha (71.0%) composed of 43,273 ha (47.5%) of undisturbed, 13,684 ha (15.0%) burned and 7,803 ha (8.6%) cutblocks.
Total in the RSA – 274,067 ha (68.7%) composed of 192,123 ha (48.1%) of undisturbed, 48,300 ha (12.1%) burned and 33,644 ha (8.4%) cutblocks.
Most common class – Forest – dense coniferous at 29,122 ha (31.9%) in the LSA and 127,536 ha (31.9%) in the RSA.
Least common class – Bedrock at 29 ha (<0.1%) in the LSA and 148 ha (<0.1%) in the RSA.
Forested upland areas account for 273,919 ha (99.9% of upland ecosystems), while non-forested areas (i.e., bedrock) account for 148 ha (0.1% of uplands) of the RSA.
Existing anthropogenic disturbance (e.g., roads, utility lines, mines and urban settlements), excluding cutblocks, in the LSA is 4,830 ha (5.3%) and in the RSA is 9,969 ha (2.5%).
Seral Stages The age of forests across the study areas are variable. For this analysis, the amount of each forest seral stage (i.e., forest stand age [stage] and structure) found in the study areas includes upland and wetland ecosystems. Seral stage totals include only those portions of land with the potential to be treed and do not account for areas of the land where forest would not form (e.g., human infrastructure and sites with conditions that do not favour forests such as bedrock). These portions of the landscape without potential for forests are not suitable for tree growth often because conditions are either too dry to feed tree roots or too wet for trees to establish as is the case with open water areas. Data for seral stages were not available over the entire LSAs and RSAs. Therefore values reported are for those areas with FRI coverage only (Table 6.1-8).
June 2017 Project No. 1535751 6-28
ENVIRONMENTAL ASSESSMENT REPORT FOR THE PHASE 1 NEW TRANSMISSION LINE TO PICKLE LAKE PROJECT SECTION 6.0: BIOLOGICAL ENVIRONMENT BASE CASE AND EFFECTS ASSESSMENT
Table 6.1-8: Forest Resource Inventory Coverage within the Regional and Local Study Areas
Forest Management Unit
Preliminary Proposed Corridor Corridor Alternative Around Mishkeegogamang
Corridor Alternative Through Mishkeegogamang
Local Study Area
Regional Study Area Local Study Area Regional Study
Total 69,269 66.8 317,312 68.0 75,144 81.1 323,993 78.7 75,347 82.6 324,102 81.2 Note: Some numbers are rounded for presentation purposes. Therefore, it may appear that the totals do not equal the sum of the individual values. ha = hectares; % = percent.
June 2017 Project No. 1535751 6-29
ENVIRONMENTAL ASSESSMENT REPORT FOR THE PHASE 1 NEW TRANSMISSION LINE TO PICKLE LAKE PROJECT SECTION 6.0: BIOLOGICAL ENVIRONMENT BASE CASE AND EFFECTS ASSESSMENT
Below is a summary of the availability of seral stages in the LSAs and RSAs for the Preliminary Proposed Corridor and corridor alternatives (Table 6.1-9).
Preliminary Proposed Corridor
Most common age – mature (81 to 110 years) seral stage at 18,580 ha (31.8% of seral stages) of FRI data available in the LSA and 89,276 ha of FRI data available in the RSA (35.1% of seral stages).
Least common age in LSA – late-successional (111 years and older) seral stage at 2,970 ha in the LSA (5.1% of seral stages) and 16,148 ha in the RSA (6.4% of seral stages).
Least common age in RSA – pre-sapling (0 to 10 years) seral stage at 2,978 ha in the LSA (5.1% of seral stages) and 10,892 ha in the RSA (4.3% of seral stages).
Corridor Alternative Around Mishkeegogamang
Most common age - mature (81 to 110 years) seral stage at 21,360 ha in the LSA (36.7% of seral stages) and 84,326 ha in the RSA (35.4% of seral stages).
Least common age - pre-sapling (0 to 10 years) seral stage at 2,084 ha in the LSA (3.6% of seral stages) and 9,469 ha in the RSA (4.0% of seral stages).
Corridor Alternative Through Mishkeegogamang
Most common age - mature (81 to 110 years) seral stage at 21,052 ha in the LSA (36.4% of seral stages) and 83,006 ha in the RSA (35.1% of seral stages).
Least common age - pre-sapling (0 to 10 years) seral stage at 2,084 ha in the LSA (3.6% of seral stages) and 9,469 ha in the RSA (4.0% of seral stages).
June 2017 Project No. 1535751 6-30
ENVIRONMENTAL ASSESSMENT REPORT FOR THE PHASE 1 NEW TRANSMISSION LINE TO PICKLE LAKE PROJECT SECTION 6.0: BIOLOGICAL ENVIRONMENT BASE CASE AND EFFECTS ASSESSMENT
Table 6.1-9: Structural Stages in the Base Case Local and Regional Study Areas by Corridor
Seral Stage
Preliminary Proposed Corridor Corridor Alternative Around Mishkeegogamang
Corridor Alternative Through Mishkeegogamang
Local Study Area Regional Study Area Local Study Area Regional Study
Total 58,513 100.0 254,233 100.0 58,242 100.0 237,925 100.0 57,800 100.0 236,478 100.0 Notes: This summary is derived only from the areas that have FRI coverage. Some numbers are rounded for presentation purposes. Therefore, it may appear that the totals do not equal the sum of the individual values. Seral stage totals are based on upland and wetland ecosites identified as Forest (FOR) only from the FRI as age classes are not provided for other polytypes in the FRI. ha = hectare; % = percent.
June 2017 Project No. 1535751 6-31
ENVIRONMENTAL ASSESSMENT REPORT FOR THE PHASE 1 NEW TRANSMISSION LINE TO PICKLE LAKE PROJECT SECTION 6.0: BIOLOGICAL ENVIRONMENT BASE CASE AND EFFECTS ASSESSMENT
Rare Vegetation Communities Rare vegetation communities have not been mapped by MNRF in the LSAs or RSAs. However, the MNRF communicated that vegetation communities with bur oak are rare on the regional landscape and are to be considered as rare vegetation communities for the Project (MNRF 2017 pers comm.). According to the Field Guide to the Forest Ecosystem Classification for Northwestern Ontario, Northwest Science and Technology (NWST) Field Guide FG-03 (Sims et al. 1997), there are two vegetation type codes that pertain to bur oak stands: V3.2 – Other Hardwoods and Mixedwoods and V3.3 – Upland Bur Oak. Bur oak vegetation types can be found in the upland ecosite, NW30 (i.e., ES30) Black Ash Hardwood: Fresh, Silty-Clayey Soil, according to the Terrestrial and Wetland Ecosites of Northwestern Ontario, NWST Field Guide FG-02 (Racey et al. 1996).
Preliminary Proposed Corridor
There is 39 ha (<0.1%) of the NW30 ecosite within the LSA and 141 ha (<0.1%) within the RSA.
Corridor Alternative Around Mishkeegogamang
The NW30 ecosite is not found within the LSA or RSA of the Corridor Alternative Around Mishkeegogamang.
Corridor Alternative Through Mishkeegogamang
The NW30 ecosite is not found within the LSA or RSA of the Corridor Alternative Through Mishkeegogamang.
Areas of Natural and Scientific Interest Areas of Natural and Scientific Interest are “areas of land and water containing natural landscapes or features that have been identified as having life science or earth science values related to protection, scientific study or education” (MNR 2010). There are no recorded ANSIs in the Preliminary Proposed Corridor and corridor alternatives LSAs and RSAs.
Critical Landform/Vegetation Associations Critical Landform/Vegetation Associations are areas identified as unique habitat because of the combination of unique landforms and specific vegetation communities. Landform/Vegetation Associations are managed on an ecodistrict scale, whereby the minimum conservation targets are 1% or 50 ha of each LVA type (Davis et al. 2006). Landform/Vegetation Association types that do not achieve this minimum target are referred to as “gaps” if they are identified outside of provincial parks and other conservation area. Landform/Vegetation Associations that do not achieve this minimum target, but that are located within provincial parks and other conservation areas are referred to as CLVAs. Gaps have no legislative protection. However, CLVAs are generally protected within the framework of the Provincial Parks and Conservation Reserves Act.
Below is a summary of the availability of upland CLVAs in the ecodistricts that intersect with the LSAs for the Preliminary Proposed Corridor and corridor alternatives.
Preliminary Proposed Corridor
Total of 573,654 ha of CLVA in the ecodistricts that intersect with the Primary Corridor, of which 416,598 ha (72.6%) are found in upland ecosystems.
Most common CLVA – Precambrian Intermediate to Acid Bedrock land form associated with the Coniferous Treed vegetation type in the 3W1 ecodistrict at 144,755 ha.
Several CLVAs in the ecodistricts that intersect with the Primary Corridor are represented by <0.001 ha.
June 2017 Project No. 1535751 6-32
ENVIRONMENTAL ASSESSMENT REPORT FOR THE PHASE 1 NEW TRANSMISSION LINE TO PICKLE LAKE PROJECT SECTION 6.0: BIOLOGICAL ENVIRONMENT BASE CASE AND EFFECTS ASSESSMENT
Corridor Alternative Around Mishkeegogamang
Total of 547,100 ha of CLVA in the ecodistricts that intersect with the corridor alternative around Mishkeegogamang, of which 395,850 ha (72.4%) are found in upland ecosystems.
Most common CLVA – Precambrian Intermediate to Acidic Bedrock land form associated with the Coniferous Treed vegetation type in the 3W1 ecodistrict at 144,755 ha.
Several CLVAs in the ecodistricts that intersect with the corridor alternative around Mishkeegogamang, are represented by <0.001 ha.
Corridor Alternative Through Mishkeegogamang
Total of 547,100 ha of CLVA in the ecodistricts that intersect with the corridor alternative through Mishkeegogamang, of which 395,853 ha (72.4%) are found in upland ecosystems.
Most common CLVA – Precambrian Intermediate to Basic Bedrock land form associated with the Coniferous Treed vegetation type in the 3W1 ecodistrict at 144,755 ha.
Several CLVAs in the ecodistricts that intersect with the corridor alternative through Mishkeegogamang, are represented by <0.001 ha.
The Base Case upland CLVA availability is presented in Appendix 6.1E for the Preliminary Proposed Corridor, as well as the corridor alternatives. The Base Case was not calculated as the disturbance layer was unavailable for the area that includes the eight ecodistricts that intersect with the corridors.
Forest Management Plans and Other Factors of Change to Upland Ecosystems The LSAs and RSAs for the Preliminary Proposed Corridor and corridor alternatives overlap various Forest Management Units (FMUs), each with its own FMP. The FMPs describe historical forest conditions and management as well as future forest management plans for each unit. The following FMUs are found in the RSAs: Caribou, Dryden, English River, Lac Seul and Wabigoon (Figure 6.1-1). Below is a combined summary of the FMPs that overlap the RSAs, which provides natural forest structure patterns and the influences of human disturbance over approximately the past 150 years.
Upland forests are typically dominated by black spruce and Jack pine conifer stand and sometimes mixedwood stands. White spruce is also commonly a dominant component of coniferous forests in some FMUs (e.g., Dryden and English River). Northern FMUs are largely composed of black spruce stands, while Jack pine is more common in burned areas of the south. Hardwood stands (e.g., poplar, trembling aspen and white birch) and hardwood-dominated mixed stands are less common than coniferous stands and tend to occur along lakeshores and drainage areas where fire is less frequent. Other tree species found within the FMUs that are present but less common include white cedar, balsam fir, black ash, red pine, white pine and tamarack.
Historically the composition and structure of the boreal forest was primarily driven by wildfire, insect outbreaks, windthrow and disease, while more recently large-scale harvesting and controlled fire suppression play key roles in forest composition and structure. The fire cycles in the ecoregions are variable across the RSA depending on stand type. In coniferous pine stands, cycles range from 50 to 187 years, and fires are typically stand-replacing events (Crins et al. 2009). Mixed forest fire cycles range from 63 to 210 years, with variable intensities (Crins et al. 2009). Fire suppression over the last 60 years has prolonged the forest fire return cycle, leading to
June 2017 Project No. 1535751 6-33
ENVIRONMENTAL ASSESSMENT REPORT FOR THE PHASE 1 NEW TRANSMISSION LINE TO PICKLE LAKE PROJECT SECTION 6.0: BIOLOGICAL ENVIRONMENT BASE CASE AND EFFECTS ASSESSMENT
changes in the average age of the forest. Before fire suppression, the boreal forest complex of northwestern Ontario was approximately 30 years younger than it was during the 1970s (based on comparisons from Pikangikum to Pickle Lake between 1915 and 1974) (Carleton 2001).
Changes to forest composition and structure over more than 100 years have been greatly influenced by forest harvesting operations. The creation of forestry logging roads for access has contributed to increased forest fragmentation. Management practices have been introduced that have reduced the size of harvest blocks and provided forest buffer strips surrounding waterbodies. However, these management practices have also resulted in development of fragmented forest blocks and strips that are susceptible to windthrow damage.
Overall, fire suppression and selective harvesting practices lead to fragmented conditions and smaller, dispersed disturbances compared to larger burned areas that would have resulted historically. Thus, there tends to be fewer conifer species on the landscape and more mixed wood and broad-leaved forest. For example, white pine forests have converted to more shade tolerant broad-leaved species from a less frequent fire renewal. Climate change may exacerbate this scenario because longer summers favour the persistence of broad-leaved species and limit invasion of poplar stands by conifers (Carleton 2001). Species such as red oak and hemlock are also less frequent on the landscape as they do not regenerate easily. Even with an increased effort to plant or seed clearcuts with conifers, there is a shift from conifer to deciduous forests in Ontario (Carleton 2001).
Mining for gold, iron and base metals were historically important in the region. In most of the FMUs, there are relatively few active mines, while historic metal production has occurred and exploration is still ongoing. Aggregate extraction has and currently takes place in the majority of FMUs.
Other previous and existing disturbances to upland ecosystems include railways, towns and highways/roads, which increase access to natural resources. Fur traders from Europe established in the region in the late 1600s. With the construction and opening of the Canadian Pacific Railway in 1881 and the National Transcontinental Railway in 1907, large-scale development came to the region and established several communities. Non-industrial uses of Ontario forests include tourism, snowmobiling, fishing, hydro-generation facilities, hunting, trapping, and traditional uses by First Nations. Non-industrial uses of Ontario forests include tourism, snowmobiling, fishing, hydro-generation facilities, hunting, and trapping. Previous to European settlement, the upland ecosystems were under traditional use and management by Aboriginal communities.
June 2017 Project No. 1535751 6-34
ENVIRONMENTAL ASSESSMENT REPORT FOR THE PHASE 1 NEW TRANSMISSION LINE TO PICKLE LAKE PROJECT SECTION 6.0: BIOLOGICAL ENVIRONMENT BASE CASE AND EFFECTS ASSESSMENT
Caribou Integrated Range Assessments The LSAs and RSAs for the Preliminary Proposed Corridor and corridor alternatives overlap various Integrated Range Assessments (IRAs) for caribou ranges, which also overlap with the FMUs described above (MNRF 2014). The IRAs describe historical landscape conditions and management. The following caribou ranges are found in the RSAs: Brightsand, Churchill, and Kinloch (part of the Far North IRA). Below is a summary of the IRAs that overlap the LSAs and RSAs.
Brightsand Range 2011
Characterized by boreal forest with a frequent fire cycle with large and intense wildfires being common in the range. Other natural disturbance in the range includes forest blowdown.
Several small to medium-sized lakes are found scattered throughout the region.
Southern portion is dominated by Jack pine and black spruce forests, while the northern area is dominated by conifer and conifer-mixed forests.
Caribou use peatlands, lakes and old conifer forests.
There is a low density of small human settlements in the range including First Nations communities, railways, highways, fishing lodges, mining and exploration sites, and transmission lines. The largest and most influential disturbance has historically been and is currently from forest harvesting. Forest harvesting began in the 1950s and continues to present day. Forest harvesting was minimal from 1950 to the 1970s, but began to increase from the mid-1970s to the mid-1980s.
Soils in the range are often shallow and bedrock exposure is relatively common. Coarse and loamy soils are found at sites dominated by Jack pine and black spruce.
Churchill Range 2012
Characterized by boreal forest with a frequent fire cycle. Large and intense fires are common in the range. Other natural disturbance in the range includes forest blowdown.
Several small to large-sized lakes are found scattered throughout the region.
Historically and presenting, forest harvesting is the main form of disturbance in the range with greater harvesting in the southern portion compared to the northern portion. Forest harvesting began in 1925 and continues to present day within the range. Other human development includes mineral development, railways, highways, hydroelectric facilities, First Nation communities and transmission lines.
Far North Range 2013 (Kinloch Range portion overlaps with LSA and RSA)
The Kinloch Range has an aggressive fire cycle, isolated patches of peatlands and peatland complexes and many lakes. Disturbance from blowdown is also relatively common in the range.
Forests are mainly dominated by variable age Jack pine and black spruce stands with trembling aspen present on soils that allow growth.
Forest harvesting is less common in this range compared to the Churchill and Brightsand ranges. Other human disturbance includes First Nation communities, highways, mineral exploration and mining activities, transmission lines, hydroelectric facilities and winter roads.
June 2017 Project No. 1535751 6-35
ENVIRONMENTAL ASSESSMENT REPORT FOR THE PHASE 1 NEW TRANSMISSION LINE TO PICKLE LAKE PROJECT SECTION 6.0: BIOLOGICAL ENVIRONMENT BASE CASE AND EFFECTS ASSESSMENT
Summary Resilience of an ecosystem is influenced by species diversity, genetic variability, the presence of neighbouring species and ecosystems, and the size of the ecosystem (Thompson et al. 2009).Upland ecosystems are dynamic and naturally change over space and time, depending on disturbance regime. Most upland ecosystems have historically been common in the LSAs and RSAs, and the availability of upland forests, including mature and old growth forests, has almost certainly changed over time across the study areas.
For the Preliminary Proposed Corridor and corridor alternatives, uplands remain abundant across all of the RSAs despite changes from historical disturbances. Many of the upland vegetation communities identified are common to the region and have become adapted to low moisture and/or nutrient conditions and fire disturbance as part of their natural ecology (Scott et al.1995). Common upland ecosites are expected to have the capacity to adapt and be resilient to existing natural and human-related disturbances and associated variations in availability. Less commonly found upland ecosystems, such as the Bedrock land cover class in the Corridor Alternative Through Mishkeegogamang are likely less resilient and more susceptible to change. The small size, relative infrequency and slow growth of the Bedrock upland ecosystems account for the community’s depressed adaptive capacity.
6.1.5.2.1.2 Ecosystem Distribution Most upland ecosystems are common and well distributed across the landscape within the LSAs and RSAs of the Preliminary Proposed Corridor and corridor alternatives (Appendix 6.1A; Figures 6.1A-1 to 6.1A-3, and Appendix 6.1D), despite the presence of past and existing human disturbances that fragment and disconnect habitats. Human development activities have resulted in a more fragmented forest landscape compared to natural patterns. For example, there are existing linear disturbances on the landscape (e.g., roads and rail). Fragmentation also results from fire suppression and selective harvesting practices, which have led to smaller scattered disturbances compared to larger burned areas in the past. Other disturbances such as active mining, mineral exploration, transmission lines, urban settlements and recreational activities have also contributed to the fragmentation of forested uplands.
Preliminary Proposed Corridor
The current linear disturbance density across upland ecosystems is 0.47 kilometres per square kilometre (km/km2) in the RSA and 0.62 km/km2 in the LSA. Overall, most uplands are expected to be resilient to changes in distribution because they are common and well distributed across the LSA and RSA. Some specific upland land classes (i.e., Forest – regenerating depletion) are uncommon and dispersed on the landscape; however, regenerating forests have a natural capacity for adaptation and resilience due to being in the early succession stage after disturbance.
Corridor Alternative Around Mishkeegogamang
The current linear disturbance density across upland ecosystems is 0.48 km/km2 in the RSA and 0.55 km/km2 in the LSA. The existing Highway 599 is a substantial linear disturbance on the landscape. Overall, most uplands are expected to be resilient to changes in distribution because they are common and well distributed across the LSA and RSA. Some specific upland land classes (i.e., Forest - regenerating depletion) are uncommon and dispersed on the landscape.
June 2017 Project No. 1535751 6-36
ENVIRONMENTAL ASSESSMENT REPORT FOR THE PHASE 1 NEW TRANSMISSION LINE TO PICKLE LAKE PROJECT SECTION 6.0: BIOLOGICAL ENVIRONMENT BASE CASE AND EFFECTS ASSESSMENT
Corridor Alternative Through Mishkeegogamang
The current linear disturbance density across upland ecosystems is 0.50 km/km2 in the RSA and 0.61 km/km2 in the LSA. The existing Highway 599 is a substantial linear disturbance on the landscape. Overall, most uplands are expected to be resilient to changes in distribution because they are common and well distributed across the LSA and RSA. Some specific upland land classes (i.e., Bedrock) are uncommon and dispersed on the landscape and would be less resilient and have lower capacity to adapt to fragmentation from disturbance. Rock outcrops often contain rare plant species, thus if bedrock is disturbed these species would have a lower capacity to adapt to changes.
6.1.5.2.1.3 Ecosystem Composition In addition to direct predicted loss of upland ecosystems, anthropogenic disturbances may have affected upland composition through adjacency or edge effects. Remaining uplands in the LSAs may provide lower quality habitat for some species of wildlife, particularly those that are considered sensitive to fragmentation (Benitez-Lopez et al. 2010, Haddad et al. 2015, Turner 1996, Sutter et al. 2000). In addition, upland habitat edges are prone to invasion by generalist wildlife species (i.e., species that will use a variety of habitats) that may compete with or prey on upland specialists (Ministry of Forests Research Program 1998).
In the LSAs and RSAs for the Preliminary Proposed Corridor and corridor alternatives, there have been changes to forested upland composition as a result of forest harvesting. For example, the creation of forestry logging roads for access has contributed to increase forest fragmentation, which changes light and moisture regimes.
In FMUs, such as the Caribou and English River, spruce budworm outbreaks were more prominent in reducing the numbers of white spruce and balsam fir during the 1980s. In the Dryden FMU, outbreaks of the Jack pine budworm were prominent in 2006 to 2007, but with spray control from MNRF are now under control with no current concerns of pest infestation. Spruce budworm was identified in the Lac Seul FMU in 2008 and 2009, but was assessed as low.
Uplands with undisturbed soils that are located away from disturbed sites are generally resistant to invasion by non-native plant species. In contrast, upland habitat edges adjacent to disturbance are more prone to invasion. Human disturbances such as logging and mining have the potential to accelerate the establishment of invasive plant species in native ecosystems through the introduction of seeds or disturbance of soils (Ministry of Forests Research Program 1998).
Baseline field surveys were conducted within the Preliminary Proposed Corridor LSA, but not the LSAs for the corridor alternatives. No species listed as a noxious weeds in Ontario were detected during baseline surveys of the Preliminary Proposed Corridor (OMAFRA 2016; Appendix 6.1B). However, baseline surveys identified two non-native weed species. Hound’s-tongue (Cynoglossum officinale) was observed within the preliminary proposed LSA within a Forest-dense mixed land cover class. Mouse-ear hawkweed (Hieracium pilosella) was observed within the Preliminary Proposed Corridor LSA within a cutblock (Appendix 6.1B).
No federally-listed plant species (SARA or COSEWIC), species tracked provincially under COSSARO or species tracked by NHIC were observed during the baseline plant community surveys in the Preliminary Proposed Corridor (Appendix 6.1B).
June 2017 Project No. 1535751 6-37
ENVIRONMENTAL ASSESSMENT REPORT FOR THE PHASE 1 NEW TRANSMISSION LINE TO PICKLE LAKE PROJECT SECTION 6.0: BIOLOGICAL ENVIRONMENT BASE CASE AND EFFECTS ASSESSMENT
Overall, the composition of upland ecosystems is predicted to have varied due to changes in availability and distribution during Base Case conditions for the Preliminary Proposed Corridor and corridor alternatives. Changes in ecosystem composition are likely well within the resilience and adaptability limits for this criterion. However, small land cover classes such as Bedrock in the Corridor Alternative Through Mishkeegogamang study areas may be approaching limits of resilience and adaptability. Rock outcrops often have rare plant species, thus if bedrock is disturbed these species would have a lower capacity to adapt to changes.
6.1.5.2.2 Wetland Ecosystems 6.1.5.2.2.1 Ecosystem Availability Wetlands are ecosystems containing soils that are saturated with moisture either permanently or seasonally, and are further characterized by the presence of hydrophytic (water-adapted) vegetation (National Wetlands Working Group 1988 in National Wetlands Working Group 1997). Wetlands contribute to fish and wildlife habitat and recreational activities such as birding, store carbon from the atmosphere and act as natural filters. Wetlands with late-successional old growth stands provide structure, promoting biodiversity and are used for a variety of recreational activities (LandOwner Resource Centre 1999). Within the RSAs and LSAs, open and treed bogs and fens make up the wetland landscape. Open water wetlands were not differentiated from other waterbodies, but also exist in the LSAs and RSAs.
Although the amount of wetland ecosystems available before industrial development in the RSAs is not precisely known, availability has almost certainly changed due to disturbances such as forest harvesting, roads, rail, mining and recreational activities. The areas of land cover classes associated with wetland ecosystems in the Base Case are provided in Appendix 6.1D. For this assessment, uplands and wetlands were combined in the calculation and analysis of changes to the area of forest age classes, and are provided in Section 6.1.5.2.1.1.
Wetland ecosystems have historically been common in the LSAs and RSAs. Historically, boreal forest composition has primarily been affected by wildfire, insect outbreaks and disease. More recently, large-scale harvesting and controlled fire suppression play key roles in forest composition and structure. Fire suppression over the last 60 years and logging have decreased the forest fire return cycle, leading to changes in the forest composition (Carleton 2001). Forest-harvesting is one of the key disturbances to wetlands in the LSAs and RSAs. Logged wetlands eventually return to dominance by black spruce, but will often go through successional stages following harvesting where the site is characterized by alder swales and swamp-like conditions (Carleton 2001).
The industrial period in the early 1900s established some of the linear infrastructure such as roads and rail that currently exists in the RSAs, and would have contributed to adverse effects on wetlands. Construction of transportation routes may have reduced the availability of wetland ecosystems in the RSAs because of draining or filling of small wetlands along road ROWs, and potential redirection or channelization of local water flow (Table 6.1-10).
June 2017 Project No. 1535751 6-38
ENVIRONMENTAL ASSESSMENT REPORT FOR THE PHASE 1 NEW TRANSMISSION LINE TO PICKLE LAKE PROJECT SECTION 6.0: BIOLOGICAL ENVIRONMENT BASE CASE AND EFFECTS ASSESSMENT
Table 6.1-10: Wetland Ecosystems Availability in the Base Case in the Local and Regional Study Areas by Corridor
Wetland Type
Preliminary Proposed Corridor Corridor Alternative Around Mishkeegogamang
Total 4,891 4.7 21,700 4.6 3,928 4.2 17,346 4.2 3,358 3.7 14,905 3.7 Note: Some numbers are rounded for presentation purposes. Therefore, it may appear that the totals do not equal the sum of the individual values. Burns and Cutblocks are less than or equal to 40 years of age. ha = hectare; LSA = local study area; RSA = regional study area % = percent.
June 2017 Project No. 1535751 6-39
ENVIRONMENTAL ASSESSMENT REPORT FOR THE PHASE 1 NEW TRANSMISSION LINE TO PICKLE LAKE PROJECT SECTION 6.0: BIOLOGICAL ENVIRONMENT BASE CASE AND EFFECTS ASSESSMENT
Table 6.1-11: Summary of Wetland Ecosystem Features for the Preliminary Proposed Corridor, Corridor Alternative Around Mishkeegogamang and Corridor Alternative Through Mishkeegogamang
Feature Preliminary Proposed
Corridor Corridor Alternative Around
Mishkeegogamang Corridor Alternative through
Mishkeegogamang
LSA RSA LSA RSA LSA RSA Wetland Ecosystem Availability (% of study area) 4.7 4.6 4.2 3.8 3.7 3.7
Most Common Wetland Class Bog – treed
Bog – treed Bog – treed Bog - treed Bog – treed Bog - treed
Least Common Wetland Class Fen – open Fen - open Fen – open Fen - open Fen – open Fen - open
PSWs n/a n/a n/a n/a n/a n/a Notes: LSA = local study area; n/a = not present in the study areas; PSW = provincially significant wetlands; RSA = regional study area; TBD = to be determined; % = percent.
June 2017 Project No. 1535751 6-40
ENVIRONMENTAL ASSESSMENT REPORT FOR THE PHASE 1 NEW TRANSMISSION LINE TO PICKLE LAKE PROJECT SECTION 6.0: BIOLOGICAL ENVIRONMENT BASE CASE AND EFFECTS ASSESSMENT
Table 6.1-12: Base Case Summary of Wetland CLVAs in the Ecodistricts that Intersect with Corridor Alternatives(a)
Feature Preliminary Proposed Corridor Corridor Alternative
Around Mishkeegogamang Corridor Alternative
Through Mishkeegogamang
Type Area (ha) Type Area
(ha) Type Area (ha)
Most Common Wetland CLVA
3W1 Precambrian Basic to Intermediate Bedrock/Coniferous Swamp
69,083 3W1 Precambrian Basic to Intermediate Bedrock/Coniferous Swamp
69,082 3W1 Precambrian Basic to Intermediate/Coniferous Swamp
69,082
Total Wetland CLVA - 157,056 - 151,250 - 151,247
Notes: CLVA = Critical Landform/Vegetation Association; ha = hectare. a) CLVAs are considered in an ecodistrict context rather than LSA and RSA. b) The least common CLVA is not presented because several CLVAs in the ecodistricts were represented by <0.001 ha.
June 2017 Project No. 1535751 6-41
ENVIRONMENTAL ASSESSMENT REPORT FOR THE PHASE 1 NEW TRANSMISSION LINE TO PICKLE LAKE PROJECT SECTION 6.0: BIOLOGICAL ENVIRONMENT BASE CASE AND EFFECTS ASSESSMENT
Preliminary Proposed Corridor
Below is a summary of availability of wetland ecosystems in the LSA and RSA (Table 6.1-11; Appendix 6.1A, Figures 6.1A-4; Appendix 6.1D):
Total in the LSA – 4,891 ha (4.7%) composed of 4,730 ha (4.6%) of undisturbed wetlands, 75 ha (0.1%) burned wetlands and 87 ha (0.1%) cutblock wetlands.
Total in the RSA – 21,700 ha (4.6%) composed of 20,866 ha (4.5%) of undisturbed, 500 ha (0.1%) burned and 333 ha (0.1%) cutblocks.
Most common class – Bog – treed at 3,413 ha (3.3%) in the LSA and 14,734 ha (3.2%) in the RSA.
Least common class – Fen – open at 68 ha (0.1%) in the LSA and 424 ha (0.1%) in the RSA.
Provincially significant wetlands (PSWs) are not located within the LSA or RSA.
Corridor Alternative Around Mishkeegogamang
Below is a summary of availability of wetland ecosystems in the LSA and RSA (Table 6.1-11; Appendix 6.1A, Figures 6.1A-5; Appendix 6.1D):
Total in the LSA - 3,928 ha (4.2%) composed of 3,496 ha (3.8%) of undisturbed, 331 ha (0.4%) burned and 102 ha (0.1%) cutblocks.
Total in the RSA - 17,346 ha (4.2%) composed of 15,586 ha (3.8%) of undisturbed, 1,145 ha (0.3%) burned and 615 ha (0.1%) cutblocks.
Most common class –Bog-treed at 2,505 ha (2.7%) in the LSA and 11,706 ha (2.8%) in the RSA.
Least common class – Fen-open at 177 ha (0.2%) in the LSA and 736 ha (0.2%) in the RSA.
Provincially significant wetlands are not located within the LSA or RSA.
Corridor Alternative Through Mishkeegogamang
Below is a summary of availability of wetland ecosystems in the LSA and RSA (Table 6.1-11; Appendix 6.1A, Figures 6.1A-6; Appendix 6.1D):
Total in the LSA – 3,358 ha (3.7%) composed of 2,926 ha (3.2%) of undisturbed, 333 ha (0.4%) burned and 99 ha (0.1%) cutblocks.
Total in the RSA – 14,905 ha (3.7%) composed of 13,075 ha (3.3%) of undisturbed, 1,191 ha (0.3%) burned and 639 ha (0.2%) cutblocks.
Most common class – Bog – treed at 2,230 ha (2.4%) in the LSA and 10,176 ha (2.5%) in the RSA.
Least common class – Fen – open at 144 ha (0.2%) in the LSA and 635 ha (0.2%) in the RSA.
Provincially significant wetlands are not located within the LSA or RSA.
Rare Vegetation Communities Rare vegetation communities have not been mapped by MNRF in the LSAs or RSAs; however, MNRF communicated that vegetation communities with bur oak are rare on the landscape in the region and could be considered as rare vegetation communities for the Project assessment (MNRF 2017 pers comm.). According to
June 2017 Project No. 1535751 6-42
ENVIRONMENTAL ASSESSMENT REPORT FOR THE PHASE 1 NEW TRANSMISSION LINE TO PICKLE LAKE PROJECT SECTION 6.0: BIOLOGICAL ENVIRONMENT BASE CASE AND EFFECTS ASSESSMENT
Field Guide to the Forest Ecosystem Classification for Northwestern Ontario, NWST Field Guide FG-03 (Sims et al. 1997), there are two vegetation type codes that pertain to Bur Oak stands: V3.2 – Other Hardwoods and Mixedwoods and V3.3 – Upland Bur Oak. Bur oak vegetation types can be found in the wetland ecosite, NW36 (i.e., ES36) – Intermediate Swamp, Black Spruce (Tamarack); Organic Soil, according to the Terrestrial and Wetland Ecosites of Northwestern Ontario, NWST Field Guide FG-02 (Racey et al. 1996).
Preliminary Proposed Corridor
There is 7,001 ha (6.7%) of the NW36 ecosite within the LSA and 32,521 ha (7.0%) within the RSA.
Corridor Alternative Around Mishkeegogamang
There is 5,159 ha (5.6%) of the NW36 ecosite within the LSA and 19,412 ha (4.7%) within the RSA.
Corridor Alternative Through Mishkeegogamang
There is 4,630 ha (5.1%) of the NW36 ecosite within the LSA and 18,618 ha (4.7%) within the RSA.
Critical Landform/Vegetation Associations Below is a summary of the availability of wetland CLVAs in the ecodistricts that intersect with the LSAs for the Preliminary Proposed Corridor and corridor alternatives.
Preliminary Proposed Corridor
Total of 573,654 ha of CLVAs in the ecodistricts that intersect with the LSA of which 157,056ha (27.4%) are found in wetland ecosystems.
Most common CLVA – Precambrian Basic to Intermediate Bedrock land form associated with the Coniferous Swamp vegetation type at 69,082 ha Several wetland CLVAs in the ecodistricts that intersect with the Primary Corridor are represented by <0.001 ha.
Corridor Alternative Around Mishkeegogamang
Total of 547,100 ha of CLVAs in the ecodistricts that intersect with the LSA of which 151,250 ha (27.6%) are found in wetland ecosystems.
Most common CLVA – Precambrian Basic to Intermediate Bedrock land form associated with the Coniferous Swamp vegetation type at 69,082 ha.
Several wetland CLVAs in the ecodistricts that intersect with the corridor alternative around Mishkeegogamang are represented by <0.001 ha.
Corridor Alternative Through Mishkeegogamang
Total of 547,100 ha of CLVA in the ecodistricts that intersect with the LSA of which 151,247 ha (27.6%) are found in wetland ecosystems.
Most common CLVA – Precambrian Basic to Intermediate Bedrock land form associated with the Coniferous Swamp vegetation type at 69,082 ha.
Several wetland CLVAs in the ecodistricts that intersect with the corridor alternative around Mishkeegogamang are represented by <0.001 ha.
June 2017 Project No. 1535751 6-43
ENVIRONMENTAL ASSESSMENT REPORT FOR THE PHASE 1 NEW TRANSMISSION LINE TO PICKLE LAKE PROJECT SECTION 6.0: BIOLOGICAL ENVIRONMENT BASE CASE AND EFFECTS ASSESSMENT
Summary Wetlands remain abundant across all of the RSAs for the Preliminary Proposed Corridor and corridor alternatives despite changes from historical disturbances. Most wetlands are expected to have the capacity to adapt and be resilient to existing natural and human-related disturbances and associated variations in availability. However, some specific wetland types (i.e., the Fen – open land cover class) are uncommon on the landscape and would be likely less resilient to adverse changes in availability.
Wetlands were mapped as either bogs or fens. It is likely that mineral wetlands also exist in the study areas; however, due to the Land Cover 2000 scale of mapping small mineral wetlands are not discernible in the mapped landscape. This uncertainty is inherent in the assessment (i.e., low level of confidence regarding predicted effects to particular wetland types), but can be reduced during construction monitoring (i.e., wetlands confirmed to be disturbed by the Project can be field-verified as peat or mineral wetlands). Resilience in wetlands is a function of soil type, as mineral-based wetlands can be reclaimed and contribute to reversing adverse effects, while there is less confidence in reclaiming peat-type wetlands when soils have been disturbed (Environment Canada 2013).
6.1.5.2.2.2 Ecosystem Distribution The distribution of wetland ecosystems has changed from pre-industrial conditions for many of the same reasons that availability has changed. Wetlands are abundant in the LSAs and RSAs and are found distributed across the area (Appendix 6.1A, Figures 6.1A-4 to Figures 6.1A-6). Wetlands are often associated with lakes, rivers, and streams, making them important movement corridors for many wildlife species. Prior to forest harvesting and other human development activities and features such as roads, mining, urban settlements and recreation, wetlands likely had greater connectivity.
The effects of forestry activities on wetland ecosystem distribution likely have been caused mostly by clearing, water flow interception and culverts for roads, and changes in water quantity, which may have caused smaller wet areas to dry out, thereby reducing wetland connectivity in the LSAs and RSAs. It is assumed that early logging in the early and mid-1900s would not have followed guidelines specific to riparian areas. The Code of Practice for Timber Management Operations in Riparian Areas was published in 1991 (MNR 1991). Therefore, timber harvesting during these time periods may have cleared riparian areas, resulting in erosion and sedimentation in downstream waterbodies and watercourses, potentially reducing availability and distribution of wetlands.
Aside from forest harvesting, existing winter roads are moderate linear disturbances on the landscape. Some fragmentation would also have been caused by the mining of metals and these disturbances would have created gaps in the distribution of wetlands in the Base Case. Some wetlands downstream of mining operations may have been affected by changes in the catchment areas due to altered topography in mine footprints. Changes in the catchment area would affect flows of headwater streams, which may have reduced wetland availability and distribution. The current linear disturbance density across wetlands in the Base Case is:
Preliminary Proposed Corridor - 0.13 km/km2 in the RSA and 0.10 km/km2 in the LSA.
Corridor Alternative Around Mishkeegogamang - 0.23 km/km2 in the RSA and 0.29 km/km2 in the LSA.
Corridor Alternative Through Mishkeegogamang - 0.29 km/km2 in the RSA and 0.44 km/km2 in the LSA
June 2017 Project No. 1535751 6-44
ENVIRONMENTAL ASSESSMENT REPORT FOR THE PHASE 1 NEW TRANSMISSION LINE TO PICKLE LAKE PROJECT SECTION 6.0: BIOLOGICAL ENVIRONMENT BASE CASE AND EFFECTS ASSESSMENT
Overall, most wetland ecosystems are well distributed in the RSAs for the Preliminary Proposed Corridor and corridor alternatives, and small localized reductions in connectivity due to cumulative changes in the Base Case are likely within the resilience and adaptability limits of this assessment criteria. Some wetland types that are less common on the landscape (i.e., Fen-open) are likely approaching the limits of resilience and adaptive capacity to changes in distribution.
6.1.5.2.2.3 Ecosystem Composition The hydrologic regime is one of the most important factors determining wetland ecosystem function and the health of associated wetland plants (Carter 1997, Sheldon et al. 2005, Welsch et al. 1995). The composition and richness of species in a wetland plant community is influenced by the duration, timing, and frequency of saturation and depth of water (Sheldon et al. 2005). Disturbance to one or all of these factors can result in changes to the distribution and richness of plant and wildlife species in wetlands, although individual species will respond differently to changes in the hydrologic regime. Baseline plant community surveys in the Project study area found an average of 11 vascular plant species per wetland ecosite ranging from 8 to 21 species per community type (Appendix 6.1B). A wide range of wetland-dependent plant and wildlife species were observed during baseline surveys for the Project (e.g., Sphagnum spp, bluejoint reedgrass [Calamagrostis canadensis], few-fruited sedge [Carex oligosperma] as well as various other sedges, birds and moose [Alces alces]]).
The extent of the effects from historical developments on wetland ecosystem composition and hydrology is poorly understood. However, available information indicates that wetland ecosystem composition has likely been altered by historical disturbances and developments in the RSAs of the Preliminary Proposed Corridor and corridor alternatives since the late 1800s due to forest harvesting, roads, rail, mining and recreational activities. Disturbance can lead to increased invasive species on the landscape. Wetland ecosystems can be particularly sensitive to invasive species, and changes in species composition can affect local wetland structure and function (Zedler and Kercher 2004).
Through much of the 1900s, forestry practices in the RSAs of the Preliminary Proposed Corridor and corridor alternatives would have included clearing trees from riparian areas, which would have caused increased water flow, erosion, and siltation in the downstream receiving wetlands. These effects would have altered local hydrologic and abiotic conditions. Plant species composition (i.e., biotic conditions) and habitat conditions for aquatic invertebrates and wetlands-dependent wildlife would also have changed. Construction of transportation routes including roads, culverts, and bridges likely degraded wetland ecosystems in the RSAs through vegetation clearing and removing riparian forests, destabilizing banks and altering upstream and downstream geomorphology.
Wetlands located near anthropogenic disturbance are more likely to be affected by invasive species because of increased exposure to primary vectors for the spread of invasive species such as vehicles and equipment. More remote wetlands can also be affected by invasive species that are transported via waterways and wind; however, native wetlands located beyond 50 m from anthropogenic disturbance are less likely to be have been substantially altered by invasive plants in the LSAs and RSAs in the Base Case (Hamberg et al. 2008). Most wetlands (i.e., greater than 87% of wetland polygons) present in the Base Case in the RSAs are farther than 50 m from a disturbance, thus, soil disturbances (and invasive plant species) have not likely affected these wetlands to a large degree.
June 2017 Project No. 1535751 6-45
ENVIRONMENTAL ASSESSMENT REPORT FOR THE PHASE 1 NEW TRANSMISSION LINE TO PICKLE LAKE PROJECT SECTION 6.0: BIOLOGICAL ENVIRONMENT BASE CASE AND EFFECTS ASSESSMENT
Within the RSA of the Preliminary Proposed Corridor, agricultural lands are low in abundance (399 ha). Agricultural land is not found within the corridor alternatives. In these areas, livestock can affect wetland ecosystem condition by treading in wetlands, transporting invasive plant seeds, depositing urine and fecal material, and foraging on wetland plants. These processes can alter ecological attributes that affect wetland condition, and can lead to changes in water quality, water regime, soil properties, physical form, and vegetation health, structure, and species composition (Morris and Reich 2013).
Baseline field surveys were conducted within the Preliminary Proposed Corridor, but not study areas of the corridor alternatives. No species listed as a noxious weeds in Ontario were detected during baseline surveys within the study area of the Preliminary Proposed Corridor (OMAFRA 2017, Appendix 6.1B).
No plant species listed federally (SARA or COSEWIC) or provincially under COSSARO were observed during the baseline plant community surveys (Appendix 6.1B). One rare plant species tracked by NHIC has been reported as an Element Occurrence (i.e., areas of land or water on or in which a species or plant community is or was present) within the Preliminary Proposed Corridor LSA (NHIC 2016). The species documented was slender bulrush (Schoenoplectus heterochaetus), a provincially vulnerable (S3) plant.
Although wetland ecosystem condition probably has been degraded due to anthropogenic disturbances in the RSAs for the Preliminary Proposed Corridor and corridor alternatives during the Base Case, wetland composition at the Base Case is anticipated to be within the resilience and adaptability limits of this criterion.
6.1.5.2.3 Riparian Ecosystems 6.1.5.2.3.1 Ecosystem Availability Riparian ecosystems are distributed throughout the RSAs for the Preliminary Proposed Corridor and corridor alternatives, and are associated with streams, rivers and lakeshores. Historically, disturbance to riparian areas would have been from natural factors such as fires, floods, wildlife and disease. Since the late 1800s to early 1900s, disturbances from many sources including forest harvesting, roads, rail, mining, agriculture and recreational activities have been the primary factors contributing to changes in riparian habitat availability. The construction of transportation routes, including roads and culverts, would have altered riparian habitat in the region through vegetation clearing and the removal of riparian forests. Much of the disturbance to riparian areas would have been associated with logging. The Code of Practice for Timber Management Operations in Riparian Areas was published in 1991 (MNR 1991). It is assumed that early logging in the late 1800s to mid-1900s would not have followed guidelines specific to riparian areas. Thus, historical logging in riparian areas may have led to more erosion, sedimentation, soil compaction, rutting and water pooling than more recent logging in areas surrounding lakes, streams and rivers.
June 2017 Project No. 1535751 6-46
ENVIRONMENTAL ASSESSMENT REPORT FOR THE PHASE 1 NEW TRANSMISSION LINE TO PICKLE LAKE PROJECT SECTION 6.0: BIOLOGICAL ENVIRONMENT BASE CASE AND EFFECTS ASSESSMENT
Table 6.1-13: Summary of Riparian Ecosystem Features for the Preliminary Proposed Corridor, Corridor Alternative Around Mishkeegogamang and Corridor Alternative Through Mishkeegogamang
Feature Preliminary Proposed
Corridor Corridor Alternative Around
Mishkeegogamang Corridor Alternative
Through Mishkeegogamang
LSA RSA LSA RSA LSA RSA Total Riparian Area (%) 6.0 5.7 5.1 4.9 5.1 5.0
Notes: LSA = local study area; km/km2 = kilometre per square kilometre; RSA = regional study area; % = percent.
June 2017 Project No. 1535751 6-47
ENVIRONMENTAL ASSESSMENT REPORT FOR THE PHASE 1 NEW TRANSMISSION LINE TO PICKLE LAKE PROJECT SECTION 6.0: BIOLOGICAL ENVIRONMENT BASE CASE AND EFFECTS ASSESSMENT
Table 6.1-14: Riparian Ecosystem Availability in the Base Case in the Local and Regional Study Areas by Corridor
Riparian Type
Preliminary Proposed Corridor Corridor Alternative Around Mishkeegogamang
Corridor Alternative Through Mishkeegogamang
Local Study Area Regional Study Area Local Study Area Regional Study
Total 6,246 6.0 26,421 5.7 4,690 5.1 20,252 4.9 4,665 5.1 19,957 5.0 Note: Some numbers are rounded for presentation purposes. Therefore, it may appear that the totals do not equal the sum of the individual values. Burns and Cutblocks are less than or equal to 40 years of age. ha = hectare; % = percent.
June 2017 Project No. 1535751 6-48
ENVIRONMENTAL ASSESSMENT REPORT FOR THE PHASE 1 NEW TRANSMISSION LINE TO PICKLE LAKE PROJECT SECTION 6.0: BIOLOGICAL ENVIRONMENT BASE CASE AND EFFECTS ASSESSMENT
Preliminary Proposed Corridor
Below is a summary of availability of riparian ecosystems in the LSA and RSA (Table 6.1-14; Appendix 6.1A, Figures 6.1A-7; Appendix 6.1D):
Total riparian in the LSA – 6,246 ha (6.0%) composed of 5,022 ha (4.8%) of undisturbed riparian, 712 ha (0.7%) burned riparian and 512 ha (0.5%) cutblock riparian.
Total riparian in the RSA – 26,421 ha (5.7%) composed of 22,362 ha (4.8%) of undisturbed, 2,090 ha (0.4%) burned and 1,969 ha (0.4%) cutblocks.
Existing winter roads are some of the linear disturbances on the landscape.
Overall, 97.1% of habitat adjacent to watercourses and waterbodies in the LSA remains naturally vegetated in the Base Case, which is above the resource management criterion of 75% naturally vegetated stream length recommended by Environment Canada (2013) to prevent degradation of these ecosystems. Within the RSA, 97.3% of the area adjacent to watercourses and waterbodies is naturally vegetated. Changes to ecosystem availability appear to be within the resilience and adaptability limits of this criterion in the Base Case despite historical losses to riparian areas.
Corridor Alternative Around Mishkeegogamang
Below is a summary of availability of riparian ecosystems in the LSA and RSA (Table 6.1-14; Appendix 6.1A, Figures 6.1A-8; Appendix 6.1D):
Total riparian in the LSA – 4,690 ha (5.1%) composed of 3,597 ha (3.9%) of undisturbed, 959 ha (1.0%) burned and 134 ha (0.1%) cutblocks.
Total riparian in the RSA – 20,525 ha (4.9%) composed of 16,204 ha (3.9%) of undisturbed, 3,401 ha (0.8%) burned and 646 ha (0.2%) cutblocks.
The existing Highway 599 is a substantial linear disturbances on the landscape.
Overall, 96.0% of habitat adjacent to watercourses and waterbodies in the LSA remains naturally vegetated in the Base Case. Within the RSA, 97.4% of the area adjacent to watercourses and waterbodies is naturally vegetated. Changes to ecosystem availability appear to be within the resilience and adaptability limits of this criterion in the Base Case despite historical losses to riparian areas.
Corridor Alternative Through Mishkeegogamang
Below is a summary of availability of riparian ecosystems in the LSA and RSA (Table 6.1-14; Appendix 6.1A, Figures 6.1A-9; Appendix 6.1D):
Total riparian in the LSA – 4,665 ha (5.1%) composed of 3,561 ha (3.9%) of undisturbed, 967 ha (1.1%) burned and 137 ha (0.2%) cutblocks.
Total riparian in the RSA – 19,957 ha (5.0%) composed of 15,761 ha (3.9%) of undisturbed, 3,503 ha (0.9%) burned and 692 ha (0.2%) cutblocks.
The existing Highway 599 is a substantial linear disturbances on the landscape.
June 2017 Project No. 1535751 6-49
ENVIRONMENTAL ASSESSMENT REPORT FOR THE PHASE 1 NEW TRANSMISSION LINE TO PICKLE LAKE PROJECT SECTION 6.0: BIOLOGICAL ENVIRONMENT BASE CASE AND EFFECTS ASSESSMENT
Overall, 95.4% of habitat adjacent to watercourses and waterbodies in the LSA remains naturally vegetated in the Base Cases within the RSA, 97.3% of the area adjacent to watercourses and waterbodies is naturally vegetated. Changes to ecosystem availability appear to be within the resilience and adaptability limits of this criterion in the Base Case despite historical losses to riparian areas.
6.1.5.2.3.2 Ecosystem Distribution Changes to riparian distribution are caused by the same disturbances as those described above for availability. Regional connectivity of riparian habitat is important for dispersal of plants, and for movement of fish and wildlife species. In the LSAs and RSAs, an extensive network of streams, rivers, and waterbodies are bordered by riparian vegetation (Figures 6.1A-7 to Figures 6.1A-9). The distribution of riparian habitat in the RSAs is likely within the range of natural historical conditions (where natural events such as flooding would have caused regular shifts in distribution), except in areas affected by forest harvesting, roads, urban settlements and mines, where riparian systems have been lost or permanently altered.
Preliminary Proposed Corridor
The current linear disturbance density across riparian ecosystems in the Base Case is 0.31 km/km2 within the RSA and 0.37 km/km2 in the LSA. Overall, riparian ecosystems remain well-distributed and connected over the RSA in the Base Case. Therefore, changes to riparian habitat distribution that occurred during the Base Case are predicted to be within the resilience and adaptability limits of this criterion.
Corridor Alternative Around Mishkeegogamang
The current linear disturbance density across riparian ecosystems in the Base Case is 0.32 km/km2 within the RSA and 0.51 km/km2 within the LSA. Overall, riparian ecosystems remain well-distributed and connected over the RSA in the Base Case. Therefore, changes to riparian habitat distribution that occurred during the Base Case are predicted to be within the resilience and adaptability limits of this criterion.
Corridor Alternative Through Mishkeegogamang
The current linear disturbance density across riparian ecosystems in the Base Case is 0.34 km/km2 within the RSA and 0.52 km/km2 within the LSA. Overall, riparian ecosystems remain well-distributed and connected over the RSA in the Base Case. Therefore, changes to riparian habitat distribution that occurred during the Base Case are predicted to be within the resilience and adaptability limits of this criterion.
6.1.5.2.3.3 Ecosystem Composition Riparian trees provide habitat for wildlife and shade to buffer temperature within watercourses. Inputs of fallen woody debris increase fish habitat and inputs of organic matter from leaf litter provide food for invertebrates and fish. Riparian habitat also maintains water quality of watercourses by filtering out nutrients and contaminants.
Riparian areas with undisturbed soils that are distant from disturbances are resistant to invasion by non-native plant species. However, riparian habitat edges adjacent to disturbances are more prone to invasion. Human disturbances such as logging, urban areas and mining have the potential to accelerate the establishment of invasive plant species in native ecosystems through the introduction of seeds or disturbance of soils (Hamberg et al. 2008, Watkins et al. 2003). Most riparian areas (i.e., greater than 90% of riparian polygons) present in the Base Case in the RSA are farther than 50 m from a disturbance, and thus soil disturbances have not likely affected riparian areas to a large degree (Table 6.1-14).
June 2017 Project No. 1535751 6-50
ENVIRONMENTAL ASSESSMENT REPORT FOR THE PHASE 1 NEW TRANSMISSION LINE TO PICKLE LAKE PROJECT SECTION 6.0: BIOLOGICAL ENVIRONMENT BASE CASE AND EFFECTS ASSESSMENT
While the extent of agriculture is low (i.e., 399 ha) in the Preliminary Proposed Corridor RSA, livestock grazing, treading, and trampling may have also affected riparian ecosystem condition during the Base Case, affecting water quality (e.g., increasing turbidity), soils, and physical form, and allowing the introduction of invasive plants and altering vegetation health, structure, and composition in riparian habitat (Jansen and Robertson 2001). There is no agricultural land mapped in the corridor alternatives.
Riparian habitat in the region has been and continues to be altered by human activities such as vegetation clearing. Through much of the 1900s, forestry practices would have included clearing trees from riparian areas. This practice altered local hydrological and abiotic conditions, and plant species composition and habitat conditions for fish, aquatic invertebrates, and wildlife. Disturbance near riparian habitat can increase the potential for noxious species. Noxious species have the potential to out-compete native plants and become permanently established. Large changes in species composition can alter the function of ecosystem processes and change the dynamic of how other species interact within the ecosystem (Naeem et al. 1999). Other disturbances such as roads, urban settlements and mining likely increased access to previously remote areas and caused habitat fragmentation and barriers or partial barriers to wildlife movement, especially along riparian corridors.
Baseline field surveys were conducted within the Preliminary Proposed Corridor and this information was used to support the assessment on both the Preliminary Proposed Corridor and the corridor alternatives. No noxious species were detected in riparian habitat along the Preliminary Proposed Corridor (Appendix 6.1B). Several species of birds were observed in wetlands, lakes and associated riparian areas during baseline surveys (Appendix 6.1B).
The riparian habitats in the RSAs and LSAs of the Preliminary Proposed Corridor and corridor alternatives have maintained overall function in terms of ability to support the variety of wildlife that use them for foraging, nesting, and dispersal (Section 6.3). Therefore, changes to the condition of riparian habitat in the Base Case are predicted to be within the resilience and adaptability limits of this criterion.
June 2017 Project No. 1535751 6-51
ENVIRONMENTAL ASSESSMENT REPORT FOR THE PHASE 1 NEW TRANSMISSION LINE TO PICKLE LAKE PROJECT SECTION 6.0: BIOLOGICAL ENVIRONMENT BASE CASE AND EFFECTS ASSESSMENT
6.1.6 Project-Environment Interactions and Pathways Analysis The linkages between Project components and activities and potential effects to vegetation and wetlands are identified and assessed through a pathway analysis (Section 4.3). Potential effect pathways were identified by reviewing the Project Description, existing environmental conditions, input from engagement, knowledge from similar projects and activities, and the preliminary potential effects identified in the ToR. Effects after the implementation of impact management measures (or net effects) are screened. The screening process classifies potential effect pathways into the following categories:
No pathway: the pathway is removed (i.e., effect is avoided) by implementation of impact management measures or Project design. The pathway is not expected to result in a measurable environmental change relative to the Base Case and, therefore, would not have a net effect on a criterion’s assessment endpoint.
Secondary: the pathway could result in a measurable environmental change relative to the Base Case but would have a negligible net effect on a criterion’s assessment endpoint. The pathway is, therefore, not expected to additively or synergistically contribute to effects of other past, previous or reasonably foreseeable projects.
Primary: the pathway is likely to result in an environmental change relative to the Base Case that could contribute to net effects on a criterion’s assessment endpoint.
Potential pathways for effects to vegetation and wetlands are presented in Table 6.1-15. Classification of effects pathways to vegetation and wetlands resources are also presented in Table 6.1-15, and detailed descriptions are provided in the following sections.
June 2017 Project No. 1535751 6-52
ENVIRONMENTAL ASSESSMENT REPORT FOR THE PHASE 1 NEW TRANSMISSION LINE TO PICKLE LAKE PROJECT SECTION 6.0: BIOLOGICAL ENVIRONMENT BASE CASE AND EFFECTS ASSESSMENT
Table 6.1-15: Potential Effect Pathway for Effects to Vegetation and Wetlands
Project Component or Activity Effect Pathway Pathway Duration Impact Management Measures Pathway Type
Project activities during the construction stage: clearing, grading, earth moving, grubbing of vegetation,
and stockpiling of materials along the ROW and other access and construction areas, and construction of infrastructure (e.g., access roads, bridges, laydown areas, turn-around areas and temporary construction camps);
surface water management and erosion control; hazardous materials, solid and liquid waste handling; maintenance of site services; and reclamation of decommissioned access roads, laydown
areas, staging areas, and construction camps.
Project activities during the operation and maintenance stage: Operation and maintenance of new ROW, fencing,
transmission line, conductors, tower foundations, and permanent access roads.
Site preparation, construction and operation activities can result in the loss or alteration of upland, wetland and riparian ecosystems.
Effects starting during construction and potentially extending into the operation and maintenance stage.
Construction stage: Existing roads and trails will be used where possible. Use clearing equipment that minimizes surface disturbance, soil compaction and
topsoil loss (e.g., equipment with low ground pressure tracks or tires, blade shores and brush), where feasible.
When required, follow the appropriate contingency methods as listed in the Soil Handling Management Plan (Section 9.3.1.4).
Limit to the extent practical the construction of temporary (e.g., access road, travel lane) and permanent (tower foundations) structures in wetlands or within 30 m setback from a wetland.
Selectively cut vegetation and restrict grubbing within areas with steep slopes or soils with risk of erosion.
Selective clearing and retention of shrub vegetation, trees, wildlife trees, and coarse woody debris in environmentally sensitive areas as much as practicable.
Under non-frozen conditions and where regulatory approvals allow, install mats (e.g., rig mats, swamp mats or access mats) to limit effects to waterbodies and wetlands, if warranted and surface conditions require.
Proposed locations of construction camps, laydown and will be field-verified to avoid wetlands including bogs and fens, where feasible. Where possible, schedule work activities in wet areas during frozen conditions.
If construction cannot avoid wetlands and setback, MNRF will be notified as soon as possible. Work may not be conducted unless approval is obtained from the appropriate regulatory agencies.
Burn timber and brush in accordance with the rules and conditions for outdoor fires regulations under the Forest Fires Prevention Act.
Avoid burning slash piles when a fire hazard is present. Minimize burning within 100 m of a waterbody to the extent practical. Avoid locating burn piles in peat rich areas where residual fires could persist after
construction. Strip the topsoil at burn locations to prevent sterilization of the soil. Wataynikaneyap will work with both Aboriginal communities and forest
management units to dispose of merchantable timber cleared by the Project. If timber and brush are disposed of by mechanical means (i.e., mulching or
chipping), the material must be dispersed in a way to avoid accumulation of flammable material and comply with the Forest Fires Prevention Act.
In the event that a rare plant species or a rare vegetation community are suspected or encountered unexpectedly, or cannot be avoided, implement the Rare Plant Management Plan (Section 9.3.1.6).
Clearly mark known site-specific features (e.g., rare vegetation community, wetland, significant wildlife habitat).
Stabilize erodible soils as soon as practical by seeding, spreading mulch or installing erosion control blankets.
Stabilize disturbed areas (e.g., cover exposed areas with erosion control blankets or tarps to keep the soil in place and prevent erosion). Cover such areas with mulch to prevent erosion.
Retain snags (i.e., standing or partially fallen dead trees) to provide wildlife habitat, where practical.
Primary
Reduced soil quantity during earth moving activities may affect revegetation.
Effects starting during construction and potentially extending into the operation and maintenance stage.
Secondary
Soil disturbance and stockpiling can change physical, chemical or biological properties of soil, increase erosion potential, and affect revegetation.
Effects starting during construction and potentially extending into the operation and maintenance stage.
Secondary
June 2017 Project No. 1535751 6-53
ENVIRONMENTAL ASSESSMENT REPORT FOR THE PHASE 1 NEW TRANSMISSION LINE TO PICKLE LAKE PROJECT SECTION 6.0: BIOLOGICAL ENVIRONMENT BASE CASE AND EFFECTS ASSESSMENT
Table 6.1-15: Potential Effect Pathway for Effects to Vegetation and Wetlands
Project Component or Activity Effect Pathway Pathway Duration Impact Management Measures Pathway Type
Reclaim temporary access roads and water crossings, laydown areas, staging areas, and construction camps.
Re-contour disturbed areas to restore drainage patterns and the approximate preconstruction profile.
Decompact subsoils, temporary access trails and soils damaged during wet weather.
Consider propagating species or component species, in the case of rare vegetation communities, via vegetative or reproductive means (e.g., harvesting of seed, salvaging and transplanting portions of sod and surrounding vegetation or collecting of cuttings).
Operation and maintenance stage: Allow compatible vegetation in the ROW to grow back to a maximum height of
2 m, including riparian vegetation buffer.
June 2017 Project No. 1535751 6-54
ENVIRONMENTAL ASSESSMENT REPORT FOR THE PHASE 1 NEW TRANSMISSION LINE TO PICKLE LAKE PROJECT SECTION 6.0: BIOLOGICAL ENVIRONMENT BASE CASE AND EFFECTS ASSESSMENT
Table 6.1-15: Potential Effect Pathway for Effects to Vegetation and Wetlands
Project Component or Activity Effect Pathway Pathway Duration Impact Management Measures Pathway Type
Project activities during the construction stage: clearing, grading, earth moving, grubbing of vegetation,
and stockpiling of materials along the ROW and other access and construction areas, and construction of infrastructure (e.g., access roads, bridges, laydown areas, turn-around areas and temporary construction camps);
water taking from surface water sources for the purposes of construction and water supply;
surface water management and erosion control; discharges of wastewater from construction, vehicle and
equipment wash, and domestic activities; and reclamation of decommissioned access roads, laydown
areas, staging areas, and construction camps.
Changes to hydrology may alter drainage patterns and increase/decrease drainage flows and surface water levels, which could cause changes to soils and upland, wetland and riparian ecosystems.
Effects commencing during construction and potentially extending into the operation and maintenance stage.
Refer to impact management measures presented for the surface water assessment in Table 5.1-12.
Secondary
Project activities during the construction stage: foundation installation including dewatering activities; pumping of wells for supply of water to temporary
construction camps; and construction of access roads and trails, fencing, the
transformer station, the connection facility, and the transmission line alignment ROW.
Changes to groundwater quantity and quality could cause near-surface groundwater level changes in wetlands.
Temporary, with effects commencing during construction and potentially extending into the operation and maintenance stage.
Refer to impact management measures presented for the hydrogeology assessment in Table 5.2-8.
Secondary
Project activities during construction stage: re-fuelling, service and maintenance of vehicles and
construction equipment; operation of vehicles, construction equipment, and diesel
generators; and hazardous materials, solid and liquid waste handling.
Project activities during the operation and maintenance stage: Transportation of personnel, materials, and equipment.
Chemical or hazardous material spills on the Project footprint or along access roads can affect soil quality and upland, wetland and riparian ecosystems
Effects likely limited to construction, but may occur during the operation and maintenance stage
Refer to impact management measures presented for the surface water assessment in Table 5.1-12.
No pathway
June 2017 Project No. 1535751 6-55
ENVIRONMENTAL ASSESSMENT REPORT FOR THE PHASE 1 NEW TRANSMISSION LINE TO PICKLE LAKE PROJECT SECTION 6.0: BIOLOGICAL ENVIRONMENT BASE CASE AND EFFECTS ASSESSMENT
Table 6.1-15: Potential Effect Pathway for Effects to Vegetation and Wetlands
Project Component or Activity Effect Pathway Pathway Duration Impact Management Measures Pathway Type
Project activities during the construction stage: clearing, grading, earth moving, grubbing of vegetation,
and stockpiling of materials along the ROW and other access and construction areas, and construction of infrastructure (e.g., access roads, bridges, laydown areas, turn-around areas and temporary construction camps);
use of explosives and blasting to create level areas for transmission structures, roads, and for foundation excavations; and
reclamation of decommissioned access roads, laydown areas, staging areas, and construction camps.
Project activities during the operation and maintenance stage: Operation and maintenance of new ROW, fencing,
transmission line, conductors, tower foundations, and permanent access roads.
Dust and air emissions, and subsequent deposition can affect upland, wetland and riparian ecosystems through changes in soil quality and direct contact with plants
Effects mostly limited to construction stage
Refer to impact management measures presented in the air quality assessment in Table 5.3-13.
Secondary
Project activities during the construction stage: clearing, grading, earth moving, grubbing of vegetation,
and stockpiling of materials along the ROW and other access and construction areas, and construction of infrastructure (e.g., access roads, bridges, laydown areas, turn-around areas, and temporary construction camps; and
reclamation of decommissioned access roads, laydown areas, staging areas, and construction camps.
Project activities during the operation and maintenance stage: Operation and maintenance of new ROW, fencing,
transmission line, conductors, tower foundations, and permanent access roads.
Introduction and spread of noxious and invasive plant species can affect upland, wetland and riparian ecosystems.
Effects commencing during construction and potentially extending into the operation and maintenance stage.
Construction stage: Prepare and implement the Invasive Species Management Plan (Section 9.3.1.7),
that describes the appropriate management of construction materials and equipment to prevent the infiltration and spread of weeds, including: cleaning and inspection of vehicles and equipment prior to arriving at the job re-cleaning vehicles and equipment if an area of weed infestation is
encountered on the Project Site (i.e., Project footprint), prior to advancing to a weed-free area
locating and management of vehicle and equipment cleaning locations on the Project footprint
Use certified seed mix as required for site revegetation and provide the analysis certificate to MNRF.
On Crown land, allow for natural regeneration or use certified native seed in engagement with appropriate Land Administrator. Natural recovery is the preferred method of reclamation on level terrain where erosion is not expected.
Use natural recovery in wetlands.
Operation and maintenance stage: Manage access (e.g., fencing) to discourage public use of access roads and
transmission corridor, where permitted by communities or MNRF.
Secondary
Notes: m = metre; MNRF = Ontario Ministry of Natural Resources and Forestry; ROW = right-of-way.
June 2017 Project No. 1535751 6-56
ENVIRONMENTAL ASSESSMENT REPORT FOR THE PHASE 1 NEW TRANSMISSION LINE TO PICKLE LAKE PROJECT SECTION 6.0: BIOLOGICAL ENVIRONMENT BASE CASE AND EFFECTS ASSESSMENT
6.1.6.1 Pathway Screening 6.1.6.1.1 No Pathway An effect pathway was assessed as having no pathway if the activity would not occur (e.g., site runoff is not released), or if the pathway would be removed by impact management measures such that the Project would result in no measurable environmental change in, an no expected net effect to, upland, wetland and riparian ecosystems. The pathway described in the following bullet was assessed as having no pathway to vegetation and wetlands. No further assessment or characterization of net effects, including determination of significance, is required for this pathway.
Chemical or hazardous material spills (e.g., petroleum products, ammonium nitrate) on the Project site or along access or haul roads can affect soil quality and upland, wetland and riparian ecosystems
Spills that occur in high enough concentrations could potentially contaminate soils and cause effects on aquatic organisms, soil organisms, and vegetation. Direct contact of spills on plants can also result in injury or mortality. Transport and handling of hazardous materials will be carefully managed by Wataynikaneyap. If chemical or fuel spills occur as a result of the Project, contaminants will be contained and cleaned up according to the procedures outlined in the Spill Prevention and Emergency Response Plan (Section 9.3.1.13) and the Soil Handling Management Plan (Section 9.3.1.4).
Procedures for storing and handling chemicals and fuels will be implemented for the Project. The Liquid Waste Management Plan (Section 9.3.1.10) will describe the procedures for the handling, storage and disposal of wastes such as used oil, filter and grease cartridges, lubrication containers, construction related debris and surplus materials, and domestic garbage and camp wastes (e.g., food and grey water). Individuals working on site and handling hazardous materials will be trained in the transportation of dangerous goods. Emergency spill kits will be available near fuel and hazardous materials handling locations (e.g., spill kits at laydown areas and/or construction camps) and in vehicles. Construction equipment and vehicles will be regularly maintained to minimize leaks.
The implementation of the draft Environmental and Social Management Plan (ESMP, Section 9.0) and training of personnel in safe handling of chemicals and hazardous materials are anticipated to minimize the frequency, spatial extent, and severity of spills. Given implementation of the impact management measures described above, spills in the Project footprint are not expected to result in measurable changes to soil quality and plants, and were determined to have no pathway to vegetation and wetlands.
June 2017 Project No. 1535751 6-57
ENVIRONMENTAL ASSESSMENT REPORT FOR THE PHASE 1 NEW TRANSMISSION LINE TO PICKLE LAKE PROJECT SECTION 6.0: BIOLOGICAL ENVIRONMENT BASE CASE AND EFFECTS ASSESSMENT
6.1.6.1.2 Secondary Pathway In some cases both a Project component or activity (i.e., source) and an effect pathway may exist, but the Project is assessed as resulting in a minor environmental change, with a negligible net effect on upland, wetland, and riparian ecosystems relative to baseline values, resulting in a secondary pathway. The pathways described in the following bullets were assessed as secondary and were not carried through to the net effects assessment.
Reduced soil quantity may affect revegetation
Soil disturbance and stockpiling can change physical, chemical, or biological properties of soil, increase erosion potential, and affect revegetation
Site clearing and preparation during Project construction can cause soil compaction, admixing and erosion, and result in changes to soil quantity (and distribution) and quality. Soil stockpiling can also change soil quality and increase erosion potential. These changes in soil quantity and quality can adversely influence the success of revegetation (reclamation) activities.
Soil compaction decreases soil quality and occurs primarily from heavy equipment or repeated passes of equipment across the soil surface. Soil compaction increases soil density and reduces soil porosity, influences drainage and structure, and alters soil strength, water content and temperature (Corns 1988, Tuttle et al. 1988, Busse et al. 2006, Blouin et al. 2008). Areas most prone to compaction are low-lying, poorly-drained areas with fine-textured soils. To mitigate changes in soil quality (and quantity), the Project would use clearing equipment with low ground pressure tracks or tires, which would reduce surface disturbance, soil compaction and topsoil loss.
Stripping, admixing and stockpiling upper soil materials can cause physical changes to soil such as disturbing soil structure. Loss of soil structure may result in a reduction in the amount of soil organic matter and soil organic carbon present within the soil and influences the bulk density, pore size distribution, microbial community structure and resistance of soil to erosion (Wick et al. 2009). However, by salvaging the upper soil horizons where possible, soil organic materials can be maintained, which is important for ecosystem resilience (Baldock and Broos 2012). Soil salvage and stockpiling are advantageous because topsoil is a more productive vegetation medium than subsoil (Abdul-Kareem and McRae 1984).
Chemical changes occur in stockpiled soils. As oxygen decreases because of overall bulk, the stockpile can become anaerobic, which inhibits the nitrogen cycle, thereby increasing ammonium-nitrogen (Abdul-Kareem and McRae 1984, Williamson and Johnson 1994). A decrease in potential for hydrogen (pH) also has been recorded in stockpiled soil, mostly because of ammonia build-up from anaerobic conditions (Abdul-Kareem and McRae 1984). In some studies, extractable potassium, phosphorus, and magnesium increased in clayey stockpiles and decreased in sandy- and loamy-textured stockpiles (Abdul-Kareem and McRae 1984). Other studies have found that nutrients for plants, such as nitrogen, phosphorus, and potassium declined over time in stockpiles, which is likely a result of the loss of clays and silts to erosion (Ghose 2001, Kundu and Ghose 1997). Perhaps the largest potential change in soil chemistry in stockpiled soil is alterations in organic matter content, especially in sandy-textured soil (Abdul-Kareem and McRae 1984). Soil organic matter content influences the rates of microbial decomposition and nutrient availability for plant uptake (Wick et al. 2009), and its loss or reduction can decrease the ability of soil to support vegetation.
June 2017 Project No. 1535751 6-58
ENVIRONMENTAL ASSESSMENT REPORT FOR THE PHASE 1 NEW TRANSMISSION LINE TO PICKLE LAKE PROJECT SECTION 6.0: BIOLOGICAL ENVIRONMENT BASE CASE AND EFFECTS ASSESSMENT
Biological soil properties include the diversity and activity of soil microorganisms (e.g., bacteria, fungi, microbial biomass, and community structure [Ewing and Singer 2012]), and soil organisms (e.g., protozoa, nematodes, earthworms, and arthropods). Biological changes arise because of physical and chemical changes to soils. Initial soil stripping causes large decreases in soil microbial activity, microbial biomass, and mycorrhizal fungi abundance (Abdul-Kareem and McRae 1984, Stark and Redente 1987, Wick et al. 2009). Adverse effects on soil biology may result in decreased rates of nutrient cycling and reduced nutrient availability, but this effect is dependent on the depth of the stockpile, length of time soil remains in the stockpile, and whether the stockpile has been revegetated (Abdul-Kareem and McRae 1984, Stark and Redente 1987, Wick et al. 2009). Vegetation maintained on stockpiles tends to sustain populations of bacteria and fungi over time at the surface of the stockpile.
The Soil Handling Management Plan (Section 9.3.1.4) for the Project will provide direction on topsoil stripping, stockpiling, salvage, and prioritized placement on the landscape, which is expected to mitigate changes to soil quality and quantity. The Project will also implement impact management measures to limit erosion of soil from wind and water, such as selectively cutting vegetation and restricting clearing within areas with steep slopes. Temporary access roads and waterbody crossings, laydown areas, staging areas, and construction camps will be decommissioned and reclaimed throughout and after completion of the construction stage. Compacted areas will be ripped or otherwise treated to loosen soil and facilitate revegetation. Reclamation activities are anticipated to occur immediately after construction, which would decrease the adverse effects to physical, chemical and biological properties of soil from stockpiling (i.e., stockpiling would happen over the short-term). Post-construction monitoring will be used to determine the success of reclamation activities, and provide feedback for additional impact management measures, if necessary.
By implementing the impact management measures indicated in the Soil Handling Management Plan (Section 9.3.1.4), the change in local soil quantity and quality from construction activities and subsequent stockpiling is anticipated to be measurable, but minor, and mostly reversible. Consequently, these activities are predicted have a negligible net effect on revegetation and are assessed as secondary pathways to upland, wetland and riparian ecosystems.
Changes to hydrology may alter drainage patterns and increase/decrease drainage flows and surface water levels, which could cause changes to soils and upland, wetland and riparian ecosystems
Changes in drainage patterns and increases and decreases in drainage flows and surface water levels beyond the natural range of variation could lead to a loss of soils through increased erosion, and affect the quality and quantity (and distribution) of vegetation. Wetland and riparian vegetation distribution is a result of water regime and plant species tolerance to flooding and saturation (Casanova and Brock 2000, Odland and del Moral 2002). Natural water fluctuations result in cyclic vegetation changes. Alternating wet and dry patterns determine plant establishment and composition by stimulating or inhibiting germination of seeds in the soil seed bank (Casanova and Brock 2000) and water depth is the primary influence on seed bank composition (Lu et al. 2010). Prolonged flooding or drying eliminates some plant species while favouring others because of changes in soil oxygen levels, nutrients, and species tolerance to saturated or dry soil conditions (Casanova and Brock 2000).
June 2017 Project No. 1535751 6-59
ENVIRONMENTAL ASSESSMENT REPORT FOR THE PHASE 1 NEW TRANSMISSION LINE TO PICKLE LAKE PROJECT SECTION 6.0: BIOLOGICAL ENVIRONMENT BASE CASE AND EFFECTS ASSESSMENT
A change in local water flows could alter the distribution of wetlands, riparian, and upland areas in relation to the changes in soil moisture (Nilsson and Svedmark 2002, Odland and del Moral 2002, Shafroth et al. 2002, Leyer 2005). As soil moisture levels change because of changes in surface flows and water levels, plant species that thrive in drier soil moisture regimes can out-compete riparian species that rely on fluctuations in soil moisture (Shafroth et al. 2002, Leyer 2005).
Impact management measures have been included in the Project design to limit loss of soils, and include not permitting the fording of watercourses unless approved by the appropriate regulatory agencies, and installing culverts or temporary bridges using best management practices and following environmental approval conditions. Project activities are expected to not influence broad scale drainage patterns. Some measurable changes to localized soil moisture regimes (and erosion) adjacent to smaller drainages are predicted during construction and into operation and maintenance until vegetation cover is restored in the surrounding area (Section 5.2). Overall, minor and local changes in the abundance and distribution of soils and plant communities are predicted relative to Base Case conditions. Therefore, this pathway was determined to have a negligible net effect on upland, wetland, and riparian ecosystems.
A potential change in the near-surface groundwater levels in wetlands due to groundwater extraction to support the Project is assessed in the Hydrogeology Assessment (Section 5.2.6).
Dust and air emissions, and subsequent deposition can affect upland, wetland and riparian ecosystems through changes in soil quality and direct contact with plants
Construction and operation of the Project is expected to generate air and dust emissions such as carbon monoxide (CO), oxides of sulphur (SOx, including sulphur dioxide [SO2]), oxides of nitrogen (NOx), particulate matter (e.g., PM2.5), and total suspended particulates (SPM). Air emissions such as SOx and NOx can result from the use of fossil fuels in generators, vehicles, machinery, and the use of explosives during the Project. The use of explosives will be limited to Project construction and to specific geological conditions that do not allow for an alternative method of removing material to create level areas for transmission structures and foundations for the anchoring of towers. For example, ripping will be selected over blasting where rock is encountered. A Blast Management Plan (Section 9.3.1.15) will be prepared and implemented to limit the amount of chemical residue in the environment. The dominant contributor to dust emissions (SPM) is from vehicles travelling on roads (Farmer 1993, Harrison et al. 2003, Peachey et al. 2009, Liu et al. 2011).
Air emissions can change soil quality by altering soil pH and nutrient content, and soil fauna composition (Jung et al. 2011, Rusek and Marshall 2000). Changes in soil fauna and soil quality can lead to effects on vegetation when they alter rates of organic matter decomposition and nutrient cycling (Rusek and Marshall 2000). Changes to soil from atmospheric inputs are determined by several complex geochemical factors, which include nutrient uptake by plants, decomposition of vegetation, cation and anion exchange in soil, soil sensitivity to acidification, and duration and quantity of atmospheric inputs (Jung et al. 2011, Turchenek et al. 1998). The alteration of soil pH from deposition of SO2 and NO2 can cause acidification. However, the potential for acidification depends on the buffering capacity of the soil and the vegetation cover present in the receiving environment (Bobbink et al. 1998, Barton et al. 2002, Jung et al. 2011, Jung et al. 2013). Soils in the LSA are anticipated to exhibit a low to moderate ability to buffer the effects of acidic inputs (Crins et al. 2009, Holowaychuck and Fessenden 1987).
June 2017 Project No. 1535751 6-60
ENVIRONMENTAL ASSESSMENT REPORT FOR THE PHASE 1 NEW TRANSMISSION LINE TO PICKLE LAKE PROJECT SECTION 6.0: BIOLOGICAL ENVIRONMENT BASE CASE AND EFFECTS ASSESSMENT
Accumulation of dust produced from the Project may result in local and direct changes to vegetation. Dust that falls directly on plants can have a physical effect by smothering plant leaves or blocking stomata openings (Farmer 1993). Crusts forming on leaves can reduce net photosynthesis (Brandt and Rhoades 1973). After many cycles of crusting, the annual growth rate of plants can be reduced or cease and crusting can even lead to death. Walker and Everett (1987) and Everett (1980) reported that few vascular plant species showed physiological effects from dust, except where vegetation was subject to very high dust loading. Auerbach et al. (1997) found that, although plant species composition may change and aboveground biomass may be reduced by dust deposition, ground cover is still maintained. Species such as cottongrass (Eriophorum spp.) are more tolerant of dust and were found to be more abundant next to a road, and some shrub species such as willow (Salix spp.) increase in cover with dust deposition (Auerbach et al. 1997).
In addition to changes from the deposition of SOx and NOx, chemical changes can occur from the deposition of dust. Rates of dust deposition and accumulation are dependent on the rate of supply from the source, wind speed, precipitation events, topography, and vegetation cover (Rusek and Marshall 2000, Liu et al. 2011). The indirect responses of vegetation to changes in soil quality depend on the chemical compositions of dust and the source (Grantz et al. 2003). Dust deposition can also cause chemical loading in soils and plants if dust emissions include elevated concentrations of metal particles. Metal particle deposition can result in increased metals concentrations in plant leaves (Grantz et al. 2003, Peachey et al. 2009). Metal particle deposition can also affect soil biota composition (Grantz et al. 2003), which could indirectly affect vegetation. Although additions of metals through dust deposition can change vegetation chemistry, Peachy et al. (2009) found that vegetation that received metals from dust deposition did not cause direct toxicity to plants.
In addition to metals, dust can contain other cations and anions. The presence of cations such as calcium in dust emissions can reduce the acid generating potential of the SO2 and NOx because they tend to react with bases (e.g., carbonates) found in dust (McNaughton et al. 2009). When cations (e.g., ammonium) are deposited into an ecosystem, the vegetation present can take up the cation; however, hydrogen [H+] can be released into the environment and decrease soil pH (Turchenek et al. 1998). When anions (e.g., chloride) are deposited into an ecosystem, anions such as hydroxide [OH-] can be released. Although OH- increases pH, cation and anion uptake has generally been shown to result in a net production of acidity. The net effect is acidification because the cations are generally retained in the plant biomass and are therefore not mineralized. Ultimately, the concentrations and duration of air and dust emissions and the sensitivity of the ecosystems determine the overall influence that emission deposition will have on vegetation (Bobbink et al. 1998).
Bryophytes and lichens can be sensitive to the chemical effects of dust because they obtain moisture and nutrients from the atmosphere and immediate surroundings, including substances that are trapped or deposited directly on the surface of the bryophyte leaf or lichen thalli (Farmer 1993). Bryophytes and lichens may experience the largest effects close to roads where the greatest amount of deposition frequently occurs. Some lichens have been found to incorporate the dust into their tissue; however, this is dependent on the growth form of the lichen (Farmer 1993). Direct effects on lichen are likely more important in ground-dwelling lichen species that normally receive all of their nutrients directly from the atmosphere. However, fruticose lichens, such as Usnea, have been shown sensitivity to atmospheric contaminant deposition (Beckett 1995). Mosses such as Sphagnum are sensitive to dust deposition. Sphagnum along a gravel road have been observed to have decreased photosynthetic rates and a decline in cover when dust deposition was 1.0 to 2.5 g/m2/d (equivalent to 10 to 25 mg/dm2/d) (Farmer 1993).
June 2017 Project No. 1535751 6-61
ENVIRONMENTAL ASSESSMENT REPORT FOR THE PHASE 1 NEW TRANSMISSION LINE TO PICKLE LAKE PROJECT SECTION 6.0: BIOLOGICAL ENVIRONMENT BASE CASE AND EFFECTS ASSESSMENT
Although there was a decline in Sphagnum cover, it was replaced by more tolerant mosses such as haircap moss (Polytrichum spp.) and Bryum moss (Bryum spp.) (Farmer 1993).
Ambient air quality data were obtained from the Thunder Bay air quality monitoring station to determine Base Case conditions. Concentrations of NOx, SPM (which includes fugitive dust), and particulate matter (e.g., PM2.5) were observed to be below the relevant ambient air quality criteria for all compounds and averaging periods assessed (Section 5.3). For example, annual ambient concentrations of NOx and SPM were 14.8 µg/m³ and 18.4 µg/m³, respectively. Annual air quality criteria for NOx and SPM emissions is 60 µg/m³, and 30 µg/m³ for SO2 (Canadian Council of Ministers of the Environment 1999). However, SO2 is not measured at Thunder Bay or at any monitoring stations within 100 kilometres (km) of the Project. Given that the ambient concentrations of other measured compounds are small, the background air quality concentration of SO2 is also predicted to be small as there are no large industrial sources of SO2 within the immediate vicinity of the Project (Section 5.3.6.1.2.6).
Air and fugitive dust emissions would be highest during Project construction, and no new sources of emissions will occur during operation and maintenance activities. Therefore, the air quality assessment was restricted to emissions from construction activities, which included vehicles, equipment and land clearing. A screening level assessment was completed for a 5 km segment of the transmission line. Maximum predicted concentrations of all compounds assessed were highest closest to the Project footprint, decreased markedly with distance from the Project, and were all below air quality criteria. For example, within 100 m of the Project footprint, the maximum annual SO2 concentration is predicted to be 0.05 µg/m3 (without background) or 0.80 µg/m³ (with background) but this decreased to 0.03 µg/m3 (without background) or 0.78 µg/m³ (with background) at 200 m. Similarly, the annual concentration of NOx is predicted to be 19.27 µg/m³ and 12.75 µg/m³ without background at 100 m and 200 m from the Project footprint, respectively or 31.97 µg/m³ and 25.45 µg/m³ with background. Annual SPM concentrations are predicted to be 12.13 µg/m³ at 100 m and 8.03 µg/m³ (without background) at 200 m from the Project or 34.86 µg/m³ at 100 m and 30.76 µg/m³ (with background). Importantly, these modelled annual concentrations represent conservative values (i.e., overestimate effects) as the construction period for a 5-km segment of the transmission line is much less than one year (Section 5.3).
The World Health Organization (WHO 2000) has established annual critical levels at which vegetation growth and community composition characteristics may be altered due to SO2 and NOx emissions. The maximum predicted annual SO2 and NOx concentrations from the Project at all distances are below the WHO critical levels of 20 µg/m3 and 30 µg/m3, respectively (WHO 2000). With effective implementation of impact management measures planned for the Project to further reduce the effects of air emissions (Table 6.1-15) air and dust emissions and subsequent deposition are expected to result in minor and local changes to soil quality and vegetation relative to Base Case conditions. Therefore, this pathway was determined to have a negligible net effect on self-sustaining and ecologically effective upland, riparian and wetland ecosystems.
June 2017 Project No. 1535751 6-62
ENVIRONMENTAL ASSESSMENT REPORT FOR THE PHASE 1 NEW TRANSMISSION LINE TO PICKLE LAKE PROJECT SECTION 6.0: BIOLOGICAL ENVIRONMENT BASE CASE AND EFFECTS ASSESSMENT
Introduction and spread of noxious and invasive plant species can affect upland, wetland and riparian ecosystems
Construction and operation and maintenance activities have the potential to introduce non-native invasive plant species into new areas, especially when entering areas with known populations of non-native invasive plant species. Construction equipment and personnel have the potential to introduce non-native invasive plant species into new areas by transporting seed or plant parts on equipment or clothing. The introduction of these species can disrupt plant communities and decrease habitat quality by affecting plant community structure and species diversity directly through competition, and indirectly through alterations to soil microorganisms, nutrients, and soil moisture (Mack et al. 2000, Carlson and Shepherd 2007, Truscott et al. 2008).
The majority of non-native invasive plant species introductions arise from human transport (Mack et al. 2000, Reichard and White 2001). Roads also act as dispersal routes and habitat for non-native invasive plant species establishment (Parendes and Jones 2000). Transportation corridors to and from construction areas provide a means of ingress for non-native invasive plant species through direct dispersion of plant propagules (seeds and/or vegetative parts) from vehicles and machinery, and indirectly through the formation of suitable sites for non-native invasive plant species in the form of disturbed areas. Many non-native invasive plant species are able to spread more easily in landscapes that have been fragmented, and often become established along edge habitats, such as disturbed road edges associated with transportation corridors (Lafortezza et al. 2010).
Preventing noxious and invasive species from entering an area is often more efficient and cost effective than dealing with their removal once established (Clark 2003, Polster 2003, Carlson and Shepard 2007). No noxious were detected during baseline studies of the Project (Appendix 6.1B). Two species, which are considered to be introduced (NHIC 2017), were observed during the field surveys: hound’s-tongue (Cynoglossum officinale) and mouse-ear hawkweed (Hieracium pilosella). Mouse-ear hawkweed was observed at one site in forest depletion – cuts habitat and had 10% cover in the plot. Hound’s-tongue was observed at one site in Ecosite Trembling Aspen – Black Spruce - Jack Pine / Low Shrub (V10) habitat and had 2% cover in the plot. Neither of these species are classed as “noxious” under the Ontario Weeds Act Schedule of Noxious Weeds (OMAFRA 2017).
Wataynikaneyap will implement an Invasive Species Management Plan (Section 9.3.1.7) to avoid and minimize the introduction and spread of noxious and invasive plants during construction and operation and maintenance, which will include an annual monitoring program to identify and prioritize weeds for removal. Additional impact management measures will include cleaning and inspection of vehicles and equipment prior to Project site entry, and re-cleaning vehicles and equipment if an area of weed infestation is encountered, prior to advancing to a weed-free area. While natural revegetation will be the preferred method for reclamation, only certified seed mixes will be used for revegetation, where required (Table 6.1-15).
The implementation of impact management measures cited in the Invasive Species Management Plan (Section 9.3.1.7) is expected to minimize the introduction and spread of noxious and invasive species so that any changes to native vegetation would be localized and minor, and result in negligible net effects to upland, wetland and riparian ecosystems.
June 2017 Project No. 1535751 6-63
ENVIRONMENTAL ASSESSMENT REPORT FOR THE PHASE 1 NEW TRANSMISSION LINE TO PICKLE LAKE PROJECT SECTION 6.0: BIOLOGICAL ENVIRONMENT BASE CASE AND EFFECTS ASSESSMENT
6.1.6.1.3 Primary Pathway Pathways that are expected to result in net adverse effects are considered primary pathways and are forwarded for further assessment to characterize and determine the significance of the effects on assessment endpoints. The following primary pathway was assessed in detail, and net effects were characterized and significance determined for upland, wetland and riparian ecosystems in the subsequent sections.
Site preparation, construction and operation activities can result in the loss or alteration of upland, wetland and riparian ecosystems.
6.1.7 Effects Assessment Methods This section outlines the methods used to predict and characterize of net effects to vegetation criteria from primary pathways (i.e., those pathways predicted to result in net effects after incorporation of impact management measures).
6.1.7.1 Project Case Effects Classification This section outlines the methods used to predict and describe net effects of the Preliminary Proposed Corridor and the corridor alternatives on each vegetation criterion, and to put these effects in the context of interacting cumulative effects from previous, existing, and reasonably foreseeable developments. Net effects were calculated and predicted for the Preliminary Proposed Corridor and corridor alternatives, and contextualized using three assessment cases, Base Case, Project Case, and Reasonably Foreseeable Developments Case (RFD Case), as described in Section 4.2.3. The specific application of the assessment cases to vegetation and wetlands is described in the following sections. Vegetation and wetlands specific methods for describing net effects using the effects characteristics (Table 6.1-16), and methods for determining significance for vegetation criteria are also presented below.
Table 6.1-16: Definitions of Effects Characteristics Used to Describe Predicted Net Effects on Criteria
Effects Characteristic Definition Description
Direction The direction of change in the effect relative to the current value or state.
Positive – net gain or positive effect Neutral – no change Negative – net loss or adverse effect
Magnitude Magnitude is the intensity of the effect or a measure of the degree of change from existing (baseline) conditions expected to occur in the criterion.
Narrative or numeric quantification of effects
June 2017 Project No. 1535751 6-64
ENVIRONMENTAL ASSESSMENT REPORT FOR THE PHASE 1 NEW TRANSMISSION LINE TO PICKLE LAKE PROJECT SECTION 6.0: BIOLOGICAL ENVIRONMENT BASE CASE AND EFFECTS ASSESSMENT
Table 6.1-16: Definitions of Effects Characteristics Used to Describe Predicted Net Effects on Criteria
Effects Characteristic Definition Description
Geographic extent Geographic extent refers to the spatial area over which an effect will occur/can be detected (distance covered or range).
Project footprint – effect is limited to the direct physical disturbance from the Project.
Local – the effect is confined to the LSA, but outside of the Project footprint.
Regional – the effect extends beyond the LSA boundary, but is confined within the RSA.
Beyond regional – the effect extends beyond the RSA boundary.
Duration/reversibility Duration is the period of time over which the environmental effect will be present. The amount of time between the start and end of an activity or stressor (which relates to Project development stages), plus the time required for the effect to be reversed. Duration and reversibility are functions of the length of time a criterion is exposed to activities.
Reversibility is an indicator of the potential for recovery of the criterion from an effect. Reversible implies that the effect will not influence the criterion at a future predicted period in time. For effects that are permanent, the effect is determined to be irreversible.
Short-term – the effect is reversible before the end of construction.
Medium-term – the effect occurs during construction and/or operation and is reversible soon after operation begins.
Long-term – the effect occurs during construction and/or operation and persists into operations, but is reversible.
Permanent – the effect occurs during construction and/or operation and is irreversible.
Frequency/timing Frequency refers to the occurrence of the environmental effect over the duration of the assessment.
Discussions on seasonal considerations are made when they are important in the evaluation of the effect.
Infrequent – the effect is expected to occur rarely
Frequent – the effect is expected to occur intermittently
Continuous – the effect is expected to occur continually
Probability of occurrence
Probability of occurrence is a measure of the likelihood that an activity will result in an environmental effect.
Unlikely – the effect is not likely to occur
Possible – the effect may occur, but is not likely
Probable – the effect is likely to occur Certain – the effect will occur
June 2017 Project No. 1535751 6-65
ENVIRONMENTAL ASSESSMENT REPORT FOR THE PHASE 1 NEW TRANSMISSION LINE TO PICKLE LAKE PROJECT SECTION 6.0: BIOLOGICAL ENVIRONMENT BASE CASE AND EFFECTS ASSESSMENT
Net effects of the Preliminary Proposed Corridor and each corridor alternative are measured and described in the Project Case. Net effects are the Preliminary Proposed Corridor or corridor alternatives-specific net effects measured as the incremental change from existing conditions (i.e., Base Case) (Section 4.4). The description of net effects focuses on primary pathways, which are those pathways predicted to result in effects that remain after impact management measures (Section 6.1.6.1).
Changes in indicators for each criterion were estimated relative to the Base Case to describe net effects, as follows:
Changes in ecosystem availability were estimated by calculating the differences in the compilation of Land Cover 2000 classes into upland, wetland and riparian ecosystems.
Changes in ecosystem distribution and connectivity were estimated qualitatively through visual examination of Land Cover 2000 mapping, and quantitatively using linear feature density (e.g., roads).
Changes in ecosystem composition were assessed qualitatively through predicted alterations in moisture, sunlight, and dust deposition, and potential competition from invasive species.
Net effects are described using the effects characteristics identified in Table 6.1-16 and applied to the predicted changes in measurement indicators for each criterion. Net effects on vegetation and wetlands criteria considered direction (positive or negative), expected magnitude (e.g., number of hectares lost or gained, change in composition), geographic extent (i.e., spatial extent of the effect), duration and reversibility (e.g., years, decades, permanent/irreversible), frequency (i.e., number of times the effect happens per unit time), and probability of occurrence (e.g., how likely is the effect).
Magnitude was not described categorically. Characterizing magnitude using an ordinal scale (i.e., low, moderate, or high) in a manner meaningful for vegetation and wetlands criteria requires that the effect size be placed in the ecological context of the criterion, incorporating resilience, adaptability, and amount of historic disturbance. Universal effect size boundaries, such as a 20% change at the RSA scale used to define a high magnitude effect, work poorly because they fail to consider ecological context. A 20% additional loss to an ecosystem from existing conditions in the RSA may be required to cause a high magnitude effect on some criteria, whereas a 2% loss may be sufficient for others, depending on ecological context (BC EAO 2013). Integrating ecological context to understand the point at which an effect size is large enough to be important for a criterion is directly linked to the self-sustaining and ecologically effective status of the ecosystem, and therefore directly linked to significance (Section 6.1.7.3) To avoid providing a definition of magnitude synonymous with the determination of significance, predicted effect sizes were provided in specific terms (i.e., a narrative or numeric quantification). The ecological context of the predicted effect size is discussed in a reasoned narrative for the determination of significance (Section 6.1.7.3).
June 2017 Project No. 1535751 6-66
ENVIRONMENTAL ASSESSMENT REPORT FOR THE PHASE 1 NEW TRANSMISSION LINE TO PICKLE LAKE PROJECT SECTION 6.0: BIOLOGICAL ENVIRONMENT BASE CASE AND EFFECTS ASSESSMENT
6.1.7.2 Reasonably Foreseeable Development Case Effects Classification The Reasonably Foreseeable Development (RFD) Case measures and describes cumulative effects of adding the incremental changes from the Project Case, and certain/planned and RFDs to the Base Case (Section 4.2.3). The RFD Case also determines the significance of cumulative effects from the Preliminary Proposed Corridor or corridor alternatives and past, present and RFDs. Subsequently, the cumulative effects assessment is completed at the regional scale (i.e., criterion-specific RSA or beyond RSA). The RFD Case effects assessment for each vegetation and wetlands criterion is primarily qualitative and describes how the interacting effects of developments and natural factors are predicted to affect indicators for each criterion (Section 4.6). The assessment is presented as a reasoned narrative describing the outcomes of cumulative effects for each vegetation and wetlands criterion. All RFDs in the vegetation and wetlands assessment are described in detail in Table 6.1-17.
June 2017 Project No. 1535751 6-67
ENVIRONMENTAL ASSESSMENT REPORT FOR THE PHASE 1 NEW TRANSMISSION LINE TO PICKLE LAKE PROJECT SECTION 6.0: BIOLOGICAL ENVIRONMENT BASE CASE AND EFFECTS ASSESSMENT
Table 6.1-17: Summary of Reasonably Foreseeable Developments Case Interactions for Vegetation and Wetlands
Construction and operation of a 4,500 km oil pipeline system from Hardisty, Alberta to Saint John, New Brunswick to transport crude oil from Hardisty and Moosomin, Saskatchewan to delivery points in Québec and New Brunswick.
Site preparation, construction and operation activities can result in the loss or alteration of upland, wetland and riparian ecosystems.
Yes 2
Northwest Bulk Transmission Line
The project will augment the capacity and maintain the reliability of the electricity supply to the area west of Thunder Bay and was identified as a priority in the 2013 Long-Term Energy Plan. The preliminary scope of the Northwest Bulk Transmission Line Project consists of a new double-circuit 230 kV line between Thunder Bay and Atikokan and a single-circuit 230 kV line from Atikokan to Dryden.
Site preparation, construction and operation activities can result in the loss or alteration of upland, wetland and riparian ecosystems.
Yes 3
Highway 11/17 Expansion
Widening of sections of Highway 17 (from two to four lanes). Some stages of the expansion are complete.
Site preparation, construction and operation activities can result in the loss or alteration of upland, wetland and riparian ecosystems.
Yes 4
Treasury Metals Inc. Goliath Gold Project
The project would include one open pit with underground development, a tailings storage facility, waste rock storage, overburden storage, low-grade stockpile and a 115 kV transmission line with on-site electrical substation. Once in operation, the rate of production will be approximately 2,700 tonnes per day (t/d). Site Preparation and Construction will take approximately two years. The site is 20 km east of Dryden. Operation is anticipated to be 12 years. The EA is in progress.
Site preparation, construction and operation activities can result in the loss or alteration of upland, wetland and riparian ecosystems.
Yes 7
June 2017 Project No. 1535751 6-68
ENVIRONMENTAL ASSESSMENT REPORT FOR THE PHASE 1 NEW TRANSMISSION LINE TO PICKLE LAKE PROJECT SECTION 6.0: BIOLOGICAL ENVIRONMENT BASE CASE AND EFFECTS ASSESSMENT
Table 6.1-17: Summary of Reasonably Foreseeable Developments Case Interactions for Vegetation and Wetlands
The proposed project is to develop a low-grade, greenfield gold and silver open pit mine with conventional milling methods. The project is 110 km northeast of the Town of Red Lake. The production rate was assumed to be 20,000 t/d with a total of 72.4 million tonnes (Mt) of mineralized material mined and processed during the 11-year project life.
Site preparation, construction and operation activities can result in the loss or alteration of upland, wetland and riparian ecosystems.
Yes 10
New Dimensions Savant Lake Gold Project
The Property, which has not been considerably explored since the early 1980's, hosts seven known gold occurrences that have yielded high grade gold values up to 138.87 g/t from surface prospecting. New Dimension was attracted to the Savant Lake Property for its gold in iron formation characteristics that it believes are analogous to Goldcorp's neighbouring Musselwhite gold mine and Agnico Eagle's newly discovered
Site preparation, construction and operation activities can result in the loss or alteration of upland, wetland and riparian ecosystems.
Yes 35
Phase 2: Connecting 17 Remote First Nation Communities
Phase 2 - Pickle Lake Corridor Site preparation, construction and operation activities can result in the loss or alteration of upland, wetland and riparian ecosystems.
Yes 37
Commercial Forestry
Planned forestry roads derived from Forest Management Plans.
Site preparation, construction and operation activities can result in the loss or alteration of upland, wetland and riparian ecosystems.
No n/a
Note: Additional RFDs considered in the vegetation and wetlands that did not have quantifiable information or that overlapped existing disturbances are identified in Table 4.6-1. g/t = grams per tonne; km = kilometre; kV = kilovolt; m = metre; MT = million tonnes; RFD = reasonably foreseeable development; t/d = tonnes per day.
June 2017 Project No. 1535751 6-69
ENVIRONMENTAL ASSESSMENT REPORT FOR THE PHASE 1 NEW TRANSMISSION LINE TO PICKLE LAKE PROJECT SECTION 6.0: BIOLOGICAL ENVIRONMENT BASE CASE AND EFFECTS ASSESSMENT
6.1.7.3 Significance Determination For each vegetation and wetland criterion, a determination of significance was made for the Preliminary Proposed Corridor and corridor alternatives in the Project Case (cumulative effects of Base and Project cases) and the RFD Case (cumulative effects of Base, Project, and RFD cases).
Significance was determined based on combined effects because the effects of a single project infrequently cause an ecologically significant effect on their own (McCold and Saulsbury 1996), and many environmental effects of primary concern are cumulative (Canter and Ross 2010). Therefore, whether upland, riparian or wetland ecosystems would remain self-sustaining and ecologically effective was assessed by combining the effects identified in the Base Case with the net effects identified for the Project Case and the RFD Case to assess the total predicted combined effect. If a significant effect was identified, the contribution of the Preliminary Proposed Corridor and corridor alternatives to the cumulative effect was described.
Significance was predicted as a binary response, with effects classified as significant or not significant (Section 4.5.2). Net effects were determined to be significant if a criterion is expected to no longer be: (1) self-sustaining, or (2) ecologically effective. Specifically:
An ecosystem was considered to be no longer self-sustaining where cumulative effects were expected to place the abundance of an ecosystem RSA on a declining trajectory that is not predicted to recover or stabilize. Part of being self-sustaining, in this context, was that an ecosystem that stabilizes at a lower abundance is not expected to be lost in the future. Another part of being self-sustaining was the assumption that no additional impact management measures or management actions beyond the Preliminary Proposed Corridor and corridor alternatives impact management measures and existing management strategies in the RSAs would be required. Effects that are considered not significant could result in no change, stabilization at lower abundance, stabilization at higher abundance, or a temporary decline followed by recovery.
Even where the ecosystem remains abundant and present on the landscape, a loss of important ecological function also resulted in a determination of a significant adverse effect. Ecological function can be lost, even when an ecosystem remains abundant, if ecosystem composition is altered. Even where ecosystems remain stable, fragmentation effects that cause ecological isolation (i.e., severely reducing or eliminating overall viability of the ecosystem) may also be considered significant.
The approach to determining the significance of combined effects for each criterion incorporated the concepts of resilience and adaptability using the reasoned narrative provided in the effects assessment and cumulative effects assessment for the Preliminary Proposed Corridor and corridor alternatives. Although the determination of significance was informed by the characterization of net effects, the interaction between ecological context from the Base Case and the magnitude, duration, and geographic extent of the interacting net effects were the most important factors. Provincial and federal standards, guidelines, and objectives were considered, where available, and integrated into the reasoned narrative.
June 2017 Project No. 1535751 6-70
ENVIRONMENTAL ASSESSMENT REPORT FOR THE PHASE 1 NEW TRANSMISSION LINE TO PICKLE LAKE PROJECT SECTION 6.0: BIOLOGICAL ENVIRONMENT BASE CASE AND EFFECTS ASSESSMENT
Resource management criteria are targets identified by governments and resource management organizations to maintain and improve biodiversity. Available provincial and federal standards, guidelines, and objectives were considered, where available, and integrated into the reasoned narrative. Such resource management criteria have been developed by Environment Canada (2013) and other sources to help define functional ecosystems. Exceeding a resource management criterion may or may not indicate that an ecosystem is no longer self-sustaining or ecologically effective, but resource management criteria can provide useful context, especially where uncertainty is high.
Below is a summary of the Preliminary Proposed Corridor-related changes to upland ecosystem availability in the LSA and RSA (Table 6.1-18; Appendix 6.1A, Figures 6.1A-10; Appendix 6.1D):
Loss of 1,277 ha (1.6% of Base Case) to upland ecosystems in the LSA.
Largest predicted loss by percent change and absolute change (ha) - Forest - dense coniferous with a 1.7% change from Base Case and an absolute predicted loss of 613 ha in the LSA.
The Project is not expected to disturb the least common and available land cover class in the study areas (i.e., Forest – regenerating depletion). There is expected to a 2 ha loss (2.7% of Base Case) to the second least common land cover class (i.e., Bedrock).
Loss of 1,275 ha (1.6% of Base Case) to forested areas in the LSA and 2 ha to non-forested areas (i.e., bedrock) (2.7% of Base Case).
Loss of 1.0 ha (<0.01% of Base Case) to CLVAs in the ecodistricts that intersect with the LSA.
Corridor Alternative Around Mishkeegogamang
Below is a summary of the Corridor Alternative Around Mishkeegogamang-related changes to upland ecosystem availability in the LSA and RSA (Table 6.1-18; Appendix 6.1A, Figures 6.1A-11; Appendix 6.1D):
Loss of 1,162 ha (1.7% of Base Case) to upland ecosystems in the LSA.
Largest predicted loss by percent change – Forest – dense mixed with a 2.0% change from Base Case and an absolute predicted loss of 364 ha in the LSA.
Largest absolute changes (ha) – Forest – dense coniferous of 551 ha (1.8% of Base Case) in the LSA.
The Corridor Alternative Around Mishkeegogamang is not expected to disturb the least common and available land cover class in the study areas (i.e., Forest – regenerating depletion). A small change of less than 1 ha (1.8% of Base Case) is expected for the second least common land cover class (i.e., Bedrock).
Loss of 1,161 ha (1.7% of Base Case) to forested areas in the LSA and less than 1 ha to non-forested areas (i.e., bedrock) (1.8% of Base Case).
Loss of 23.7 ha (0.01% of the Base Case) to CLVAs in the ecodistricts that intersect with the LSA.
June 2017 Project No. 1535751 6-71
ENVIRONMENTAL ASSESSMENT REPORT FOR THE PHASE 1 NEW TRANSMISSION LINE TO PICKLE LAKE PROJECT SECTION 6.0: BIOLOGICAL ENVIRONMENT BASE CASE AND EFFECTS ASSESSMENT
Corridor Alternative Through Mishkeegogamang
Below is a summary of Corridor Alternative Through Mishkeegogamang-related changes to upland ecosystem availability in the LSA and RSA (Table 6.1-18; Appendix 6.1A, Figures 6.1A-12; Appendix 6.1D):
Loss of 1,135 ha (1.8% of Base Case) to upland ecosystems in the LSA.
Largest predicted loss by percent change – Forest – regenerating depletion with a 2.5% change from Base Case and an absolute predicted loss of 3 ha in the LSA.
Largest absolute changes (ha) – Forest – dense coniferous of 539 ha (1.8% of Base Case) in the LSA.
The Corridor Alternative Through Mishkeegogamang is not expected to disturb the least common and available land cover classes in the study areas (i.e., Bedrock).
Loss of 1,135 ha (1.8% of Base Case) to forested areas in the LSA and 0 ha to non-forested areas (i.e., Bedrock).
Loss of 23.7 ha (0.01% of the Base Case) to CLVAs in the ecodistricts that intersect with the LSA.
June 2017 Project No. 1535751 6-72
ENVIRONMENTAL ASSESSMENT REPORT FOR THE PHASE 1 NEW TRANSMISSION LINE TO PICKLE LAKE PROJECT SECTION 6.0: BIOLOGICAL ENVIRONMENT BASE CASE AND EFFECTS ASSESSMENT
Table 6.1-18: Predicted Changes to Upland Ecosystem Availability in the Project Case by Corridor
Total 64,759 63,624 -1,135 -1.8 274,067 272,932 -1,135 -0.4 Note: Some numbers are rounded for presentation purposes. Therefore, it may appear that the totals do not equal the sum of the individual values. The total percent change is calculated relative to the total area and therefore this value will not equal the sum of the individual values. Cutblocks and burns are less than or equal to 40 years of age. ha = hectare; % = percent.
June 2017 Project No. 1535751 6-73
ENVIRONMENTAL ASSESSMENT REPORT FOR THE PHASE 1 NEW TRANSMISSION LINE TO PICKLE LAKE PROJECT SECTION 6.0: BIOLOGICAL ENVIRONMENT BASE CASE AND EFFECTS ASSESSMENT
This page intentionally left blank
June 2017 Project No. 1535751 6-74
ENVIRONMENTAL ASSESSMENT REPORT FOR THE PHASE 1 NEW TRANSMISSION LINE TO PICKLE LAKE PROJECT SECTION 6.0: BIOLOGICAL ENVIRONMENT BASE CASE AND EFFECTS ASSESSMENT
Seral Stages Below is a summary of changes in availability of seral stages due to the Preliminary Proposed Corridor and corridor alternatives (Table 6.1-19).
Preliminary Proposed Corridor
Late-successional (111 years and older) forests – loss of 38 ha in the LSA (1.3% of the Base Case seral stage in the LSA; 0.2% of the Base Case seral stage in the RSA).
Mature (81-110 years) – loss of 303 ha in the LSA (1.6% of the Base Case LSA; 0.3% of the Base Case RSA).
Corridor Alternative Around Mishkeegogamang
Late-successional (111 years and older) forests – loss of 137 ha in the LSA (1.7% of the Base Case seral stage in the LSA; 0.4% of the Base Case seral stage in the RSA).
Mature (81-110 years) – loss of 368 ha in the LSA (1.7% of the Base Case seral stage in the LSA; 0.4% of the Base Case seral stage in the RSA).
Corridor Alternative Through Mishkeegogamang
Late-successional (111 years and older) forests – loss of 130 ha in the LSA (1.7% of the Base Case seral stage in the LSA; 0.4% of the Base Case seral stage in the RSA).
Mature (81-110 years) – loss of 360 ha in the LSA (1.7% of the Base Case seral stage in the LSA; 0.4% of the Base Case seral stage in the RSA).
June 2017 Project No. 1535751 6-75
ENVIRONMENTAL ASSESSMENT REPORT FOR THE PHASE 1 NEW TRANSMISSION LINE TO PICKLE LAKE PROJECT SECTION 6.0: BIOLOGICAL ENVIRONMENT BASE CASE AND EFFECTS ASSESSMENT
This page intentionally left blank
June 2017 Project No. 1535751 6-76
ENVIRONMENTAL ASSESSMENT REPORT FOR THE PHASE 1 NEW TRANSMISSION LINE TO PICKLE LAKE PROJECT SECTION 6.0: BIOLOGICAL ENVIRONMENT BASE CASE AND EFFECTS ASSESSMENT
Table 6.1-19: Seral Stages in the Project Case by Corridor
Seral Stage
Preliminary Proposed Corridor Local Study Area Regional Study Area
Total 57,800 56,792 -1,008 -1.7 236,478 235,469 -1,008 -0.4 Note: Some numbers are rounded for presentation purposes. Therefore, it may appear that the totals do not equal the sum of the individual values. Seral stage totals are based on upland and wetland ecosites identified as Forest (FOR) only from the FRI as age classes are not provided for other polytypes in the FRI. ha = hectare; % = percent.
June 2017 Project No. 1535751 6-77
ENVIRONMENTAL ASSESSMENT REPORT FOR THE PHASE 1 NEW TRANSMISSION LINE TO PICKLE LAKE PROJECT SECTION 6.0: BIOLOGICAL ENVIRONMENT BASE CASE AND EFFECTS ASSESSMENT
This page intentionally left blank
June 2017 Project No. 1535751 6-78
ENVIRONMENTAL ASSESSMENT REPORT FOR THE PHASE 1 NEW TRANSMISSION LINE TO PICKLE LAKE PROJECT SECTION 6.0: BIOLOGICAL ENVIRONMENT BASE CASE AND EFFECTS ASSESSMENT
Rare Vegetation Communities The rare bur oak vegetation community can be found as part of the NW30 ecosite and is included in upland ecosystems. This ecosite was not identified in the RSAs for the corridor alternatives. There is no loss of the NW30 ecosite within the Preliminary Proposed Corridor LSA.
Critical Landform/Vegetation Associations Below is a summary of changes in availability of CLVA due to the Preliminary Proposed Corridor and corridor alternatives.
Preliminary Proposed Corridor
Loss of 1.0 ha (<0.01% of the Base Case) to upland CLVA in the ecodistricts that intersect with the LSA.
Largest relative percent change of Base Case area is expected to be to the Fine Lacustrine & Glaciolacustrine landform associated with Intolerant Hardwood-Other Conifer Mixed vegetation type in the 4S-3 ecodistrict, with a predicted loss of 0.8 ha (0.1% of the Base Case).
Corridor Alternative Around Mishkeegogamang
Loss of 23.7 ha (0.01% of the Base Case) to upland CLVA in the ecodistricts that intersect with LSA.
Largest relative percent change of Base Case area is expected to be to the Alluvial & Fluvial Deposits landform associated with Intolerant Hardwood-Other Conifer Mixed vegetation type in the 3W-2 ecodistrict, with a predicted loss of 1.5 ha (0.9% of the Base Case.
Corridor Alternative Through Mishkeegogamang
Loss of 23.7 ha (0.01% of the Base Case) to upland CLVA in the LSA.
Largest relative percent change of Base Case area is expected to be to the Alluvial & Fluvial Deposits landform associated with Intolerant Hardwood-Other Conifer Mixed vegetation type in the 3W-2 ecodistrict, with a predicted loss of 1.5 ha (0.9% of the Base Case.
The summary of the project effects to the Base Case CLVA areas for the Preliminary Corridor and corridor alternatives is presented in Appendix 6.1D.
Summary The incremental contribution of the Preliminary Proposed Corridor, Corridor Alternative Around Mishkeegogamang and Corridor Alternative Through Mishkeegogamang to the adverse changes in available uplands (i.e., estimated loss of 1,277 ha, 1,162 ha and 1,135 ha, respectively) is predicted to have no to little influence on ecological function on upland ecosystems. At the scale of the RSA, more than 99% of uplands at Base Case remain intact in the Project Case. At the LSA scale, more than 98% of upland ecosystems at Base Case are predicted to remain in the Project Case for the Preliminary Proposed Corridor and corridor alternatives.
June 2017 Project No. 1535751 6-79
ENVIRONMENTAL ASSESSMENT REPORT FOR THE PHASE 1 NEW TRANSMISSION LINE TO PICKLE LAKE PROJECT SECTION 6.0: BIOLOGICAL ENVIRONMENT BASE CASE AND EFFECTS ASSESSMENT
6.1.8.1.2 Ecosystem Distribution Preliminary Proposed Corridor Below is a summary of Project-related changes to upland ecosystem distribution (Appendix 6.1A, Figures 6.1A-10; Appendix 6.1D):
Linear disturbance density LSA – increases from 0.62 km/km2 in the Base Case to 1.23 km/km2 for the Project Case.
Linear disturbance density RSA – increases from 0.47 km/km2 in the Base Case to 0.61 km/km2 for the Project Case. Loss of 1 ha (<0.01% of the Base Case) to CLVA in the ecodistricts that intersect with the LSA.
The Preliminary Proposed Corridor linear features overlaps with 97 km of existing disturbances, while another 416 km are adjacent to existing disturbances (i.e., within 500 m). These areas are found primarily where the Preliminary Proposed Corridor is beside or overlapping with winter roads.
Despite some increase in fragmentation, overall most upland ecosystems remain abundant and well-connected across the LSA and RSA to support healthy and functioning ecosystems.
Corridor Alternative Around Mishkeegogamang Below is a summary of the Corridor Alternative Through Mishkeegogamang-related changes to upland ecosystem distribution (Appendix 6.1A, Figures 6.1A-11; Appendix 6.1D):
Linear disturbance density LSA – increases from 0.55 km/km2 in the Base Case to 1.07 km/km2 for the Project Case.
Linear disturbance density RSA – increases from 0.48 km/km2 in the Base Case to 0.60 km/km2 for the Project Case.
A loss of 23.7 ha (0.1% of the Base Case) to the CLVA in the ecodistricts that intersect with the LSA.
Habitat loss from fragmentation is likely overestimated because the corridor is expected to largely parallel existing (Base Case) linear developments (e.g., Highway 599). The linear features of the Corridor Alternative Around Mishkeegogamang overlap with 76 km of existing disturbances while another 361 km are adjacent to existing disturbances (i.e., within 500 m).
Despite some increase in fragmentation, overall most upland ecosystems remain abundant and well-connected across the LSA and RSA to support healthy and functioning ecosystems.
June 2017 Project No. 1535751 6-80
ENVIRONMENTAL ASSESSMENT REPORT FOR THE PHASE 1 NEW TRANSMISSION LINE TO PICKLE LAKE PROJECT SECTION 6.0: BIOLOGICAL ENVIRONMENT BASE CASE AND EFFECTS ASSESSMENT
Corridor Alternative Through Mishkeegogamang Below is a summary of Corridor Alternative Through Mishkeegogamang-related changes to upland ecosystem distribution (Appendix 6.1A, Figures 6.1A-12; Appendix 6.1D):
Linear disturbance density LSA – increases from 0.61 km/km2 in the Base Case to 1.12 km/km2 for the Project Case.
Linear disturbance density RSA – increases from 0.50 km/km2 in the Base Case to 0.62 km/km2 for the Project Case.
A loss of 23.7 ha (0.1% of the Base Case) to CLVA in the ecodistricts that intersect with the LSA.
Habitat loss from fragmentation is likely overestimated because the corridor is expected to largely parallel existing (Base Case) linear developments (e.g., Highway 599). The linear features of the Corridor Alternative Through Mishkeegogamang overlap with 82 km of existing disturbances while another 407 km are adjacent to existing disturbances (i.e., within 500 m).
Despite some increase in fragmentation, overall most upland ecosystems remain abundant and well-connected across the LSA and RSA to support healthy and functioning ecosystems.
6.1.8.1.3 Ecosystem Composition Forested areas in closer proximity to the Preliminary Proposed Corridor and corridor alternatives may be affected by removal of wildlife trees and other edge effects (e.g., sensory disturbance, ingress of generalist or invasive species, changes in moisture and sunlight) that can adversely influence conditions. Wildlife species associated with upland ecosystems, including species dependent on mature forest (e.g., blackburnian warbler [Setophaga fusca]) and wildlife tree users such as northern flickers (Colaptes auratus) were identified during baseline surveys (Appendix 6.1B). It is possible that these species may be adversely affected by changes in condition of upland ecosystems due to the Preliminary Proposed Corridor and corridor alternatives. Moreover, woodpeckers excavate cavities in wildlife trees that can subsequently be used by secondary cavity users, which are species that do not excavate their own cavities (Martin et al. 2004). Secondary cavity users include a large variety of species such as common goldeneye (Bucephala clangula), northern saw-whet owl (Aegolius acadicus), tree swallow (Tachycineta bicolor), red squirrel (Sciurus vulgaris), and American kestrel (Falco sparverius). Therefore, adverse effects on woodpeckers can indirectly affect various other wildlife species as well.
Native habitat edges are prone to ingress by non-native invasive species near disturbance. No noxious or invasive plant species were detected during baseline studies in Preferred Project Corridor (Appendix 6.1B). However, baseline surveys detected two non-native weed species. Hound’s-tongue (Cynoglossum officinale) was observed within the RSA in a Forest-dense mixed land cover class. Mouse-ear hawkweed (Hieracium pilosella) was observed within the RSA in a cutblock (Appendix 6.1B).
June 2017 Project No. 1535751 6-81
ENVIRONMENTAL ASSESSMENT REPORT FOR THE PHASE 1 NEW TRANSMISSION LINE TO PICKLE LAKE PROJECT SECTION 6.0: BIOLOGICAL ENVIRONMENT BASE CASE AND EFFECTS ASSESSMENT
6.1.8.1.4 Characterization of Project Case Effects A summary of the characterization of incremental adverse net effects of the Preliminary Proposed Corridor and corridor alternatives on upland ecosystems in the Project Case is provided for each indicator in Table 6.1-20. Net effects were described after the implementation of effective impact management measures, and summarized according to direction, magnitude, geographic extent, duration/reversibility, frequency/timing, and probability of the effect occurring following the methods described in Section 4.5.1. Effective implementation of impact management measures summarized in Table 6.1-15 is expected to reduce the magnitude and duration of net effects on upland ecosystems.
For the Preliminary Proposed Corridor and corridor alternatives, negative effects to the availability and distribution of upland ecosystems are predicted to be small, certain, continuous and local in scale. Construction of the Project is expected to remove upland habitats and the direct and indirect effects of the changes are predicted to be confined to the footprint and extend into the LSA, respectively. For the purposes of this assessment, changes to all three indicators that extend into the operations and maintenance stages are assumed to be irreversible for uplands disturbed by permanent access roads and towers. Effects to treed upland land cover classes in the corridor ROW would also be permanent due to maintaining a maximum vegetation height of approximately 2 m to meet safety requirements during operations. In contrast, effects to upland ecosystems from temporary access roads, laydown and construction camps are predicted to be reversible in the long-term. Reclamation of non-treed upland land cover classes along the corridor ROW is also expected to result in long-term reversible effects. The implementation of appropriate invasive species control during progressive reclamation would minimize the potential for invasive species to occupy upland ecosystems adjacent to the Project, and result in possible effects to ecosystem composition.
June 2017 Project No. 1535751 6-82
ENVIRONMENTAL ASSESSMENT REPORT FOR THE PHASE 1 NEW TRANSMISSION LINE TO PICKLE LAKE PROJECT SECTION 6.0: BIOLOGICAL ENVIRONMENT BASE CASE AND EFFECTS ASSESSMENT
Table 6.1-20: Description of Net Effects in the Project Case for Upland Ecosystems by Corridor
Indicator Characteristic Preliminary Proposed Corridor Corridor Alternative Around Mishkeegogamang
Corridor Alternative Through Mishkeegogamang
Ecosystem availability
Direction Negative Negative Negative Magnitude Predicted loss of 1,277 ha (1.6%
of the LSA Base Case; 0.4% of the RSA Base Case); loss of 2 ha (2.7% of Base Case) to the second least common land cover class (i.e., Bedrock); no loss to the least common Forest-regenerating depletion land cover class.
Predicted loss of 1,162 ha (1.7% of the LSA Base Case; 0.4% of the RSA Base Case); loss of <1 ha (1.8% of Base Case) is expected for the second least common land cover class (i.e., Bedrock); no loss to the least common Forest-regenerating depletion land cover class.
Predicted loss of 1,135 ha (1.8% of the LSA Base Case; 0.4% of the RSA Base Case); no predicted loss to uncommon land cover class (i.e., Bedrock).
Geographic extent Local Local Local Duration/ reversibility Permanent/Long-term Permanent/Long-term Permanent/Long-term Frequency/timing Continuous Continuous Continuous Probability of occurrence Certain Certain Certain
June 2017 Project No. 1535751 6-83
ENVIRONMENTAL ASSESSMENT REPORT FOR THE PHASE 1 NEW TRANSMISSION LINE TO PICKLE LAKE PROJECT SECTION 6.0: BIOLOGICAL ENVIRONMENT BASE CASE AND EFFECTS ASSESSMENT
Table 6.1-20: Description of Net Effects in the Project Case for Upland Ecosystems by Corridor
Indicator Characteristic Preliminary Proposed Corridor Corridor Alternative Around Mishkeegogamang
Corridor Alternative Through Mishkeegogamang
Ecosystem distribution
Direction Negative Negative Negative Magnitude Predicted loss to upland
ecosystems is primarily associated with the corridor ROW and new permanent access roads creating a more fragmented distribution of uplands. However, upland ecosystems remain well-connected in areas surrounding the Preliminary Proposed Corridor. Small disruption to the uncommon Bedrock land cover class.
Predicted loss to upland ecosystems is primarily associated with the corridor ROW and new permanent access roads creating a more fragmented distribution of uplands. However, upland ecosystems remain well-connected in areas surrounding the corridor alternative. Small disruption to the uncommon Bedrock land cover class.
Predicted loss to upland ecosystems is primarily associated with the corridor ROW and new permanent access roads creating a more fragmented distribution of uplands. However, upland ecosystems remain well-connected in areas surrounding the corridor alternative. No predicted loss to uncommon Bedrock land cover class.
Geographic extent Local Local Local Duration/ reversibility Permanent/Long-term Permanent/Long-term Permanent/Long-term Frequency/timing Continuous Continuous Continuous Probability of occurrence Certain Certain Certain
Ecosystem composition
Direction Negative Negative Negative Magnitude Edge effects and potential
introduction of invasive species may alter upland species abundance and richness.
Edge effects and potential introduction of invasive species may alter upland species abundance and richness.
Edge effects and potential introduction of invasive species may alter upland species abundance and richness.
Geographic extent Local Local Local Duration/ reversibility Permanent/Long-term Permanent/Long-term Permanent/Long-term Frequency/timing Continuous Continuous Continuous Probability of occurrence Possible Possible Possible
Significance rating Not significant Not significant Not significant Note: ha = hectare; LSA = local study area; RSA = regional study area; % = percent.
June 2017 Project No. 1535751 6-84
ENVIRONMENTAL ASSESSMENT REPORT FOR THE PHASE 1 NEW TRANSMISSION LINE TO PICKLE LAKE PROJECT SECTION 6.0: BIOLOGICAL ENVIRONMENT BASE CASE AND EFFECTS ASSESSMENT
6.1.8.1.5 Determination of Significance Historically, boreal forest composition and structure was primarily driven by wildfire, insect outbreaks, and disease, while more recently large-scale timber harvesting and controlled fire suppression play key roles in forest composition and structure. For the Preliminary Proposed Corridor and corridor alternatives, past and present developments have already removed and altered upland ecosystems in the RSAs. However, uplands remain abundant and well distributed and connected in the RSAs in the Base Case. For example, the RSAs contain from approximately 48% to 58% (192,000 to 271,500 ha) undisturbed upland ecosystems. Recently burned and harvested upland areas (<40 years of age) comprise from 4% to 12% of the RSAs. Similar relative values (i.e., percentages) describe existing conditions in the LSAs for the Preliminary Proposed Corridor and corridor alternatives. At Base Case, the most common forest age class is the mature (81 to 110 years) seral stage and comprises approximately 35% of seral stages in the RSAs for the Preliminary Proposed Corridor and corridor alternatives (based on FRI coverage). There are moderate amounts of sapling (11 to 30 years) and immature (31 to 80 years) forested areas, relative to other seral stages in the LSAs and RSAs. Pre-sapling (0 to 10 years) and late-successional (111 years and older) are less common on the landscape.
The rare bur oak vegetation community can be found as part of the NW30 ecosite and is included in upland ecosystems for the Preliminary Proposed Corridor. This ecosite was not identified in the RSAs for the corridor alternatives at Base Case. There is 39 ha (<0.1%) of the NW30 ecosite within the LSA and 141 ha (<0.1%) within the RSA of the Preliminary Proposed Corridor; however this ecosite is not affected by the current Project footprint. Several CLVA were identified in the ecodistricts that intersect with the LSA. The upland CLVAs areas are approximately 416,598 ha, 395,850 ha, and 395,853ha for the Preliminary Proposed Corridor and corridor alternatives around and through Mishkeegogamang, respectively. No federally-listed plant species (SARA or COSEWIC), provincially listed COSSARO species or species tracked by NHIC were observed during the baseline plant community surveys in the Preliminary Proposed Corridor. Although baseline surveys detected two non-native weed species in the Preliminary Proposed Corridor RSA (hound’s-tongue within Forest-dense mixed habitat and mouse-ear hawkweed within a cutblock), no species listed as a noxious weeds in Ontario were observed.
Overall, upland ecosystems are expected to have the capacity to adapt and be resilient to existing natural and human-related disturbances and associated variations in availability and distribution. Therefore, the combined evidence on upland ecosystem availability, distribution, and composition (condition) indicates uplands are self-sustaining and ecologically effective in the Base Case.
The Project is predicted to contribute to small negative changes in upland ecosystem availability, distribution, and composition. These changes are expected to be within the existing resilience limits and adaptive capacity of upland ecosystems in the RSAs. For example, the incremental loss to the available upland ecosystems for the Preliminary Proposed Corridor and corridor alternatives around and through Mishkeegogamang is calculated to be 1,277 ha, 1,162 ha, and 1,135 ha, respectively. These changes should have no to little influence on ecological structure and function; approximately 98% and 99% of upland ecosystems present in the Base Case are predicted to remain in the Project Case within the LSAs and RSAs for the Preliminary Proposed Corridor and corridor alternatives. In addition, the Preliminary Proposed Corridor and corridor alternatives have been designed to cause little to no disturbance to the second least common land cover class (i.e., Bedrock).
Some small changes to forest seral stages are also predicted. The Preliminary Proposed Corridor is estimated to decrease the amount of mature and late-successional forest by 303 ha and 38 ha, respectively. Approximately
June 2017 Project No. 1535751 6-85
ENVIRONMENTAL ASSESSMENT REPORT FOR THE PHASE 1 NEW TRANSMISSION LINE TO PICKLE LAKE PROJECT SECTION 6.0: BIOLOGICAL ENVIRONMENT BASE CASE AND EFFECTS ASSESSMENT
368 ha of mature forest and 137 ha of late-successional forest will be removed by the Corridor Alternative Around Mishkeegogamang, and similar values (360 ha mature and 130 ha late-successional) are anticipated to be altered by the Corridor Alternative Through Mishkeegogamang. Relative to the Base Case, these changes in availability represent less than 2% of the LSAs and less than 1% of the RSAs for the Preliminary Proposed Corridor and corridor alternatives. The Preliminary Proposed Corridor is predicted not to disturb the NW30 ecosite upland rare bur oak vegetation community, and would cause a calculated loss of 1 ha (<0.01% of the Base Case) to upland CLVA within the ecodistricts that intersect with the LSA. Similarly, the corridor alternatives around and through Mishkeegogamang are each expected to result in a loss of 23.7 ha (0.01% of the Base Case) to upland CLVAs within the ecodistricts that intersect with the LSAs.
Forest clearing for construction of the Project can change moisture and sunlight regimes, and facilitate the ingress of non-native and native invasive species, which negatively alters plant species abundance and richness in upland ecosystems. Sensory disturbance during construction can also adversely influence wildlife species abundance and distribution, further affecting the biodiversity supported by upland habitats. Wataynikaneyap will implement a number of impact management measures policies and practices to avoid and minimize the effects on upland ecosystem composition. For example, vehicles will be cleaned and inspected for vegetation and seeds, and weed management and monitoring plans will be carried out to prevent and limit the risk of spreading noxious and invasive weeds. Natural re-vegetation will be preferred over seed mixes for reclamation. Impact management measures to minimize sensory disturbance to wildlife includes using existing access roads to avoid new clearing of vegetation as much as possible, selective clearing and retention of shrubs, trees and wildlife trees, and progressive reclamation of temporary access roads, laydown and staging areas, and construction camps (Section 6.3; Table 6.3-19).
With effective implementation of impact management measures, the incremental contribution of the Project to combined effects from previous and existing developments on upland ecosystems in the RSAs is not expected to change the self-sustaining and ecologically effective status of this criterion. Consequently, effects on upland ecosystems in the Project Case are predicted to be not significant (Table 6.1-20).
June 2017 Project No. 1535751 6-86
ENVIRONMENTAL ASSESSMENT REPORT FOR THE PHASE 1 NEW TRANSMISSION LINE TO PICKLE LAKE PROJECT SECTION 6.0: BIOLOGICAL ENVIRONMENT BASE CASE AND EFFECTS ASSESSMENT
6.1.8.2 Reasonably Foreseeable Developments Case Effects Assessment 6.1.8.2.1 Ecosystem Availability The RFD Case includes the Project and past, existing and reasonably foreseeable developments. The RFDs that did not have footprints available at the time of analysis and reporting are described in Table 6.1-17 (Section 4.6), and are expected to contribute to decreases in the availability of upland habitats. Those RFDs that were quantified are summarized for the Preliminary Proposed Corridor and corridor alternatives below. Details on the area of predicted loss of specific land cover classes of upland ecosystems in the RFD Case are provided in Appendix 6.1D.
Preliminary Proposed Corridor
Below is a summary of RFD-related changes to upland ecosystem availability in the Preliminary Proposed Corridor LSA and RSA (Table 6.1-21; Appendix 6.1A, Figures 6.1A-13; Appendix 6.1D):
Loss of 5,037 ha (1.5% of Base Case) in the RFD Case to upland ecosystems in the RSA.
Loss of 1,974 ha (2.5% of Base Case) in the RFD Case to upland ecosystems in the LSA.
Largest predicted loss by percent change in the RSA – Forest – regenerating depletion with a 19.3% change from Base Case and an absolute predicted loss of 2 ha.
Largest predicted loss by percent change in the LSA – Forest – sparse with a 3.1% change from Base Case and an absolute predicted loss of 501 ha.
Largest absolute changes (ha) – Forest – dense coniferous with 1,016 ha (2.8% of Base Case) in the LSA and 2,576 ha (1.7% of Base Case) in the RSA.
As described above, there is expected to be a change of 2 ha (19.3% of Base Case) to the least common land cover class, Forest regenerating depletion in the RSA. No changes are expects in the LSA to this land cover class. There is expected to be a 2 ha change (2.7% of Base Case LSA and 1.3% of the Base Case RSA) to the second least common land cover class (i.e., Bedrock).
Loss of 2 ha (1.3% of Base Case LSA; 2.7% of Base case RSA) to non-forested areas in the LSA and RSA from RFDs.
Loss of 1,972 (2.5% of Base Case) to forested areas in the LSA and 5,035 ha (1.5% of Base Case) to forested areas in the RSA.
June 2017 Project No. 1535751 6-87
ENVIRONMENTAL ASSESSMENT REPORT FOR THE PHASE 1 NEW TRANSMISSION LINE TO PICKLE LAKE PROJECT SECTION 6.0: BIOLOGICAL ENVIRONMENT BASE CASE AND EFFECTS ASSESSMENT
Corridor Alternative Around Mishkeegogamang
Below is a summary of RFD-related changes to upland ecosystem availability in the Corridor Alternative Around Mishkeegogamang LSA and RSA (Table 6.1-21; Appendix 6.1A, Figures 6.1A-14; Appendix 6.1D):
Loss of 10,793 ha (3.8% of Base Case) in the RFD Case to upland ecosystems in the RSA.
Loss of 3,049 ha (4.6% of Base Case) in the RFD Case to upland ecosystems in the LSA.
Largest predicted loss by percent change and absolute value (ha) - Forest - dense coniferous with a 6.2% change from Base Case and an absolute loss of 1,909 ha in the LSA and a 5.1% change from Base Case and an absolute loss of 6,729 ha in the RSA.
There is expected to be a 2 ha change (1.3% of Base Case RSA) to the least common land cover class (i.e., Forest regenerating depletion). No changes are expected to this land cover class in the LSA. There is expected to be a less than 1 ha change (1.8% of Base Case LSA and 0.3% of Base Case RSA) to the second least common land cover class (i.e., Bedrock).
Loss of less than 1 ha (1.8% of Base Case LSA; 0.3% of Base case RSA) to non-forested areas in the LSA and RSA from RFDs.
Loss of 3,048 (4.6% of Base Case) to forested areas in the LSA and 10,793 ha (3.8% of Base Case) to forested areas in the RSA.
Corridor Alternative Through Mishkeegogamang
Below is a summary of RFD-related changes to upland ecosystem availability in the Corridor Alternative Through Mishkeegogamang LSA and RSA (Table 6.1-21; Appendix 6.1A, Figures 6.1A-15; Appendix 6.1D):
Loss of 10,767 ha (3.9% of Base Case) in the RFD Case to upland ecosystems in the RSA.
Loss of 3,022 ha (4.7% of Base Case) in the RFD Case to upland ecosystems in the LSA.
Largest predicted loss by percent change and absolute value (ha) – Forest – dense coniferous with a 6.5% change from Base Case and an absolute predicted loss of 1,897 ha in the LSA and a 5.3% change from Base Case and an absolute loss of 6,717 ha in the RSA.
The Corridor Alternative Through Mishkeegogamang is not expected to disturb the least common and available land cover classes in the study areas (i.e., Bedrock).
There is no loss to non-forested areas in the RSA and LSA.
Loss of 3,022 ha (4.7% of Base) to forested areas in the LSA and 10,767 ha (3.9% of Base Case) to forested areas in the RSA.
June 2017 Project No. 1535751 6-88
ENVIRONMENTAL ASSESSMENT REPORT FOR THE PHASE 1 NEW TRANSMISSION LINE TO PICKLE LAKE PROJECT SECTION 6.0: BIOLOGICAL ENVIRONMENT BASE CASE AND EFFECTS ASSESSMENT
Table 6.1-21: Predicted Changes to Upland Ecosystem Availability in the Reasonably Foreseeable Development Case by Corridor
Total 64,759 61,737 -3,022 -4.7 274,067 263,300 -10,767 -3.9 Note: Some numbers are rounded for presentation purposes. Therefore, it may appear that the totals do not equal the sum of the individual values. The total percent change is calculated relative to the total area and therefore this value will not equal the sum of the individual values. Burns and Cutblocks are less than or equal to 40 years of age. ha = hectare; RFD = reasonably foreseeable developments; % = percent.
June 2017 Project No. 1535751 6-89
ENVIRONMENTAL ASSESSMENT REPORT FOR THE PHASE 1 NEW TRANSMISSION LINE TO PICKLE LAKE PROJECT SECTION 6.0: BIOLOGICAL ENVIRONMENT BASE CASE AND EFFECTS ASSESSMENT
This page intentionally left blank
June 2017 Project No. 1535751 6-90
ENVIRONMENTAL ASSESSMENT REPORT FOR THE PHASE 1 NEW TRANSMISSION LINE TO PICKLE LAKE PROJECT SECTION 6.0: BIOLOGICAL ENVIRONMENT BASE CASE AND EFFECTS ASSESSMENT
Seral Stages Below is a summary of RFD-related changes in availability of seral stages due to the Preliminary Proposed Corridor and corridor alternatives (Table 6.1-22).
Preliminary Proposed Corridor
Late-successional (111 years and older) forests – loss of 38 ha (1.3% of the Base Case) in the LSA; loss of 76 ha (0.5% of the Base Case) in the RSA.
Mature (81-110 years) – loss of 303 ha (1.6% of the Base Case) in the LSA; loss of 345 ha (0.4% of the Base Case) in the RSA.
Corridor Alternative Around Mishkeegogamang
Late-successional (111 years and older) forests – loss of 205 ha (2.5% of the Base Case) in the LSA; loss of 774 ha (2.2% of the Base Case) in the RSA.
Mature (81-110 years) – loss of 1,326 ha (6.2% of the Base Case) in the LSA; loss of 5,125 ha (6.1% of the Base Case) in the RSA.
Corridor Alternative Through Mishkeegogamang
Late-successional (111 years and older) forests – loss of 199 ha in the LSA (2.6% of the Base Case) in the LSA; loss of 767 ha (2.3% of the Base Case) in the RSA.
Mature (81-110 years) – loss of 1,318 ha in the LSA (6.3% of the Base Case) in the LSA; loss of 5,117 ha (6.2% of the Base Case) in the RSA.
June 2017 Project No. 1535751 6-91
ENVIRONMENTAL ASSESSMENT REPORT FOR THE PHASE 1 NEW TRANSMISSION LINE TO PICKLE LAKE PROJECT SECTION 6.0: BIOLOGICAL ENVIRONMENT BASE CASE AND EFFECTS ASSESSMENT
This page intentionally left blank
June 2017 Project No. 1535751 6-92
ENVIRONMENTAL ASSESSMENT REPORT FOR THE PHASE 1 NEW TRANSMISSION LINE TO PICKLE LAKE PROJECT SECTION 6.0: BIOLOGICAL ENVIRONMENT BASE CASE AND EFFECTS ASSESSMENT
Table 6.1-22: Structural Stages in the Reasonably Foreseeable Developments Case by Corridor
Total 57,800 55,517 -2,283 -4.0 236,478 229,227 -7,250 -3.1 Note: Some numbers are rounded for presentation purposes. Therefore, it may appear that the totals do not equal the sum of the individual values. Seral stage totals are based on upland and wetland ecosites identified as Forest (FOR) only from the FRI as age classes are not provided for other polytypes in the FRI. ha = hectare; RFD = reasonably foreseeable developments; % = percent.
June 2017 Project No. 1535751 6-93
ENVIRONMENTAL ASSESSMENT REPORT FOR THE PHASE 1 NEW TRANSMISSION LINE TO PICKLE LAKE PROJECT SECTION 6.0: BIOLOGICAL ENVIRONMENT BASE CASE AND EFFECTS ASSESSMENT
This page intentionally left blank
June 2017 Project No. 1535751 6-94
ENVIRONMENTAL ASSESSMENT REPORT FOR THE PHASE 1 NEW TRANSMISSION LINE TO PICKLE LAKE PROJECT SECTION 6.0: BIOLOGICAL ENVIRONMENT BASE CASE AND EFFECTS ASSESSMENT
Rare Vegetation Communities The rare bur oak vegetation community can be found as part of the NW30 ecosite and is included in upland ecosystems for the Preliminary Proposed Corridor (this ecosite was not identified in the RSAs for the corridor alternatives). There is no loss of the NW30 ecosite within the Preliminary Proposed Corridor LSA or RSA.
Forest Management Plans and Other Factors of Change to Upland Ecosystems It is the responsibility of the MNRF to manage forests in a sustainable manner and provide healthy forests for future generations (MNR 2012). Forest health and values are managed through the use of forest guides. Pest control and forest fire management are other tools used to maintain healthy forests (MNR 2012). The annual average harvest from 2004 to 2008 in Ontario boreal forests was 180,447 ha (MNR 2012). It is noted that these years provide an example of a reduced harvest relative to previous years (MNR 2012). Reductions in forest harvesting and the suppression of fire and insects could lead to a shift to older forests over time in the RSAs. While this shift provides habitat for species that rely on older forests, it may reduce the amount of available habitat for species that rely on younger forests. The average annual area regenerated across Ontario forests from 2004 to 2008 was 202,947 ha (approximately 13% higher than the average annual harvest) showing that renewal efforts were greater than harvesting.
Each of the FMUs across the RSAs has an FMP that describes future plans and expected forest structure and age. These FMPs are summarized as follows:
Caribou FMP – Management objectives to minimize road access throughout this remote forest unit aim to focus road-based recreation in current harvest blocks, while previous roads are decommissioned. Forestry operations anticipated for the 2016 to 2017 period include the harvest of approximately 15,250 ha of forest, primarily focused on upland and lowland coniferous forest (84%) and mixedwood forest (10.6%). Long-term management strategies for the Caribou Forest include gradually increasing conifer cover to bring conditions in line with what would be observed under a natural disturbance regime by fire. Hardwood cover and mixedwood cover are anticipated to decrease in favour of pure conifer stands, which is also consistent with natural conditions of a fire-dominated disturbance regime.
Dryden FMP – The 10-year management plan outlines a harvest area of 11,910 ha to be clearcut. By volume, the largest species group to be harvested is conifer (i.e., spruce-pine-fir) and poplar. Long-term management plans are focused on increasing the amount of red pine dominated mixedwood forest, as well as pure hardwood and conifer stands, to resemble conditions that would have been created by natural forest-fire disturbance regimes. Abundant reserves of gold, silver and zinc remain available in the forest unit, in addition to reserves of peat and granite. Over 2,000 active mining claims are recorded for the Dryden Forest unit. An additional 49 km of road are planned to be constructed over the next ten years.
English River FMP – Long-term management objectives aim to increase or maintain the conifer component of the forest, while minimizing the hardwood component. This is intended to better reflect natural conditions under a forest fire regime, and based on market demand that underutilizes hardwood lumber. There are a large number of existing primary, branch and operational roads and others planned to be constructed over the next ten years. It is expected that mining activity will continue to increase and will benefit from forest industry’s road construction and maintenance programs. Mineral exploration operations may benefit by utilizing areas cleared of timber.
June 2017 Project No. 1535751 6-95
ENVIRONMENTAL ASSESSMENT REPORT FOR THE PHASE 1 NEW TRANSMISSION LINE TO PICKLE LAKE PROJECT SECTION 6.0: BIOLOGICAL ENVIRONMENT BASE CASE AND EFFECTS ASSESSMENT
Lac Seul FMP – Over the planning period of 2011 to 2021, a total of 53,056 ha of forest are forecasted for clearcut harvest. Future harvest is planned to focus on areas within the 41 to 80-year age class. Old growth areas (>80 years) are slated for deferral to meet management objectives for caribou habitat. Long-term management goals aim to reduce cover of balsam fir dominated stands in the southern portion of the FMU where fire suppression and early harvesting has led to an imbalance in forest composition. Management goals aim to restore this portion to natural conditions characteristic of the boreal forest and a natural forest fire regime. There are a large number of existing primary, branch and operational roads and an additional 308 km planned to be constructed over the planning period. It is expected that mining activity will continue to increase and will benefit from forest industry’s road construction and maintenance programs. Mineral exploration operations may benefit by utilizing areas cleared of timber.
Wabigoon FMP – Over the 10-year planning period (2008-2018), a total of 72,719 ha of forest is forecasted for harvest. There are a large number of existing primary, branch and operational roads and others to be constructed over the ten year planning period. It is expected that mining activity will continue to increase and will benefit from forest industry’s road construction and maintenance programs. Mineral exploration operations may benefit by utilizing areas cleared of timber.
Changes in upland ecosystems due to climate change are qualitatively discussed in this assessment. Based on warming trends, the annual mean temperature in Ontario is predicted to increase by 5 to 6 degrees Celsius (°C) by the end of the 21st century (McKenney et al. 2010). More conservative estimates predict that the temperature will rise 3.6°C, which take into account actions to reduce greenhouse gas emissions. The combination of higher temperature paired with predicted increase in the occurrence of fire are expected to reduce the amount of area covered by boreal forests (Thompson et al. 1998, Varrin et al. 2007). In contrast, some literature reviews suggest that fire frequency may decrease in large regions of the northern hemisphere. Depending on the rate of climate change, there may be increased forest mortality for species that are unable to adapt to changes fast enough (Thompson et al. 1998). Species that are adapted to regenerate following fire such as pine and aspen are predicted to increase in the landscape leading to a homogenization of species on the landscape (Thompson et al. 1998, Iverson and Prasad 2001, Varrin et al. 2007). Warming is expected to be greater in the winter versus the summer with more increases in the north versus the south of the province (Colombo et al. 2007).
6.1.8.2.2 Ecosystem Distribution Changes in upland ecosystem distribution in the RFD Case are summarized for the Preliminary Proposed Corridor and corridor alternatives below. Changes in the distribution of upland ecosystems due to climate change were not quantified here. However, due to increases in temperature associated with climate change, there may be shifts of species more northward and a reduction in spruce, with greater amounts of pine and aspen on the landscape (Thompson et al. 1998, Iverson and Prasad 2001, Varrin et al. 2007). Within the Preliminary Proposed Corridor and corridor alternatives, the distribution of upland ecosystems in the LSA and RSA would be similar to the distribution in the Base Case. Connectivity among upland ecosystems is expected to be maintained despite increased fragmentation.
June 2017 Project No. 1535751 6-96
ENVIRONMENTAL ASSESSMENT REPORT FOR THE PHASE 1 NEW TRANSMISSION LINE TO PICKLE LAKE PROJECT SECTION 6.0: BIOLOGICAL ENVIRONMENT BASE CASE AND EFFECTS ASSESSMENT
Preliminary Proposed Corridor
Below is a summary of RFD Case-related changes to upland ecosystem distribution in the Preliminary Proposed Corridor LSA and RSA (compare Appendix 6.1A, Figures 6.1A-1 and Figures 6.1A-13):
Most notable changes are to upland habitat distribution is predicted to occur within the Treasury Metals Inc. Goliath Gold Project and First Mining's Pickle Crow Gold Project where the cumulative effects of mining would increase fragmentation of existing upland habitat.
Linear disturbance density LSA – increases from 0.62 km/km2 in the Base Case to 1.23 km/km2 for the RFD Case.
Linear disturbance density RSA – increases from 0.47 km/km2 in the Base Case to 0.61 km/km2 for the RFD Case.
Corridor Alternative Around Mishkeegogamang
Below is a summary of RFD Case-related changes to upland ecosystem distribution in the Corridor Alternative Around Mishkeegogamang LSA and RSA (compare Appendix 6.1A, Figures 6.1A-2 and Figures 6.1A-14):
Most notable changes are to upland habitat distribution is predicted to occur within the First Mining's Pickle Crow Gold Project and New Dimensions Savant Lake Gold Project where the cumulative effects of mining would increase fragmentation of existing upland habitat.
Linear disturbance density LSA – increases from 0.55 km/km2 in the Base Case to 1.07 km/km2 for the RFD Case.
Linear disturbance density RSA – increases from 0.48 km/km2 in the Base Case to 0.60 km/km2 for the RFD Case.
Corridor Alternative Through Mishkeegogamang
Below is a summary of RFD Case-related changes to upland ecosystem distribution in the Corridor Alternative Through Mishkeegogamang LSA and RSA (compare Appendix 6.1A, Figures 6.1A--3 and Figures 6.1A-15):
Most notable changes are to upland habitat distribution is predicted to occur within the First Mining's Pickle Crow Gold Project and New Dimensions Savant Lake Gold Project where the cumulative effects of mining would increase fragmentation of existing upland habitat.
Linear disturbance density LSA – increases from 0.61 km/km2 in the Base Case to 1.12 km/km2 for the RFD Case.
Linear disturbance density RSA – increases from 0.50 km/km2 in the Base Case to 0.62 km/km2 for the RFD Case.
June 2017 Project No. 1535751 6-97
ENVIRONMENTAL ASSESSMENT REPORT FOR THE PHASE 1 NEW TRANSMISSION LINE TO PICKLE LAKE PROJECT SECTION 6.0: BIOLOGICAL ENVIRONMENT BASE CASE AND EFFECTS ASSESSMENT
6.1.8.2.3 Ecosystem Composition Upland ecosystems in close proximity to new developments may be affected by removal of wildlife trees1 and other edge effects (e.g., sensory disturbance, ingress of generalist or invasive species, alteration in moisture and sunlight regimes) that change conditions. Natural upland ecosystem edges are prone to ingress by generalist wildlife species (i.e., species that will use a variety of habitats) that may displace specialists. Natural areas with undisturbed soils that occur away from disturbances are resistant to invasion by non-native plant species. The implementation of the Invasive Species Management Plan (Section 9.3.1.7) to control invasive species during construction and progressive reclamation would minimize the potential for invasive species to occupy upland ecosystems adjacent to the Project. However, invasive species could become more prevalent in other parts of the RSA if they were not managed to the same degree as the Project. For example, forestry roads and logging equipment could facilitate the spread of invasive species, particularly on private timberlands where new access roads would be required.
Specific impact management measures for tracked rare plants in upland ecosystems include implementing the Rare Plant Management Plan (Section 9.3.1.4) in the event that a rare plant species or a rare vegetation community are suspected or encountered unexpectedly, or cannot be avoided. Site-specific features (e.g., rare vegetation community, wetland, significant wildlife habitat) will be clearly marked. It is expected that RFDs will be required to implement similar impact management measures that will limit cumulative effects on tracked rare plants.
Climate change could influence upland ecosystem composition as increases in air temperature may lead to greater land area extension of tree defoliation caused by spruce budworm especially in the northern portions of the province (Candau and Fleming 2011). Increases in invasive species and pests could put greater stresses on biodiversity and tree species in the region (MNR 2012). Warmer temperatures could create conditions that may be inhospitable to some species while favoring others, thereby affecting community composition (Huff and Thomas 2014, Varrin et al. 2007). Boreal tree species (e.g., black spruce, Jack pine, white spruce, balsam fir and trembling aspen) are predicted to migrate northwards; however, because trees are long-lived species with slow migration rates some trees are likely to become less adapted to climate conditions making them susceptible to mortality (Canadian Council of Forest Ministers 2010). Other pests that pose potential risks to Ontario forests include invasive kudzu (Pueraria montana) and dog-straggling vine (Vincetaxicum rossicum) (MNR 2012). The MNRF and Invasive Species Centre (ISC) are working together to improve invasive species prevention, management and research (MNR 2012).
6.1.8.2.4 Characterization of Reasonably Foreseeable Development Case Effects A summary of the characterization of cumulative effects from the Preliminary Proposed Corridor and corridor alternatives, and past, present and RFDs on upland ecosystems in the RFD Case is provided for each indicator in Table 6.1-23. All impact management measures to avoid and minimize effects from the Preliminary Proposed Corridor and corridor alternatives in the Project Case apply to the RFD Case. It is expected that RFDs will be required to implement similar impact management measures policies and practices that will limit cumulative effects on upland ecosystems.
1 A standing dead or dying tree or a live veteran tree that is important for wildlife because it provides areas for nests, nurseries, storage, foraging, roosting, and perching.
June 2017 Project No. 1535751 6-98
ENVIRONMENTAL ASSESSMENT REPORT FOR THE PHASE 1 NEW TRANSMISSION LINE TO PICKLE LAKE PROJECT SECTION 6.0: BIOLOGICAL ENVIRONMENT BASE CASE AND EFFECTS ASSESSMENT
Effects from RFDs to ecosystem availability and distribution are likely less than certain (i.e., probable or possible) due to the uncertainty in the construction and operation of these projects. However, to avoid underestimating the significance of effects, changes in ecosystem availability and distribution from RFDs were classified as certain (i.e., precautionary approach). Similarly, for the purpose of this assessment, the predicted loss of upland habitat due to the RFDs is permanent as reclamation plans are not available for these projects, and long-term for temporary Project components that are expected to be reclaimed. The effects from climate change are uncertain, but would influence the magnitude of development-related changes in upland ecosystems and the geographic extent of effects would occur beyond the RSAs.
Table 6.1-23: Description of Effects in the Reasonably Foreseeable Developments Case for Upland Ecosystems Indicators by Corridor
Direction Negative Negative Negative Magnitude Upland ecosystem
availability would be reduced by 5,037 ha (1.5%) in the RSA relative to the Base Case. Loss of 2 ha (19.3% of Base Case) to the uncommon Forest regenerating depletion land cover class and loss of 2 ha (1.3% of Base Case) to the uncommon Bedrock land cover class in the RSA. Magnitude will depend on influences from climate change.
Upland ecosystem availability would be reduced by 10,793 ha (3.8%) in the RSA relative to the Base Case. Loss of 2 ha (1.3% of Base Case) to the uncommon Forest regenerating depletion land cover class and loss of <1 ha (0.3% of Base Case) to the uncommon Bedrock land cover class in the RSA. Magnitude will depend on influences from climate change.
Upland ecosystem availability would be reduced by 10,767 ha (3.9%) in the RSA relative to the Base Case. Loss of 2 ha change (1.3% of Base Case) to the uncommon land cover class (i.e., Forest regenerating depletion) in the RSA. No loss to the uncommon bedrock land cover class. Magnitude will depend on influences from climate change.
Geographic extent Beyond regional (due to climate change)
Frequency/timing Continuous Continuous Continuous Probability of occurrence
Certain Certain Certain
June 2017 Project No. 1535751 6-99
ENVIRONMENTAL ASSESSMENT REPORT FOR THE PHASE 1 NEW TRANSMISSION LINE TO PICKLE LAKE PROJECT SECTION 6.0: BIOLOGICAL ENVIRONMENT BASE CASE AND EFFECTS ASSESSMENT
Table 6.1-23: Description of Effects in the Reasonably Foreseeable Developments Case for Upland Ecosystems Indicators by Corridor
Direction Negative Negative Negative Magnitude The distribution of
upland ecosystems in the LSA and RSA in the RFD Case would be similar to the distribution in the Base Case. There would be some loss and fragmentation of upland ecosystems throughout the RSA. Magnitude will depend on influences from climate change.
The distribution of upland ecosystems in the LSA and RSA in the RFD Case would be similar to the distribution in the Base Case. There would be some loss and fragmentation of upland ecosystems throughout the RSA. Magnitude will depend on influences from climate change.
The distribution of upland ecosystems in the LSA and RSA in the RFD Case would be similar to the distribution in the Base Case. There would be some loss and fragmentation of upland ecosystems throughout the RSA. Magnitude will depend on influences from climate change.
Geographic extent Beyond regional (due to climate change)
Frequency/timing Continuous Continuous Continuous Probability of occurrence
Possible Possible Possible
Significance rating Not significant Not significant Not significant Note: LSA = local study area; RFD = reasonably foreseeable development; RSA = regional study area.
June 2017 Project No. 1535751 6-100
ENVIRONMENTAL ASSESSMENT REPORT FOR THE PHASE 1 NEW TRANSMISSION LINE TO PICKLE LAKE PROJECT SECTION 6.0: BIOLOGICAL ENVIRONMENT BASE CASE AND EFFECTS ASSESSMENT
6.1.8.2.5 Determination of Significance For the Preliminary Proposed Corridor and corridor alternatives, climate change may alter the processes that influence the abundance and distribution of upland ecosystems, and effects would likely occur beyond the RSA. Based on warming trends, the annual mean temperature in Ontario is predicted to increase by 5 to 6°C by the end of the 21st century (McKenney et al. 2010). Boreal tree species (e.g., black spruce, Jack pine, white spruce, balsam fir and trembling aspen) are predicted to migrate northwards; however, because trees are long-lived species with slow migration rates some trees are likely to become less adapted to climate conditions making them susceptible to mortality (Canadian Council of Forest Ministers 2010). Overall, it is uncertain whether or not climate change will positively or negatively affect upland ecosystems, but it will influence the magnitude and geographic extent of effects to this criterion.
The suppression of fire and insects could lead to a shift in older forests over time. While this shift provides habitat for species that rely on older forests, it may reduce the amount of available habitat for species that rely on younger forests. Future forest harvesting would also change the availability, distribution and composition of upland ecosystems in the RSAs. The goal of many FMPs is to achieve a forest age and composition structure similar to historical conditions prior to human development and fire suppression. Historically, the forest composition had more pure conifer stands and was younger in age. Targets for selectively leaving some wildlife trees in harvested areas and slating areas for old growth deferrals are part of some FMP goals. Meeting these targets is expected to support the maintenance of self-sustaining and ecologically effective upland ecosystems within and beyond the RSAs.
Upland ecosystem availability would be reduced by 1.5% to 4.7% in the Preliminary Proposed Corridor and corridor alternatives LSAs and RSAs relative to the Base Case. The most notable change in upland ecosystem availability, distribution and composition is likely to occur from Treasury Metals Inc. Goliath Gold Project and First Mining's Pickle Crow Gold Project in the Preliminary Proposed Corridor. Within the corridor alternatives, the most notable changes from RFDs are from the First Mining's Pickle Crow Gold Project and New Dimensions Savant Lake Gold Project.
For the Preliminary Proposed Corridor RSA, there is expected to be a 2 ha change (1.3% of the Base Case RSA) to the uncommon land cover class (i.e., Bedrock). Within the corridor alternative RSAs, there is a less than 1 ha change to the Bedrock for the Corridor Alternative Around Mishkeegogamang and no changes for the Corridor Alternative Through Mishkeegogamang.
There is no loss of the NW30 ecosite within the Preliminary Proposed Corridor LSA or RSA. The RFDs that could not be quantified (e.g., gold mines and transportation projects) also have the potential to interact and reduce the availability and distribution of uplands in the RSA, but these projects would also be expected to mitigate effects to upland ecosystems.
In the RFD Case, the Preliminary Proposed Corridor, corridor alternatives, and other RFDs would contribute to adverse changes in upland ecosystem availability, distribution, and condition; however, these changes are predicted to be within the resilience limits and adaptive capacity of existing upland ecosystems. Relative to the Base Case, most uplands remain abundant, intact and well distributed across the RSAs in the RFD Case. The contribution of the Preliminary Proposed Corridor, corridor alternatives, and RFDs to cumulative effects on upland ecosystems in the RSAs is not expected to change the self-sustaining and ecologically effective status of this criterion. Consequently, cumulative effects on upland ecosystems in the RFD Case are predicted to be not significant (Table 6.1-23).
June 2017 Project No. 1535751 6-101
ENVIRONMENTAL ASSESSMENT REPORT FOR THE PHASE 1 NEW TRANSMISSION LINE TO PICKLE LAKE PROJECT SECTION 6.0: BIOLOGICAL ENVIRONMENT BASE CASE AND EFFECTS ASSESSMENT
Below is a summary of Preliminary Proposed Corridor-related changes to wetland ecosystem availability in the LSA and RSA (Table 6.1-24; Appendix 6.1A, Figures 6.1A-16; Appendix 6.1D):
Loss of 56 ha (1.1% of the Base Case LSA; 0.3% of the Base Case RSA) of wetland ecosystems.
Largest predicted loss by percent change and absolute value (ha) – Bog – treed with a 1.3% change from Base Case and an absolute predicted loss of 43 ha in the LSA.
The Preliminary Proposed Corridor is not expected to disturb the least common and available land cover class in the study areas (i.e., Fen-open).
Corridor Alternative Around Mishkeegogamang
Below is a summary of Corridor Alternative Around Mishkeegogamang-related changes to wetland ecosystem availability in the LSA and RSA (Table 6.1-24; Appendix 6.1A, Figures 6.1A-17; Appendix 6.1D):
Loss of 43 ha (1.1% of the Base Case LSA; 0.2% of the Base Case RSA) of wetland ecosystems.
Largest predicted loss by percent change and absolute value (ha) – Bog – treed with a 1.2% change from Base Case and an absolute predicted loss of 31 ha in the LSA.
The Corridor Alternative Around Mishkeegogamang is expected to disturb 2 ha (0.9% of Base Case) of the least common and available land cover class (i.e., Fen-open) in the study areas.
Corridor Alternative Through Mishkeegogamang
Below is a summary of Corridor Alternative Through Mishkeegogamang-related changes to wetland ecosystem availability in the LSA and RSA (Table 6.1-24; Appendix 6.1A, Figures 6.1A-18, Appendix 6.1D):
Loss of 41 ha (1.2% of the Base Case LSA; 0.3% of the Base Case RSA) of wetland ecosystems.
Largest predicted loss by percent change – Bog – open with a 1.9% change from Base Case and an absolute predicted loss of 7 ha in the LSA.
Largest absolute changes (ha) – Bog – treed of 28 ha (1.3% of Base Case) in the LSA.
The Corridor Alternative Through Mishkeegogamang is expected to disturb 1 ha (0.6% of Base Case) of the least common and available land cover class (i.e., Fen-open) in the study areas.
June 2017 Project No. 1535751 6-102
ENVIRONMENTAL ASSESSMENT REPORT FOR THE PHASE 1 NEW TRANSMISSION LINE TO PICKLE LAKE PROJECT SECTION 6.0: BIOLOGICAL ENVIRONMENT BASE CASE AND EFFECTS ASSESSMENT
Table 6.1-24: Predicted Changes to Wetland Ecosystem Availability in the Project Case by Corridor
Total 3,358 3,317 -41 -1.2 14,905 14,864 -41 -0.3 Note: Some numbers are rounded for presentation purposes. Therefore, it may appear that the totals do not equal the sum of the individual values. The total percent change is calculated relative to the total area and therefore this value will not equal the sum of the individual values. Burns and Cutblocks are less than or equal to 40 years of age. >-1 or >-0.1 = value approaches zero. ha = hectare; % = percent.
June 2017 Project No. 1535751 6-103
ENVIRONMENTAL ASSESSMENT REPORT FOR THE PHASE 1 NEW TRANSMISSION LINE TO PICKLE LAKE PROJECT SECTION 6.0: BIOLOGICAL ENVIRONMENT BASE CASE AND EFFECTS ASSESSMENT
This page intentionally left blank
June 2017 Project No. 1535751 6-104
ENVIRONMENTAL ASSESSMENT REPORT FOR THE PHASE 1 NEW TRANSMISSION LINE TO PICKLE LAKE PROJECT SECTION 6.0: BIOLOGICAL ENVIRONMENT BASE CASE AND EFFECTS ASSESSMENT
Rare Vegetation Communities The rare bur oak vegetation community can be found as part of the NW36 ecosite and is included in wetland ecosystems.
Preliminary Proposed Corridor
There is a predicted loss of 111 ha (1.6% of Base Case in the LSA and 0.3% of Base Case in the RSA) to the NW36 ecosite in the LSA and RSA.
Corridor Alternative Around Mishkeegogamang
There is a predicted loss of 95 ha (1.8% of Base Case in the LSA and 0.5% of Base Case in the RSA) to the NW36 ecosite in the LSA and RSA.
Corridor Alternative Through Mishkeegogamang
There is a predicted loss of 82 ha (1.8% of Base Case in the LSA and 0.4% of Base Case in the RSA) to NW36 ecosite in the LSA and RSA.
Critical Landform/Vegetation Associations Below is a summary of changes in the availability of CLVA in the LSAs due to the Preliminary Proposed Corridor and corridor alternatives.
Preliminary Proposed Corridor
Total loss of 0.9 ha (<0.01% of the Base Case) to wetland CLVA in the ecodistricts that intersect with the LSA.
Largest change – Precambrian Basic to Intermediate Bedrock land form associated with Open Bog vegetation in the 3S-4 ecodistrict with a predicted loss of 0.8 ha (0.11% of the Base Case).
Corridor Alternative Around Mishkeegogamang
Total loss of 5.5 ha (<0.01% of the Base Case) to wetland CLVA in the ecodistricts that intersect with the LSA.
Largest change – Fine Lacustrine & Glaciolacustrine landform associated with Conifer Swamp vegetation in the 3W2 ecodistrict, with a predicted loss of 0.58 ha (1.2% of the Base Case).
Corridor Alternative Through Mishkeegogamang
Total loss of 5.5 ha (<0.01% of the Base Case) to wetland CLVA in the ecodistricts that intersect with the LSA.
Largest change – Glaciofluvial Outwash land form associated with the Tamarack Dominated vegetation in the 45-5 ecodistrict, with a predicted loss of 0.43 ha (4.9% of the Base Case).
The summary of the project effects to the Base Case CLVA areas for the Preliminary Corridor and corridor alternatives is presented in Appendix 6.1E.
June 2017 Project No. 1535751 6-105
ENVIRONMENTAL ASSESSMENT REPORT FOR THE PHASE 1 NEW TRANSMISSION LINE TO PICKLE LAKE PROJECT SECTION 6.0: BIOLOGICAL ENVIRONMENT BASE CASE AND EFFECTS ASSESSMENT
Summary Studies indicate that wetland functions including flood resistance and the ability to improve water quality do not decline until substantial portions (i.e., 40%) of historical wetlands are removed (Environment Canada 2013, Johnston et al. 1990, Zedler 2003). The incremental contribution of the Preliminary Proposed Corridor and corridor alternatives around and through Mishkeegogamang to the adverse changes in available wetlands (i.e., estimated loss of 56 ha, 43 ha and 41 ha, respectively) is predicted to have no to little influence on ecological function on wetland ecosystems. At the scale of the RSA, 99.7% of wetlands at Base Case remain intact in the Project Case. At the LSA scale, more than 98% of upland ecosystems at Base Case are predicted to remain in the Project Case for the Preliminary Proposed Corridor and corridor alternatives.
6.1.9.1.2 Ecosystem Distribution Environment Canada (2013) states that priorities should be made to maintain wetlands in close proximity to one another. Fragmentation of wetlands can lead to reduced habitat for species that require contiguous patches and may inhibit effective dispersal (Environment Canada 2013). Changes from the Preliminary Proposed Corridor and corridor alternatives to wetlands are summarized below. Due to the coarse scale of the land cover data, peat- and mineral-based wetlands could not be distinguished, and all wetlands were classed as peat-based (Section 6.2.6.1.3), which have a large amount uncertainty with respect to reclamation success. However, some wetland connectivity reduced by the Project may be restored where mineral soil wetlands are located under temporary access roads that will be reclaimed when no longer in use.
Preliminary Proposed Corridor
Below is a summary of Preliminary Proposed Corridor-related changes to wetland ecosystem distribution (Appendix 6.1A, Figures 6.1A-16; Appendix 6.1D):
Linear disturbance density LSA – increases from 0.10 km/km2 in the Base Case to 0.41 km/km2 for the Project Case.
Linear disturbance density RSA – increases from 0.13 km/km2 in the Base Case to 0.20 km/km2 for the Project Case.
The linear features of the Preliminary Proposed Corridor overlap with 97 km of existing disturbances while another 416 km of linear features are adjacent to existing disturbances (i.e., within 500 m). These areas are found primarily where the Preliminary Proposed Corridor is beside or overlapping with winter roads.
Changes to wetlands from the footprint would slightly increase inter-patch distance in the LSA. Despite some increase in fragmentation, overall most wetland ecosystems remain abundant (i.e., 98.9% remaining in the LSA; 99.7% remaining in the RSA) and with patches connected and distributed throughout the LSA.
June 2017 Project No. 1535751 6-106
ENVIRONMENTAL ASSESSMENT REPORT FOR THE PHASE 1 NEW TRANSMISSION LINE TO PICKLE LAKE PROJECT SECTION 6.0: BIOLOGICAL ENVIRONMENT BASE CASE AND EFFECTS ASSESSMENT
Corridor Alternative Around Mishkeegogamang
Below is a summary of the Corridor Alternative Around Mishkeegogamang-related changes to wetland ecosystem distribution (Appendix 6.1A, Figures 6.1A-17; Appendix 6.1D):
Linear disturbance density LSA – increases from 0.29 km/km2 in the Base Case to 0.71 km/km2 for the Project Case.
Linear disturbance density RSA – increases from 0.23 km/km2 in the Base Case to 0.33 km/km2 for the Project Case.
Habitat loss from fragmentation is likely overestimated because the Corridor Alternative Around Mishkeegogamang is expected to largely parallel existing (Base Case) linear developments (e.g., Highway 599). The linear features of the Corridor Alternative Around Mishkeegogamang overlap with 76 km of existing disturbances while another 361 km of linear features are adjacent to existing disturbances (i.e., within 500 m).
Changes to wetlands from the footprint would slightly increase inter-patch distance in the LSA. Despite some increase in fragmentation, overall most wetland ecosystems remain abundant (i.e., 98.9% remaining in the LSA; 99.8% remaining in the RSA) and with patches connected and distributed throughout the LSA.
Corridor Alternative Through Mishkeegogamang
Below is a summary of Corridor Alternative Through Mishkeegogamang-related changes to wetland ecosystem distribution (Appendix 6.1A, Figures 6.1A-18; Appendix 6.1D):
Linear disturbance density LSA – increases from 0.44 km/km2 in the Base Case to 0.83 km/km2 for the Project Case.
Linear disturbance density RSA – increases from 0.29 km/km2 in the Base Case to 0.38 km/km2 for the Project Case.
Habitat loss from fragmentation is likely overestimated because the alternative corridor through Mishkeegogamang is expected to largely parallel existing (Base Case) linear developments (e.g., Highway 599). The linear features of the Corridor Alternative Through Mishkeegogamang overlaps with 82 km of existing disturbances while another 407 km of linear features are adjacent to existing disturbances (i.e., within 500 m).
Changes to wetlands from the footprint would slightly increase inter-patch distance in the LSA. Despite some increase in fragmentation, overall most wetland ecosystems remain abundant (i.e., 98.8% remaining in the LSA; 99.7% remaining in the RSA) and with patches connected and distributed throughout the LSA.
6.1.9.1.3 Ecosystem Composition Species associated with wetlands, including moose, swamp sparrow (Melospiza georgiana), and northern waterthrush (Parkesia noveboracensis) were identified during baseline surveys for the Project (Appendix 6.1B). It is possible that these species may be adversely affected by changes in the condition of wetlands due to the Preliminary Proposed Corridor or corridor alternatives. Wetland habitat in close proximity to construction activities and permanent development features are predicted to provide lower quality habitat for wildlife due to changes in the composition of vegetation communities. Wildlife species sensitive to anthropogenic disturbance are
June 2017 Project No. 1535751 6-107
ENVIRONMENTAL ASSESSMENT REPORT FOR THE PHASE 1 NEW TRANSMISSION LINE TO PICKLE LAKE PROJECT SECTION 6.0: BIOLOGICAL ENVIRONMENT BASE CASE AND EFFECTS ASSESSMENT
predicted to avoid these lower quality wetlands (e.g., sora [Porzana carolina]) whereas species adapted to anthropogenic disturbance are more likely to be present (e.g., red-winged blackbird [Agelaius phoeniceus]).
The Preliminary Proposed Corridor and corridor alternatives are predicted to degrade some wetlands in the LSAs due to changes in water quality and quantity. These effects are anticipated to be the primarily associated with wetlands that overlap and are immediately adjacent to the footprints. However, in the RSAs, the proportion of wetlands within 50 m of anthropogenic disturbance does not change substantially in the Project Case (i.e., greater than 84% of wetland polygons).
Preliminary Proposed Corridor
The tracked vulnerable (S3) plant species, slender bulrush (Schoenoplectus heterochaetus), documented as an Element Occurrence by NHIC is anticipated to be disturbed by the Preliminary Proposed Corridor. Native habitat edges are prone to ingress by non-native invasive species near disturbance. No noxious or invasive plant species were detected during baseline studies in wetland ecosystems for the Preliminary Proposed Corridor (Appendix 6.1B).
Corridor Alternative Around Mishkeegogamang
Native habitat edges are prone to ingress by non-native invasive species near disturbance.
Corridor Alternative Through Mishkeegogamang
Native habitat edges are prone to ingress by non-native invasive species near disturbance.
6.1.9.1.4 Characterization of Project Case Effects A summary of the characterization of incremental adverse net effects of the Preliminary Proposed Corridor and corridor alternatives on wetland ecosystems in the Project Case is provided for each indicator in Table 6.1-25. Net effects were described after the implementation of effective impact management measures, and summarized according to direct, magnitude, geographic extent, duration/reversibility, frequency/timing, and probability of the effect occurring following the methods described in Section 4.5.1. Effective implementation of the impact management measures summarized in Table 6.1-15 is expected to reduce the magnitude and duration of net effects on wetland ecosystems.
For the Preliminary Proposed Corridor and corridor alternatives, the magnitude of effects from the changes in wetland availability, distribution and composition are predicted to be small. The geographic extent of effects are local (i.e., do not extend beyond the LSA) and continuous throughout the life of the Project, until functional habitat is reclaimed or offset. For the purpose of this assessment, some disturbances that extend into the operation and maintenance stage of the Project are considered to be permanent (e.g., permanent new access roads). Alternately, effects from temporary access roads, laydown areas, and construction camps are predicted to be reversible in the long-term, provided that organic soil is not adversely altered. Vegetation in the corridor ROW is expected to be kept at a height of approximately 2 m or less during operation. Therefore, effects to treed wetlands will be permanent because changes to the structure and composition of vegetation are expected to alter the function of these wetlands in terms of the wildlife species they will support, but their hydrologic and water quality functions should be maintained. Effects to non-treed wetlands along the corridor ROW are considered reversible in the long-term after the implementation of impact management measures such as installing temporary sediment barriers (e.g., berms, silt fences) on approach slopes to waterbodies and wetlands to maintain water quality
June 2017 Project No. 1535751 6-108
ENVIRONMENTAL ASSESSMENT REPORT FOR THE PHASE 1 NEW TRANSMISSION LINE TO PICKLE LAKE PROJECT SECTION 6.0: BIOLOGICAL ENVIRONMENT BASE CASE AND EFFECTS ASSESSMENT
(Table 6.1-15). Construction of temporary (e.g., access road, travel lane) and permanent (tower foundations) structures in wetlands will be avoided where possible. Some measurable changes to localized soil moisture regimes (and erosion) adjacent to smaller drainages are predicted during construction and into operation until vegetation cover is restored in the surrounding area. Possible effects to wetland species abundance and richness from invasive species will be avoided and minimized through the implementation of impact management measures actions (e.g., Invasive Species Management Plan).
Table 6.1-25: Description of Effects in the Project Case for Wetland Ecosystems by Corridor
Direction Negative Negative Negative Magnitude Loss of 56 ha (1.1% of
the LSA Base Case; 0.3% of the RSA Base Case); no loss to the least common and available land cover class in the study areas (i.e., Fen-open).
Loss of 43 ha (1.1% of the LSA Base Case; 0.2% of the RSA Base Case); 2 ha (0.9% of Base Case) loss to the least common and available land cover class (i.e., Fen-open) in the study areas.
Loss of 41 ha (1.2% of the LSA Base Case; 0.3% of the RSA Base Case); 1 ha (0.6% of Base Case) loss to the least common and available land cover class (i.e., Fen-open) in the study areas.
Frequency/timing Continuous Continuous Continuous Probability of occurrence
Certain Certain Certain
June 2017 Project No. 1535751 6-109
ENVIRONMENTAL ASSESSMENT REPORT FOR THE PHASE 1 NEW TRANSMISSION LINE TO PICKLE LAKE PROJECT SECTION 6.0: BIOLOGICAL ENVIRONMENT BASE CASE AND EFFECTS ASSESSMENT
Table 6.1-25: Description of Effects in the Project Case for Wetland Ecosystems by Corridor
Direction Negative Negative Negative Magnitude Wetlands disrupted by
corridor ROW and access roads crossings. However patches of wetlands remain connected in areas surrounding the Preliminary Proposed Corridor footprint. No disruption to the uncommon Fen-open wetland.
Wetlands disrupted by corridor ROW and access roads crossings. However patches of wetlands remain connected in areas surrounding the corridor alternative footprint. A small disruption to the uncommon Fen-open wetland.
Wetlands disrupted by corridor ROW and access roads crossings. However patches of wetlands remain connected in areas surrounding the corridor alternative footprint. A small disruption to the uncommon Fen-open wetland.
Frequency/timing Continuous Continuous Continuous Probability of occurrence
Possible Possible Possible
Significance rating Not significant Not significant Not significant Note: ha = hectares; % = percent.
June 2017 Project No. 1535751 6-110
ENVIRONMENTAL ASSESSMENT REPORT FOR THE PHASE 1 NEW TRANSMISSION LINE TO PICKLE LAKE PROJECT SECTION 6.0: BIOLOGICAL ENVIRONMENT BASE CASE AND EFFECTS ASSESSMENT
6.1.9.1.5 Determination of Significance Wetland ecosystems have historically been abundant in the LSAs and RSAs for the Preliminary Proposed Corridor and corridor alternatives. Previously, boreal forest structure and composition was primarily affected by wildfire, insect outbreaks and disease, while more recently large-scale harvesting and controlled fire suppression play key roles in forest composition and structure. For the Preliminary Proposed Corridor and corridor alternatives, the combined effects of past and present anthropogenic disturbance have reduced wetland ecosystem availability, distribution and composition in the RSA in the Base Case relative to what was likely present before industrial development. However, wetlands remain abundant and well distributed and connected in the RSAs in the Base Case. For example, the RSAs contain from 14,905 to 21,700 ha (i.e., 3.7% to 4.6%) of undisturbed wetland ecosystems. Recently burned and harvested wetland areas (<40 years of age) comprise from 0.1% to 0.3% of the RSAs. Similar relative values (i.e., percentages) describe existing conditions in the LSAs for the Preliminary Proposed Corridor and corridor alternatives.
The rare bur oak vegetation community can be found as part of the NW36 ecosite and is included in wetland ecosystems. The NW36 ecosite comprises between 4.7% and 7.0% of the RSAs of the Preliminary Proposed Corridor and corridor alternatives, with similar relative values in the LSAs. Several CLVA were identified and make up approximately 157,056ha, 151,250 ha, and 151,247ha in the for Preliminary Proposed Corridor and corridor alternatives around and through Mishkeegogamang, respectively. Provincially significant wetlands are not located within the LSAs or RSAs of the Preliminary Proposed Corridor and corridor alternatives.
No federally-listed plant species (SARA or COSEWIC) or provincially listed COSSARO species were observed during the baseline plant community surveys in the Preliminary Proposed Corridor. One rare plant species (i.e., slender bulrush [Schoenoplectus heterochaetus]) tracked by NHIC has been reported as an Element Occurrence within the Preliminary Proposed Corridor LSA (NHIC 2016).
Overall, wetland ecosystems remain abundant and well distributed across the RSA in the Base Case. Most wetlands are expected to have the capacity to adapt and be resilient to existing natural and human-related disturbances and associated variations in availability, distribution and composition. However, the Fen-open wetland is less common on the landscape and would be likely less resilient to adverse changes in availability. Due to the uncertainty in reclaiming peat wetlands, these types of wetlands (i.e., bogs and fens) are considered to have a lower resilience to changes relative to mineral soil wetlands, which can be reclaimed and contribute to reversing net effects. The combined evidence on wetland ecosystem availability, distribution and condition indicates that wetlands are self-sustaining and ecologically effective in the Base Case.
The Preliminary Proposed Corridor and corridor alternatives are expected to cause small losses to wetlands. Changes are expected to be within the existing resilience limits and adaptive capacity of wetland ecosystems in the RSAs. For example, the incremental loss to the available wetland ecosystems for the Preliminary Proposed Corridor, and corridor alternatives around and through Mishkeegogamang is calculated to be 56 ha, 43 ha, and 41 ha, respectively. These changes should have little to no influence on ecological structure and function; approximately 98% and 99% of wetland ecosystems present in the Base Case are predicted to remain in the Project Case within the LSAs and RSAs for the Preliminary Proposed Corridor and corridor alternatives. Wetlands may withstand large losses (i.e., up to 60% of historical wetlands) before their functional role on the landscape is compromised (Environment Canada 2013). In addition, the Preliminary Proposed Corridor and corridor
June 2017 Project No. 1535751 6-111
ENVIRONMENTAL ASSESSMENT REPORT FOR THE PHASE 1 NEW TRANSMISSION LINE TO PICKLE LAKE PROJECT SECTION 6.0: BIOLOGICAL ENVIRONMENT BASE CASE AND EFFECTS ASSESSMENT
alternatives have been designed to cause little to no disturbance to the least common land cover class (i.e., Fen-open).
There is a predicted loss of 1.6 to 1.8% loss to the rare bur oak community NW36 ecosite within the LSAs of the Preliminary Proposed Corridor and corridor alternatives. There is a calculated loss of 0.9 ha (<0.01% of the Base Case) to wetland CLVA within the ecodistricts that intersect with the Preliminary Proposed Corridor LSA. Similarly, the ecodistricts that intersect with the LSAs of the corridor alternatives around and through Mishkeegogamang are each expected to result in a loss of 5.5 ha (<0.01% of the Base Case) to wetland CLVAs.
The Preliminary Proposed Corridor and corridor alternatives are predicted to degrade some wetlands in the LSAs due to changes in water quality and quantity. These effects are anticipated to be the primarily associated with wetlands that overlap and are immediately adjacent to the footprints (Section 7.6). Wataynikaneyap will implement a number of impact management measures policies and practices to avoid and minimize the effects on upland ecosystem composition. For example, construction of temporary (e.g., access road, travel lane) and permanent (tower foundations) structures in wetlands will be avoided where possible. Proposed locations of construction camps and laydown areas will be field-verified to avoid wetlands including bogs and fens, where feasible.
With effective implementation of impact management measures, the incremental contribution of the Project to combined effects from previous and existing developments on wetland ecosystems in the RSAs is not expected to change the self-sustaining and ecologically effective status of this criterion. Consequently, effects on wetland ecosystems in the Project Case are predicted to be not significant (Table 6.1-25).
June 2017 Project No. 1535751 6-112
ENVIRONMENTAL ASSESSMENT REPORT FOR THE PHASE 1 NEW TRANSMISSION LINE TO PICKLE LAKE PROJECT SECTION 6.0: BIOLOGICAL ENVIRONMENT BASE CASE AND EFFECTS ASSESSMENT
6.1.9.2 Reasonably Foreseeable Development Case Effects Assessment 6.1.9.2.1 Ecosystem Availability The RFD Case includes all of the past, existing and RFDs (including the Preliminary Proposed Corridor and corridor alternatives). The RFDs that did not have footprints available at the time of analysis and reporting are described in Table 4.6-1 (Section 4.6), and are expected to contribute to decreases in the availability of wetland habitats. Those RFDs that were quantified are summarized for the Preliminary Proposed Corridor and corridor alternatives below. Details on the area of predicted loss of specific land cover classes of wetland ecosystems in the RFD Case are provided in Appendix 6.1D.
Preliminary Proposed Corridor
Below is a summary of RFD-related changes to wetland ecosystem availability in the Preliminary Proposed Corridor LSA and RSA (Table 6.1-26; Appendix 6.1A, Figures 6.1A-19; Appendix 6.1D):
Loss of 816 ha (3.8% of Base Case) to wetland ecosystems in the RSA.
Loss of 109 ha (2.2% of Base Case) to wetland ecosystems in the LSA.
Largest predicted loss by percent change and absolute value (ha) – Bog – treed with a 2.6% change from Base Case and an absolute loss of 89 ha in the LSA and a 4.5% change from Base Case and an absolute loss of 657 ha in the RSA.
The RFDs are expected to disturb 6 ha (1.4% of Base Case) of the least common Fen-open in the RSA. There are no changes to Fen-open in the LSA.
Corridor Alternative Around Mishkeegogamang
Below is a summary of RFD-related changes to wetland ecosystem availability in the Corridor Alternative Around Mishkeegogamang LSA and RSA (Table 6.1-26; Appendix 6.1A, Figures 6.1A-20; Appendix 6.1D):
Loss of 823 ha (4.7% of Base Case) to wetland ecosystems in the RSA.
Loss of 110 ha (2.8% of Base Case) to wetland ecosystems in the LSA.
Largest predicted loss by percent change – Bog – treed with a 3.4% change from Base Case and an absolute loss of 86 ha in the LSA and a 5.6% change from Base Case and an absolute loss of 661 ha in the RSA.
There is expected to be a 4 ha (1.5% of Base Case) loss to the least common land cover class within the LSA and a 19 ha (2.6% of Base Case) loss within the RSA.
June 2017 Project No. 1535751 6-113
ENVIRONMENTAL ASSESSMENT REPORT FOR THE PHASE 1 NEW TRANSMISSION LINE TO PICKLE LAKE PROJECT SECTION 6.0: BIOLOGICAL ENVIRONMENT BASE CASE AND EFFECTS ASSESSMENT
Corridor Alternative Through Mishkeegogamang
Below is a summary of RFD-related changes to wetland ecosystem availability in the Corridor Alternative Through Mishkeegogamang LSA and RSA (Table 6.1-26; Appendix 6.1A, Figures 6.1A-21; Appendix 6.1D):
Loss of 821 ha (5.5% of Base Case) to wetland ecosystems in the RSA.
Loss of 108 ha (3.2% of Base Case) to wetland ecosystems in the LSA.
Largest predicted loss by percent change and absolute value - Bog – treed with a 3.7% change from Base Case and an absolute loss of 83 ha in the LSA and a 6.5% change from Base Case and an absolute loss of 658 ha.
There is expected to be 2 ha (1.3% of Base Case) loss to the least common Fen-open land cover class in the LSA and a 19 ha (3.0% of Base Case) in the RSA.
June 2017 Project No. 1535751 6-114
ENVIRONMENTAL ASSESSMENT REPORT FOR THE PHASE 1 NEW TRANSMISSION LINE TO PICKLE LAKE PROJECT SECTION 6.0: BIOLOGICAL ENVIRONMENT BASE CASE AND EFFECTS ASSESSMENT
Table 6.1-26: Predicted Changes to Wetland Ecosystem Availability in the Reasonably Foreseeable Development Case by Corridor
Total 3,358 3,250 -108 -3.2 14,905 14,084 -821 -5.5 Note: Some numbers are rounded for presentation purposes. Therefore, it may appear that the totals do not equal the sum of the individual values. The total percent change is calculated relative to the total area and therefore this value will not equal the sum of the individual values. Cutblocks and burns are less than or equal to 40 years of age. ha = hectare; RFD = reasonably foreseeable developments% = percent.
June 2017 Project No. 1535751 6-115
ENVIRONMENTAL ASSESSMENT REPORT FOR THE PHASE 1 NEW TRANSMISSION LINE TO PICKLE LAKE PROJECT SECTION 6.0: BIOLOGICAL ENVIRONMENT BASE CASE AND EFFECTS ASSESSMENT
This page intentionally left blank
June 2017 Project No. 1535751 6-116
ENVIRONMENTAL ASSESSMENT REPORT FOR THE PHASE 1 NEW TRANSMISSION LINE TO PICKLE LAKE PROJECT SECTION 6.0: BIOLOGICAL ENVIRONMENT BASE CASE AND EFFECTS ASSESSMENT
There is a predicted loss of 111 ha (1.6% of Base Case) in the LSA and a loss of 142 ha (0.4% of Base Case) in the RSA to the NW36 ecosite.
Corridor Alternative Around Mishkeegogamang
There is a predicted loss of 172 ha (3.3% of Base Case) in the LSA and a loss of 661 ha (3.4% of Base Case) in the RSA to the NW36 ecosite.
Corridor Alternative Through Mishkeegogamang
There is a predicted loss of 159 ha (3.4% of Base Case) in the LSA and a loss of 648 ha (3.5% of Base Case) in the RSA to the NW36 ecosite.
Forest Management Plans and Other Factors of Change to Wetland Ecosystems Future forestry activities would also change the availability, distribution and composition of wetland ecosystems in the RSAs of the Preliminary Proposed Corridor and corridor alternatives. However, the goal for FMPs is to reach target levels for forest diversity and composition, wildlife habitat for provincially significant species, and locally featured species and species at risk. Overall, the FMPs seek to achieve a level of forestry operation and harvest that meets market demand while incorporating sustainable forest practices and environmental values to meet a desired forest composition. Meeting these targets is expected to support the maintenance of self-sustaining and ecologically effective wetland ecosystems within and beyond the RSAs.
Changes in wetland ecosystems due to climate change are qualitatively discussed in this assessment. Wetland ecosystem availability may be adversely affected by climate change in the RFD Case. Wetlands are considered to be one of the ecosystems most sensitive to predicted climate changes because they are at the interface between terrestrial and aquatic ecosystems (ECCC 2017). Based on warming trends, the annual mean temperature in Ontario is predicted to increase by 5 to 6°C by the end of the 21st century (McKenney et al. 2010). Increases in evapotranspiration and decreases in surface water flow could cause wetlands to contract in size and in extreme cases to convert to upland ecosystems (Dove-Thompson et al. 2011, Mortsch 1998, Lemmon and Warren. 2004). The reliance on precipitation to maintain function in bogs makes them especially vulnerable to climate change, and a decline in precipitation could lead to drying of peatlands, and altered distribution and abundance of bog vegetation (Dove-Thompson et al. 2011). The diversity of plants and animals in wetlands is linked to water level fluctuations and therefore predicted decreases in water levels may lead to concerns for species diversity (Dove-Thompson et al. 2011, Mortsch et al. 2003). Consequently, in the RFD Case, wetland ecosystem availability could be further reduced in the LSAs, RSAs and beyond the RSAs due to climate change, although the extent of wetland reduction is not known.
6.1.9.2.2 Ecosystem Distribution For the Preliminary Proposed Corridor and corridor alternatives, the predicted loss of wetland ecosystems in the RSAs would result in localized changes in wetland distribution associated with individual RFDs and these effects are assumed to be permanent as reclamation plans are not available for RFDs. The distribution of wetland ecosystems may be further affected in the RFD Case because of changes to hydrology and drainage patterns associated with mining, and potential hydrologic changes brought on by climate change. The extent to which wetland ecosystem distribution would be affected by these factors could not be quantified.
June 2017 Project No. 1535751 6-117
ENVIRONMENTAL ASSESSMENT REPORT FOR THE PHASE 1 NEW TRANSMISSION LINE TO PICKLE LAKE PROJECT SECTION 6.0: BIOLOGICAL ENVIRONMENT BASE CASE AND EFFECTS ASSESSMENT
Preliminary Proposed Corridor
Below is a summary of RFD Case-related changes to wetland ecosystem distribution in the Preliminary Proposed Corridor LSA and RSA (compare Appendix 6.1A, Figures 6.1A-4 and Figures 6.1A-19):
Most notable changes are to wetland habitat distribution is predicted to occur within the Treasury Metals Inc. Goliath Gold Project and First Mining's Pickle Crow Gold Project where the cumulative effects of mining would increase fragmentation of existing wetland habitat.
Linear disturbance density LSA – increases from 0.10 km/km2 in the Base Case to 0.41 km/km2 for the RFD Case.
Linear disturbance density RSA – increases from 0.13 km/km2 in the Base Case to 0.21 km/km2 for the RFD Case.
Corridor Alternative Around Mishkeegogamang
Below is a summary of RFD Case-related changes to wetland ecosystem distribution in the Corridor Alternative Around Mishkeegogamang LSA and RSA (compare Appendix 6.1A, Figures 6.1A-5 and Figures 6.1A-20):
Most notable changes are to wetland habitat distribution is predicted to occur within the First Mining's Pickle Crow Gold Project and New Dimensions Savant Lake Gold Project where the cumulative effects of mining would increase fragmentation of existing wetland habitat.
Linear disturbance density LSA – increases from 0.29 km/km2 in the Base Case to 0.71 km/km2 for the RFD Case.
Linear disturbance density RSA – increases from 0.23 km/km2 in the Base Case to 0.33 km/km2 for the RFD Case.
Corridor Alternative Through Mishkeegogamang
Below is a summary of RFD Case-related changes to wetland ecosystem distribution in the Corridor Alternative Through Mishkeegogamang LSA and RSA (compare Appendix 6.1A, Figures 6.1A-6 and Figures 6.1A-):
Most notable changes are to wetland habitat distribution is predicted to occur within the First Mining's Pickle Crow Gold Project and New Dimensions Savant Lake Gold Project where the cumulative effects of mining would increase fragmentation of existing wetland habitat.
Linear disturbance density LSA – increases from 0.44 km/km2 in the Base Case to 0.83 km/km2 for the RFD Case.
Linear disturbance density RSA – increases from 0.29 km/km2 in the Base Case to 0.38 km/km2 for the RFD Case.
June 2017 Project No. 1535751 6-118
ENVIRONMENTAL ASSESSMENT REPORT FOR THE PHASE 1 NEW TRANSMISSION LINE TO PICKLE LAKE PROJECT SECTION 6.0: BIOLOGICAL ENVIRONMENT BASE CASE AND EFFECTS ASSESSMENT
6.1.9.2.3 Ecosystem Composition The change in linear disturbance density in the RFD Case leads to a greater exposure of wetland edges to disturbance. This change could result in increased potential for invasion by noxious weed species. Effects of climate change on invasive species abundance may also contribute to changes in wetlands (MNR 2012; ECCC 2017). For example, temperature increase may allow invasive species such as purple loosestrife (Lythrum salicaria) to expand their northern range in the province (ECCC 2017). Invasive plants can affect wetland species diversity through direct competition with native plants. An Invasive Species Management Plan (Section 9.3.1.5) will be implemented for the Project and protect wetlands from invasive species. Most wetlands in the RSAs have retained buffers of natural vegetation and therefore, despite their proximity to disturbance, they should be largely intact. However, invasive species may become more prevalent near other developments in the RSAs, which may not be managed to the same degree as the Project. For example, forestry roads and logging equipment may facilitate the spread of invasive species, particularly on private timberlands where new access roads are required. As described in the Project Case, the tracked vulnerable (S3) plant species, slender bulrush (Schoenoplectus heterochaetus), documented as an Element Occurrence by NHIC is anticipated to be disturbed by the Project. For the Preliminary Proposed Corridor and corridor alternatives, the amount of wetland habitat within 50 m of disturbance increases relative to the Base Case in the RFD Case, but most wetland areas (i.e. greater than 82% of riparian polygons).
The reduction in wetland ecosystem condition in the RFD Case relative to the Base Case is not predicted to greatly alter the ecological function of wetlands on the landscape because most wetlands would remain intact. For both the Preliminary Proposed Corridor and corridor alternatives over 94% of wetlands present in the Base Case are predicted to remain in the RSAs in the RFD Case.
June 2017 Project No. 1535751 6-119
ENVIRONMENTAL ASSESSMENT REPORT FOR THE PHASE 1 NEW TRANSMISSION LINE TO PICKLE LAKE PROJECT SECTION 6.0: BIOLOGICAL ENVIRONMENT BASE CASE AND EFFECTS ASSESSMENT
6.1.9.2.4 Characterization of Reasonably Foreseeable Development Case Effects A summary of the characterization of cumulative effects from the Preliminary Proposed Corridor and corridor alternatives, and past, present and RFDs on wetland ecosystems in the RFD Case is provided for each indicator in Table 6.1-27. All impact management measures to avoid and minimize effects from the Preliminary Proposed Corridor and corridor alternatives in the Project Case apply to the RFD Case. It is expected that RFDs will be required to implement similar impact management measures policies and practices that will limit cumulative effects on wetland ecosystems.
Effects from RFDs to ecosystem availability and distribution are likely less than certain (i.e., probable or possible) due to the uncertainty in the construction and operation of these projects. However, to avoid underestimating the significance of effects, changes in ecosystem availability and distribution from RFDs were classified as certain (i.e., precautionary approach). Similarly, for the purpose of this assessment, the predicted loss of wetland habitat due to the RFDs is permanent as reclamation plans are not available for these projects, and long-term for temporary Project components that are expected to be reclaimed. The effects from climate change are uncertain, but would influence the magnitude of development-related changes in wetland ecosystems and the geographic extent of effects would occur beyond the RSAs.
Table 6.1-27: Description of Effects in the Reasonably Foreseeable Developments Case for Wetland Ecosystems by Corridor
Direction Negative Negative Negative Magnitude Availability of
wetlands in RSA is predicted to decrease by 816 ha (3.8% of Base Case) relative to the Base Case. Loss of 6 ha (1.4% of Base Case) to the uncommon Fen-open land cover class in the RSA. Magnitude will depend on influences from climate change.
Availability of wetlands in RSA is predicted to decrease by 823 ha (4.7% of Base Case) relative to the Base Case. Loss of 19 ha (2.6% of Base Case) to the uncommon Fen-open land cover class in the RSA. Magnitude will depend on influences from climate change.
Availability of wetlands in RSA is predicted to decrease by 821 ha (5.5% of Base Case) relative to the Base Case. Loss of 19 ha (3.0% of Base Case) to the uncommon Fen-open land cover class in the RSA. Magnitude will depend on influences from climate change.
Geographic extent Beyond regional (due to climate change)
Frequency/timing Continuous Continuous Continuous Probability of occurrence
Certain Certain Certain
June 2017 Project No. 1535751 6-120
ENVIRONMENTAL ASSESSMENT REPORT FOR THE PHASE 1 NEW TRANSMISSION LINE TO PICKLE LAKE PROJECT SECTION 6.0: BIOLOGICAL ENVIRONMENT BASE CASE AND EFFECTS ASSESSMENT
Table 6.1-27: Description of Effects in the Reasonably Foreseeable Developments Case for Wetland Ecosystems by Corridor
Direction Negative Negative Negative Magnitude The distribution of
wetland ecosystems in the LSA and RSA in the RFD Case would be similar to the distribution in the Base Case. There would some predicted loss and fragmentation of wetland ecosystems throughout the RSA. Magnitude will depend on influences from climate change.
The distribution of wetland ecosystems in the LSA and RSA in the RFD Case would be similar to the distribution in the Base Case. There would some predicted loss and fragmentation of wetland ecosystems throughout the RSA. Magnitude will depend on influences from climate change.
The distribution of wetland ecosystems in the LSA and RSA in the RFD Case would be similar to the distribution in the Base Case. There would some predicted loss and fragmentation of wetland ecosystems throughout the RSA. Magnitude will depend on influences from climate change.
Geographic extent Beyond regional (due to climate change)
Frequency/timing Continuous Continuous Continuous Probability of occurrence
Possible Possible Possible
Significance rating Not significant Not significant Not significant Note: LSA = local study area; RFD = reasonably foreseeable development; RSA = regional study area.
June 2017 Project No. 1535751 6-121
ENVIRONMENTAL ASSESSMENT REPORT FOR THE PHASE 1 NEW TRANSMISSION LINE TO PICKLE LAKE PROJECT SECTION 6.0: BIOLOGICAL ENVIRONMENT BASE CASE AND EFFECTS ASSESSMENT
6.1.9.2.5 Determination of Significance Changes in surface water and groundwater quantity and quality from RFDs, particularly mining developments, may alter the availability, distribution and condition of wetlands. However, it is expected that such projects would be constructed and operated under provincial and federal regulations to meet water quality standards, and water license permits. Future forestry activities would also change the availability, distribution and composition of wetland ecosystems in the Preliminary Proposed Corridor and corridor alternatives RSAs. However, the goal for FMPs is to reach target levels for forest diversity and composition, and wildlife habitat for provincially significant species, and locally featured species and species at risk. Overall, the FMPs seek to achieve a level of forestry operation and harvest that meets market demand while incorporating sustainable forest practices and environmental values to meet a desired forest composition. Meeting these targets is expected to support the maintenance of self-sustaining and ecologically effective wetland ecosystems within and beyond the RSAs. Disturbance adjacent to wetlands also has potential to alter species composition. Invasive plants can affect wetland species diversity through direct competition with native plants. An Invasive Species Management Plan (Section 9.3.1.5) would be implemented for the Project and protect wetlands from invasive species. Similar impact management measures policies and practices would be expected from RFDs to avoid and minimize cumulative effects to wetlands.
Wetlands are considered to be one of the ecosystems most sensitive to climate change because they are at the interface between terrestrial and aquatic ecosystems (ECCC 2017). Increases in evapotranspiration and decreases in surface water flow could cause wetlands to contract in size and in extreme cases to convert to upland ecosystems (Dove-Thompson et al. 2011, Mortsch 1998). The diversity of plants and animals in wetlands is linked to water level fluctuations and therefore predicted decreases in water levels may lead to concerns for species diversity (Dove-Thompson et al. 2011, Mortsch et al. 2003). Consequently, in the RFD Case, wetland ecosystem availability could be further reduced beyond the RSAs due to climate change, although the magnitude and spatial extent of wetland reduction is not known.
In the RFD Case, wetland ecosystem availability would be reduced by 3.8% to 5.5% in the Preliminary Proposed Corridor and corridor alternatives RSAs relative to the Base Case. The most notable change in the Preliminary Proposed Corridor wetland habitat distribution in the RFD Case is predicted to occur from the Treasury Metals Inc. Goliath Gold Project and First Mining's Pickle Crow Gold Project where the effects of mining would increase fragmentation of the existing wetland habitat. For the corridor alternatives, the largest quantifiable RFDs are the First Mining's Pickle Crow Gold Project and New Dimensions Savant Lake Gold Project. Wetlands that are less common on the landscape (i.e., Fen-open) are also expected to remain well-connected, with a predicted loss of 1.4% to 3.0% within the RSAs. As described in the Project Case, the tracked vulnerable (S3) plant species, slender bulrush (Schoenoplectus heterochaetus), documented as an Element Occurrence by NHIC is anticipated to be disturbed by the Preliminary Proposed Corridor. The RFDs that could not be quantified (e.g., gold mines and transportation projects) also have the potential to interact and reduce the availability and distribution of wetlands in the RSA, but these projects would also be expected to mitigate effects to wetland ecosystems.
Overall, changes to ecosystem availability, distribution and composition from the Project and RFDs are predicted to be within the resilience limits and adaptive capacity of wetland ecosystems. Despite changes in wetland condition during the Base Case, existing wetlands remain well-connected to support a diversity of plant and wildlife species in the region, and this is not expected to change in the RFD Case. The reduction in wetland ecosystem condition in the RFD Case relative to the Base Case is not predicted to greatly alter the ecological function of
June 2017 Project No. 1535751 6-122
ENVIRONMENTAL ASSESSMENT REPORT FOR THE PHASE 1 NEW TRANSMISSION LINE TO PICKLE LAKE PROJECT SECTION 6.0: BIOLOGICAL ENVIRONMENT BASE CASE AND EFFECTS ASSESSMENT
wetlands on the landscape because most (94% to 96%) wetlands would remain intact and well distributed across the RSAs of the Preliminary Proposed Corridor and corridor alternatives. The combined evidence regarding wetland ecosystem availability, distribution, and condition in the RSAs indicates that this ecosystem would continue to be self-sustaining and ecologically effective in the RFD Case. Consequently, cumulative effects on wetland ecosystem in the RFD Case are predicted to be not significant (Table 6.1-27).
Below is a summary of Preliminary Proposed Corridor-related changes to riparian ecosystem availability in the LSA and RSA (Table 6.1-28; Appendix 6.1A, Figures 6.1A-22; Appendix 6.1D):
The Preliminary Proposed Corridor would remove 66 ha of riparian habitat in the LSA (1.1% of the Base Case LSA; 0.3% of the Base Case RSA).
Changes are predicted to add little to the adverse effects on habitat surrounding watercourses and lakes present in the Base Case.
96.0% in the LSA and 97.1% in the RSA of naturally vegetated areas are predicted to remain intact adjacent to watercourses and waterbodies in the Project Case.
Corridor Alternative Around Mishkeegogamang
Below is a summary of Corridor Alternative Around Mishkeegogamang-related changes to riparian ecosystem availability in the LSA and RSA (Table 6.1-28; Appendix 6.1A, Figure 6.1A-23; Appendix 6.1D):
The Corridor Alternative Around Mishkeegogamang would remove 56 ha of riparian habitat in the LSA (1.2% of the Base Case LSA; 0.3% of the Base Case RSA).
Changes are predicted to add little to the adverse effects on habitat surrounding watercourses and lakes present in the Base Case.
94.9% in the LSA and 97.1% in the RSA of naturally vegetated areas are predicted to remain intact adjacent to watercourses and waterbodies in the Project Case.
Corridor Alternative Through Mishkeegogamang
Below is a summary of Corridor Alternative Through Mishkeegogamang-related changes to riparian ecosystem availability in the LSA and RSA (Table 6.1-28; Appendix 6.1A, Figure 6.1A-24; Appendix 6.1D):
The Corridor Alternative Through Mishkeegogamang would remove 53 ha of riparian habitat in the LSA (1.1% of the Base Case LSA; 0.3% of the Base Case RSA).
Changes are predicted to add little to the adverse effects on habitat surrounding watercourses and lakes present in the Base Case.
94.3% in the LSA and 97.0% in the RSA of naturally vegetated areas are predicted to remain intact adjacent to watercourses and waterbodies in the Project Case.
June 2017 Project No. 1535751 6-123
ENVIRONMENTAL ASSESSMENT REPORT FOR THE PHASE 1 NEW TRANSMISSION LINE TO PICKLE LAKE PROJECT SECTION 6.0: BIOLOGICAL ENVIRONMENT BASE CASE AND EFFECTS ASSESSMENT
This page intentionally left blank
June 2017 Project No. 1535751 6-124
ENVIRONMENTAL ASSESSMENT REPORT FOR THE PHASE 1 NEW TRANSMISSION LINE TO PICKLE LAKE PROJECT SECTION 6.0: BIOLOGICAL ENVIRONMENT BASE CASE AND EFFECTS ASSESSMENT
Table 6.1-28: Predicted Changes to Riparian Ecosystem Availability in the Project Case by Corridor
Total 4,665 4,612 -53 -1.1 19,957 19,904 -53 -0.3 Note: Some numbers are rounded for presentation purposes. Therefore, it may appear that the totals do not equal the sum of the individual values. The total percent change is calculated relative to the total area and therefore this value will not equal the sum of the individual values. Burns and Cutblocks are less than or equal to 40 years of age. ha = hectare; % = percent.
June 2017 Project No. 1535751 6-125
ENVIRONMENTAL ASSESSMENT REPORT FOR THE PHASE 1 NEW TRANSMISSION LINE TO PICKLE LAKE PROJECT SECTION 6.0: BIOLOGICAL ENVIRONMENT BASE CASE AND EFFECTS ASSESSMENT
This page intentionally left blank
June 2017 Project No. 1535751 6-126
ENVIRONMENTAL ASSESSMENT REPORT FOR THE PHASE 1 NEW TRANSMISSION LINE TO PICKLE LAKE PROJECT SECTION 6.0: BIOLOGICAL ENVIRONMENT BASE CASE AND EFFECTS ASSESSMENT
6.1.10.1.2 Ecosystem Distribution Preliminary Proposed Corridor
Below is a summary of the Preliminary Proposed Corridor-related changes to riparian ecosystem distribution (Figures 6.1A-22):
Linear disturbance density LSA – increases from 0.37 km/km2 in the Base Case to 0.77 km/km2 for the Project Case.
Linear disturbance density RSA – increases from 0.31 km/km2 in the Base Case to 0.40 km/km2 for the Project Case.
The linear features of the Preliminary Proposed Corridor overlaps with 97 km of existing disturbances while another 416 km of linear features are adjacent to existing disturbances (i.e., within 500 m). Areas of where the Preliminary Proposed Corridor parallels and overlaps with existing linear disturbances are primarily along existing winter roads.
Small changes to habitat along creeks may decrease local connectivity, but the majority of riparian habitat along major streams would remain intact in the RSA.
Corridor Alternative Around Mishkeegogamang
Below is a summary of the Corridor Alternative Around Mishkeegogamang-related changes to riparian ecosystem distribution (Figure 6.1A-23):
Linear disturbance density LSA – increases from 0.51 km/km2 in the Base Case to 0.87 km/km2 for the Project Case.
Linear disturbance density RSA – increases from 0.32 km/km2 in the Base Case to 0.41 km/km2 for the Project Case.
Habitat loss from fragmentation is likely overestimated because the Corridor Alternative Around Mishkeegogamang is expected to largely parallel existing (Base Case) linear developments (e.g., Highway 599). The linear features of the Corridor Alternative Around Mishkeegogamang overlap with 76 km of existing disturbances while another 361 km of linear features are adjacent to existing disturbances (i.e., within 500 m).
Small changes to habitat along creeks may decrease local connectivity, but the majority of riparian habitat along major streams would remain intact in the RSA.
Corridor Alternative Through Mishkeegogamang
Below is a summary of Corridor Alternative Through Mishkeegogamang-related changes to riparian ecosystem distribution (Figure 6.1A-24):
Linear disturbance density LSA – increases from 0.52 km/km2 in the Base Case to 0.86 km/km2 for the Project Case.
Linear disturbance density RSA – increases from 0.34 km/km2 in the Base Case to 0.42 km/km2 for the Project Case.
June 2017 Project No. 1535751 6-127
ENVIRONMENTAL ASSESSMENT REPORT FOR THE PHASE 1 NEW TRANSMISSION LINE TO PICKLE LAKE PROJECT SECTION 6.0: BIOLOGICAL ENVIRONMENT BASE CASE AND EFFECTS ASSESSMENT
Habitat loss from fragmentation is likely overestimated because the corridor alternative through Mishkeegogamang is expected to largely parallel existing (Base Case) linear developments (e.g., Highway 599). The linear features of the corridor alternative through Mishkeegogamang overlaps with 82 km of existing disturbances while another 407 km of linear features are adjacent to existing disturbances (i.e., within 500 m).
Small changes to habitat along creeks may decrease local connectivity, but the majority of riparian habitat along major streams would remain intact in the RSA.
6.1.10.1.3 Ecosystem Composition Changes in ecosystem composition as a result of the Project would be similar. Wildlife species associated with riparian ecosystems, including olive-sided flycatcher (Contopus cooperi) and common yellowthroat (Geothlypis trichas), were identified during baseline surveys (Appendix 6.1B). It is possible that these species may be adversely affected by changes in condition of riparian ecosystems due to the preliminary proposed corridor and corridor alternatives. Riparian habitat in close proximity to construction activities and permanent development features are predicted to provide lower quality habitat for wildlife due to changes in the composition of vegetation communities. Species sensitive to anthropogenic disturbance are predicted to avoid these lower quality riparian ecosystems whereas species adapted to anthropogenic disturbance may increase in abundance. However, these potential changes in species abundance and richness from sensory disturbance are predicted to be reversible a few months after construction activities have stopped (Section 6.3).
For the preliminary proposed corridor and corridor alternatives, the amount of riparian habitat within 50 m of disturbance increases relative to the Base Case in the Project Case, but most riparian areas (i.e., greater than 89% of riparian polygons).
Changes in drainage patterns and increases and decreases in drainage flows and surface water levels beyond the natural range of variation could lead to a loss of soils through increased erosion, and affect the quality and quantity (and distribution) of vegetation. As soil moisture levels change because of changes in surface flows and water levels, plant species that thrive in drier soil moisture regimes can out-compete riparian species that rely on fluctuations in soil moisture (Shafroth et al. 2002, Leyer 2005). Changes to water quality are expected to be minimal as a result of the Project and would continue throughout construction when heavy equipment would be used on site. Following construction and during operation, changes to water quality from the Project are predicted to be ecologically non-measurable (Section 5.2).
June 2017 Project No. 1535751 6-128
ENVIRONMENTAL ASSESSMENT REPORT FOR THE PHASE 1 NEW TRANSMISSION LINE TO PICKLE LAKE PROJECT SECTION 6.0: BIOLOGICAL ENVIRONMENT BASE CASE AND EFFECTS ASSESSMENT
6.1.10.1.4 Characterization of Project Case Effects A summary of the characterization of incremental adverse net effects of the Preliminary Proposed Corridor and corridor alternatives on riparian ecosystems in the Project Case is provided for each measurement indicator in Table 6.1-29. Net effects were described after the implementation of effective impact management measures, and summarized according to direction, magnitude, geographic extent, duration/reversibility, frequency/timing, and probability of the effect occurring following the methods described in Section 4.5.1. Effective implementation of impact management measures summarized in Table 6.1-15 are expected to reduce the magnitude and duration of net effects on riparian ecosystems.
The magnitude of effects from the changes in riparian habitat availability, distribution and composition from the Preliminary Proposed Corridor and corridor alternatives are predicted to be small. The geographic extent of effects are local (i.e., do not extend beyond the LSA) and continuous throughout the life of the Preliminary Proposed Corridor and corridor alternatives, until functional habitat is reclaimed or offset. The operation and maintenance stage of the Preliminary Proposed Corridor and corridor alternatives is considered to be indefinite and for the purposes of this assessment, some disturbances are considered to be irreversible (e.g., permanent access roads and the tower locations), while other disturbances are temporary (e.g., temporary access roads) and considered to be reversible in the long-term. Vegetation in the corridor ROW is expected to be kept at a height of approximately 2 m or less to meet safety requirements. Therefore, effects to treed riparian areas that require tree height restrictions will be permanent because changes to the structure and composition of vegetation is expected to alter the function of these riparian areas for the wildlife species they support, but their hydrologic and water quality functions should be maintained. Effects to non-treed riparian areas are considered reversible in the long-term after impact management measures. Effects from changes in water quantity to species abundance and richness are possible but unlikely, because impact management measures actions have been included in the design of the Preliminary Proposed Corridor and corridor alternatives. For example, access road and travel lane construction activities will include flagging, stripping, soil salvage, grading, and installation of equipment crossings to maintain surface water flow.
Table 6.1-29: Description of Effects in the Project Case for Riparian Ecosystems by Corridor
Direction Negative Negative Negative Magnitude Predicted loss of
66 ha (1.1% in the LSA; 0.3% in the RSA)
Predicted loss of 56 ha (1.2% in the LSA; 0.3% in the RSA)
Predicted loss of 53 ha (1.1% in the LSA; 0.3% in the RSA)
Geographic extent Local Local Local Duration/ reversibility
Permanent/ Long-term
Permanent/ Long-term Permanent/ Long-term
Frequency/timing Continuous Continuous Continuous Probability of occurrence
Certain Certain Certain
June 2017 Project No. 1535751 6-129
ENVIRONMENTAL ASSESSMENT REPORT FOR THE PHASE 1 NEW TRANSMISSION LINE TO PICKLE LAKE PROJECT SECTION 6.0: BIOLOGICAL ENVIRONMENT BASE CASE AND EFFECTS ASSESSMENT
Table 6.1-29: Description of Effects in the Project Case for Riparian Ecosystems by Corridor
Direction Negative Negative Negative Magnitude Patches of
riparian ecosystems remain connected in areas surrounding the footprint
Patches of riparian ecosystems remain connected in areas surrounding the footprint
Patches of riparian ecosystems remain connected in areas surrounding the footprint
Geographic extent Local Local Local Duration/ reversibility
Permanent/ Long-term
Permanent/ Long-term Permanent/ Long-term
Frequency/timing Continuous Continuous Continuous Probability of occurrence
Certain Certain Certain
Ecosystem composition
Direction Negative Negative Negative Magnitude Small changes in
water quality and flow and potential introduction of invasive species may alter riparian species abundance and richness
Small changes in water quality and flow and potential introduction of invasive species may alter riparian species abundance and richness
Small changes in water quality and flow and potential introduction of invasive species may alter riparian species abundance and richness
Geographic extent Local Local Local Duration/ reversibility
Permanent/ Long-term
Permanent/ Long-term Permanent/ Long-term
Frequency/timing Continuous Continuous Continuous Probability of occurrence
Possible Possible Possible
Significance rating Not significant Not significant Not significant Note: ha = hectare; LSA = local study area; RSA = regional study area; % = percent.
June 2017 Project No. 1535751 6-130
ENVIRONMENTAL ASSESSMENT REPORT FOR THE PHASE 1 NEW TRANSMISSION LINE TO PICKLE LAKE PROJECT SECTION 6.0: BIOLOGICAL ENVIRONMENT BASE CASE AND EFFECTS ASSESSMENT
6.1.10.1.5 Determination of Significance In the Base Case, riparian habitat in the LSAs and RSAs of the Preliminary Proposed Corridor and corridor alternatives has been affected by urban development, forestry, mining, and other anthropogenic disturbances, which led to a loss of ecosystem availability, connectivity, and functionality for some riparian areas. Although permanent loss of riparian habitat has occurred because of developments that removed waterbodies, these changes have occurred over a relatively small area in the RSAs. Changes from previous and existing developments to the availability, distribution and composition (condition) of riparian ecosystems are predicted to be within the resilience limits and adaptive capacity of this criterion.
Much of the disturbance to riparian areas would have been associated with forest harvesting. It is assumed that early logging, in the late 1800s to mid-1900s, would not have followed guidelines specific to riparian areas. Thus, historical forest harvesting in riparian areas may have led to more erosion, sedimentation, soil compaction, rutting and water pooling than more recent logging in areas surrounding lakes, streams and rivers. Since the publication of the Code of Practice for Timber Management Operations in Riparian Areas in 1991 (MNR 1991), effects from forest harvesting to wetlands have likely been reduced.
Overall, the Land Cover 2000 indicates that approximately 97% of habitat adjacent to watercourses and waterbodies in Preliminary Proposed Corridor and corridor alternative RSAs remains naturally vegetated in the Base Case, which is above the resource management criterion of 75% naturally vegetated stream length recommended by Environment Canada (2013) to prevent degradation of these ecosystems. The available evidence indicates that riparian ecosystems in the Base Case are self-sustaining and ecologically effective.
The Preliminary Proposed Corridor is expected to reduce riparian habitat availability by 66 ha in the LSA, which would result in small, local changes in distribution and connectivity. Loss to the corridor alternatives around and through Mishkeegogamang are 56 ha and 53 ha, respectively.
Changes in drainage patterns and increases and decreases in drainage flows and surface water levels beyond the natural range of variation could lead to a loss of soils through increased erosion, and affect the quality and quantity (and distribution) of vegetation. Wataynikaneyap will implement a number of impact management measures policies and practices to avoid and minimize the effects on riparian ecosystem composition. For example, water quality management systems would remain in place until they are no longer required to achieve acceptable water quality in the receiving environment. Temporary sediment barriers (e.g., berms, silt fences) would be installed on approach slopes to waterbodies and wetlands to maintain water quality.
With effective implementation of impact management measures, minimal changes in the remaining riparian habitat condition are predicted (Table 6.1-29). Approximately 97% of Base Case riparian habitat would remain in the RSAs of the Preliminary Proposed Corridor and corridor alternatives in the Project Case. The Preliminary Proposed Corridor and corridor alternatives are not predicted to change the self-sustaining and ecologically effective status of riparian ecosystems identified for the Base Case. Consequently, incremental and combined effects from the Project and past and present developments on riparian habitat in the RSAs are predicted to be not significant in the Project Case (Table 6.1-29).
June 2017 Project No. 1535751 6-131
ENVIRONMENTAL ASSESSMENT REPORT FOR THE PHASE 1 NEW TRANSMISSION LINE TO PICKLE LAKE PROJECT SECTION 6.0: BIOLOGICAL ENVIRONMENT BASE CASE AND EFFECTS ASSESSMENT
6.1.10.2 Reasonably Foreseeable Development Case Effects Assessment 6.1.10.2.1 Ecosystem Availability The RFD Case includes all of the past, existing and reasonably foreseeable developments (including the Preliminary Proposed Corridor and corridor alternatives). The RFDs that did not have footprints available at the time of analysis and reporting are described in Table 4.6-1 (Section 4.6), and are expected to contribute to decreases in the availability of riparian habitats. Those RFDs that were quantified are summarized for the Preliminary Proposed Corridor and corridor alternatives below. Details on the area of predicted loss of specific land cover classes of riparian ecosystems in the RFD Case are provided in Appendix 6.1C. Similar to upland and wetland ecosystems, riparian habitats may be positively or negatively influenced by alterations in water flows and levels through the effects of climate change.
Preliminary Proposed Corridor
Below is a summary of RFD-related changes to riparian ecosystem availability in the LSA and RSA (Table 6.1-30; Appendix 6.1A, Figures 6.1A-25; Appendix 6.1D):
Loss of 304 ha (1.1% of Base Case) to riparian ecosystems in the RSA.
Loss of 118 ha (1.9% of Base Case) to riparian ecosystems in the LSA.
95.2% in the LSA and 96.2% in the RSA of naturally vegetated areas are predicted to remain intact adjacent to watercourses and waterbodies in the RFD Case.
Corridor Alternative Around Mishkeegogamang
Below is a summary of RFD-related changes to riparian ecosystem availability in the LSA and RSA (Table 6.1-30; Appendix 6.1A, Figures 6.1A-26; Appendix 6.1D):
Loss of 754 ha (3.7% of Base Case) to riparian ecosystems in the RSA.
Loss of 214 ha (4.6% of Base Case) to riparian ecosystems in the LSA.
91.6% in the LSA and 93.7% in the RSA of naturally vegetated areas are predicted to remain intact adjacent to watercourses and waterbodies in the RFD Case.
Corridor Alternative Through Mishkeegogamang
Below is a summary of RFD-related changes to riparian ecosystem availability in the LSA and RSA (Table 6.1-30; Appendix 6.1A, Figures 6.1A-27; Appendix 6.1D):
Loss of 751 ha (3.8% of Base Case) to riparian ecosystems in the RSA.
Loss of 211 ha (4.5% of Base Case) to riparian ecosystems in the LSA.
91.1% in the LSA and 93.6% in the RSA of naturally vegetated areas are predicted to remain intact adjacent to watercourses and waterbodies in the RFD Case.
June 2017 Project No. 1535751 6-132
ENVIRONMENTAL ASSESSMENT REPORT FOR THE PHASE 1 NEW TRANSMISSION LINE TO PICKLE LAKE PROJECT SECTION 6.0: BIOLOGICAL ENVIRONMENT BASE CASE AND EFFECTS ASSESSMENT
Table 6.1-30: Predicted Changes to Riparian Ecosystem Availability in the Cumulative Effects Case by Corridor
Total 4,665 4,454 -211 -4.5 19,957 19,205 -751 -3.8 Note: Some numbers are rounded for presentation purposes. Therefore, it may appear that the totals do not equal the sum of the individual values. The total percent change is calculated relative to the total area and therefore this value will not equal the sum of the individual values. Cutblocks and burns are less than or equal to 40 years of age. ha = hectare; RFD = reasonably foreseeable developments; % = percent.
June 2017 Project No. 1535751 6-133
ENVIRONMENTAL ASSESSMENT REPORT FOR THE PHASE 1 NEW TRANSMISSION LINE TO PICKLE LAKE PROJECT SECTION 6.0: BIOLOGICAL ENVIRONMENT BASE CASE AND EFFECTS ASSESSMENT
This page intentionally left blank
June 2017 Project No. 1535751 6-134
ENVIRONMENTAL ASSESSMENT REPORT FOR THE PHASE 1 NEW TRANSMISSION LINE TO PICKLE LAKE PROJECT SECTION 6.0: BIOLOGICAL ENVIRONMENT BASE CASE AND EFFECTS ASSESSMENT
6.1.10.2.2 Ecosystem Distribution For the Preliminary Proposed Corridor and corridor alternatives, the fragmentation of riparian ecosystems in the RSAs would result in localized changes in riparian distribution associated with individual RFDs (including projects that were not quantified) and these effects are assumed to be permanent. The distribution of riparian ecosystems may be affected by changes to hydrology and drainage patterns associated with mining, and potential hydrologic changes brought on by climate change. The extent to which riparian ecosystem distribution would be affected by these factors could not be quantified. Overall, riparian habitat is predicted to remain well-connected in the RFD Case. Therefore, changes in distribution due to RFDs are predicted to have no to little effect on the ecological function of riparian ecosystems in the RSAs.
Preliminary Proposed Corridor
Below is a summary of changes in the RFD Case to riparian ecosystem distribution (compare Appendix 6.1A, Figures 6.1A-7 and Figures 6.1A-25).
Most notable changes are to riparian habitat distribution is predicted to occur within the Treasury Metals Inc. Goliath Gold Project and First Mining's Pickle Crow Gold Project where the cumulative effects of mining would increase fragmentation of existing riparian habitat.
Linear disturbance density LSA – increases from 0.37 km/km2 in the Base Case to 0.77 km/km2.
Linear disturbance density RSA – increases from 0.31 km/km2 in the Base Case to 0.41 km/km2.
Corridor Alternative Around Mishkeegogamang
Below is a summary of changes in the RFD Case to riparian ecosystem distribution (compare Appendix 6.1A, Figures 6.1A-8 and Figures 6.1A-26).
Most notable changes are to riparian habitat distribution is predicted to occur within the First Mining's Pickle Crow Gold Project and New Dimensions Savant Lake Gold Project where the cumulative effects of mining would increase fragmentation of existing riparian habitat.
Linear disturbance density LSA – increases from 0.51 km/km2 in the Base Case to 0.88 km/km2.
Linear disturbance density RSA – increases from 0.32 km/km2 in the Base Case to 0.41 km/km2.
Corridor Alternative Through Mishkeegogamang
Below is a summary of changes in the RFD Case to riparian ecosystem distribution (compare Appendix 6.1A, Figures 6.1A-9 and Figures 6.1A-27).
Most notable changes are to riparian habitat distribution is predicted to occur within the First Mining's Pickle Crow Gold Project and New Dimensions Savant Lake Gold Project where the cumulative effects of mining would increase fragmentation of existing riparian habitat.
Linear disturbance density LSA – increases from 0.52 km/km2 in the Base Case to 0.86 km/km2.
Linear disturbance density RSA – increases from 0.34 km/km2 in the Base Case to 0.42 km/km2.
June 2017 Project No. 1535751 6-135
ENVIRONMENTAL ASSESSMENT REPORT FOR THE PHASE 1 NEW TRANSMISSION LINE TO PICKLE LAKE PROJECT SECTION 6.0: BIOLOGICAL ENVIRONMENT BASE CASE AND EFFECTS ASSESSMENT
6.1.10.2.3 Ecosystem Composition Riparian habitat near anthropogenic disturbance can be degraded relative to habitats that are farther away from disturbance because they are at greater risk of invasive species, changes in microclimate, windthrow, and avoidance by wildlife. For the Preliminary Proposed Corridor and corridor alternatives, the amount of riparian habitat within 50 m of disturbance increases relative to the Base Case in the RFD Case, but most riparian areas (i.e. greater than 86% of riparian polygons) are further than 50 m from disturbance.
Effects of climate change on the abundance of invasive species may also contribute to changes in riparian habitats. For example, temperature increases may allow invasive species such as purple loosestrife to expand their northern range in the province (ECCC 2017). Invasive plants can affect riparian species diversity through direct competition with native plants. An Invasive Species Management Plan (Section 9.3.1.5) would be implemented for the Preliminary Proposed Corridor and corridor alternatives and protect riparian habitat from invasive species. Most riparian habitat in the RSAs have retained buffers of natural vegetation and therefore, despite their proximity to disturbance, they should be largely intact. However, invasive species may become more prevalent near RFDs, which may not be managed to the same degree as the Project. For example, forestry roads and logging equipment may facilitate the spread of invasive species, particularly on private timberlands where new access roads are required.
Drainage patterns and flow rates of tributaries may change due to mining activities in the RFD Case. Changes in river flows may alter the condition of associated riparian habitat. Mining projects in the RSAs may also contribute to reduction in water quality; however, it is expected that these projects would be constructed and operated under provincial and federal regulations to meet water quality standards and water license permits.
Trees contribute to wooded structure used by wildlife (e.g., nesting and foraging) and to shading that helps maintain fish habitat (Environment Canada 2013). Continued forestry in the RSAs may cause some temporary loss of these functions. However, rooted vegetation such as shrubs would still be present, which would contribute to sediment filtering. It is the responsibility of the MNRF to manage forests in a sustainable manner and provide healthy forests for future generations (MNR 2012).
The reduction in riparian habitat condition in the RFD Case relative to the Base Case is predicted to not greatly alter ecological function on the landscape because most riparian habitat would remain intact, including habitat within 100 m of disturbance due to environmental setbacks and best management practices. Where riparian habitat buffers are removed during forestry, partial function (i.e., sediment filtering) would be maintained. The adverse effects are temporary and riparian habitat is predicted to recover.
June 2017 Project No. 1535751 6-136
ENVIRONMENTAL ASSESSMENT REPORT FOR THE PHASE 1 NEW TRANSMISSION LINE TO PICKLE LAKE PROJECT SECTION 6.0: BIOLOGICAL ENVIRONMENT BASE CASE AND EFFECTS ASSESSMENT
6.1.10.2.4 Characterization of Reasonably Foreseeable Development Case Effects A summary of the characterization of cumulative effects from the Preliminary Proposed Corridor and corridor alternatives, and past, present and RFDs on riparian ecosystems in the RFD Case is provided for each indicator in Table 6.1-31. All impact management measures to avoid and minimize effects from the Preliminary Proposed Corridor and corridor alternatives in the Project Case apply to the RFD Case. It is expected that RFDs will be required to implement similar impact management measures policies and practices that will limit cumulative effects on riparian ecosystems.
Effects from RFDs to ecosystem availability and distribution are likely less than certain (i.e., probable or possible) due to the uncertainty in the construction and operation of these projects. However, to avoid underestimating the significance of effects, changes in ecosystem availability and distribution from RFDs were classified as certain (i.e., precautionary approach). Similarly, for the purpose of this assessment, the predicted loss of riparian habitat due to the RFDs is permanent as reclamation plans are not available for these projects, and long-term for temporary Preliminary Proposed Corridor and corridor alternatives components that are expected to be reclaimed. The effects from climate change are uncertain, but would influence the magnitude of development-related changes in riparian ecosystems and the geographic extent of effects would occur beyond the RSAs.
Table 6.1-31: Description of Effects in the Reasonably Foreseeable Development Case for Riparian Ecosystems by Corridor
Direction Negative Negative Negative Magnitude Availability of riparian
habitat in the RSA is predicted to decrease by 304 ha (1.1% of Base Case) relative to the Base Case in the RSA. Magnitude will depend on influences from climate change.
Availability of riparian habitat in the RSA is predicted to decrease by 754 ha (3.7% of Base Case) relative to the Base Case in the RSA. Magnitude will depend on influences from climate change.
Availability of riparian habitat in the RSA is predicted to decrease by 751 ha (3.8% of Base Case) relative to the Base Case in the RSA. Magnitude will depend on influences from climate change.
Geographic extent Beyond regional (due to climate change)
Frequency/timing Continuous Continuous Continuous Probability of occurrence
Certain Certain Certain
June 2017 Project No. 1535751 6-137
ENVIRONMENTAL ASSESSMENT REPORT FOR THE PHASE 1 NEW TRANSMISSION LINE TO PICKLE LAKE PROJECT SECTION 6.0: BIOLOGICAL ENVIRONMENT BASE CASE AND EFFECTS ASSESSMENT
Table 6.1-31: Description of Effects in the Reasonably Foreseeable Development Case for Riparian Ecosystems by Corridor
Direction Negative Negative Negative Magnitude There would some
loss and fragmentation of riparian habitat throughout the RSA relative to the Base Case, but riparian ecosystems remain well connected. Magnitude will depend on influences from climate change.
There would some loss and fragmentation of riparian habitat throughout the RSA relative to the Base Case, but riparian ecosystems remain well connected. Magnitude will depend on influences from climate change.
There would some loss and fragmentation of riparian habitat throughout the RSA relative to the Base Case, but riparian ecosystems remain well connected. Magnitude will depend on influences from climate change.
Geographic extent Beyond regional (due to climate change)
Frequency/timing Continuous Continuous Continuous Probability of occurrence
Certain Certain Certain
Ecosystem composition
Direction Negative Negative Negative Magnitude Small changes in
water quality and flow and potential introduction of invasive species may alter riparian species abundance and richness. Magnitude will depend on influences from climate change.
Small changes in water quality and flow and potential introduction of invasive species may alter riparian species abundance and richness. Magnitude will depend on influences from climate change.
Small changes in water quality and flow and potential introduction of invasive species may alter riparian species abundance and richness. Magnitude will depend on influences from climate change.
Geographic extent Beyond regional (due to climate change)
Frequency/timing Continuous Continuous Continuous Probability of occurrence
Possible Possible Possible
Significance rating Not significant Not significant Not significant Note: ha = hectare, LSA = local study area; RSA = regional study area; % = percent.
June 2017 Project No. 1535751 6-138
ENVIRONMENTAL ASSESSMENT REPORT FOR THE PHASE 1 NEW TRANSMISSION LINE TO PICKLE LAKE PROJECT SECTION 6.0: BIOLOGICAL ENVIRONMENT BASE CASE AND EFFECTS ASSESSMENT
6.1.10.2.5 Determination of Significance The combined effects in the RFD Case would reduce riparian habitat availability in the Preliminary Proposed Corridor and corridor alternative RSAs. The Invasive Species Management Plan (Section 9.3.1.5) for the Project would minimize the effect and threat of invasive species on lands throughout the LSAs. Drainage patterns and flow rates of tributaries may also change due to RFDs (including non-quantifiable projects), particularly from mining activities, which can alter the composition of riparian ecosystems. However, it is expected that these projects would be constructed and operated under provincial and federal regulations to meet water quality standards, and water license permits, which would minimize cumulative net effects to riparian habitats.
Increases in evapotranspiration and decreases in surface water flow from climate change could cause decreases in the amount of available riparian habitat. For example, water inflow into lakes may be decreased as a result of reduced run-off due to increased temperature, decreased precipitation and an increase in evaporation (Dove-Thompson et al. 2011). Therefore, effects from climate change to riparian areas are uncertain, but would likely have effects beyond the RSAs.
The combined effects in the RFD Case would reduce riparian habitat availability by 1.1% to 3.8% in the Project and corridor alternative RSAs relative to the Base Case. Connectivity and condition of riparian habitat would likewise decline in the RFD Case relative to the Base Case due to the cumulative effects of the Project and RFDs. Overall, changes in riparian habitat indicators from the cumulative effects of development are not predicted to exceed the limits of resilience and adaptability of riparian habitat in the RSAs. Relative to the Base Case, riparian habitat remains abundant, intact and well distributed across the RSAs in the RFD Case. The Land Cover 2000 indicates approximately 91.6% to 95.2% of habitat adjacent to watercourses and waterbodies in the RSAs remains naturally vegetated in the RFD Case, which is above the resource management criterion of 75% naturally vegetated stream length recommended by Environment Canada (2013) to prevent degradation of these ecosystems. The weight of evidence indicates that cumulative effects from the Project, and past, present, and RFDs on riparian ecosystems in the RSA are predicted to be not significant in the RFD Case (Table 6.1-31).
6.1.11 Prediction Confidence in the Assessment Prediction confidence refers to the degree of certainty in the net effects predictions and associated determination of significance. The EA deals with predictions of future circumstances, and predicts interactions between the Preliminary Proposed Corridor, corridor alternatives and other developments or activities within complex ecosystems. Scientific inference is associated with uncertainty, and prediction confidence (level of confidence in the assessment results) depends on the degree of uncertainty and how it is addressed. Primary factors affecting confidence in the predictions made in the assessment include:
availability and accuracy of baseline data;
accuracy of Land Cover 2000 data and the riparian habitat model;
level of understanding of the strength of effects pathways (i.e., mechanisms) on each criterion;
level of certainty associated with the effectiveness of proposed impact management measures; and
level of understanding of the cumulative drivers of change in measurement indicators and associated effects on assessment endpoints (e.g., climate change).
June 2017 Project No. 1535751 6-139
ENVIRONMENTAL ASSESSMENT REPORT FOR THE PHASE 1 NEW TRANSMISSION LINE TO PICKLE LAKE PROJECT SECTION 6.0: BIOLOGICAL ENVIRONMENT BASE CASE AND EFFECTS ASSESSMENT
The level of certainty is considered during the effects assessment, and how uncertainty was addressed to increase confidence so that net effects will not be worse than predicted, such as building conservatism into the analysis and assessment. Uncertainty in the assessment was managed by:
conducting quality assurance and control on baseline data;
using the best available land cover data across the RSAs for the Preliminary Proposed Corridor and corridor alternatives;
reviewing regional information such as FMPs and caribou IRAs;
acquiring local and regional data from provincial government departments to understand ecological relationships relevant to potential pathways, and inform the assessment;
using data to make inferences about ecological interactions and mechanisms of change; and
comparing assessment results to relevant published literature.
For the Base Case, existing mineral exploration drill holes across the LSAs and RSAs were classified as disturbance for all vegetation criterion. A conservative approach was taken to apply an approximate 12.5 m buffer around all drill holes. Depending on the age of mineral exploration drill holes, this may be an overestimation of disturbance as older drill holes have likely become re-vegetated. Similarly, for the purpose of this assessment the predicted loss of upland, wetland and riparian habitat due to the Project and RFDs is assumed to be permanent (i.e., for permanent Preliminary Proposed Corridor and corridor alternatives components, and reclamation plans that are not available for planned RFDs) and long-term (i.e., for temporary Preliminary Proposed Corridor and corridor alternatives components that will be reclaimed). Some ecosystems disturbed by the Project through temporary access roads and water crossings, laydown areas and construction camps are expected to be reclaimed, which would contribute to reducing net effects. Therefore, the confidence in predictions concerning effects to upland, wetland and riparian ecosystems from the Preliminary Proposed Corridor and corridor alternatives is moderate to high.
Wetlands in the study area were mapped as either bogs or fens. It is likely that mineral wetlands also exist in the study areas; however, due to the Land Cover 2000 scale of mapping, small mineral wetlands were not discernible in the mapped landscape. This uncertainty is inherent in the assessment (i.e., low level of confidence regarding predicted effects to particular wetland types), but can be reduced during construction monitoring (i.e., wetlands confirmed to be disturbed by the Project can be field-verified as peat or mineral wetlands).
There is a high level of uncertainty surrounding the reclamation of peat-accumulating wetlands using existing technology once the soil layers have been disturbed (Environment Canada 2013). This uncertainty has largely been managed by applying impact management measures to avoid soil disturbance to peat-accumulating wetlands such as fens and bogs, either through siting or by completing construction primarily under frozen conditions to limit soil disturbance and compaction. Field verification of proposed locations of construction camps and laydown areas will be key to successfully avoiding effects to peat-accumulating wetlands due to uncertainty associated with the Land Cover 2000 mapping.
June 2017 Project No. 1535751 6-140
ENVIRONMENTAL ASSESSMENT REPORT FOR THE PHASE 1 NEW TRANSMISSION LINE TO PICKLE LAKE PROJECT SECTION 6.0: BIOLOGICAL ENVIRONMENT BASE CASE AND EFFECTS ASSESSMENT
Although climate change models predict an increase in average global temperatures in the Project Case and the RFD Case, the effect of these changes on ecosystem processes is uncertain (Deser et al. 2010, Walther 2010). Predicting how an ecosystem or an individual species will cope with climate change is difficult and many scenarios are possible (Dawson et al. 2011). Boreal tree species (e.g., black spruce, Jack pine, white spruce, balsam fir and trembling aspen) are predicted to migrate northwards; however, because trees are long-lived species with slow migration rates, some trees are likely to have decreasing adaptive capacity to unfavourable climate conditions making them susceptible to mortality (Canadian Council of Forest Ministers 2010). Changes in water levels and flows are uncertain, and may result in negative or positive effects to upland, wetland and riparian ecosystems (Gleeson et al. 2011). As expected, there is a low level of confidence in predicted effects from climate change to upland, wetland and riparian ecosystems. However, where there was ambiguity in the response of an ecosystem to climate change, the assessment considered a precautionary outcome for each criterion (i.e., an adverse effect of climate change on ecosystems in the RFD Case).
6.1.12 Monitoring This section identifies any recommended effects monitoring to verify the predictions in the effects assessment and the effectiveness of the impact management measures and compliance monitoring to evaluate whether the Project has been constructed, implemented, and operated in accordance with the commitments made in the Draft EA Report. The objectives monitoring programs include:
Evaluate the effectiveness of impact management measures and reclamation, and modify or enhance policies and actions as necessary through adaptive management.
Identify unanticipated potentially adverse effects, including possible accidents and malfunctions.
Contribute to continual improvement.
A summary of the monitoring activities relevant to the protection of upland, wetland and riparian ecosystems are described below:
The development footprint will be monitored during construction for incidental sensitive features (e.g., rare plants and rare vegetation communities) that have not previously been identified on or near the anticipated footprint. In the event that a sensitive feature is suspected, the Rare Plant Management Plan (Section 9.3.1.6) will be implemented.
Siting of construction camps and laydown areas will be field-verified prior to installation to avoid organic-type wetlands (e.g., bogs and fens).
Erosion and sedimentation control measures will be monitored to avoid and minimize sediment mobilization from disturbed areas to drainages, wetlands or watercourses.
Soil topsoil piles will be monitored for weeds. The Invasive Species Management Plan (Section 9.3.1.7) will be implemented, when required.
Reclamation concerns would be monitored and managed, and include soil erosion, re-vegetation and slope stability.
June 2017 Project No. 1535751 6-141
ENVIRONMENTAL ASSESSMENT REPORT FOR THE PHASE 1 NEW TRANSMISSION LINE TO PICKLE LAKE PROJECT SECTION 6.0: BIOLOGICAL ENVIRONMENT BASE CASE AND EFFECTS ASSESSMENT
6.1.13 Information Passed on to Other Components Results of the assessment were reviewed and incorporated into the following components of the EA:
Wildlife (Section 6.3);
Non-Aboriginal Land and Resource Use (Section 7.4);
Visual Aesthetics (Section 7.5); and
Aboriginal and Treaty Rights and Interests (Section 8.0).
6.1.14 Component Summary Table 6.1-32 presents a summary of the assessment results by criteria for the Preliminary Proposed Corridor and corridor alternatives.
June 2017 Project No. 1535751 6-142
ENVIRONMENTAL ASSESSMENT REPORT FOR THE PHASE 1 NEW TRANSMISSION LINE TO PICKLE LAKE PROJECT SECTION 6.0: BIOLOGICAL ENVIRONMENT BASE CASE AND EFFECTS ASSESSMENT
Table 6.1-32: Vegetation and Wetlands Assessment Summary
Criteria Preliminary Proposed Corridor Corridor Alternative Around Mishkeegogamang
Corridor Alternative Through Mishkeegogamang
Upland ecosystems
Negative effects to the availability and distribution of upland ecosystems in the Project Case are predicted to be small, local, permanent, continuous, certain, and not significant.
Negative effects to upland ecosystem composition in the Project Case are predicted to be small, local, permanent, continuous, possible, and not significant.
Negative effects to upland ecosystems availability and distribution in the RFD Case are predicted to be small, beyond regional, permanent, continuous, certain, and not significant.
Negative effects to upland ecosystems composition in the RFD Case are predicted to be small, beyond regional, permanent, continuous, possible, and not significant.
June 2017 Project No. 1535751 6-143
ENVIRONMENTAL ASSESSMENT REPORT FOR THE PHASE 1 NEW TRANSMISSION LINE TO PICKLE LAKE PROJECT SECTION 6.0: BIOLOGICAL ENVIRONMENT BASE CASE AND EFFECTS ASSESSMENT
Table 6.1-32: Vegetation and Wetlands Assessment Summary
Criteria Preliminary Proposed Corridor Corridor Alternative Around Mishkeegogamang
Corridor Alternative Through Mishkeegogamang
Wetland ecosystems
Negative effects to the availability and distribution of wetland ecosystems in the Project Case are predicted to be small, local, permanent, continuous, certain, and not significant.
Negative effects to wetland ecosystem composition in the Project Case are predicted to be small, local, permanent, continuous, possible, and not significant.
Negative effects to wetland ecosystems availability and distribution in the RFD Case are predicted to be small, beyond regional, permanent, continuous, certain, and not significant.
Negative effects to wetland ecosystems composition in the RFD Case are predicted to be small, beyond regional, permanent, continuous, possible, and not significant.
June 2017 Project No. 1535751 6-144
ENVIRONMENTAL ASSESSMENT REPORT FOR THE PHASE 1 NEW TRANSMISSION LINE TO PICKLE LAKE PROJECT SECTION 6.0: BIOLOGICAL ENVIRONMENT BASE CASE AND EFFECTS ASSESSMENT
Table 6.1-32: Vegetation and Wetlands Assessment Summary
Criteria Preliminary Proposed Corridor Corridor Alternative Around Mishkeegogamang
Corridor Alternative Through Mishkeegogamang
Riparian ecosystems
Negative effects to the availability and distribution of riparian ecosystems in the Project Case are predicted to be small, local, permanent, continuous, certain, and not significant.
Negative effects to riparian ecosystem composition in the Project Case are predicted to be small, local, permanent, continuous, possible, and not significant.
Negative effects to riparian ecosystems availability and distribution in the RFD Case are predicted to be small, beyond regional, permanent, continuous, certain, and not significant.
Negative effects to riparian ecosystems composition in the RFD Case are predicted to be small, beyond regional, permanent, continuous, possible, and not significant.
Note: RFD = reasonably foreseeable developments
June 2017 Project No. 1535751 6-145
ENVIRONMENTAL ASSESSMENT REPORT FOR THE PHASE 1 NEW TRANSMISSION LINE TO PICKLE LAKE PROJECT SECTION 6.0: BIOLOGICAL ENVIRONMENT BASE CASE AND EFFECTS ASSESSMENT
6.1.15 References
Abdul-Kareem, A.W. and S.G. McRae. 1984. The effects on topsoil of long-term storage in stockpiles. Biological Processes and Soil Fertility 76: 357-363.
Auerbach, N.A., M.D. Walker, and D.A. Walker. 1997. Effects of roadside disturbance on substrate and vegetation properties in Arctic tundra. Ecological Applications 7(1): 218-235.
Austin, M.A., D.A. Buffett, D.J. Nicolson, G.G.E. Scudder, and V. Stevens (editors). 2008. Taking nature’s pulse: the status of biodiversity in British Columbia. Biodiversity BC, Victoria, B.C.
Baldock, J.A. and Broos, K. 2012. Soil Organic Matter. In P.M. Huang, Y. Li, and M.E. Sumner (ed.). Handbook of Soil Sciences Properties and Processes, 2nd Edition. CRC Press. Boca Raton, FL.
Barton, C.D., A.D. Karathansis, and G. Chalfant. 2002. Influence of acidic atmospheric deposition on soil solution composition in the Daniel Boone National Forest, KY, USA. Environmental Geology 41(6): 672-682.
Beckett, P.J. 1995. Lichens: Sensitive Indicators of Improving Air Quality. In J.M. Gunn (ed.). Restoration and recovery of an industrial region: progress in restoring the smelter-damaged landscape near Sudbury, Canada. Springer-Verlag, New York. 358 pp.
Blouin, V.M., M.G. Schmidt, C.E. Bulmer, and M. Krzic. 2008. Effects of compaction and water content on lodgepole pine seedling growth. Forest Ecology and Management 255:2444-2452.
Bobbink, R., M. Hornung and J.G.M. Roelofs. 1998. The effects of air-borne nitrogen pollutants on species diversity in natural and semi-natural European vegetation. Journal of Ecology 86(5): 717-738.
Brandt, C.J. and R.W. Rhoades. 1973. Effects of limestone dust accumulation on lateral growth of forest trees. Environmental Pollution 4(3): 207-213.
British Colombia Environmental Assessment Office (BC EAO). 2013. Guideline for the Selection of Valued Components and Assessment of Potential Effects. September 2013.
Busse, M.D., S.E. Beattie, R.F. Powers, F.G. Sanchez, and A.E. Tiarks. 2006. Microbial community responses in forest mineral soil to compaction, organic matter removal, and vegetation control. Canadian Journal of Forest Research 36 (3):577-588.
Canadian Council of Forest Ministers. 2010. Vulnerability of Canada’s Tree Species to Climate Change and Management Options for Adaptation: An Overview for Policy Makers and Practitioners. Available at: http://www.ccfm.org/pdf/TreeSpecies_web_e.pdf. Accessed on: January 7, 2017.
Candau, J. and R. Fleming. 2011. Forecasting the response of spruce budworm defoliation to climate change in Ontario. Canadian Journal of Forest Research 41(10): 1948-1960.
June 2017 Project No. 1535751 6-146
ENVIRONMENTAL ASSESSMENT REPORT FOR THE PHASE 1 NEW TRANSMISSION LINE TO PICKLE LAKE PROJECT SECTION 6.0: BIOLOGICAL ENVIRONMENT BASE CASE AND EFFECTS ASSESSMENT
Carleton, T.J. 2001. Vegetation Responses to the Managed Forest Landscape of Central and Northern Ontario. In: Ecology of a Managed Terrestrial Landscape: Patterns and Processes of Forest Landscapes in Ontario [Eds. Perera, A., Euler, D. and I. Thompson]. University of British Columbia Press. 352 pp.
Carlson, M.L., and M., Shephard. 2007. Is the Spread of Non-Native Plants in Alaska Accelerating? Meeting the Challenge: Invasive Plants in Pacific Northwest Ecosystems. General Technical Report. Harrington TBR, Sarah H. Portland, OR, USA. Department of Agriculture, Forest Service, Pacific Northwest Research Station: 111-127.
Carr, W.W, W.R Mitchell and Watt, W. J. 1991. Basic soil interpretations for forest development planning: surface soil erosion and soil compaction. Land Management Report 63. BC Ministry of Forests, Victoria, BC.
Carter, V. 1997. Technical Aspects of Wetlands Hydrology, Water Quality, and Associated Functions. In National Water Summary on Wetlands Resources. United States Geological Survey Water Supply Paper 2425. Available at: http://water.usgs.gov/nwsum/WSP2425/hydrology.html. Accessed January 7, 2017.
Casanova M.T., and M.A. Brock. 2000. How do depth, duration, and frequency of flooding influence the establishment of wetland plant communities? Plant Ecology 147(2): 237-250.
Colombo, S.J., D.W. McKenney, K.M. Lawrence and P.A. Gray. 2007. Climate Change Projections for Ontario: Practical Policymakers and Planners. Science and Information Resources Division, Ontario Ministry of Natural Resources and Great Lakes Forestry Centre, Canadian Forest Service. Available at: http://www.climateontario.ca/MNR_Publications/276923.pdf. Accessed on: January 6, 2017.
Corns, I.G.W. 1988. Compaction by forestry equipment and effects on coniferous seedling growth on four soil in the Alberta foothills. Canadian Journal of Forest Research 18:75-84.
COSEWIC (Committee on the Status of Endangered Wildlife in Canada). 2016. COSEWIC Status Reports. Available at: http://www.sararegistry.gc.ca/search/advSearchResults_e.cfm?stype=doc&docID=18. Accessed January 7, 2017.
Crins, W.J., P.A. Gray, P.W.C. Uhlig, and M.C. Wester. 2009. The ecosystems of Ontario, Part 1: Ecozones and Ecoregions. Ministry of Natural Resources Peterborough Ontario, Inventory, Monitoring and Assessment, SIB TER IMA TR- 01, 71pp.
Davis, R., L. Chora, and W.J. Crins. 2006. GapTool: An Analytical Tool for Ecological Monitoring and Conservation Planning. Available at: http://casiopa.mediamouse.ca/wp-content/uploads/2010/05/PRFO-2006-Proceedings-p139-150-Davis-Chora-and-Crins.pdf. Accessed on: January 7, 2017.
Dawson, T.P., S.T. Jackson, J.I. House, I.C Prentice and G.M. Mace. 2011. Beyond predictions: biodiversity conservation in a changing climate. Science 332(6025): 53-58.
June 2017 Project No. 1535751 6-147
ENVIRONMENTAL ASSESSMENT REPORT FOR THE PHASE 1 NEW TRANSMISSION LINE TO PICKLE LAKE PROJECT SECTION 6.0: BIOLOGICAL ENVIRONMENT BASE CASE AND EFFECTS ASSESSMENT
Deser, C., A. Phillips, V. Bourdette and H. Teng. 2010. Uncertainty in climate change projections: the role of internal variability. Climate Dynamics 38 (3-4): 527-546.
Dove-Thompson, D., C. Lewis, P. Gray, C. Chu, and W.I. Dunlop. 2011. A Summary of the Effects of Climate Change on Ontario’s Aquatic Ecosystems. Science and Information Resources Division. Ontario Ministry of Natural Resources. Available at: http://files.ontario.ca/environment-and-energy/aquatics-climate/stdprod_088243.pdf. Accessed on: January 6, 2017.
ECCC (Environment and Climate Change Canada). 2017. Wetlands. Available at: https://www.ec.gc.ca/eau-water/default.asp?lang=En&n=27147C37-1#Section3. Accessed on: January 6, 2017.
Elmqvist, T., C. Folke, M. Nyström, G. Peterson, J. Bengtsson, B. Walker and J. Norberg. 2003. Response diversity, ecosystem change, and resilience. Frontiers in Ecology and the Environment 1: 488–494.
Environment Canada. 2013. How Much Habitat is Enough? Third Edition. Environment Canada, Toronto, Ontario. 130 pp.
Everett, K.R. 1980. Distribution and Properties of Road Dust Along the Northern Portion of the Haul Road. In: Brown J., and R. Berg (eds.). Environmental Engineering and Ecological Baseline Investigations Along the Yukon River-Prudhoe Bay Haul Road. U.S. Army Cold Regions Research and Engineering Laboratory. CRREL Report 80-19:101-128.
Ewing, S.A. and M.J. Singer. 2012. Soil quality. In: Huang P.M., Y. Li, and M.E. Sumner (eds.). Handbook of Soil Resource Management and Environmental Impacts, Second Edition. CRC Press. Boca Raton, FL. Pp 26-1 – 26-28.
Folke, C., S. Carpenter, S., B. Walker, M. Scheffer, T. Elmqvist, L. Gunderson and C.S. Holling. 2004. Regime shifts, resilience, and biodiversity in ecosystem management. Annual Review of Ecology, Evolution and Systematics 35: 557-581.
Ghose, M.K. 2001. Management of topsoil for geo-environmental reclamation of coal mining areas. Environmental Geology 40: 1405-1410.
Gleeson, J., P. Gray, A. Douglas, C.J. Lemieux, and G. Nielsen. 2011. A Practitioner’s Guide to Climate Change Adaptation in Ontario’s Ecosystems. Available at: http://www.climateontario.ca/doc/Tools/A%20Practitioners%20Guide%20to%20ClimateChange%20Adaptation%20in%20Ontario's%20Ecosystems%20Ver%201%202011.pdf. Accessed on: January 6, 2017.
Government of Canada. 2017. Species at Risk Public Registry. Available at: http://www.sararegistry.gc.ca/default.asp?lang=en&n=24F7211B-1. Accessed January 7, 2017.
Government of Ontario. 2017. Species at Risk in Ontario List. Available at: https://www.ontario.ca/environment-and-energy/species-risk-ontario-list. Accessed January 7, 2017.
June 2017 Project No. 1535751 6-148
ENVIRONMENTAL ASSESSMENT REPORT FOR THE PHASE 1 NEW TRANSMISSION LINE TO PICKLE LAKE PROJECT SECTION 6.0: BIOLOGICAL ENVIRONMENT BASE CASE AND EFFECTS ASSESSMENT
Government of Ontario. 2007. Endangered Species Act. Available at: https://www.ontario.ca/laws/statute/07e06. Accessed January 7, 2017.
Grantz, D.A., J.H.B. Gamer and D.W. Johnson. 2003. Ecological effects of particulate matter. Environment International 29(2-3): 213-239.
Farmer, A.M. 1993. The effects of dust on vegetation – a review. Environmental Pollution 79: 63-75.
Haddad, N.M., L.A. Brudvig, J. Clobert, K.F. Kendi, F. Davies, A. Gonzalez, R.D. Holt, T.E. Lovejoy, J.O. Sexton, M.P. Austin, C.D. Collins, W.M. Cook, E.I. Damschen, R.M. Ewers, B.L. Foster, C.N. Jenkins, A.J. King, W.F. Laurance, D.J. Levey, C.R. Margules, B.A. Melbourne, A.O. Nicholls, J.L. Orrock, D-X. Song, and J.R. Townshend. 2015. Habitat fragmentation and its lasting impact on Earth’s ecosystems. Science Advances 1(2): 1-9.
Hamberg, L.H., S. Lehvävirta, M.L. Minna, H. Rita, and D.J. Kotze. 2008. The effects of habitat edges and trampling on understorey vegetation in urban forests in Helsinki, Finland. Applied Vegetation Science 11(1):83-98.
Harrison, R.M., R. Tilling, M.S. Callén Romero, S. Harrad, and K. Jarvis. 2003. A study of trace metals and polycyclic aromatic hydrocarbons in the roadside environment. Atmospheric Environment 37(17): 2391-2402.
Holling, C.S. 1973. Resilience and Stability of Ecological Systems. Institute of Resource Ecology, University of British Columbia, Vancouver, Canada.
Holowaychuk, N. and R.J. Fessenden. 1987. Soil Sensitivity to Acid Deposition and the Potential of Soils and Geology in Alberta to Reduce the Acidity of Acidic Inputs. Alberta Research Council. Earth Sciences Report 87-1. Edmonton, AB. 38 pp.
Iverson, L. R. and A.M. Prasad. 2001. Potential changes in tree species richness and forest community types following climate change. Ecosystems 4: 186-199.
Jansen, A. and A.I. Robertson. 2001. Relationships between livestock management and the ecological condition of riparian habitats along an Australian floodplain river. Journal of Applied Ecology 38:63-75.
Johnston, C.A., N.E. Detenbeck and G.J. Niemi. 1990. The cumulative effects of wetlands on stream water quality and quantity. A landscape approach. Biogeochemistry 10(2): 105-141.
Jung, K. Y.S. Ok and S.X. Chang. 2011. Sulfate Adsorption Properties of Acid-sensitive Soils in the Athabasca Oil Sand Region in Alberta, Canada. Chemosphere 84: 457-463.Kundu, N.K. and M.K. Ghose. 1997. Shelf life of stock-piled topsoil of an opencast coal mine. Environmental Conservation 24: 24-30.
Jung, K., W. Choi, S.X. Chang, M.A. Arshad. 2013. Soil and tree ring chemistry of Pinus banksiana and Populus tremuloides stands as indicators of changes in atmospheric environments in the oil sands region of Alberta, Canada. Ecological Indicators 25: 256-265.
June 2017 Project No. 1535751 6-149
ENVIRONMENTAL ASSESSMENT REPORT FOR THE PHASE 1 NEW TRANSMISSION LINE TO PICKLE LAKE PROJECT SECTION 6.0: BIOLOGICAL ENVIRONMENT BASE CASE AND EFFECTS ASSESSMENT
LandOwner Resource Centre. 1999. Extension Notes: The Old-Growth Forests of Southern Ontario. Available at: http://www.lrconline.com/Extension_Notes_English/pdf/oldgwth.pdf. Accessed on: January 31, 2017.
Lafortezza R., D. Coomes, V. Kapos, and R. Ewers. 2010. Assessing the impacts of fragmentation on plant communities in New Zealand: Scaling from survey plots to landscapes. Global Ecology and Biogeography 19: 741-754.
Lemmon, D.S. and F.J. Warren. 2004. Climate change impacts and adaptation: A Canadian perspective. Natural Resources Canada, Ottawa, ON. Available at: https://cfs.nrcan.gc.ca/publications/download-pdf/27428. Accessed on: January 6, 2017.
Leyer, I. 2005. Predicting plant species’ responses to river regulation: the role of water level fluctuations. Journal of Applied Ecology 42(2): 239-250.
Liu, D., J. Abuduwaili, J. Lei, G. Wu and D. Gui. 2011. Wind erosion of saline playa sediments and its ecological effects in Ebinur Lake, Xinjiang, China. Environmental Earth Science 63: 241-250.
Lu, Z., L. Li, M. Jiang, H. Huang, and D. Bao. 2010. Can the soil seed bank contribute to revegetation of the drawdown zone in the three gorges reservoir region? Plant Ecology 209(1): 153-165.
Mack, R.N., D. Simberloff, W.M. Lonsdale, H. Evans, M. Clout, and F.A. Bazzaz. 2000. Biotic invasions: Causes, epidemiology, global consequences, and control. Ecological Applications 10: 689-710.
Martin, K., K.E.H. Aitken, and K.L. Wiebe. 2004. Nest sites and nest webs for cavity-nesting communities in interior British Columbia, Canada: nest characteristics and niche partitioning. The Condor 106(1):5-19.
McKenney, D.W., J.H. Pedlar, K. Lawrence, P.A. Gray, S.J. Colombo, and W.J. Crins. 2010. Current and Projected Future Climatic Conditions for Ecoregions and Selected Natural Heritage Areas in Ontario. Climate Change Research Report CCRR-016. Applied Research and Development Branch, Ontario Ministry of Natural Resources, Sault Ste. Marie, Ontario.
McNaughton, C.S., A.D. Clarke, V. Kapustin, Y. Shinozuka, S.G. Howell, B.E. Anderson, E. Winstead, J. Dibb, E. Scheuer, R.C. Cohen, P. Wooldridge, A. Perring, L.G. Huey, S. Kim, J.L. Jimenez, E.J. Dunlea, P.F. DeCarlo, P.O Wennberg, J.D. Crounse, A.J. Weinheimer, and F. Flocke. 2009. Observations of heterogeneous reactions between Asian pollution and mineral dust over the eastern North Pacific during INTEX-B. Atmospheric Chemistry and Physics 9: 8283-8308.
Ministry of Forests Research Program. 1998. Biodiversity and Interior Habitat: The Need to Minimize Edge Effects, Part 6 of 7. Available at: https://www.for.gov.bc.ca/hfd/pubs/docs/en/en21.pdf. Accessed on: January 7, 2017.
MNR (Ontario Ministry of Natural Resources). 2012. State of Ontario’s Forests. [Accessed September 15, 2016]. https://www.ontario.ca/page/forestry-reports.
June 2017 Project No. 1535751 6-150
ENVIRONMENTAL ASSESSMENT REPORT FOR THE PHASE 1 NEW TRANSMISSION LINE TO PICKLE LAKE PROJECT SECTION 6.0: BIOLOGICAL ENVIRONMENT BASE CASE AND EFFECTS ASSESSMENT
MNR. 2011. Natural Resources and Values Information System [computer file]. Toronto, Ontario: The Ontario Ministry of Natural Resources, [2011].
MNR. 2010. Natural Heritage Reference Manual for Natural Heritage Policies of the Provincial Policy Statement, 2005. Second Edition. March 18, 2010. Available at: http://cloca.ca/resources/Outside%20documents/Natural%20Heritage%20Policies%20of%20the%20Provincial%20Policy%20Statement%20MNR%202010.pdf. Accessed: January 7, 2017.
MNR. 2001. Ecological Land Classification for Southern Ontario: Training Manual. SCSS TM 01, March 2001.
MNR. 1991. Code of Practice for Timber Management Operations in Riparian Areas. Available at: https://dr6j45jk9xcmk.cloudfront.net/documents/2794/guide-code-prac-riparian.pdf. Accessed on: January 7, 2017.
MNRF (Ontario Ministry of Natural Resources and Forestry). 2017. Rare Vegetation Communities [email personal communication]. February 6, 2017 with John Campo.
MNRF. 2016a. Forest Resources Inventories - Planning Composite Inventory or Base Model Inventory Land Information Ontario. Metadata available at: https://www.javacoeapp lrc.gov.on.ca/geonetwork/srv/en/main.home?uuid=cbb10bcd-bef9-49ea-8bda-f6e1121b0a47. Accessed on: October 25, 2016. [Downloaded from Land. Information Ontario Data Warehouse, under Ontario Geospatial Data Exchange agreement with MNRF and Windigo First Nations Council, 2016].
MNRF. 2016b. Wetland. Land Information Ontario. Metadata available at: https://www.javacoeapp.lrc.gov.on.ca:443/geonetwork?uuid=04e466a9-7731-438c-a37a-38fde98202b7. [Downloaded from Land Information Ontario Data Warehouse, under Ontario Geospatial Data Exchange agreement with MNRF and Windigo First Nations Council, 2016].
MNRF. 2014. Integrated Assessment Protocol for Woodland Caribou Ranges in Ontario. Species at Risk Branch, Thunder Bay, Ontario, vii + 95 pp.
Morris, K. and P. Reich. 2013. Understanding the Relationship Between Livestock Grazing and Wetland Condition. Arthur Rylah Institute for Environmental Research Technical Report Series No. 252. Available at: http://www.delwp.vic.gov.au/__data/assets/pdf_file/0006/249756/ARI-Technical-Report-252-Understanding-the-relationship-between-grazing-and-wetland-condition.pdf. Accessed January 7, 2017.
Mortsch, L.D., M. Alden and J.D. Scheraga. 2003. Climate Change and Water Quality in the Great Lakes Region: Risks, Opportunities and Responses. Available at: http://www.ijc.org/rel/pdf/climate_change_2003_part3.pdf. Accessed on: January 7, 2017.
Mortsch. L.D. 1998. Assessing the impact of climate change on the Great Lakes shoreline wetlands. Climate Change 40: 391-416.
ENVIRONMENTAL ASSESSMENT REPORT FOR THE PHASE 1 NEW TRANSMISSION LINE TO PICKLE LAKE PROJECT SECTION 6.0: BIOLOGICAL ENVIRONMENT BASE CASE AND EFFECTS ASSESSMENT
Naeem, S., F.S. Chapin III, R. Costanza, P.R. Ehrlich, F.B. Golley, D.U. Hooper, J.H. Lawton, R.V. O’Neill and H.A. Mooney. 1999. Biodiversity and ecosystem functioning: maintaining natural life support processes. Issues in Ecology 4:1–11.
NHIC (Natural Heritage Information Centre). 2017. Natural Heritage Information Centre: Get Natural Heritage Information. Available at: https://www.ontario.ca/page/get-natural-heritage-information. Accessed January 7, 2017.
NHIC. 2016. Natural Heritage Mehtodology. Available at: https://www.ontario.ca/page/natural-heritage-methodology. Accessed on: February 13, 2017.
Nilsson, C. and M. Svedmark. 2002. Basic principles and ecological consequences of changing water regimes: riparian plant communities. Environmental Management 30(4): 468–480.
Noss, R.F. 1990. Indicators of monitoring biodiversity: a hierarchical approach. Conservation Biology 4(4):355-364.
Odland, A. and R. del Moral. 2002. Thirteen years of wetland vegetation succession following a permanent drawdown, Myrkdalen Lake, Norway. Plant Ecology 162(2): 185-198.
OMAFRA (Ontario Ministry of Agriculture, Food and Rural Affairs). 2017. Noxious Weeds in Ontario. Available at: http://www.omafra.gov.on.ca/english/crops/facts/noxious_weeds.htm. Accessed January 7, 2017.
Parendes, L.A. and J.A. Jones. 2000. Role of light availability and dispersal in exotic plant invasion along roads and streams in the H.J. Andrews Experimental Forest, Oregon. Conservation Biology 14: 64-75.
Peachey, C.J., D. Sinnett, M. Wilkinson, G.W. Morgan, P.H. Freer-Smith, and T.R. Hutchings. 2009. Deposition and solubility of airborne metals to four plant species grown at varying distances from two heavily trafficked roads in London. Environmental Pollution 157(8-9): 2291-2299.
Peterson, G., C.R. Allen and C.S. Holling. 1998. Ecological resilience, biodiversity, and scale. Ecosystems 1: 6-18.
Polster, D.F. 2003. The role of invasive plant species management in mined land reclamation. British Columbia Mine Reclamation Symposium: 24-32.
Racey, G.D., A.G. Harris, J.K. Jeglum, R.F. Foster and G.M. Wickware. 1996. Terrestrial and wetland ecosites of northwestern Ontario. Ontario Ministry of Natural Resources, Northwest Science and Technology Field Guide FG-02. 94 pp + Append.
Reichard, S.H. and P. White. 2001. Horticulture as a pathway of invasive plant introductions in the United States. BioScience 51: 103-113.
Rusek, A. and V.G. Marshall. 2000. Impacts of airborne pollutants on soil fauna. Annual Review of Ecology and Systematics 31: 395-423.
June 2017 Project No. 1535751 6-152
ENVIRONMENTAL ASSESSMENT REPORT FOR THE PHASE 1 NEW TRANSMISSION LINE TO PICKLE LAKE PROJECT SECTION 6.0: BIOLOGICAL ENVIRONMENT BASE CASE AND EFFECTS ASSESSMENT
Scott, G.A.J. 1995. Canada’s Vegetation: A World Perspective. McGill-Queen’s University Press, Montreal. 361 pp.
Shafroth, P.B., J.M. Friedman, G.T. Auble, M.L. Scott, and J.H. Braatne. 2002. Potential responses of riparian vegetation to dam removal. BioScience 52: 703–712.
Sheldon, D., T. Hruby, P. Johnson, K. Harper, A. McMillan, T. Granger, S. Stanley and E. Stockdale. 2005. Wetlands in Washington State – Volume 1: A Synthesis of the Science. Washington State Department of Ecology. Available at: https://fortress.wa.gov/ecy/publications/documents/0506006.pdf. Accessed on: January 7, 2017.
Sims, R.A., W.D. Towill, K.A. Baldwin, P. Uhlig and G.M. Wickware. 1997. Field Guide to the Forest Ecosystem Classification for Northwestern Ontario. Ontario Ministry of Natural Resources Northwest Science and Technology. Thundery Bay, Ontario. Feld Guide FG-03. 176 pp.
Soulé, M.E., J.A. Estes, J. Berger and C.M. Del Rio. 2003. Ecological effectiveness: conservation goals for interactive species. Conservation Biology 17: 1238-1250.
Species at Risk Act, 2002. SC 2002, c 29. Available at: http://canlii.ca/t/520l0
Spectranalysis Inc. 2004. Introduction to the Ontario Land Cover Data Base, Second Edition (2000): Outline of Production Methodology and Description of 27 Land Cover Classes. Report to Ontario Ministry of Natural Resources. Unpublished. [Downloaded from Land Information Ontario Data Warehouse, under agreement with MNRF and Windigo First Nations Council, 2016].
Stark, J.M and E.F. Redente. 1987. Production potential of stockpiled topsoil. Soil Science 144: 72-76.
Sutter, G.C., S.K. Davis, and D.C. Duncan. 2000. Grassland songbird avoidance along roads and trails in southern Saskatchewan. Journal of Field Ornithology 71: 110-116.
Swift, T.L. and S.J. Hannon. 2010. Critical thresholds associated with habitat loss: a review of the concepts, evidence, and applications. Biological Reviews 85: 35-53.
Thompson, I.D., M.D. Flannigan, B.M. Wotton, and R. Suffling. 1998. The effects of climate change on landscape diversity: an example in Ontario forests. Environmental Monitoring and Assessment 49: 213-233.
Truscott, A-M., S.C. Palmer, C. Soulsby, S. Westaway, and P.E. Hulme. 2008. Consequences of invasion by the alien plant Mimulus guttatus on the species composition and soil properties of riparian plant communities in Scotland. Perspectives in Plant Ecology, Evolution and Systematics 10(4): 231-240.
Turchenek, L.W., S.A. Abboud and U. Dowey. 1998. Critical Loads for Organic (Peat) Soils in Alberta. Prepared for the Target Loading Subgroup and Clean Air Strategic Alliance by Alberta Research Council and AGRA Earth and Environmental Limited. Edmonton, AB.
June 2017 Project No. 1535751 6-153
ENVIRONMENTAL ASSESSMENT REPORT FOR THE PHASE 1 NEW TRANSMISSION LINE TO PICKLE LAKE PROJECT SECTION 6.0: BIOLOGICAL ENVIRONMENT BASE CASE AND EFFECTS ASSESSMENT
Turner, I.M. 1996. Species loss in fragments of tropical rainforest: a review of the evidence. Journal of Applied Ecology 33: 200-209.
Varrin, R. J. Bowman, P.A. Gray. The Known and Potential Effects of Climate Change on Biodiversity in Ontario’s Terrestrial Ecosystems: Case Studies and Recommendations for Adaptation. Wildlife Research and Development Section Ontario Ministry of Natural Resources. Available at: http://www.climateontario.ca/MNR_Publications/276927.pdf. Accessed on: January 6, 2017.
Walker, D.A., and K.R. Everett. 1987. Road dust and its environmental-impact on Alaskan taiga and tundra. Arctic Alpine Research 19: 479-489.
Walther, G.R. 2010. Community and ecosystem responses to recent climate change. Philosophical Transactions of the Royal Society B 365(1549): 2019-2024.
Waring, R.H. 1989. Ecosystems: fluxes of matter and energy. In: Ecological Concepts: The Contribution of Ecology to an Understanding of the Natural World (JM Cherrett, ed.). Blackwell Scientific Publications, Oxford, UK.
Watkins, R.Z., J. Chen, J. Pickens, and K.D. Brosofske. 2003. Effects of forest roads on understory plants in a managed hardwood landscape. Conservation Biology 17(2): 411-419.
Welsch, D., D. Smart, J. Boyer, P. Minkin, S. Smith and T. McCandless. 1995. Forested Wetlands: Functions, Benefits, and the Use of Best Management Practices. USDA Forest Service, Radnor, PA. 62 pp.
WHO (World Health Organization). 2000. Air Quality Guidelines for Europe Second Edition - Part III Evaluation of Ecotoxic Effects. WHO Regional Publications, European Series. No. 91. Copenhagen, DK. Available at: http://helid.digicollection.org/pdf/s13481e/s13481e.pdf. Accessed January 7, 2017.
Wick, A.F., P.D. Stahl, L.J. Ingram and L. Vicklun. 2009. Soil aggregation and organic carbon in short-term stockpiles. Soil Use and Management 25(3): 311-319.
Zedler, J.B. and S. Kercher. 2004. Causes and consequences of invasive plants in wetlands: opportunities, opportunists, and outcomes. Critical Reviews in Plant Sciences 23: 431-452.
Zedler, J.B. 2003. Wetlands at your service: reducing impacts of agriculture at the watershed scale. Frontiers in Ecology and the Environment 1(2): 65-72.