COMMUNITY ENGAGEMENT OF IMMIGRANTS AND REFUGEES IN THE HOST SOCIETY: THE CASE OF GREATER VICTORIA COMMUNITY ENGAGEMENT OF IMMIGRANTS AND REFUGEES IN THE HOST SOCIETY: Catherine Xie, Annabelle Song, Cindy Lu, Pallas Zhang
Transcript
COMMUNITY ENGAGEMENT OF IMMIGRANTS AND REFUGEES IN
THE HOST SOCIETY:
THE CASE OF GREATER VICTORIA
COMMUNITY ENGAGEMENT OF IMMIGRANTS AND REFUGEES IN
THE HOST SOCIETY:
CatherineXie,AnnabelleSong,CindyLu,PallasZhang
3
In 2010, 10,863 Family Class immigrants arrived in B.C., compared to 12,612 in 2009, a 13.9% decline. The 2010 total was down 12.6% from 2008.
B.C. welcomed 1,667 Refugee Class immigrants in 2010, up over 2009 (+2.1%) and 2008 (+8.8%).
Source Countries
In 2010, immigrants to B.C. came from over 170 countries. Mainland China continues to be the top source country to B.C. and has been so since 1998. While India had been the second top source country since 1999, it was surpassed in 2010 by the Philippines. The change in ranking refl ects the decline in Family Class immigrants, of which India is the largest source country. Overall, India was the third top source country in 2010.
The top three source countries accounted for nearly half (49.4%) of all immigrant arrivals to B.C. Rounding out the top fi ve in 2010 were United Kingdom and South Korea.
In 2010, four of the top fi ve countries came from the Asia-Pacifi c while six of the top ten also came from this region.
By world region, 29,700 or just over two-thirds (67.2%) of new immigrants to B.C. in 2010 came from Asia. Europe accounted for 12.7% (5,622) of new immigrants to B.C. followed by Africa and the Middle East with 10.4% (4,593), Central and South America with 4.4% (1,948), United States with 3.8% (1,697), and Australia and New Zealand with 1.4% (608).
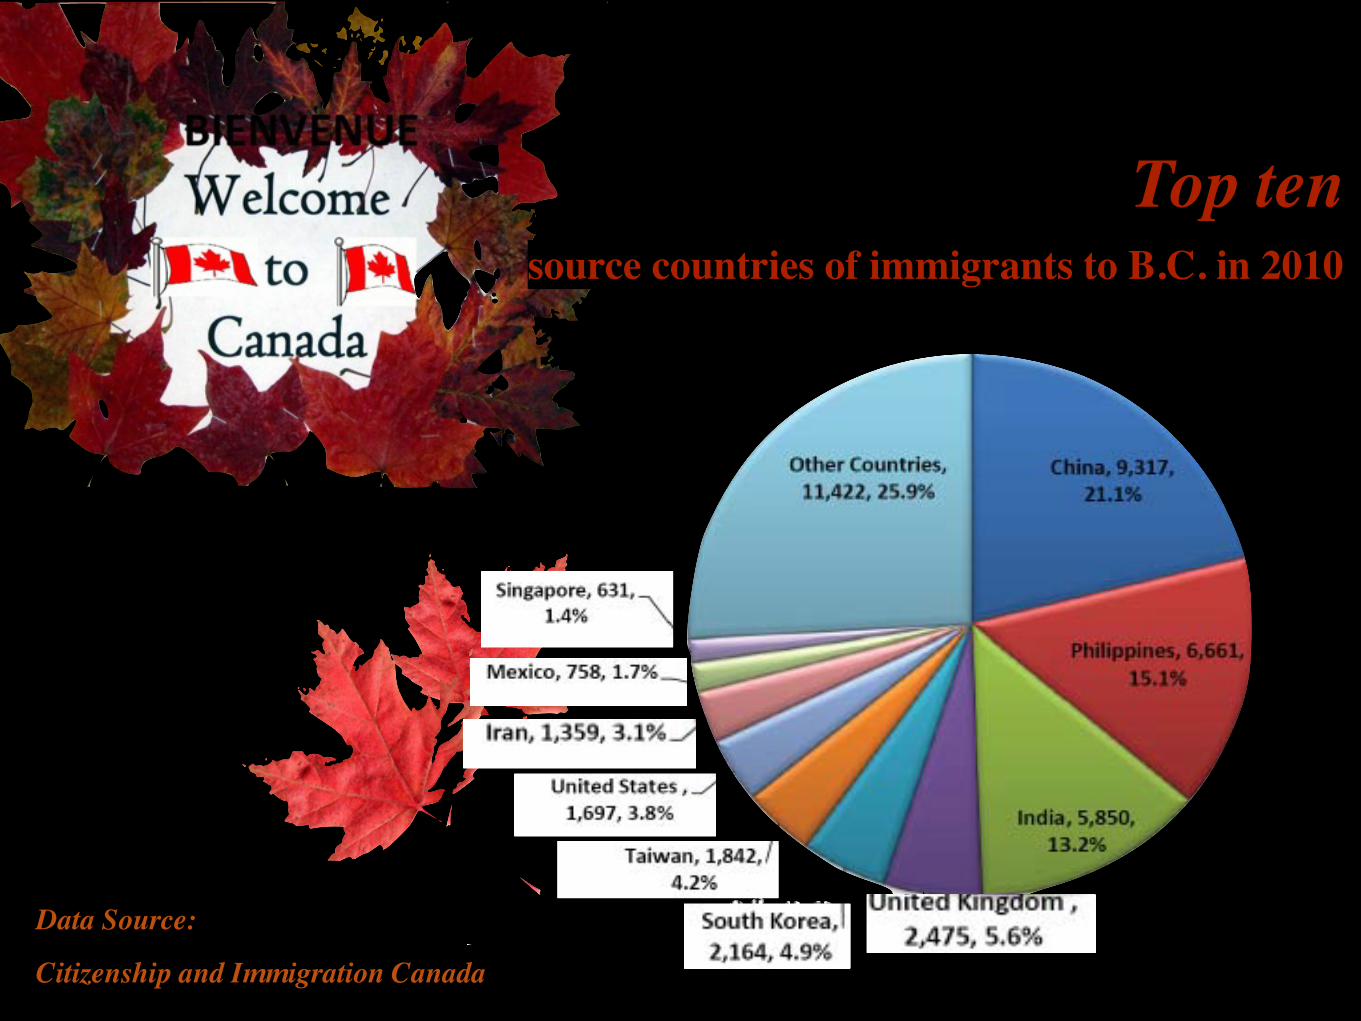
Chart 2: Top ten source countries of immigrants to B.C. in 2010
Data Source: Citi zenship and Immigrati on Canada
Please refer to the Asia-Pacifi c Immigrants Fact Sheet for detailed information on immigrants from this region: http://www.welcomebc.ca/facts_and_trends
Offi cial Language Ability (English and/or French)
Offi cial language ability (the ability to speak English and/or French) is reported for immigrants aged 15 and over at the time of arrival. The data is based mostly on self-reported language ability. Offi cial language ability is generally considered to overstate competency in Canada’s offi cial languages.
Despite the increased share in Economic Class immigrants, little change occurred in offi cial language ability. 72.5% (25,695) of youth and adult immigrants to B.C. arrived with offi cial language ability in 2010, which was slightly higher than in 2009 (71.3%) and 2008 (71.8%).
27.5% (9,757) of immigrants came with no offi cial language ability in 2010 compared to 28.7% in 2009 and 28.2% in 2008.
Table 2: Immigrants to B.C. (aged 15 and over) by offi cial language ability at the time of arrival, 2008-2010
Offi cial Language Ability 2008 2009 2010
English 67.5% 67.1% 68.7%
Bilingual 3.9% 3.8% 3.5%
French 0.4% 0.4% 0.3%
None 28.2% 28.7% 27.5%
Total 100.0% 100.0% 100.0%
Absolute Number 35,923 34,142 35,452
Data Source: Citi zenship and Immigrati on Canada
In general, the percentage of immigrants to B.C. with offi cial language ability is less than Canada. In 2010, 81.4% of immigrants to Canada had offi cial language ability compared to 72.5% of B.C. immigrants. This is in part explained by the high percentage of Quebec immigrants with an offi cial language (French and/or English), which infl uences the national numbers. As well, B.C.’s lower offi cial language ability refl ects the source country of immigrants to B.C., many of whom come from countries where English and/or French is not the spoken or offi cial language.
In 2010, 71.6% of female immigrants to B.C. aged 15 and over had offi cial language ability compared to 73.4% of males. Although the diff erence is small, generally, a greater share of male immigrants to B.C. have offi cial language ability compared to females.
Immigrants with more education tend to arrive with offi cial language ability compared to lesser educated. For instance, 85.1% of immigrants with university education (aged 25+) arrived with offi cial language ability compared to 49.8% of immigrants with no formal education.
Top ten
source countries of immigrants to B.C. in 2010
3
In 2010, 10,863 Family Class immigrants arrived in B.C., compared to 12,612 in 2009, a 13.9% decline. The 2010 total was down 12.6% from 2008.
B.C. welcomed 1,667 Refugee Class immigrants in 2010, up over 2009 (+2.1%) and 2008 (+8.8%).
Source Countries
In 2010, immigrants to B.C. came from over 170 countries. Mainland China continues to be the top source country to B.C. and has been so since 1998. While India had been the second top source country since 1999, it was surpassed in 2010 by the Philippines. The change in ranking refl ects the decline in Family Class immigrants, of which India is the largest source country. Overall, India was the third top source country in 2010.
The top three source countries accounted for nearly half (49.4%) of all immigrant arrivals to B.C. Rounding out the top fi ve in 2010 were United Kingdom and South Korea.
In 2010, four of the top fi ve countries came from the Asia-Pacifi c while six of the top ten also came from this region.
By world region, 29,700 or just over two-thirds (67.2%) of new immigrants to B.C. in 2010 came from Asia. Europe accounted for 12.7% (5,622) of new immigrants to B.C. followed by Africa and the Middle East with 10.4% (4,593), Central and South America with 4.4% (1,948), United States with 3.8% (1,697), and Australia and New Zealand with 1.4% (608).
Chart 2: Top ten source countries of immigrants to B.C. in 2010
Data Source: Citi zenship and Immigrati on Canada
Please refer to the Asia-Pacifi c Immigrants Fact Sheet for detailed information on immigrants from this region: http://www.welcomebc.ca/facts_and_trends
Offi cial Language Ability (English and/or French)
Offi cial language ability (the ability to speak English and/or French) is reported for immigrants aged 15 and over at the time of arrival. The data is based mostly on self-reported language ability. Offi cial language ability is generally considered to overstate competency in Canada’s offi cial languages.
Despite the increased share in Economic Class immigrants, little change occurred in offi cial language ability. 72.5% (25,695) of youth and adult immigrants to B.C. arrived with offi cial language ability in 2010, which was slightly higher than in 2009 (71.3%) and 2008 (71.8%).
27.5% (9,757) of immigrants came with no offi cial language ability in 2010 compared to 28.7% in 2009 and 28.2% in 2008.
Table 2: Immigrants to B.C. (aged 15 and over) by offi cial language ability at the time of arrival, 2008-2010
Offi cial Language Ability 2008 2009 2010
English 67.5% 67.1% 68.7%
Bilingual 3.9% 3.8% 3.5%
French 0.4% 0.4% 0.3%
None 28.2% 28.7% 27.5%
Total 100.0% 100.0% 100.0%
Absolute Number 35,923 34,142 35,452
Data Source: Citi zenship and Immigrati on Canada
In general, the percentage of immigrants to B.C. with offi cial language ability is less than Canada. In 2010, 81.4% of immigrants to Canada had offi cial language ability compared to 72.5% of B.C. immigrants. This is in part explained by the high percentage of Quebec immigrants with an offi cial language (French and/or English), which infl uences the national numbers. As well, B.C.’s lower offi cial language ability refl ects the source country of immigrants to B.C., many of whom come from countries where English and/or French is not the spoken or offi cial language.
In 2010, 71.6% of female immigrants to B.C. aged 15 and over had offi cial language ability compared to 73.4% of males. Although the diff erence is small, generally, a greater share of male immigrants to B.C. have offi cial language ability compared to females.
Immigrants with more education tend to arrive with offi cial language ability compared to lesser educated. For instance, 85.1% of immigrants with university education (aged 25+) arrived with offi cial language ability compared to 49.8% of immigrants with no formal education.
3
In 2010, 10,863 Family Class immigrants arrived in B.C., compared to 12,612 in 2009, a 13.9% decline. The 2010 total was down 12.6% from 2008.
B.C. welcomed 1,667 Refugee Class immigrants in 2010, up over 2009 (+2.1%) and 2008 (+8.8%).
Source Countries
In 2010, immigrants to B.C. came from over 170 countries. Mainland China continues to be the top source country to B.C. and has been so since 1998. While India had been the second top source country since 1999, it was surpassed in 2010 by the Philippines. The change in ranking refl ects the decline in Family Class immigrants, of which India is the largest source country. Overall, India was the third top source country in 2010.
The top three source countries accounted for nearly half (49.4%) of all immigrant arrivals to B.C. Rounding out the top fi ve in 2010 were United Kingdom and South Korea.
In 2010, four of the top fi ve countries came from the Asia-Pacifi c while six of the top ten also came from this region.
By world region, 29,700 or just over two-thirds (67.2%) of new immigrants to B.C. in 2010 came from Asia. Europe accounted for 12.7% (5,622) of new immigrants to B.C. followed by Africa and the Middle East with 10.4% (4,593), Central and South America with 4.4% (1,948), United States with 3.8% (1,697), and Australia and New Zealand with 1.4% (608).
Chart 2: Top ten source countries of immigrants to B.C. in 2010
Data Source: Citi zenship and Immigrati on Canada
Please refer to the Asia-Pacifi c Immigrants Fact Sheet for detailed information on immigrants from this region: http://www.welcomebc.ca/facts_and_trends
Offi cial Language Ability (English and/or French)
Offi cial language ability (the ability to speak English and/or French) is reported for immigrants aged 15 and over at the time of arrival. The data is based mostly on self-reported language ability. Offi cial language ability is generally considered to overstate competency in Canada’s offi cial languages.
Despite the increased share in Economic Class immigrants, little change occurred in offi cial language ability. 72.5% (25,695) of youth and adult immigrants to B.C. arrived with offi cial language ability in 2010, which was slightly higher than in 2009 (71.3%) and 2008 (71.8%).
27.5% (9,757) of immigrants came with no offi cial language ability in 2010 compared to 28.7% in 2009 and 28.2% in 2008.
Table 2: Immigrants to B.C. (aged 15 and over) by offi cial language ability at the time of arrival, 2008-2010
Offi cial Language Ability 2008 2009 2010
English 67.5% 67.1% 68.7%
Bilingual 3.9% 3.8% 3.5%
French 0.4% 0.4% 0.3%
None 28.2% 28.7% 27.5%
Total 100.0% 100.0% 100.0%
Absolute Number 35,923 34,142 35,452
Data Source: Citi zenship and Immigrati on Canada
In general, the percentage of immigrants to B.C. with offi cial language ability is less than Canada. In 2010, 81.4% of immigrants to Canada had offi cial language ability compared to 72.5% of B.C. immigrants. This is in part explained by the high percentage of Quebec immigrants with an offi cial language (French and/or English), which infl uences the national numbers. As well, B.C.’s lower offi cial language ability refl ects the source country of immigrants to B.C., many of whom come from countries where English and/or French is not the spoken or offi cial language.
In 2010, 71.6% of female immigrants to B.C. aged 15 and over had offi cial language ability compared to 73.4% of males. Although the diff erence is small, generally, a greater share of male immigrants to B.C. have offi cial language ability compared to females.
Immigrants with more education tend to arrive with offi cial language ability compared to lesser educated. For instance, 85.1% of immigrants with university education (aged 25+) arrived with offi cial language ability compared to 49.8% of immigrants with no formal education.Data Source:
Citizenship and Immigration Canada
English as a Second LanguageAlexis and Kris ESL teachers
To complement our numerous services, we at VIRCS have been offering ESL classes to newcomers and immigrants for more than 15 years, during which time our staff have helped thousands of newcomers and Canadian citizens returning to school to upgrade their language skills. There have been changes over the years in the scheduling and focus of the classes, but the need for these classes remains unchanged. Language training provides an essential service for new Immigrants looking to further their career goals and find a greater sense of belonging and independence within Canadian society. In 2013 we offered General English classes at two levels: beginner and intermediate. These classes ran Tuesday, Wednesday and Thursday 8:30-10:30 for beginners and 10:30-12:30 for clients with higher communication skills. The focus of the classes was communication. We give priority to immigrants and Canadian citizens for affordable lessons, but we also welcome international students to our sessions at a slightly higher fee-for-service basis. The General English classes are partially funded by the BC Gaming Policy and Enforcement Branch, but participants also pay a small fee as a contribution to the program, with international students at a higher rate and permanent residents at a considerably lower rate. The other courses have been funded under various programs and participants channeled through our other branches.VIRCS ESL also assists with on-demand test preparation courses (IELTS), pronunciation workshops, a summer English language class for youth, writing workshops for working professionals and a conversation club open to allOur participants are encouraged to engage in person-to-person interaction and friendship building in our small and friendly classes. Our teachers are qualified and experienced language facilitators, who fully understand the difficulties immigrants face and help clients overcome their inhibitions to speak and build strong language skills. Some major topics covered in our classes include transportation, health, relationships and everyday situations. In our English classes, grammar, vocabulary and pronunciation topics are presented and consolidated through reading, writing, listening and speaking activities.Volunteers contribute to all of the ESL programs at VIRCS. Our enthusiastic volunteers assist the teachers and clients in many ways. They provide one-on-one interaction, listening and speaking opportunities during courses, workshops and other sessions. They bring their own local experience and expertise in various fields. Some of these volunteers are educators themselves and help with marking homework and facilitating small group discussions. The English language training program wouldn’t be the same without our dedicated team of volunteers, and our clients really appreciate the help they get from them. Our clients come from all over the world and represent all walks of life. All of them have one goal in common: to learn English in order to enjoy greater personal and professional fulfillment. It is our hope tocontinue to provide relevant, accessible, and pedagogically sound English language training into 2014 and beyond. At present, we are particularly optimistic about the future as in addition to the support of the BC Gaming Policy and Enforcement Branch further funding has recently been proposed. We anticipate this funding will be used to strengthen and expand our existing programming in order to better meet our clients’ English language needs while striving to locate new students who have difficulty accessing traditional classroom-based courses.
8
Citizenship 101Alvaro Moreno
Launched in January 2013 with funding from by Citizenship and Immigration Canada, Citizenship 101 was designed to help Permanent Residents prepare for the Canadian citizenship test and to promote good citizenship values. This program is managed by myself, Kerri Greenidge is the Program Coordinator and Pam Devito coordinates Citizenship 101 Mentors.
The three series of ten training sessions were completed successfully between January and September 2013. More than 20 countries of origin were represented among the 86 registered participants, such as China, Mexico, Philippines, Iran, USA, and Russia. Overall, most participants were female – 71%. The most common age group has been 35-44 years old.
To date, five of our participants have taken the official Canadian citizenship test. All of them passed, one with a mark of 100%.
Volunteer mentors and small group facilitators provided invaluable support to participants. Their commitment reflects an understanding of newcomers’ needs and contribution to our community. Thank you to Pam Devito for an amazing volunteer coordination!
Guest speakers and guided tours of local sites of relevance have been popular components. Five guest speakers were invited to help cover different topics and we are grateful for their contribution to the project. Thank you to Murray Rankin, MP for Victoria, citizenship Judge Gerald Pash, Native Friendship Centre Liaison Leslie McGarry, Lawyer Roberto Alberto, Camosun College Instructor Daniel Reeve, Geographer Grace Stubblefield, and Greater Victoria Development Agency Economist Dallas Gislason.We are in the process of finalizing our Citizenship 101 Facilitators’ and Participants’ Handbooks, and we are planning the second stage of the project, which includes the outreach activities to other agencies across the province. Arrangements are being made at this time for a train-the-trainer workshop in Kamloops, BC, with the participation of 5 agencies.
To learn more about this exciting project, we invite you to visit our webpage at www.citizenship101.ca, which has become the main contact source for the project. You will find videos, photos, discussion topics and other resources available not only for newcomers, but for all Canadians interested in good citizenship.
10
VIRCS’s 2012/2013 Board of Directors
ElviraLopez–President
NancyHum–ActingPresident
AnselmeHategekimana–Co-Treasurer
MelanieMurray–Co-Treasurer
CatherineKamau-Secretary
MiguelEspinosa–Director-at-large
AaronHall-Director-at-large
MarieMorrison-Director-at-large
ZachyOlorunjowon-Director-at-large
DavidTurner-Director-at-large
YuJun(David)Wang-Director-at-large
TsehayeHaileWoldemenkeros-Director-at-large
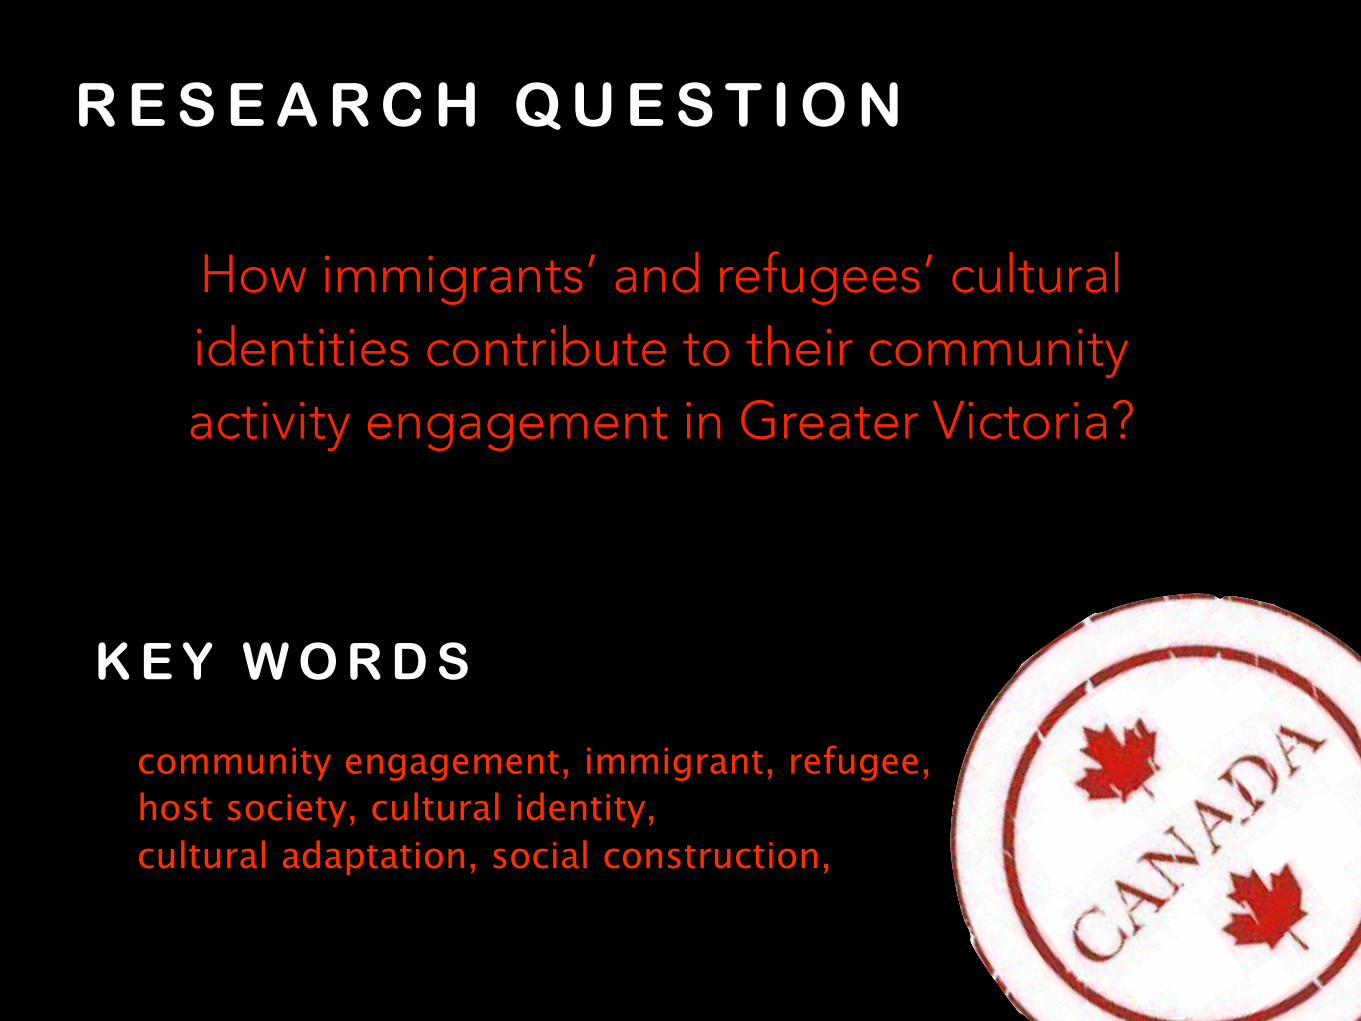
R E S E A R C H Q U E S T I O N
K E Y W O R D S
community engagement, immigrant, refugee, host society, cultural identity, cultural adaptation, social construction,
How immigrants’ and refugees’ cultural identities contribute to their community activity engagement in Greater Victoria?
T H E O RY A N D K E Y C O N C E P T S
“Social construction theory addresses the processes by which people jointly construct their understanding of the world. Advocates assume that meanings are developed in
coordination with others rather than separately within
each individual or in the world of things, making social interaction the loom upon which the social fabric is woven.”(Leeds-Hurwitz, 2009, p. 891).
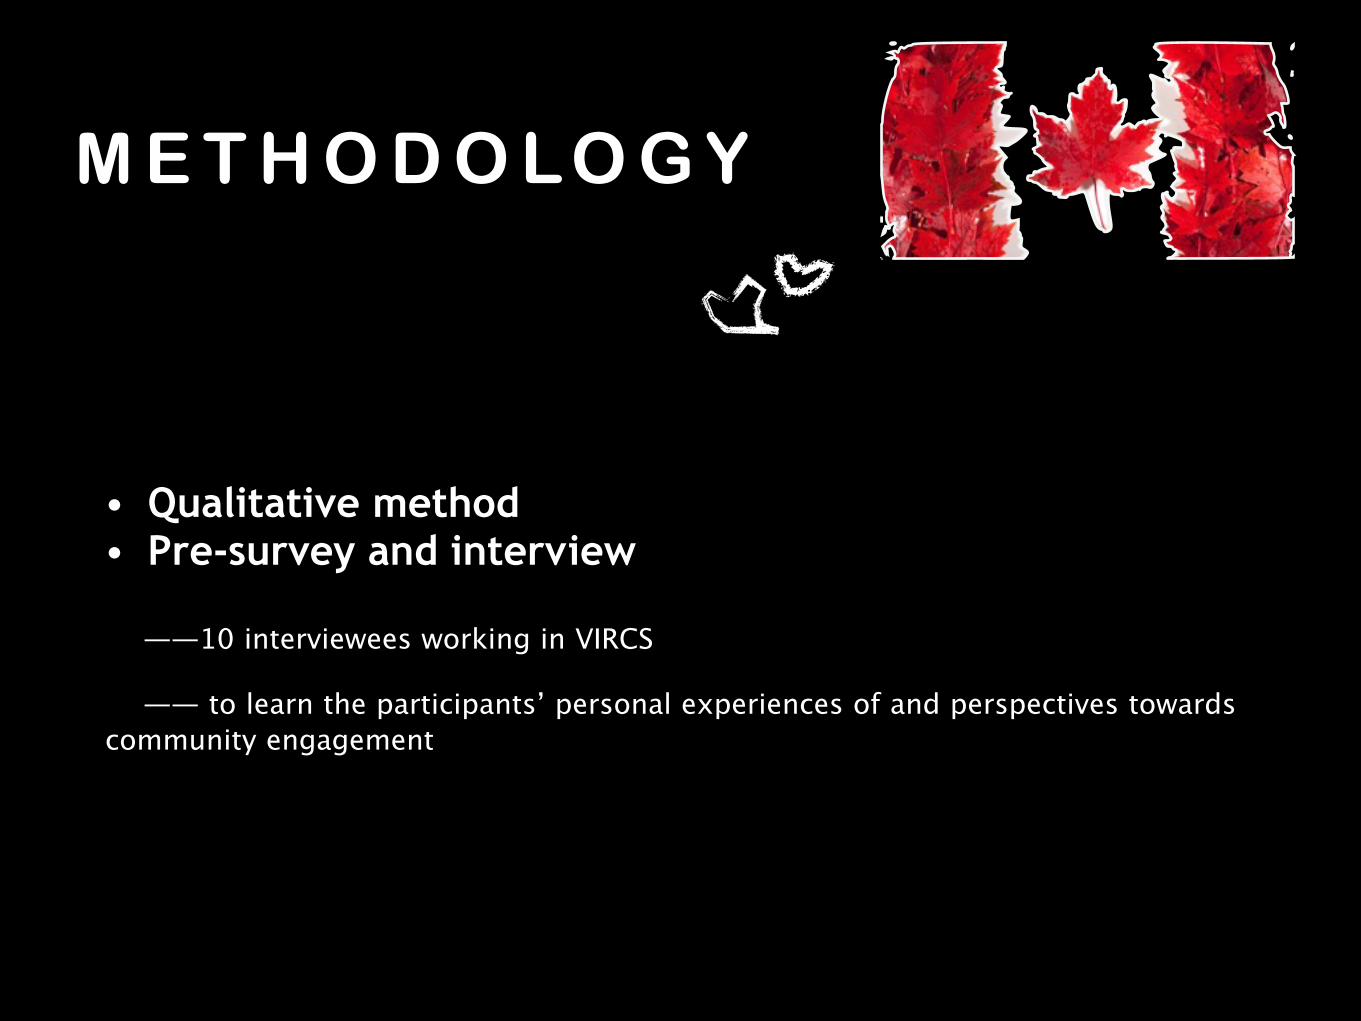
• Qualitative method • Pre-survey and interview
——10 interviewees working in VIRCS
—— to learn the participants’ personal experiences of and perspectives towards community engagement
M E T H O D O LO G Y
Gender
Marriage Status
Original Nationality
Year of Birth
PRE-SURVEY
4
6
Male
Female
2
1
1
11
1
3
India
Mexico
Malaysia
Uganda
ElSalvador
Somali
China
3
3
2
11 1950s
1960s
1970s
1980s
Blank
5
3
2
0
Married
Single
Other
Blank
Occupation Time spent in Canada
Number of Canadian friendsTime spent in Greater Victoria
PRE-SURVEY
11
8
0
Student
Employer
Employee
Other
3
4
0
1
20-9years
10-19years
20-29years
30-39yeats
40-49yeats
3
4
2
01 0-9years
10-19years
20-29years
30-39yeats
40-49yeats
20
1
7
Lessthan5
Between5and10
Between10and20
Morethan20
Types of community activities interviewees have participated in
PRE-SURVEY
0
2
4
6
8
10
12Fes+valceleb
ra+o
nVo
+ng
Volunteerin
gNeighbo
urho
od
Religiousac+vity
Parade
Re
crea+o
nalac+vity
Dona+o
nPo
li+calac+vity
Privatepar+es
Inform
also
cial
Socialengagem
ent
Other
Numberofpar+cipants
Total
Activities interviewees want to participate but could not find in Greater Victoria
PRE-SURVEY
1
1
1
7
BridgeCard
Hun/ng
Concert
Blank
Main reasons for participating in the activities
PRE-SURVEY
0
2
4
6
8
10
12
Interes.ngac.vity
Culturala8rac.on
Relaxing
Environmentalsimilarityto
Curiosity
Mee.ngfriends
Makingnewfriends
Other
Numberofpar.cipants
Total
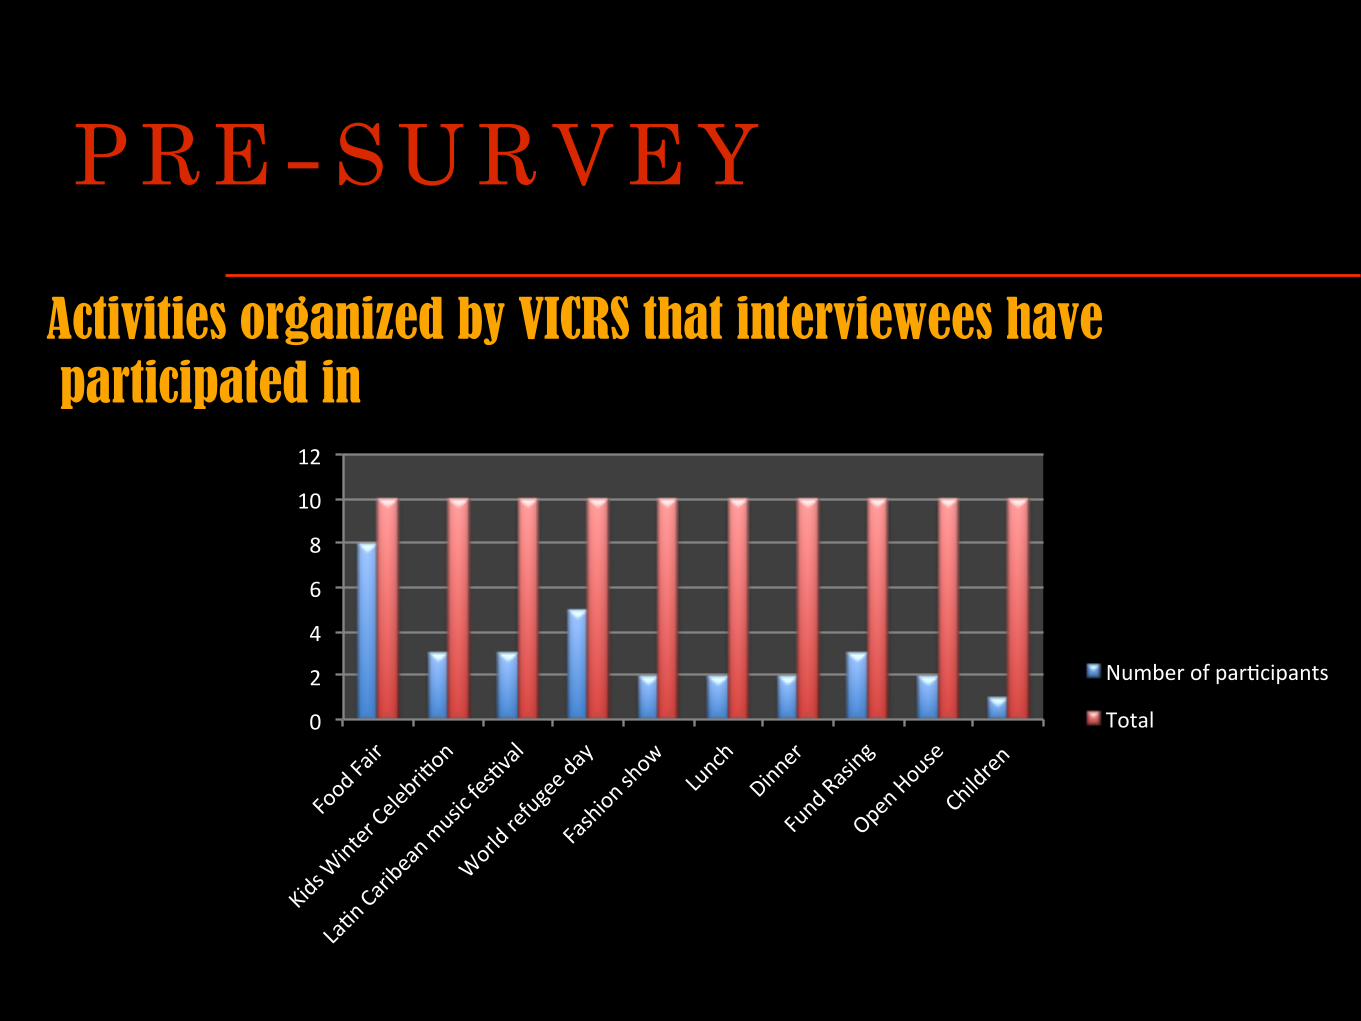
Activities organized by VICRS that interviewees have participated in
PRE-SURVEY
0
2
4
6
8
10
12
FoodFair
KidsW
interCelebri7on
La7nCaribeanm
usicfes7
val
Worldrefugeeday
Fashionshow
Lunch
Dinner
FundRasing
OpenHouse
Children
Numberofpar7cipants
Total
F I N D I N G S
• During the different PROCESSES of CULTURAL ADAPTATION,
reasons for individuals to participate in activities are different.
The cultural adaptation process includes enculturation,
acculturation, and deculturation)Chuang, 2004, p. 59(.
Acculturation: “The process of acculturation involves acquiring the elements and cultural patterns of a new host culture" (Chuang, 2004, p. 59)
T H E O RY A N D K E Y C O N C E P T S
VOLUNTEERING: “I think I need to support the community. That is your duty as a
citizen to be in contribution to your community.” ——Jennifer
“It was my way to get into the environment, and to get a job, too.”
——Yiura.
RELIGIOUS ACTIVITY: “Though I am not a Christian, I go to church to help them prepare the
parties or something else. Besides, I can make some new friends and
learn something new. “ ——Junnian
“I am Christian, I am following Jesus, I don’t care about the
denomination, I just Jesus, that’s it, the only one.” ——Yiura
For example…
F I N D I N G S
•There are ACTIVE and PASSIVE approaches to cultural adaptation
Melting Pot:"each group lost its uniqueness quickly, but all
contributed something to the flavor of the whole" ) Leeds-Hurwitz,
2002, p. 69(.
Salad bowl : "each ethnic group retains all of its unique
characteristics,even when physically located next to groups with
differences" ) Leeds-Hurwitz, 2002, p. 69(.
T H E O RY A N D K E Y C O N C E P T S
Active approach “I participated these activities because I want to do something for the
community. The community needs it. And I live in Canada now. I
would like Canadians to know how’s the diversity, how we can mingle
with them, what value we can ask them to come and join us..” ——Kamal
Passive approach “You can’t live in isolation, so you have to be part of the large
community as well.” ——Amarjit
For example…
AC T I V I T I E S E T H I N I C I T Y I N T E RV I E W E EA P P R OAC H T O A DA P TAT I O N
DONAT ION CH INA EM I LY ACT IVE
FEST IVAL
CELEBRAT ION CH INA EM I LY ACT IVE
FEST IVAL
CELEBRAT ION I ND IA KAMAL ACT IVE
FEST IVAL
CELEBRAT ION EL SALVADOR ALVARO ACT IVE
FEST IVAL
CELEBRAT ION SOMAL I SHARMARKE ACT IVE
FEST IVAL
CELEBRAT ION I ND IA ARMA J I T PASS IVE
PARADE IND IA KAMAL ACT IVE
PARADE IND IA ARMA J I T ACT IVE
PARADE UGANDA ALFRED ACT IVE
POL IT ICAL
ACT IV I TYSOMAL I SHARMARKE ACT IVE
POL IT ICAL
ACT IV I TYUGANDA ALFRED ACT IVE
POL IT ICAL
ACT IV I TYCH INA JUNN IAN PASS IVE
PR IVATE PART I E S E L SALVADOR ALVARO ACT IVE
PR IVATE PART I E S SOMAL I SHARMARKE ACT IVE
PR IVATE PART I E S MALAYS IA J EN I F F ER ACT IVE
PR IVATE PART I E S MEX ICAN Y IURA ACT IVE
PR IVATE PART I E S CH INA HA IX IA PASS IVE
RECREAT IONAL
ACT IV I TYCH INA HA IX IA ACT IVE
RECREAT IONAL
ACT IV I TYSOMAL I SHARMARKE ACT IVE
RECREAT IONAL
ACT IV I TYMALAYS IA J EN I F F ER ACT IVE
RECREAT IONAL
ACT IV I TYMEX ICAN Y IURA ACT IVE
REL IG IOUS
ACT IV I TYCH INA HA IX IA ACT IVE
AC T I V I T I E S E T H I N I C I T Y I N T E RV I E W E E A P P R OAC H T O A DA P TAT I O N
REL IG IOUS
ACT IV I TYCH INA JUNN IAN ACT IVE
REL IG IOUS
ACT IV I TYIND IA KAMAL ACT IVE
REL IG IOUS
ACT IV I TYIND IA ARMA J I T ACT IVE
REL IG IOUS
ACT IV I TYSOMAL I SHARMARKE ACT IVE
REL IG IOUS
ACT IV I TYUGANDA ALFRED ACT IVE
REL IG IOUS
ACT IV I TYMALAYS IA J EN I F F ER ACT IVE
REL IG IOUS
ACT IV I TYMEX ICAN Y IURA ACT IVE
VOLUNTEER ING CH INA EM I LY ACT IVE
VOLUNTEER ING CH INA HA IX IA ACT IVE
VOLUNTEER ING CH INA JUNN IAN ACT IVE
VOLUNTEER ING IND IA ARMA J I T ACT IVE
VOLUNTEER ING CH INA KAMAL ACT IVE
VOLUNTEER ING EL SALVADOR ALVARO ACT IVE
VOLUNTEER ING SOMAL I SHARMARKE ACT IVE
VOLUNTEER ING UGANDA ALFRED ACT IVE
VOLUNTEER ING MALAYS IA J EN I F F ER ACT IVE
VOLUNTEER ING MEX ICAN Y IURA ACT IVE
VOT ING CH INA EM I LY ACT IVE
VOT ING IND IA KAMAL ACT IVE
VOT ING SOMAL I SHARMARKE ACT IVE
VOT ING UGANDA ALFRED ACT IVE
VOT ING MALAYS IA J EN I F F ER ACT IVE
VOT ING MEX ICAN Y IURA ACT IVE
F I N D I N G S• Activities engagement plays an significant role in CREATING,
MAINTAINING and RECONSTITUTING individual’s cultural
identities.
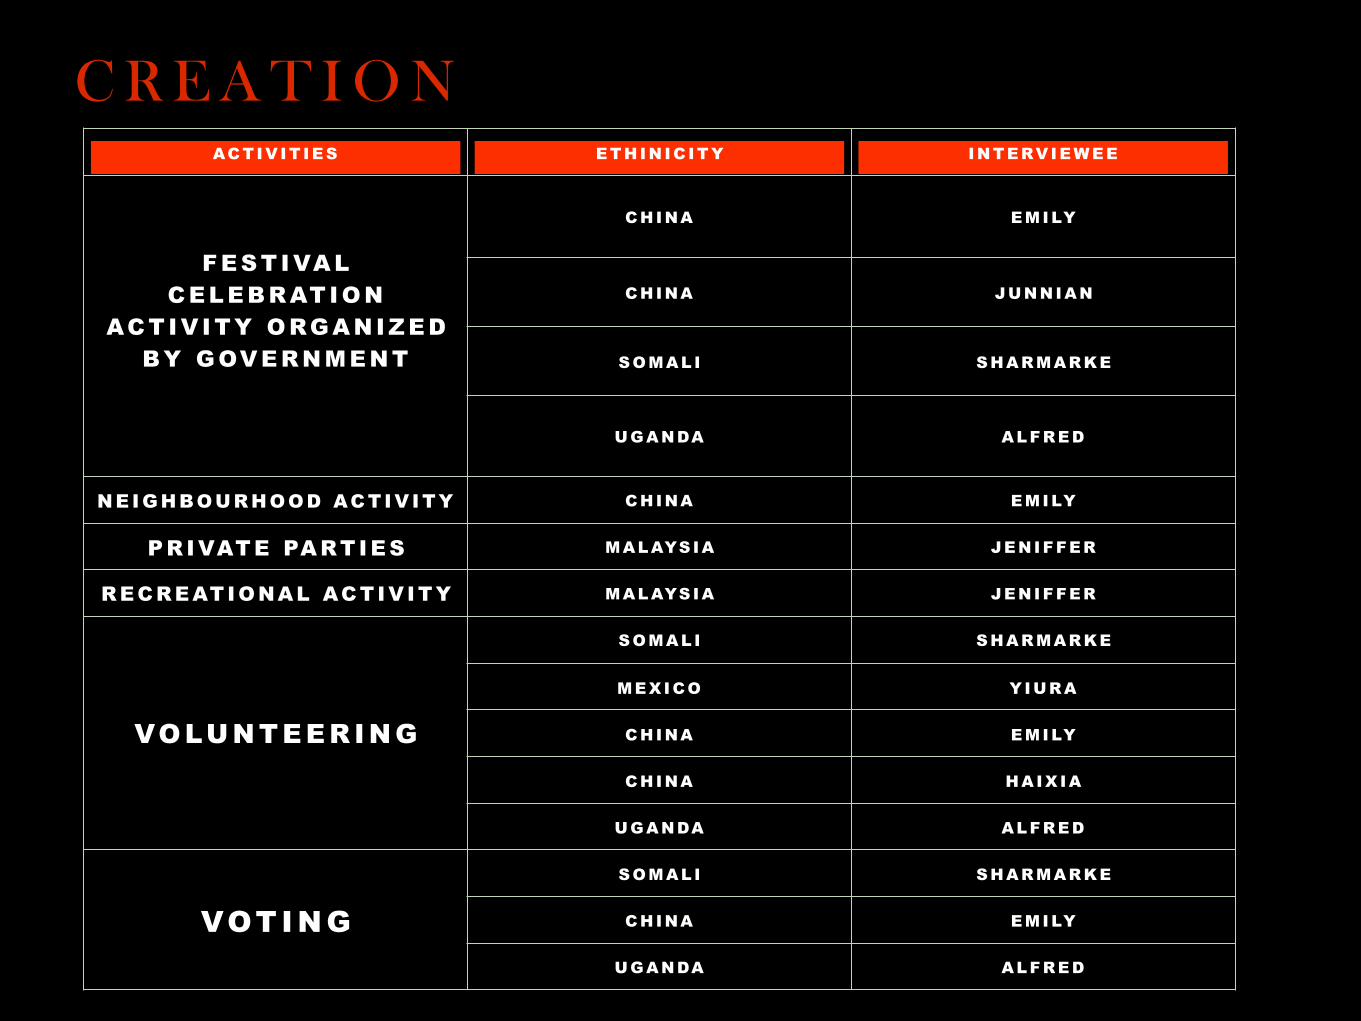
ACTIV IT IES ETHINIC ITY INTERVIEWEE
FESTIVAL CELEBRATION
ACTIV ITY ORGANIZED BY GOVERNMENT
CHINA EMILY
CHINA JUNNIAN
SOMALI SHARMARKE
UGANDA ALFRED
NEIGHBOURHOOD ACTIV ITY CHINA EMILY
PRIVATE PARTIES MALAYSIA JENIFFER
RECREATIONAL ACTIV ITY MALAYSIA JENIFFER
VOLUNTEERING
SOMALI SHARMARKE
MEXICO YIURA
CHINA EMILY
CHINA HAIXIA
UGANDA ALFRED
VOTING
SOMALI SHARMARKE
CHINA EMILY
UGANDA ALFRED
CREAT ION
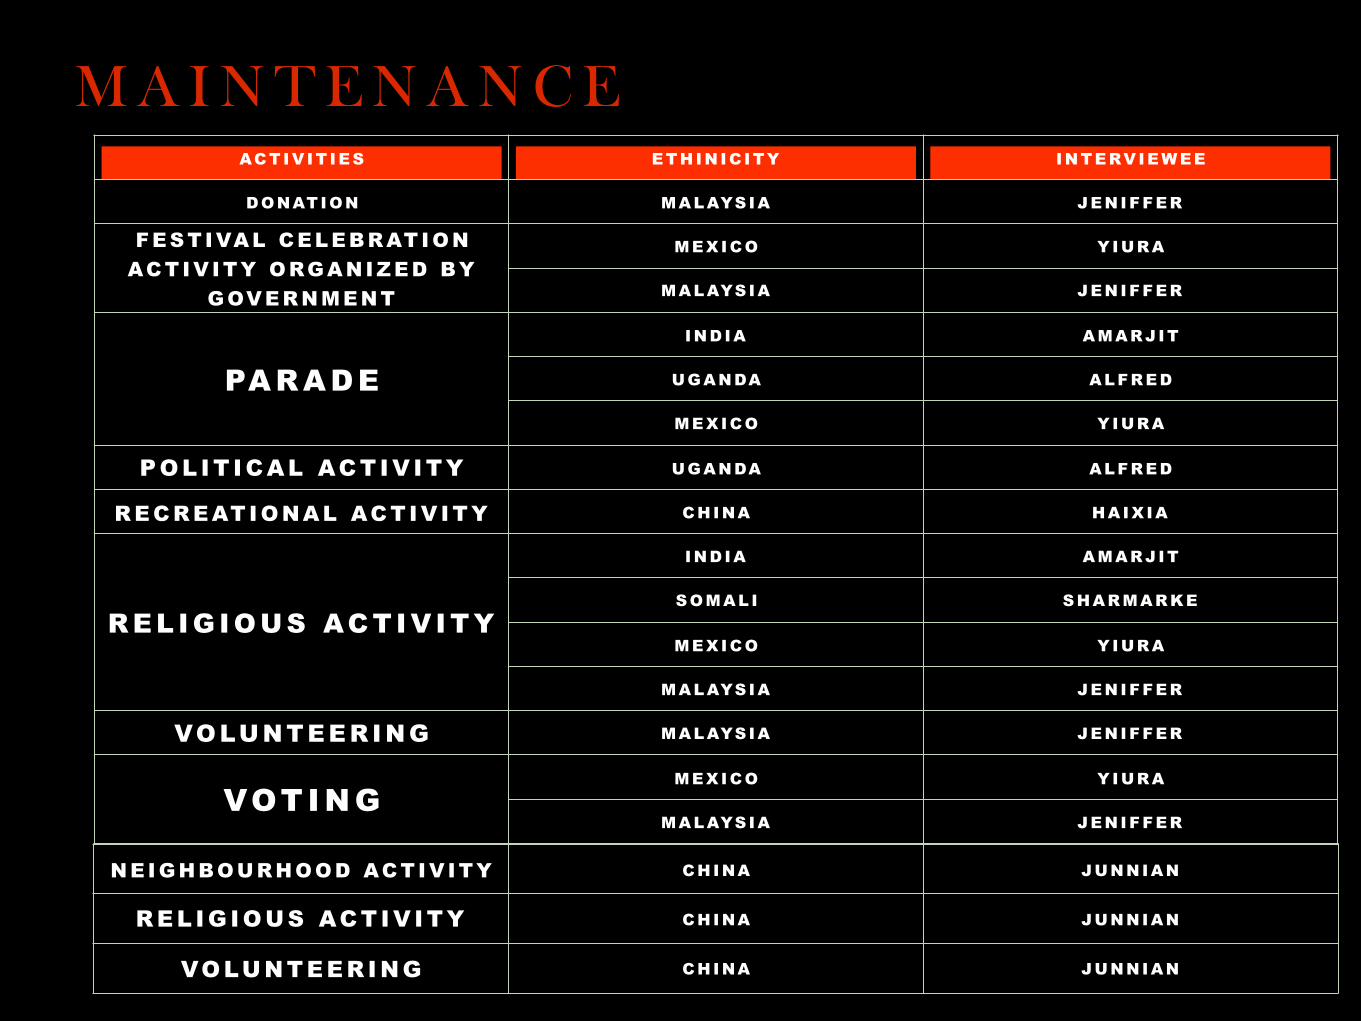
MAINTENANCEACTIV IT IES ETHINIC ITY INTERVIEWEE
DONATION MALAYSIA JENIFFER
FESTIVAL CELEBRATION ACTIV ITY ORGANIZED BY
GOVERNMENT
MEXICO YIURA
MALAYSIA JENIFFER
PARADEINDIA AMARJIT
UGANDA ALFRED
MEXICO YIURA
POLIT ICAL ACTIV ITY UGANDA ALFRED
RECREATIONAL ACTIV ITY CHINA HAIXIA
REL IGIOUS ACTIV ITY
INDIA AMARJIT
SOMALI SHARMARKE
MEXICO YIURA
MALAYSIA JENIFFER
VOLUNTEERING MALAYSIA JENIFFER
VOTINGMEXICO YIURA
MALAYSIA JENIFFER
NEIGHBOURHOOD ACTIV ITY CHINA JUNNIAN
RELIGIOUS ACTIV ITY CHINA JUNNIAN
VOLUNTEERING CHINA JUNNIAN
ACTIV IT IES ETHINIC ITY INTERVIEWEE
FESTIVAL CELEBRATION ACTIV ITY ORGANIZED
BY GOVERNMENT
INDIA AMARJIT
INDIA KAMAL
EL SALVADOR ALVARO
PARADE INDIA KAMAL
VOLUNTEERING
INDIA AMARJIT
INDIA KAMAL
EL SALVADOR ALVARO
REL IGIOUS ACTIV ITY
CHINA HAIXIA
INDIA KAMAL
UGANDA ALFRED
PRIVATE PARTIES
CHINA HAIXIA
EL SALVADOR ALVARO
SOMALI SHARMARKE
RECREATIONAL ACTIV ITY SOMALI SHARMARKE
RECONST ITUT ION
Most interviewees positively involved in voting because they
want to show their Canadian identity.
“I Vote because I am Canadian now. If you were here, you get some rights
and you need some obligations too. But for this part, you feel part of it
this place you are living right now. So how can you decide the
government if you don’t participate. As a citizen, I can show my desire or
my think.” —— Yiura
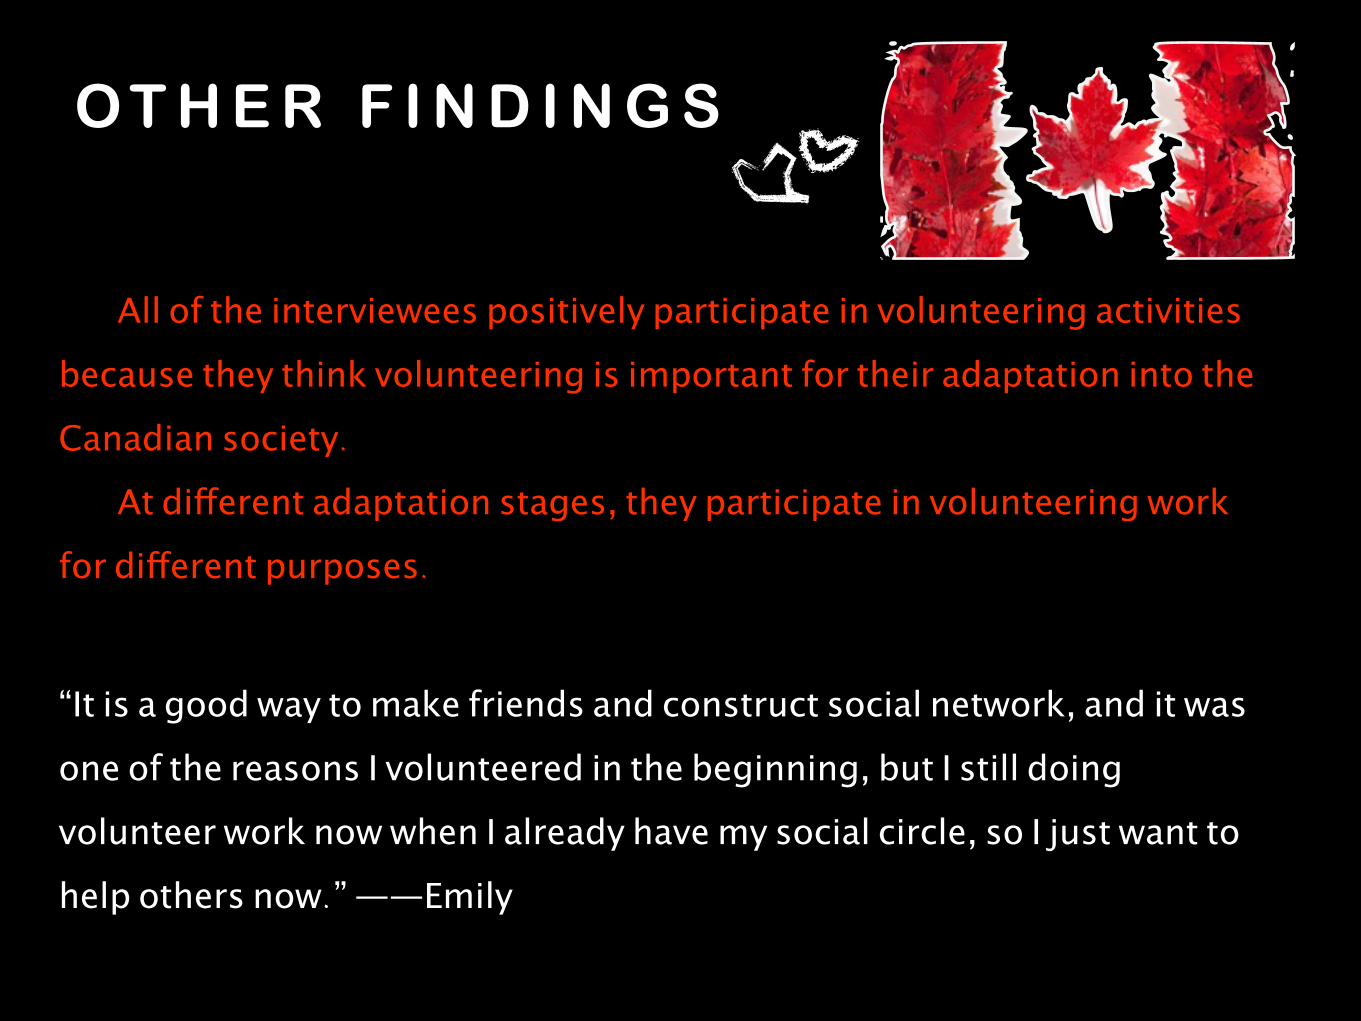
OT H E R F I N D I N G S
All of the interviewees positively participate in volunteering activities
because they think volunteering is important for their adaptation into the
Canadian society.
At different adaptation stages, they participate in volunteering work
for different purposes.
“It is a good way to make friends and construct social network, and it was
one of the reasons I volunteered in the beginning, but I still doing
volunteer work now when I already have my social circle, so I just want to
help others now.” ——Emily
OT H E R F I N D I N G S
Church, temple and other religious places are not only about religious
celebration for the interviewees, but also places to meet friends, exchange information and maintain their own cultural identities.
“Though I am not a Christian, I go to church to help them prepare the
parties or something else. Besides, I can make some new friends and
learn something new.” ——Junnian
“I am Sikh. I go to Sikh temple. All of the religious ceremonies are done
there, even the weddings. I do participate in that, but if there are any
activities in the Hindu temple, in the church, I am invited.”
——Kamal
OT H E R F I N D I N G S
VA L I D I T Y I S S U E A N D S U G G E S T I O N F O R F U T U R E S T U DY
Though data of this field study covered several ethnic backgrounds, the
number for each ethnicity is not big enough.
Future studies of similar topic are suggested to
explore deeper into certain ethnicity.
Future studies are also suggested to explore
deeper into each of the cultural adaptation
processes, eg. for acculturation, the active and
passive cultural adaptation approaches.
I M P L I C AT I O N S
For organizing further community activities, it is important for organizers
to take two elements into consideration:
target groups’ cultural identities and stages of their adaptation to the
host culture.
R E F E R E N C E S
Fong, M. (2004). Multiple dimensions of identity. In F. Mary & C. Rueyling (Eds). Communicating ethnic and cultural identity (pp. 19-34). Lanham, MD: Rowman & Littlefield.
Chuang, R. (2004). Theoretical erspectives: Fluidity and complexity of cultural and ethnic identity. In F. Mary & C. Rueyling (Eds). Communicating ethnic and cultural identity (pp. 51-68). Lanham, MD: Rowman & Littlefield.
Bradford, L., Burrell, N. & Mabry, E. (2004). Negotiating cultural identity: Strategies for belonging. In F. Mary & C. Rueyling (Eds). Communicating ethnic and cultural identity (pp. 313-327). Lanham, MD: Rowman & Littlefield.
Pinkney, J. (2004). A little bit black, but not all the way. In F. Mary & C. Rueyling (Eds). Communicatinthnic and cultural identity (pp. 373-382). Lanham, MD: Rowman & Littlefield.
Leeds-Hurwitz, W. (2009). Social construction of reality. In S. Littlejohn & K. Foss (Eds.), Encyclopedia of communication theory (pp. 891-894). Thousand Oaks, CA: Sage.