7 Rivers Region: An Economic Update September 18, 2014 Economic Indicators and Trends Taggert J. Brooks, Ph.D. UW-La Crosse Economics Department 7 Rivers Equity Index Shane Van Dalsem, Ph.D. UW-La Crosse Finance Department
Transcript
7 Rivers Region: An Economic Update September 18, 2014 Economic Indicators and Trends
Taggert J. Brooks, Ph.D. UW-La Crosse Economics Department
7 Rivers Equity Index
Shane Van Dalsem, Ph.D. UW-La Crosse Finance Department
Economic Indicators September 18, 2014
Economic Indicators Economic Indicators: An Update for the 7 Rivers Region reports on a long-term study of regional economic indicators. The research is ongoing and spans a period of time to enable us to understand and report trends. This project is expected to continuously build on a base of economic information and provide decision makers with valuable tools for strategic planning. The information will also provide a basis for comparison with other regions and a measure of our progress. State Bank Financial sponsors this research project in collaboration with the University of Wisconsin-La Crosse College of Business Administration and the La Crosse Tribune. These programs will continuously build on a base of information and provide decision makers like you with valuable tools for strategic planning. Specific goals of this project are:
• Support business owners in their business decisions by gathering key local economic indicators and trend information.
• Develop specific economic indicators for this region that are not readily available to decision makers.
• Develop tools to assess our progress in economic growth. Prepare baseline measures that will allow comparison with other regions and measure future progress of the region.
• Track the region’s participation in the “new economy” and development in the high tech arena. • Bring professionals together with business owners for discussion about the local economy and
related critical issues. • Create a business recruitment and retention tool by publishing the information.
Core economic indicators cover the following areas: • Employment • Income • Cost of Living • Consumer Attitude and Behavior • Real Estate and Housing • Interest Rates • Equity Performance
Sponsored by:
Economic Indicators September 18, 2014
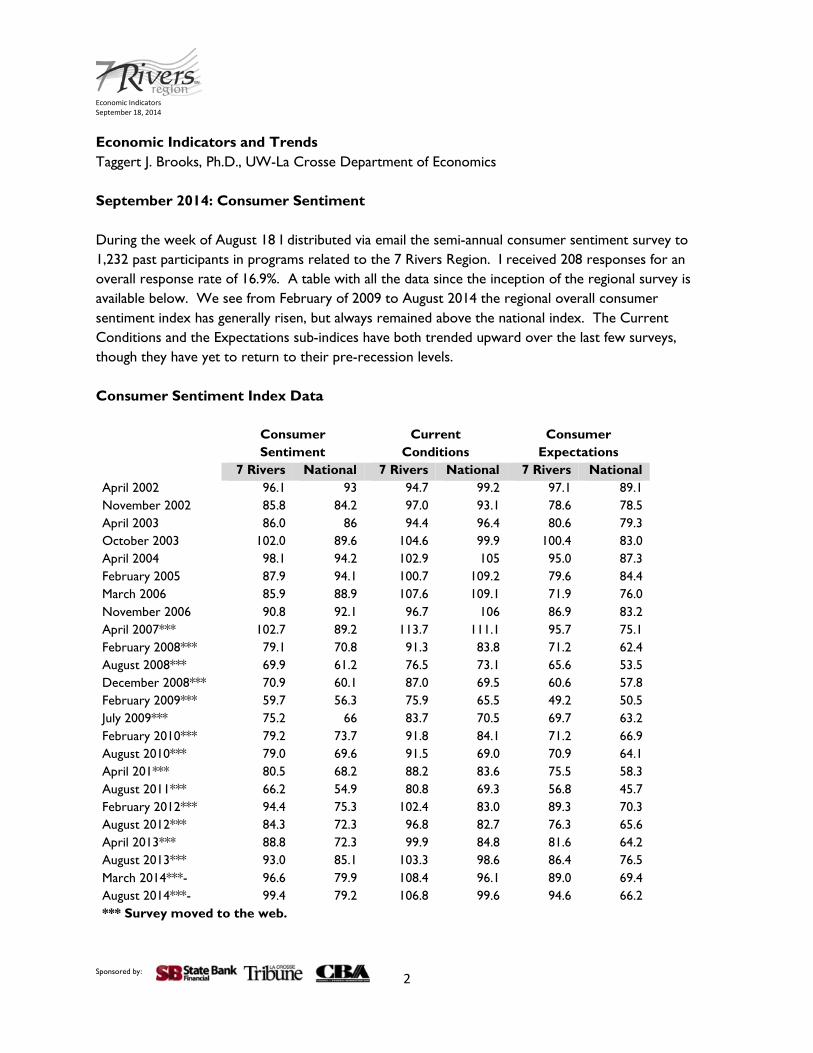
Economic Indicators and Trends Taggert J. Brooks, Ph.D., UW-La Crosse Department of Economics September 2014: Consumer Sentiment During the week of August 18 I distributed via email the semi-annual consumer sentiment survey to 1,232 past participants in programs related to the 7 Rivers Region. I received 208 responses for an overall response rate of 16.9%. A table with all the data since the inception of the regional survey is available below. We see from February of 2009 to August 2014 the regional overall consumer sentiment index has generally risen, but always remained above the national index. The Current Conditions and the Expectations sub-indices have both trended upward over the last few surveys, though they have yet to return to their pre-recession levels. Consumer Sentiment Index Data
Consumer Sentiment
Current Conditions
Consumer Expectations
7 Rivers National 7 Rivers National 7 Rivers National
April 2002 96.1 93 94.7 99.2 97.1 89.1 November 2002 85.8 84.2 97.0 93.1 78.6 78.5 April 2003 86.0 86 94.4 96.4 80.6 79.3 October 2003 102.0 89.6 104.6 99.9 100.4 83.0 April 2004 98.1 94.2 102.9 105 95.0 87.3 February 2005 87.9 94.1 100.7 109.2 79.6 84.4 March 2006 85.9 88.9 107.6 109.1 71.9 76.0 November 2006 90.8 92.1 96.7 106 86.9 83.2 April 2007*** 102.7 89.2 113.7 111.1 95.7 75.1 February 2008*** 79.1 70.8 91.3 83.8 71.2 62.4 August 2008*** 69.9 61.2 76.5 73.1 65.6 53.5 December 2008*** 70.9 60.1 87.0 69.5 60.6 57.8 February 2009*** 59.7 56.3 75.9 65.5 49.2 50.5 July 2009*** 75.2 66 83.7 70.5 69.7 63.2 February 2010*** 79.2 73.7 91.8 84.1 71.2 66.9 August 2010*** 79.0 69.6 91.5 69.0 70.9 64.1 April 201*** 80.5 68.2 88.2 83.6 75.5 58.3 August 2011*** 66.2 54.9 80.8 69.3 56.8 45.7 February 2012*** 94.4 75.3 102.4 83.0 89.3 70.3 August 2012*** 84.3 72.3 96.8 82.7 76.3 65.6 April 2013*** 88.8 72.3 99.9 84.8 81.6 64.2 August 2013*** 93.0 85.1 103.3 98.6 86.4 76.5 March 2014***- 96.6 79.9 108.4 96.1 89.0 69.4 August 2014***- 99.4 79.2 106.8 99.6 94.6 66.2 *** Survey moved to the web.
Sponsored by: 2
Economic Indicators September 18, 2014
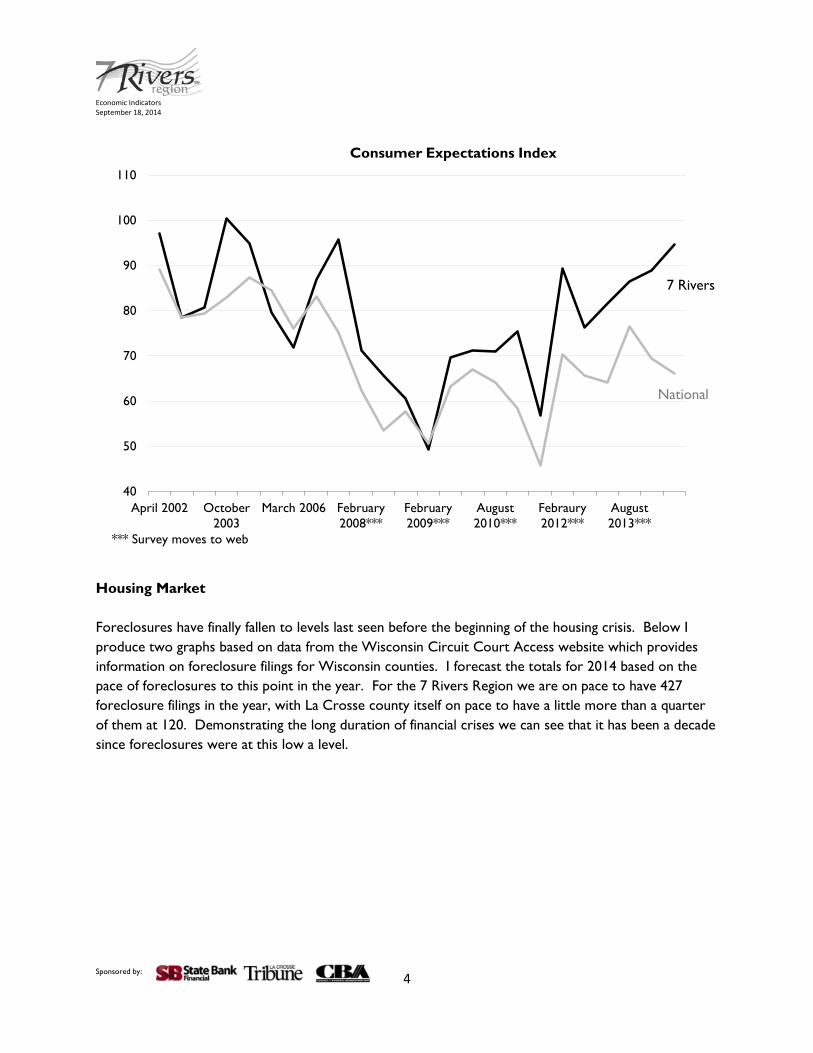
The major source of deviation between the national consumer sentiment index and the regional consumer sentiment index is largely due to the differences in expectations. Both track each other fairly well on current conditions, but whereas the national index shows a retrenchment in consumer expectations the regional index does not show the same pessimism about the future. Some of this may be due to the national slowdown in the housing recovery.
40
50
60
70
80
90
100
110
April 2002 October2003
March 2006 February2008***
February2009***
August2010***
Febraury2012***
August2013***
7 Rivers Consumer Sentiment Index
*** Survey moves to web
7 Rivers
National
Sponsored by: 3
Economic Indicators September 18, 2014
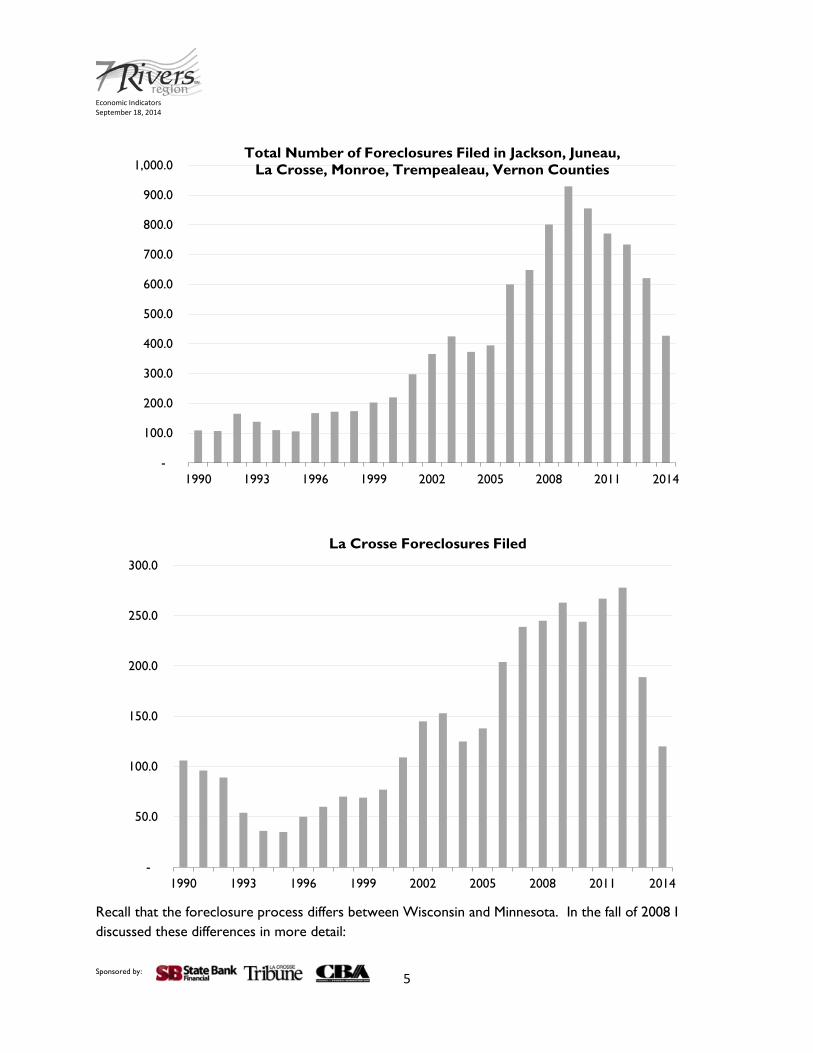
Housing Market Foreclosures have finally fallen to levels last seen before the beginning of the housing crisis. Below I produce two graphs based on data from the Wisconsin Circuit Court Access website which provides information on foreclosure filings for Wisconsin counties. I forecast the totals for 2014 based on the pace of foreclosures to this point in the year. For the 7 Rivers Region we are on pace to have 427 foreclosure filings in the year, with La Crosse county itself on pace to have a little more than a quarter of them at 120. Demonstrating the long duration of financial crises we can see that it has been a decade since foreclosures were at this low a level.
40
50
60
70
80
90
100
110
April 2002 October2003
March 2006 February2008***
February2009***
August2010***
Febraury2012***
August2013***
Consumer Expectations Index
National
7 Rivers
*** Survey moves to web
Sponsored by: 4
Economic Indicators September 18, 2014
Recall that the foreclosure process differs between Wisconsin and Minnesota. In the fall of 2008 I discussed these differences in more detail:
-
100.0
200.0
300.0
400.0
500.0
600.0
700.0
800.0
900.0
1,000.0
1990 1993 1996 1999 2002 2005 2008 2011 2014
Total Number of Foreclosures Filed in Jackson, Juneau, La Crosse, Monroe, Trempealeau, Vernon Counties
-
50.0
100.0
150.0
200.0
250.0
300.0
1990 1993 1996 1999 2002 2005 2008 2011 2014
La Crosse Foreclosures Filed
Sponsored by: 5
Economic Indicators September 18, 2014
A foreclosure is not a discrete event, but rather a process which begins with the borrower failing to pay their mortgage on time and it can end when the borrower becomes current on the loan, or the property is finally sold and the borrower is forced to vacate the premises and forfeit title. It is important to understand this process because if we want to track and measure foreclosure activity we must find a point in the process to consistently and accurately capture the number of properties in the process. Keeping in mind that our purpose in counting the number of properties caught in this process is to measure the number of people in financial stress, and to capture the number of properties that might be on the market, further effecting home prices.
In Wisconsin all foreclosures proceedings must be filed with a judge. This allows us through the open records law, and the Wisconsin Circuit Court Access1 to track the number of foreclosures filed. There are a few problems with this data, it sometimes includes commercial properties, and sometimes includes duplicate filings, but those errors are likely to be very small.
The problem with trying to do the same in Minnesota is that foreclosures do not have to be filed with a judge, in fact most are not. Most foreclosures are merely advertised by an attorney for the mortgage holder in the local newspaper. But even if they were filed with a judge, Minnesota does not allow the same kind of easy web access to court records as Wisconsin, so we would be unable to count them. The timeline below comes from the report on foreclosures by HousingLink2. It describes the Minnesota process for foreclosure by advertisement, which is the method for a majority of foreclosures.
Given this shortcoming HousingLink has been working to maintain a consistent database. Below we find that data reproduced for Winona and Houston Counties. In 2006 both counties reported there were a total of 53 Sheriff Sales, while 2013 saw 66 down from the peak of 135 in 2012. While 2014 data is not yet available, if the trend continues 2014 should see the lowest number of sales since they began tracking the data.
1 Wisconsin Court System Circuit Court Access, http://wcca.wicourts.gov/ 2 http://www.housinglink.org/adobe/reports/MinnesotaForeclosureReport_final042808.pdf accessed on August 24, 2008. Updates here: HousingLink, http://www.housinglink.org/Research/ForeclosureResearch.aspx Sponsored by: 6
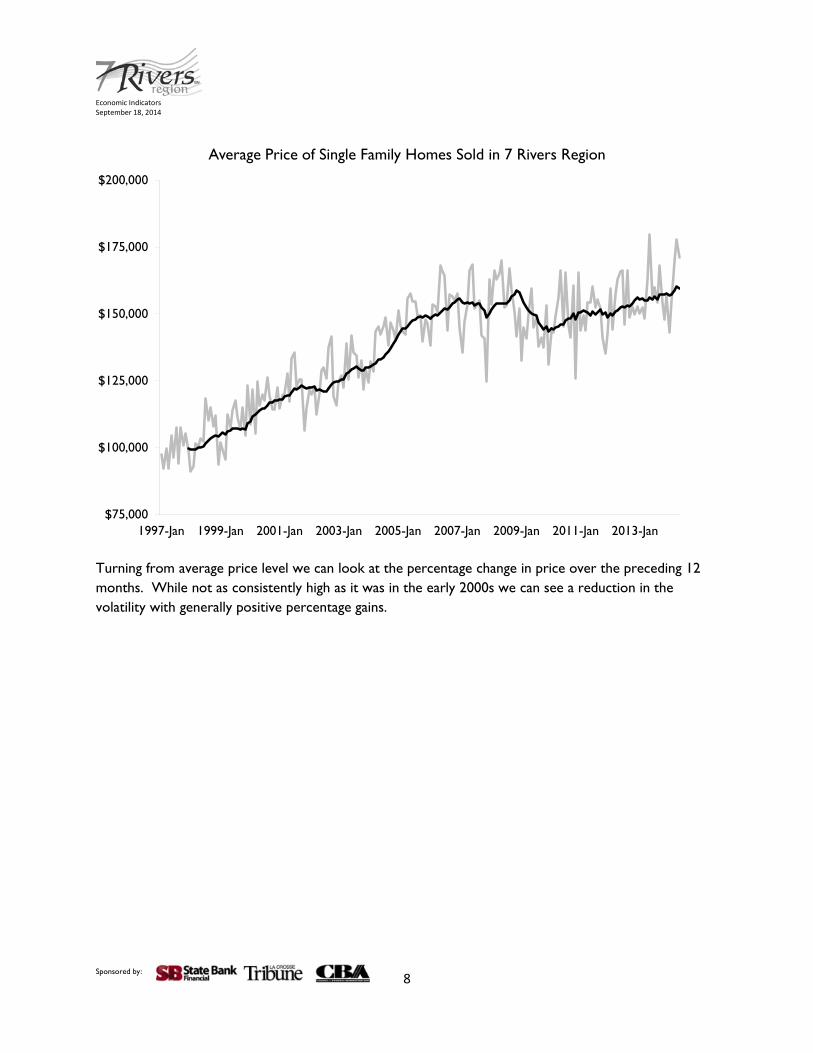
Part of the improvements is not only due to continued job growth in the region, but also home price appreciation. Using MLS data for homes sold in the region we find that the average selling price for a home in the 7 Rivers Region was $178,000. This is the highest value we have seen and has helped to bring the 12-month moving average above the pre-recession level. Recall that this data includes sales of homes in Winona and Houston that are listed with the Wisconsin MLS. While the coverage is not 100%, it is likely a sufficient number to infer the price trends in the region.
0
20
40
60
80
100
120
140
160
2006 2007 2008 2009 2010 2011 2012 2013
Foreclosures: Sheriff Sales in Winona and Houston Counties
Sponsored by: 7
Economic Indicators September 18, 2014
Turning from average price level we can look at the percentage change in price over the preceding 12 months. While not as consistently high as it was in the early 2000s we can see a reduction in the volatility with generally positive percentage gains.
Average Price of Single Family Homes Sold in 7 Rivers Region
Sponsored by: 8
Economic Indicators September 18, 2014
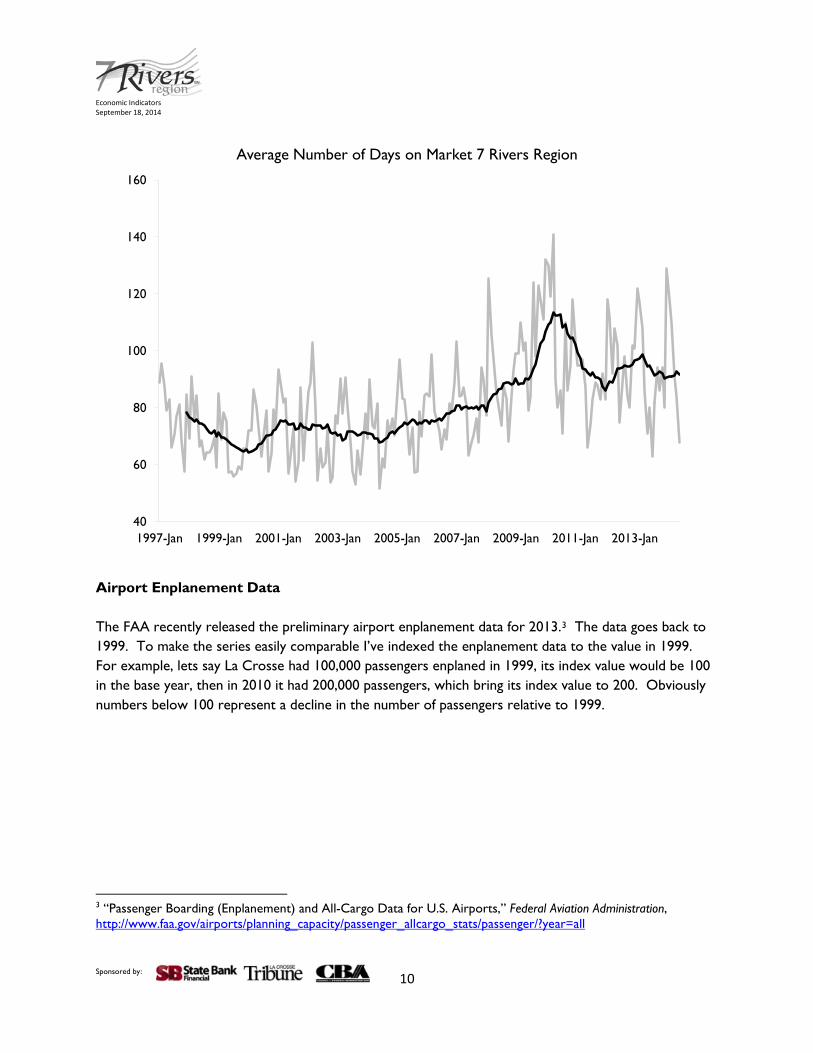
The final housing market indicator to consider for the region is the number of days on the market. Here we can see that although highly seasonal, the average number of days on the market has trended lower than the peak in 2010. Although it is still taking time to sell homes relative to the pre-crisis era.
7 Rivers Region Percentage Increase in Selling Price for Previous 12 months
Sponsored by: 9
Economic Indicators September 18, 2014
Airport Enplanement Data The FAA recently released the preliminary airport enplanement data for 2013.3 The data goes back to 1999. To make the series easily comparable I’ve indexed the enplanement data to the value in 1999. For example, lets say La Crosse had 100,000 passengers enplaned in 1999, its index value would be 100 in the base year, then in 2010 it had 200,000 passengers, which bring its index value to 200. Obviously numbers below 100 represent a decline in the number of passengers relative to 1999.
3 “Passenger Boarding (Enplanement) and All-Cargo Data for U.S. Airports,” Federal Aviation Administration, http://www.faa.gov/airports/planning_capacity/passenger_allcargo_stats/passenger/?year=all
We can see that a few of the regional airports have lost passengers over the last 14 years, with La Crosse (LSE), Central Wisconsin (CWA) and Rochester (RST) all experiencing passenger levels below that of 1999. Rochester has experienced the largest decline followed by La Crosse. Eau Claire (EAU) and Madison (MSN) have picked up passengers since 1999.
Sponsored by: 11
Economic Indicators September 18, 2014
Below we have the total data for the U.S. Domestic Revenue Passenger Enplanements. The shape of the cyclical pattern is similar to that of the MSP airport save for the fact that the US contraction in air travel occurred around 2008, whereas MSP experienced a decline beginning in 2005.4
Another travel metric to watch is the load factor. If you’ve flown in the last few years you have no doubt noticed that the airlines are using their capital more intensely, by increase the load of passengers per flight. In 2002 flights had 70% load factors, but now they are consistently in the mid 80’s. This has allowed some of the airlines to improve their balance sheets as they increase revenues.
4 “Load Factor (passenger-miles as a proportion of available seat-miles in percent (%)) All Carriers – All Airports,” Research and Innovation Technology Administration Bureau of Transportation Statistics, http://www.transtats.bts.gov/Data_Elements.aspx?Data=5
25,000
35,000
45,000
55,000
65,000
75,000
Jan 1996 Jan 1999 Jan 2002 Jan 2005 Jan 2008 Jan 2011 Jan 2014
Part of this increase in flying may have come at the cost of driving. Below we have the latest release from the department of transportation.5
5 “Traffic Volume Trends,” U.S. Department of Transportation Federal Highway Administration, http://www.fhwa.dot.gov/policyinformation/travel_monitoring/tvt.cfm
Minimum Wage The La Crosse County Board recently approved Resolution NO. 25-7/14,6 which places a non-binding referendum on the November ballot to raise the county’s minimum wage to $10.10 per hour from the current federally-mandated minimum of $7.25 per hour. La Crosse is not alone, as Milwaukee, Madison and Eau Claire Counties are among others in the state with the same referendum. Nationally the electorate seems to be fairly supportive of this increase. Pew recently did a poll of Americans asking how likely they would be to vote for a US congressional candidate that supports increasing the minimum wage. The graph below contains their results in the darker color and in the lighter color are the results from the same question asked of the past participants of the breakfast. The question was added to the biannual consumer sentiment index survey. Locally this group is relatively less supportive of voting for someone who supports the idea of raising the minimum wage than the rest of the country. Poll7
6 July 17, 2014 meeting minutes, La Crosse County, http://www.co.la-crosse.wi.us/calendar.asp?View=MeetingView&AppID=1 7 Bruce Drake, “Polls show strong support for minimum wage hike,” Pew Research Center, March 4, 2014, http://www.pewresearch.org/fact-tank/2014/03/04/polls-show-strong-support-for-minimum-wage-hike/
0 20 40 60 80 100
More Likely
Less Likely
No difference
No opnion
If a candidate for US congress supports increasing the minimum wage, would that make you to vote
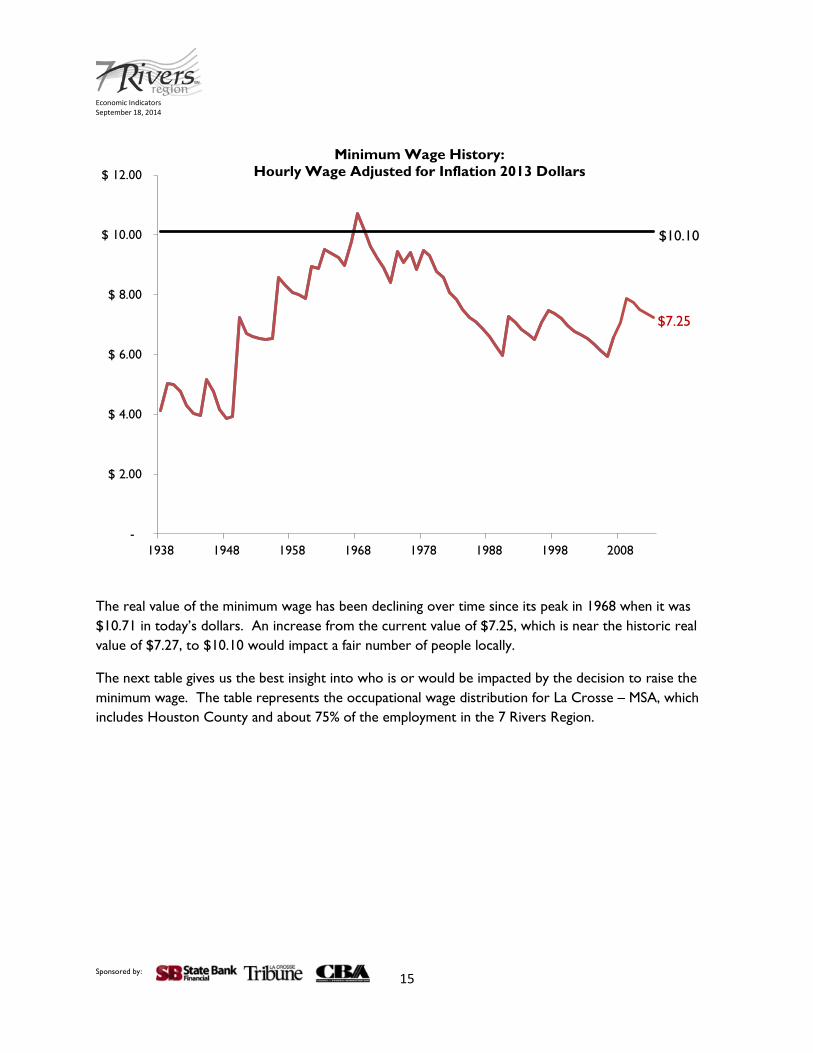
The real value of the minimum wage has been declining over time since its peak in 1968 when it was $10.71 in today’s dollars. An increase from the current value of $7.25, which is near the historic real value of $7.27, to $10.10 would impact a fair number of people locally.
The next table gives us the best insight into who is or would be impacted by the decision to raise the minimum wage. The table represents the occupational wage distribution for La Crosse – MSA, which includes Houston County and about 75% of the employment in the 7 Rivers Region.
-
$ 2.00
$ 4.00
$ 6.00
$ 8.00
$ 10.00
$ 12.00
1938 1948 1958 1968 1978 1988 1998 2008
Minimum Wage History: Hourly Wage Adjusted for Inflation 2013 Dollars
$10.10
$7.25
Sponsored by: 15
Economic Indicators September 18, 2014
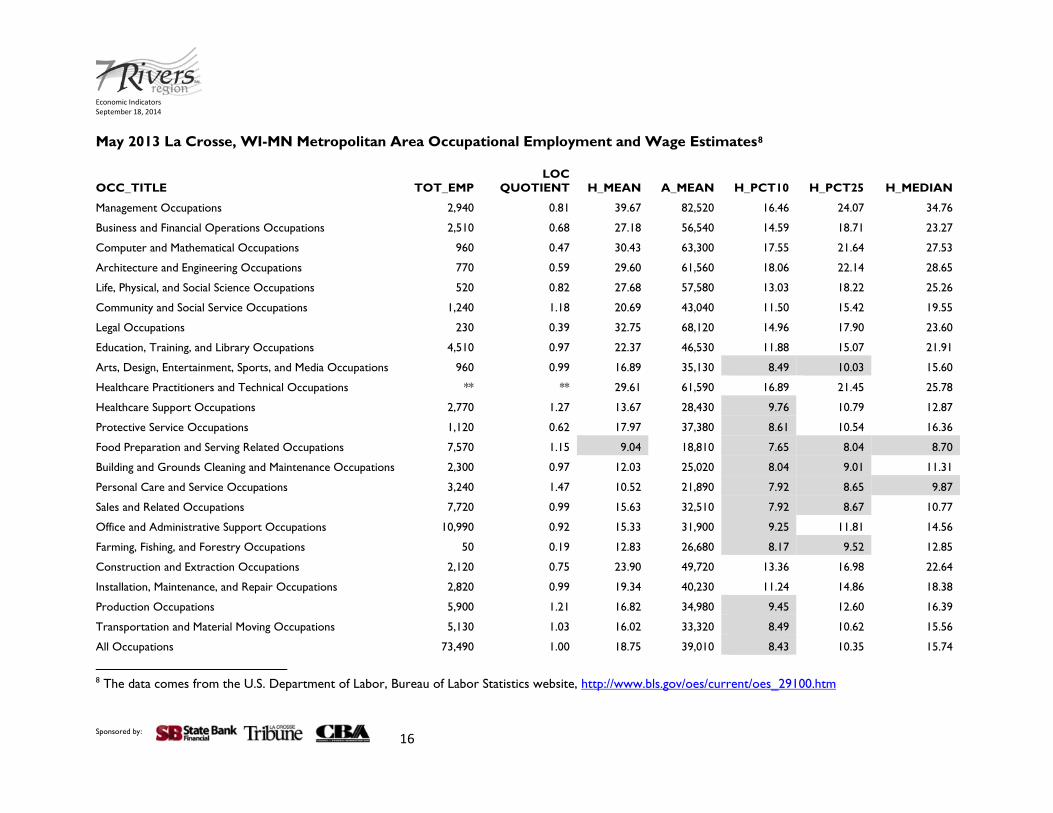
May 2013 La Crosse, WI-MN Metropolitan Area Occupational Employment and Wage Estimates8
The table on the preceding page comes from the Bureau of Labor and Statistics Occupational Employment Statistics. TOT_EMP represents the total employment for all occupations in MSA. The LOC QUOTIENT represents the location quotient, which gives you an idea of the rate of employment in the specific occupation relative to the rate of employment in that occupation for the rest of the country. For example a location quotient of 2 suggests there are 2 times as many people employed in that occupation in that region relative to the proportion of people employed in that occupation in the rest of the country. So if 10% of the country was in production occupations and our location quotient was 2 it would mean we had 20% of our local employment in production occupations. Our location quotient is not quite that high, but it is greater than 1 for production occupation, demonstrating yet again the greater local reliance on manufacturing. H_MEAN represents the hourly mean wage for that occupation while A_MEAN represents the annual mean wage for that occupation. I’ve also included the lower tail of the distribution so you can see which occupations are most likely to be impacted by an increase in the minimum wage. Only one occupation has a mean hourly wage below the new proposed minimum, and two have median wages below the new minimum. This means half of the workers in the Food Prep and Personal Care occupations currently work for less than $10.10 per hour. Of the 22 major occupation groups, 12 of them have at least 10% of their workers earning below the potentially new minimum wage. Six occupations have fully 25% of their workers currently earning an hourly rate below the proposed minimum. Looking at the total workforce approximately just under 25% of the workers are below the proposed new minimum wage, whereas less than 5% are probably currently working at the minimum wage. That means that the new minimum would be binding on an additional 15,000 workers or about 20% of the local workforce. It’s beyond the scope of this update for me to discuss the likely consequences of raising the minimum. I will say that the enormous literature of empirical work that’s been done on minimum wage changes over the years suggests the effects are never as big as the proponents or the opponents suggest. In the end there are lots of margins on which employers can respond even if they do not lower overall employment, they can begin by lowering benefits, reducing hours worked including overtime hours, employing more automation, to raising prices for their outputs, or lowering take home profits. Meanwhile workers can also respond to the increase in hourly wages. Sometimes we see supply effects, through increased labor force participation from teenagers, college students, or the retired, which makes job competition rise.
Sponsored by: 17
Economic Indicators September 18, 2014
APPENDIX
40
50
60
70
80
90
100
110
120
April 2002 October2003
March 2006 February2008***
February2009***
August2010***
Febraury2012***
August2013***
Current Conditions Index
7 Rivers
National
*** Survey moves to web
Sponsored by: 18
Economic Indicators September 18, 2014
Sponsored by: 19
Economic Indicators September 18, 2014
Sponsored by: 20
Economic Indicators September 18, 2014
Sponsored by: 21
Economic Indicators September 18, 2014
Sponsored by: 22
Economic Indicators September 18, 2014
Sponsored by: 23
Economic Indicators September 18, 2014
Sponsored by: 24
Economic Indicators September 18, 2014
Sponsored by: 25
Economic Indicators September 18, 2014
Sponsored by: 26
Economic Indicators September 18, 2014
Sponsored by: 27
Economic Indicators September 18, 2014
Sponsored by: 28
Economic Indicators September 18, 2014
Sponsored by: 29
Economic Indicators September 18, 2014
Sponsored by: 30
Economic Indicators September 18, 2014
Sponsored by: 31
Economic Indicators September 18, 2014
Sponsored by: 32
Economic Indicators September 18, 2014
Sponsored by: 33
Economic Indicators September 18, 2014
Sponsored by: 34
Economic Indicators September 18, 2014
Sponsored by: 35
Economic Indicators September 18, 2014
Seven Rivers Equity Index Update: Strong Index Performance Driven by HMN Financial and Flexsteel; Sears’ Spinoff Adds New Company to the Index Shane Van Dalsem, Ph.D., UW-La Crosse Department of Finance Introduction Tracking of the Seven Rivers Equity Index (SREI) began in 2000 as a way to provide information concerning publicly-traded firms headquartered in the 7 Rivers Region to investors and the business community. The value of the index is that it provides a measure of the economic health of the region as several of the businesses within the index have a significant impact on the region. These firms affect the economy of the region in two important ways. First, ownership of the firms is concentrated at higher levels within the area of the firm’s headquarters due to the stock ownership of the founders, management, and employees of the firm. As stock returns increase, wealth is imported into the region. Second--to the degree at which the firms’ operations occur within the region--profits, cash flows, and investments of the firms are a measure of economic activity and health of the region. This report covers the performance of the index and its components for the past five years (ending August 1, 2014). During this time period, three firms in the index were acquired by firms outside of the region and one firm was added due to moving their headquarters into the region and one was added as a result of a spinoff from its corporate parent. During the most recent year, the index has outperformed both of its benchmarks. In this article, I describe the performance of the index, examine the factors that are driving stock price changes for the individual firms in the index, and detail the spinoff of Lands’ End from Sears Holding Corporation. Construction of the Index and Index Components The SREI consists of the exchange-traded stocks of firms that are headquartered within 100 miles of La Crosse, WI. ReferenceUSA was used to identify the firms that fulfill the criteria to be included in the index. The firms identified using these criteria are as follows: Non-Financial Firms: Fastenal Company Flexsteel Industries, Inc. Hormel Foods Corporation Lands’ End, Inc. Marten Transport Ltd. National Presto Industries, Inc. Spectrum Brands Holding, Inc.
Sponsored by: 36
Economic Indicators September 18, 2014
Financial Services Firms: Citizens Community Bancorp, Inc. Heartland Financial USA, Inc. HMN Financial, Inc.
A brief profile of each of the firms in the index is provided in the Appendix. Of the ten firms that currently make up the index, seven of the firms are traded on the NASDAQ and three are traded on the NYSE. Using Standard and Poors’ guidelines, two of the firms (Fastenal and Hormel) are large-cap firms, one (Spectrum Brands) is a mid-cap firm, one (Lands’ End) is a small-cap firm, and the remaining six are micro-cap firms. In the past three years, three firms (Great Wolf Resorts, Rochester Medical, and Renaissance Learning) exited the index due to being acquired by firms that are headquartered outside of the 7 Rivers Region. Spectrum Brands was added to the index due to the move of its headquarters to within 100 miles of the 54601 ZIP code. Lands’ End was added due it being spun off from Sears Holding Corporation in late March 2014 and retaining its pre-Sears headquarters in Dodgeville, WI. Stock Performance Calculation of Returns The SREI is an equally-weighted index, meaning that it is assumed that an equal dollar amount is invested in each of the stocks at the beginning of the measurement period. The returns for the index were calculated on a monthly basis for a five-year period beginning on August 3, 2009 and ending August 1, 2014. The monthly returns are calculated as the percentage change in the adjusted price on Yahoo! Finance from one month to the next. The adjusted price incorporates cash dividends paid, stock splits, reverse stock splits, and stock dividends into the price of the stock, so the return calculated assumes that any dividends paid were reinvested back into the firm. As a result, the use of the adjusted price provides a measurement of the total return to the investor. Benchmarks For comparison purposes, I chose four benchmarks for the index, two for the total index and two for the financial firms. As mentioned above and shown in the Appendix, the index consists primarily of small firms. Standard benchmarks such as the S&P 500 and Dow Jones Industrial Index consist solely of large-cap firms. Small firms tend to have greater price volatility and higher returns when compared to large firms, so the S&P 500 and Dow Jones Index were not used. The two benchmarks chosen for the total index are the iShares S&P 400 Mid-Cap Exchange Traded Fund (Ticker: IJH) and the iShares Russell Micro-Cap Index (Ticker: IWC). The iShares S&P 400 Mid-Cap Exchange Traded Fund seeks to replicate the returns of the S&P 400 Mid-Cap
Sponsored by: 37
Economic Indicators September 18, 2014
Index and invests a minimum of 90% of its holdings in the underlying securities of the S&P 400 Index. The iShares Russell Micro-Cap Index seeks to replicate the returns of the Russell Micro-Cap Index and currently consists of 1,377 micro-cap exchange-traded firms. The average market capitalization for the firms in the SREI is approximately $3.256 billion, which falls in the mid-cap range of $3 billion to $10 billion. The median market capitalization for firms in the SREI is approximately $560 million, which falls in the micro-cap range of $1 billion or less. The financial services industry is unique from other industries due to its high level of regulation and often divergent responses to market events. As such, firms in this industry are often analyzed separately from firms in other industries. Because of the regional nature of the three financial companies in the index, the benchmarks chosen are funds that hold equities of regional financial institutions. The benchmarks used for this subsection of the index are the iShares Dow Jones Regional Banks Index (Ticker: IAT) and the SPDR KBW Regional Banking Exchange Traded Fund (Ticker: KRE). The iShares Dow Jones Regional Banks Index consists of 57 equities that are representative of the Dow Jones Regional Banks Index. The SPDR KBW Regional Banking Exchange Traded Fund seeks to replicate the returns of the S&P Regional Banks Select Industry Index and currently invests in 82 equities that are representative of that index. Index Performance Table 1 provides the returns for each firm in the SREI, the average and median return for the index components, and the returns for the S&P 400 and micro-cap indices for each of the past five years ending August 1.
Sponsored by: 38
Economic Indicators September 18, 2014
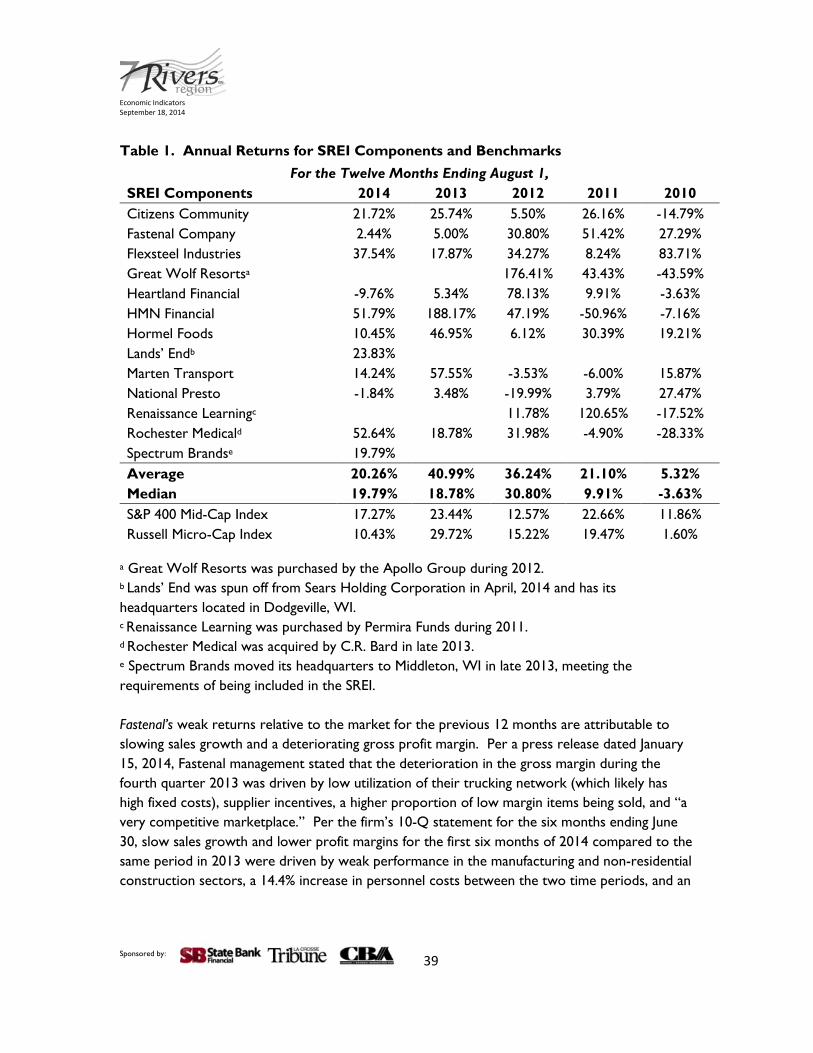
Table 1. Annual Returns for SREI Components and Benchmarks For the Twelve Months Ending August 1,
SREI Components 2014 2013 2012 2011 2010 Citizens Community 21.72% 25.74% 5.50% 26.16% -14.79% Fastenal Company 2.44% 5.00% 30.80% 51.42% 27.29% Flexsteel Industries 37.54% 17.87% 34.27% 8.24% 83.71% Great Wolf Resortsa
Rochester Medicald 52.64% 18.78% 31.98% -4.90% -28.33% Spectrum Brandse 19.79% Average 20.26% 40.99% 36.24% 21.10% 5.32% Median 19.79% 18.78% 30.80% 9.91% -3.63% S&P 400 Mid-Cap Index 17.27% 23.44% 12.57% 22.66% 11.86% Russell Micro-Cap Index 10.43% 29.72% 15.22% 19.47% 1.60%
a Great Wolf Resorts was purchased by the Apollo Group during 2012. b Lands’ End was spun off from Sears Holding Corporation in April, 2014 and has its headquarters located in Dodgeville, WI. c Renaissance Learning was purchased by Permira Funds during 2011. d Rochester Medical was acquired by C.R. Bard in late 2013. e Spectrum Brands moved its headquarters to Middleton, WI in late 2013, meeting the requirements of being included in the SREI. Fastenal’s weak returns relative to the market for the previous 12 months are attributable to slowing sales growth and a deteriorating gross profit margin. Per a press release dated January 15, 2014, Fastenal management stated that the deterioration in the gross margin during the fourth quarter 2013 was driven by low utilization of their trucking network (which likely has high fixed costs), supplier incentives, a higher proportion of low margin items being sold, and “a very competitive marketplace.” Per the firm’s 10-Q statement for the six months ending June 30, slow sales growth and lower profit margins for the first six months of 2014 compared to the same period in 2013 were driven by weak performance in the manufacturing and non-residential construction sectors, a 14.4% increase in personnel costs between the two time periods, and an
Sponsored by: 39
Economic Indicators September 18, 2014
abnormally cold and snowy winter, which not only affected the aforementioned market segments that Fastenal serves, but also increased transportation expenses for Fastenal.9 Flexsteel’s strong return for the more recent twelve months was driven by strong sales growth during that time. The firm’s stock return jumped 24.5% between February 5 and February 11, 2014. This period coincided with the firm’s quarterly earnings announcement and release of their 10-Q statement. The 10-Q reported that the firm’s sales had increased 19% for the quarter over the same period the previous year. Marten Transport’s strong performance for the twelve months ending August 1, 2013 was driven by the highest net income for the firm in its history and improving profit margins. Returns for the most recent twelve months were moderated by deteriorating profit margins due in part to the severe winter storms that hit the Midwest in the most recent winter. On April 16, 2014, a one day price jump of 7.4% coincided with Marten’s quarterly earnings announcement. While earnings per share came in below expectations, Marten’s ability to increase revenue per tractor by 3.9% from the previous year and the recognition that deteriorating profit margins were driven by the increased cost of transportation in severe winter weather elicited a positive response by the market.10 Hormel’s returns have followed a pattern similar to those of Marten Transport over the past two years. Strong returns for the period ending August 1, 2013 were attributed to strong sales growth. Sales growth of 6.1% for the first nine months of 2013 compared to the same period the previous year was driven by the acquisition of the SKIPPY® brand, the additional of sales from Don Miguel Foods Corporation as part a joint venture with MegaMex, and the increased export of SPAM® products. Profit margins were down slightly for the same period due to increased costs in Hormel’s Refrigerated Foods segment. Management of the firm indicated that wider profits margins on SKIPPY products, stable margins on SPAM products, and high margins on value-added products in the firm’s Jennie-O Turkey Stores should mitigate the lower margins of the Refrigerated Foods segment in the future.11 Stock returns for Hormel have fallen for the most recent twelve months due to lower sales growth than expected. A 13.8% year over year drop in sales for the Specialty Foods segment for the six months ending April 27, 2014 was attributed to increased prices to cover higher input costs. The Specialty Foods segment sells shelf stable products primarily to non-retail customers, such as industrial and foodservice companies, hospitals, nursing homes, and
9 Fastenal Company 10-Q dated July 16, 2014. 10 Nickey Friedman, “Why Shares of Marten Transport, Ltd. Are Accelerating Today,” The Motley Fool, April 16, 2014, http://www.fool.com/investing/general/2014/04/16/why-shares-of-marten-transport-ltd-are-acceleratin.aspx 11 Hormel Foods Corporation 10-Q dated September 6, 2013. Sponsored by: 40
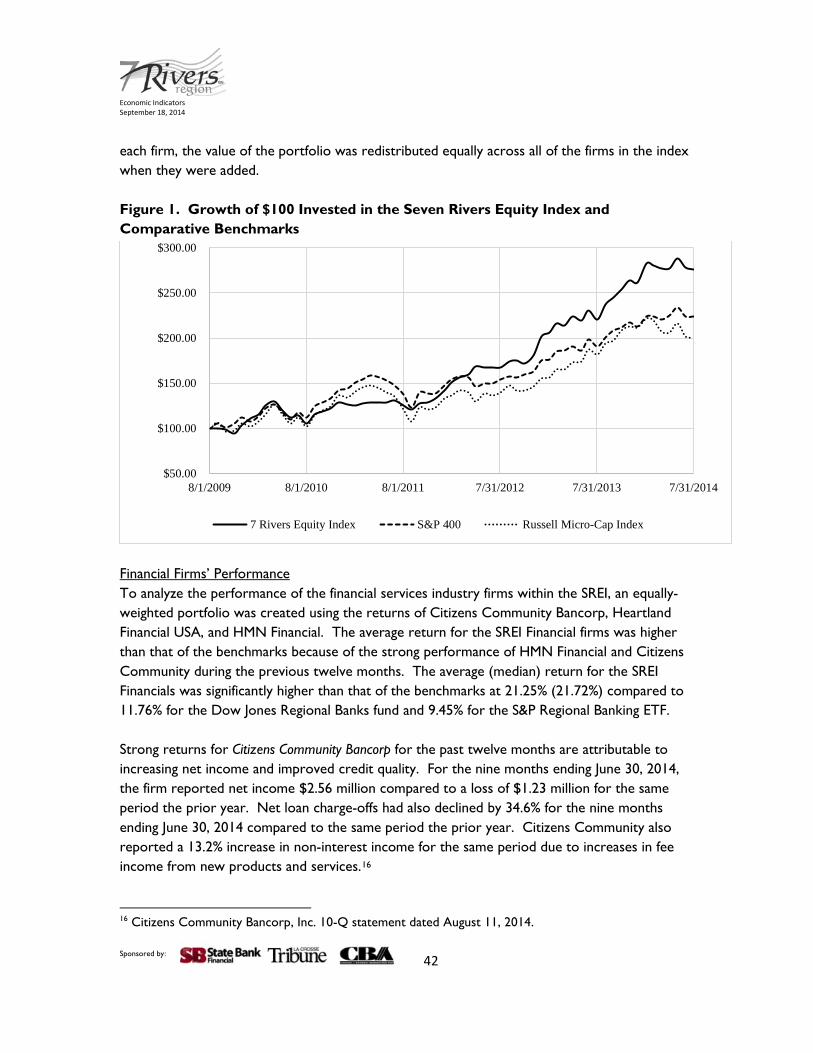
marketers of nutritional products. Management expects that sales growth for the remainder of the year will come from increased growth in SKIPPY sales in China and that the firm will continue to lower administrative costs as a percent of sales.12 National Presto’s negative returns for the past twelve months have been driven by sales and/or operating issues in each of its major segments. Budget cutbacks for the US military has resulted in a decline in sales of cartridge cases. Sales for the firm’s Houseware/Small Appliances division were down 16.33% for the first six months of 2014 compared to the same period in 2013. Management attributed the lower sales this year due to late ordering in 2013 resulting inventory not reaching stores in time for Christmas sales. This has depressed orders from retailers as they had to sell this inventory before making new orders. Sales for the Absorbent Products division were down 7.5% for the first six months of 2014 compared to the same period for 2013. Management attributes the decrease in sales in this division due to a “shift in the segment’s customer base.”13 The significant positive return for Rochester Medical for the most recent 12 months was due to the acquisition of the company by C.R. Bard, which was announced on September 3, 2013 per SEC filings. The $262 million dollar price represented an approximate 45% premium over the market value of the stock at the time of the announcement. Figure 1 shows the growth of $100 invested in the SREI equally across each of the component firms and $100 invested in each of the benchmarks on August 3, 2009 and holding those positions through August 1, 2014.14 The ending value of the SREI was $272.88; for the S&P 400 it was $223.58, and $200.34 for the Russell Micro-Cap Index. The amount of the index invested in Renaissance Learning was equally distributed across the remaining firms as of November 1, 2011 for the calculation of the index value. The amount invested in Great Wolf Resorts was equally distributed across the remaining firms as of May 1, 2012 for the calculation of the index value. The amount invested in Rochester Medical was equally distributed across the remaining firms as of November 1, 2013. Because of its move from east Madison, WI to Middleton, WI in late October 2013, Spectrum Brands was added to the SREI as of November 1, 2013. Because of its spinoff from Sears Holding Corporation in Early April 2014, Lands’ End was added to the SREI as of April 1, 2014.15 With the addition of
12 Hormel Foods Corporation 10-Q dated June 6, 2014. 13 National Presto Industries, Inc. 10-Q dated August 8, 2014. 14 The results in Table 1 differ from the results presented in Figure 1 because the average returns and medians in Table 1 are based on an equal weighting for each twelve month period, while the graph assumes a five-year buy and hold strategy. 15 Lands’ End began limited trading under the symbol “LEDMV” on March 20, 2014 and began trading under the symbol “LE” on April 7, 2014. Sponsored by: 41
Economic Indicators September 18, 2014
each firm, the value of the portfolio was redistributed equally across all of the firms in the index when they were added. Figure 1. Growth of $100 Invested in the Seven Rivers Equity Index and Comparative Benchmarks
Financial Firms’ Performance To analyze the performance of the financial services industry firms within the SREI, an equally-weighted portfolio was created using the returns of Citizens Community Bancorp, Heartland Financial USA, and HMN Financial. The average return for the SREI Financial firms was higher than that of the benchmarks because of the strong performance of HMN Financial and Citizens Community during the previous twelve months. The average (median) return for the SREI Financials was significantly higher than that of the benchmarks at 21.25% (21.72%) compared to 11.76% for the Dow Jones Regional Banks fund and 9.45% for the S&P Regional Banking ETF. Strong returns for Citizens Community Bancorp for the past twelve months are attributable to increasing net income and improved credit quality. For the nine months ending June 30, 2014, the firm reported net income $2.56 million compared to a loss of $1.23 million for the same period the prior year. Net loan charge-offs had also declined by 34.6% for the nine months ending June 30, 2014 compared to the same period the prior year. Citizens Community also reported a 13.2% increase in non-interest income for the same period due to increases in fee income from new products and services.16
16 Citizens Community Bancorp, Inc. 10-Q statement dated August 11, 2014.
7 Rivers Equity Index S&P 400 Russell Micro-Cap Index
Sponsored by: 42
Economic Indicators September 18, 2014
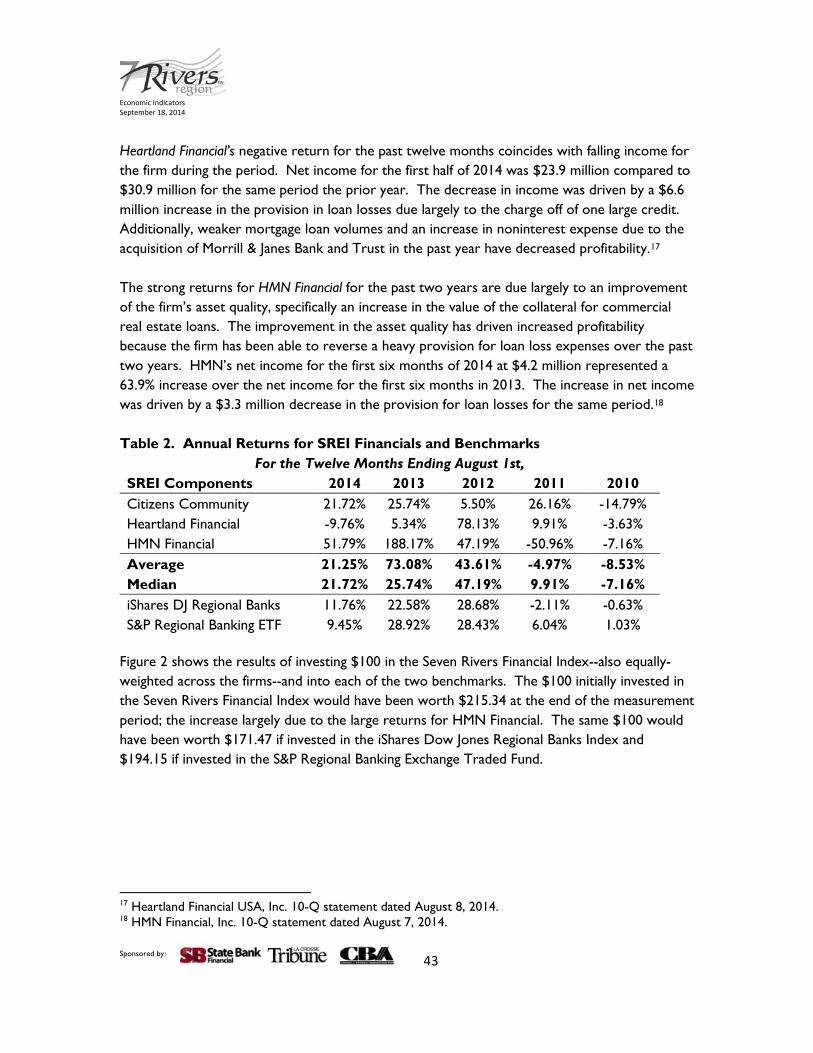
Heartland Financial’s negative return for the past twelve months coincides with falling income for the firm during the period. Net income for the first half of 2014 was $23.9 million compared to $30.9 million for the same period the prior year. The decrease in income was driven by a $6.6 million increase in the provision in loan losses due largely to the charge off of one large credit. Additionally, weaker mortgage loan volumes and an increase in noninterest expense due to the acquisition of Morrill & Janes Bank and Trust in the past year have decreased profitability.17 The strong returns for HMN Financial for the past two years are due largely to an improvement of the firm’s asset quality, specifically an increase in the value of the collateral for commercial real estate loans. The improvement in the asset quality has driven increased profitability because the firm has been able to reverse a heavy provision for loan loss expenses over the past two years. HMN’s net income for the first six months of 2014 at $4.2 million represented a 63.9% increase over the net income for the first six months in 2013. The increase in net income was driven by a $3.3 million decrease in the provision for loan losses for the same period.18 Table 2. Annual Returns for SREI Financials and Benchmarks
For the Twelve Months Ending August 1st, SREI Components 2014 2013 2012 2011 2010 Citizens Community 21.72% 25.74% 5.50% 26.16% -14.79% Heartland Financial -9.76% 5.34% 78.13% 9.91% -3.63% HMN Financial 51.79% 188.17% 47.19% -50.96% -7.16% Average 21.25% 73.08% 43.61% -4.97% -8.53% Median 21.72% 25.74% 47.19% 9.91% -7.16% iShares DJ Regional Banks 11.76% 22.58% 28.68% -2.11% -0.63% S&P Regional Banking ETF 9.45% 28.92% 28.43% 6.04% 1.03%
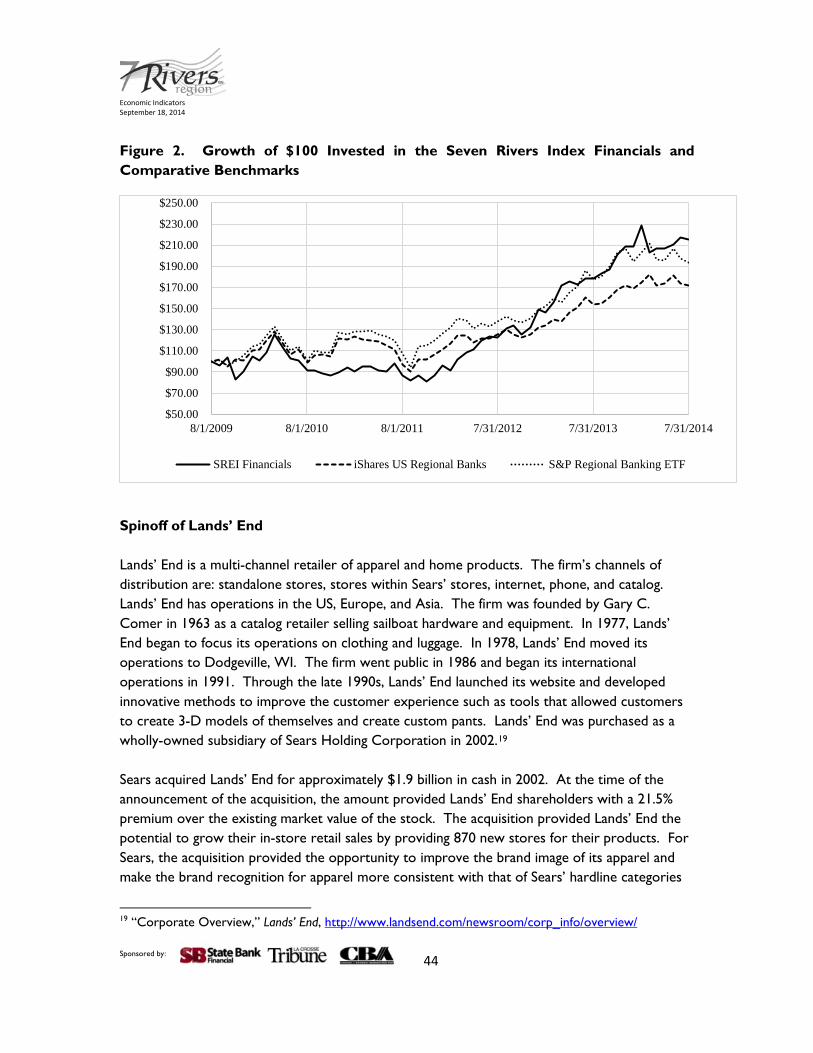
Figure 2 shows the results of investing $100 in the Seven Rivers Financial Index--also equally-weighted across the firms--and into each of the two benchmarks. The $100 initially invested in the Seven Rivers Financial Index would have been worth $215.34 at the end of the measurement period; the increase largely due to the large returns for HMN Financial. The same $100 would have been worth $171.47 if invested in the iShares Dow Jones Regional Banks Index and $194.15 if invested in the S&P Regional Banking Exchange Traded Fund.
17 Heartland Financial USA, Inc. 10-Q statement dated August 8, 2014. 18 HMN Financial, Inc. 10-Q statement dated August 7, 2014. Sponsored by: 43
Economic Indicators September 18, 2014
Figure 2. Growth of $100 Invested in the Seven Rivers Index Financials and Comparative Benchmarks
Spinoff of Lands’ End Lands’ End is a multi-channel retailer of apparel and home products. The firm’s channels of distribution are: standalone stores, stores within Sears’ stores, internet, phone, and catalog. Lands’ End has operations in the US, Europe, and Asia. The firm was founded by Gary C. Comer in 1963 as a catalog retailer selling sailboat hardware and equipment. In 1977, Lands’ End began to focus its operations on clothing and luggage. In 1978, Lands’ End moved its operations to Dodgeville, WI. The firm went public in 1986 and began its international operations in 1991. Through the late 1990s, Lands’ End launched its website and developed innovative methods to improve the customer experience such as tools that allowed customers to create 3-D models of themselves and create custom pants. Lands’ End was purchased as a wholly-owned subsidiary of Sears Holding Corporation in 2002.19 Sears acquired Lands’ End for approximately $1.9 billion in cash in 2002. At the time of the announcement of the acquisition, the amount provided Lands’ End shareholders with a 21.5% premium over the existing market value of the stock. The acquisition provided Lands’ End the potential to grow their in-store retail sales by providing 870 new stores for their products. For Sears, the acquisition provided the opportunity to improve the brand image of its apparel and make the brand recognition for apparel more consistent with that of Sears’ hardline categories
(e.g. Craftsman, Diehard, and Kenmore).20 Ultimately, Sears’ goal with the acquisition was to improve its waning sales and improve profit margins in softlines by offering higher quality apparel with existing brand recognition. In November of 2004, K-Mart announced that it was merging with Sears for a price of approximately $11 billion, which existing Sears’ shareholders could receive in cash or in stock of the new Sears Holding Corporation. At the time of the announcement, K-Mart and Sears had approximately 3,500 locations between them. This expansion offered Lands’ End the opportunity to expand its sales. Edward Lampert, the current Chairperson of Sears Holding Corporation and owner of almost half of Sears’ stock, described the relationship between Sears and Lands’ End and the decision to spin off Lands’ End in a blog post dated April 13, 2014 as follows:
Sears shoppers definitely liked having Lands’ End’s products in Sears and loved how easily they could return or exchange the products they bought from catalogs or online in Sears stores across the country. But this did not directly translate into higher earnings and the company and investors suffered: by 2004, Lands’ End’s earnings had hit their lowest level of the entire 12 year period (2002 to 2014) that Lands’ End was associated with Sears. After Sears and Kmart merged in 2005, Lands’ End’s fortunes started to turn around. During each year from 2005 to 2010, earnings were significantly higher than they were in 2004, including several years of record profits. Dedicated shops were created inside Sears stores to bring the Lands’ End brand even more distinction, in contrast to the initial approach of having merchandise spread throughout the store. However, in 2011 and 2012 the company stumbled for a variety of reasons that were described in its public filings. Just one example: in 2011, cotton prices hit heights unseen since supply and distribution were disrupted during the Civil War (impacting most other apparel retailers as well). Lands’ End’s performance improved significantly in 2013, but it was clear to us that bigger changes needed to be made to really unlock the potential of the business. Sears Holdings opted for a spinoff – a legal split that allows each company to focus on managing its own business, yet still work together in some ways. Sears Holdings stockholders – I am one myself – were given approximately three
shares of the new Lands’ End for every ten shares of Sears Holdings they own. This gives investors a choice, and the ability to continue to participate in the results of the Lands’ End business going forward.21
While we can’t know what would have happened to Lands’ End had it not been acquired by Sears, we can see that Sears was unable to add value to the firm. Per Standard & Poor’s Capital IQ, Lands’ End had a total enterprise value of $963.5 million five days after it was spun off from Sears. This represented a significant loss in value for Lands’ End from its approximate enterprise value of $1.7 billion prior to the acquisition announcement in 2002. Despite being a part of Sears for eleven years, sales in Sears’ retail locations only accounted for 15% of Lands’ End total sales for fiscal year 2013.22 During the time that Sears owned Lands’ End, it did little to invest in Lands’ End’s growth. Per Tables 3 and 4, during the time that Lands’ End was owned by Sears, assets for Lands’ End increased by $628.7 million, which consisted primarily of the value of Trade Names at $528.3 million.23 Trade Names is an intangible asset that represents the value that Sears assigned to the Lands’ End brand. For the same period Net Property, Plant and Equipment fell from $193.9 million in 2002 to $98.7 million in 2014, indicating that Sears wasn’t investing enough to maintain Lands’ End assets. Over the same twelve year period, Lands’ End’s revenues grew by only 0.33%. Despite the lack of investment by Sears, as part of the spinoff agreement, Lands’ End was required to pay $500 million in cash to Sears, which—according to Lampert—was “the equivalent of many years of after-tax profits”.24 The source of that cash was a $515 million loan from Bank of America.25 In the short-term, the spinoff will have little, if any, effect on Sears’ customers, as the spinoff arrangement included agreements that would keep Lands’ End shops in Sears’ stores, with Lands’ End paying Sears’ for providing personnel and other resources to maintain those locations. The termination dates of those agreements range between January 2018 and January 2020. The separation will also likely have little effect on the region in the short term. Lands’ End employs 6,400 people worldwide, with 5,300 of them in the US, and the majority of those in the Dodgeville, WI area. Per its most recent 10-K, Lands’ End stated that it doesn’t plan on
21 Eddie Lampert, “Spinoffs and Lands’ End,” Sears Holdings, April 13, 2014, http://blog.searsholdings.com/eddie-lampert/spinoffs-and-lands-end/ 22 Lands’ End 10-K dated March 25, 2014. 23 Lands’ End 10-K dated March 25, 2014. 24 Eddie Lampert, “Spinoffs and Lands’ End,” Sears Holdings, April 13, 2014, http://blog.searsholdings.com/eddie-lampert/spinoffs-and-lands-end/ 25 Lands’ End 10-Q dated May 2, 2014 Sponsored by: 46
hiring new employees as a result of the separation.26 One positive note is that the market responded favorably to the merger with an approximate 24% increase in Lands’ Ends’ stock price since the firm started trading openly in early April 2014. Table 3. Balance Sheet Comparison for Lands’ End, Inc.
Amounts in millions of USD Pre-Acquisition Post-Spinoff As of Feb. 1, 2002 May 2, 2014
ASSETS Cash And Equivalents 122.1 65.0 Accounts Receivable 13.3 39.8 Inventory 227.2 327.0 Prepaid Exp. 24.1 14.2 Deferred Tax Assets, Curr. 15.9 - Restricted Cash - 3.3 Other Current Assets - 15.4 Total Current Assets 402.6 464.7 Gross Property, Plant & Equipment 344.2 260.8 Accumulated Depreciation (150.3) (162.2) Net Property, Plant & Equipment 193.9 98.7 Goodwill - 110.0 Other Intangibles - 530.7 Other Long-Term Assets 2.7 23.7 Total Assets 599.1 1,227.8 LIABILITIES
Accounts Payable 83.4 76.1 Accrued Exp. 51.7 30.5 Short-term Borrowings 16.2 - Curr. Port. of LT Debt - 5.2 Curr. Income Taxes Payable 25.0 - Unearned Revenue, Current - 52.5 Def. Tax Liability, Curr. - 3.7 Other Current Liabilities 9.4 20.6 Total Current Liabilities 185.6 188.6 (Continued on page 48)
26 Lands’ End 10-K dated March 25, 2014 Sponsored by: 47
Economic Indicators September 18, 2014
Table 3. Balance Sheet Comparison for Lands’ End, Inc. (Continued) Amounts in millions of USD Pre-Acquisition Post-Spinoff
As of Feb. 1, 2002 May 2, 2014 Long-Term Debt - 509.9 Def. Tax Liability, Non-Curr. 12.8 168.3 Other Non-Current Liabilities - 15.6 Total Liabilities 198.4 882.4 EQUITY Common Stock 0.4 0.3 Additional Paid In Capital 48.0 340.2 Retained Earnings 556.0 5.9 Treasury Stock (206.9) - Comprehensive Inc. and Other 3.3 (1.1) Total Equity 400.7 345.3 Total Liabilities And Equity 599.1 1,227.8 Table 4. Income Statement Comparison for Lands’ End, Inc. Amounts in millions of USD Pre-Acquisition Post-Spinoff
For the twelve month period ending Feb. 1, 2002 May 2, 2014 Revenue 1,569.1 1,574.3 Cost Of Goods Sold 880.2 856.6 Gross Profit 688.8 717.8 Selling General & Admin Exp. 575.7 563.2 Depreciation & Amort. - 20.9 Other Operating Expense/(Income) - 0.1 Other Operating Exp., Total 575.7 584.2 Operating Income 113.2 133.6 Interest Expense (1.4) (1.9) Interest and Invest. Income 1.5 - Net Interest Exp. 0.2 (1.9) Currency Exchange Gains (Loss) (1.7) - Other Non-Operating Inc. (Exp.) (3.7) 0.2 EBT Excl. Unusual Items 107.9 131.8 Legal Settlements - 1.6 EBT Incl. Unusual Items 107.9 133.4 Income Tax Expense 41.0 51.1 Net Income 66.9 82.4
Sponsored by: 48
Economic Indicators September 18, 2014
Concluding Remarks Strong performance for the SREI for the past two years has been driven by returns for HMN Financial and Rochester Medical. HMN Financial, along with Citizens Community Bancorp, continues to benefit from improving asset quality. Two firms in the index, Fastenal and Marten Transport, were negatively affected by severe winter weather in the Midwest. Marten Transport has appeared to bounce back from the weather-induced poor performance. Rochester Medical’s strong stock price performance was driven by the decision to exit the unprofitable Foley catheter market in 2012 and the sale of the firm to C. R. Bard in 2013. The spinoff of Lands’ End from Sears provides an interesting opportunity to examine if separating the firm from its long-term owner will improve the long-term health of the firm. So far, investors have responded favorably.
Sponsored by: 49
Economic Indicators September 18, 2014
APPENDIX Non-Financial Firms27 Company: Fastenal Corporation Ticker: FAST Exchange: NasdaqGS Market Cap: $13.21 Billion Description: Wholesaler and retailer of industrial and construction supplies. Product lines include fasteners, hydraulic and pneumatic tools, janitorial supplies, and welding equipment. Institutional Ownership: 82% Year Founded: 1967 Company: Flexsteel Industries, Inc. Ticker: FLXS Exchange: NasdaqGS Market Cap: $221.23 Million Description: Manufacturer, importer, and marketer of residential and commercial furniture. Product lines include upholstered and wood furniture, desks, dining tables and chairs, and bedroom furniture. Institutional Ownership: 44% Year Founded: 1929 Company: Hormel Foods Corporation Ticker: HRL Exchange: NYSE Market Cap: $11.98 Billion Description: Producer and marketer of meat and food products worldwide. Business segments include: grocery products, refrigerated foods, Jennie-O Turkey Stores, and specialty foods. Institutional Ownership: 34% Year Founded: 1891
27 Data presented is from Capital IQ, Morningstar, and Thomson Reuters. Sponsored by: 50
Economic Indicators September 18, 2014
Company: Lands’ End, Inc Ticker: LE Exchange: NasdaqCM Market Cap: $1.10 Billion Description: Multi-channel retailer of apparel and home products. The firm’s channels of distribution are: standalone stores, stores within Sears’ stores, internet, phone, and catalog. Lands’ End has operations in the US, Europe, and Asia. Institutional Ownership: N/A Year Founded: 1963 Company: Marten Transport Ltd. Ticker: MRTN Exchange: NasdaqGS Market Cap: $671.97 Million Description: Truckload carrier that specializes in transporting consumer goods that require a temperature-controlled or insulated environment across North America and Mexico. Business segments are trucking and logistics. Institutional Ownership: 67% Year Founded: 1946 Company: National Presto Industries, Inc. Ticker: NPK Exchange: NYSE Market Cap: $440.54 Million Description: Manufacturer of housewares and electrical appliances; defense-related products, such as: training ammunition fuses, firing devices, and initiators; diapers and adult incontinence products. Institutional Ownership: 48% Year Founded: 1905 Company: Spectrum Brands Holdings, Inc. Ticker: SPB Exchange: NYSE Market Cap: $4.40 Billion Description: International consumer products company that sells products under the brand names Rayovac, Kwikset, Weiser, Baldwin, National Hardware, Pfister, Remington, VARTA, George Foreman, Black & Decker, Toastmaster, Farberware, Tetra, Marineland, Nature’s Miracle, Dingo, 8-in-1, Russell Hobbs, FURminator, Littermaid, Spectracide, Cutter, Repel, Hot Shot, and Black Flag. Institutional Ownership: 41% Year Founded: 1906
Sponsored by: 51
Economic Indicators September 18, 2014
Financial Services Firms28 Company: Citizens Community Bancorp Inc. Ticker: CZWI Exchange: NasdaqGM Market Cap: $45.68 Million Description: Provider of consumer banking services through 18 in-store Wal-Mart Supercenter locations and eight branches in Wisconsin, Minnesota, and Michigan. Institutional Ownership: 10% Year Founded: 1938 Company: Heartland Financial USA Inc. Ticker: HTLF Exchange: NasdaqGS Market Cap: $447.28 Million Description: A multi-bank holding company that has subsidiaries in Iowa, Illinois, Wisconsin, New Mexico, Arizona, Montana, Colorado, and Minnesota. Institutional Ownership: 40% Year Founded: 1981 Company: HMN Financial, Inc. Ticker: HMNF Exchange: NasdaqGM Market Cap: $46.58 Million Description: Operator of retail banking and loan production facilities in Minnesota and Iowa. Institutional Ownership: 28% Year Founded: 1933
28 Data presented is from Capital IQ, Morningstar, and Thomson Reuters. Sponsored by: 52
State Bank Financial, dedicated to the economic growth of the region, sponsors this research and community forum to deepen our understanding of regional economic trends to provide tools for decision makers. Bruce Norgaard, President & CEO Kevin Leslie, Executive Vice-President Wayne Oliver, Executive Vice-President
The La Crosse Tribune is a partner in this and many other regional initiatives to promote growth in our new economy. Media coverage extends throughout the region in a network of Lee Enterprises publications. Rusty Cunningham, Publisher
UW-La Crosse College of Business Administration contributes faculty and administrative support for this regional initiative. The project team tracks core economic indicators, analyzes trends, and prepares periodic reports. Bruce May, Dean Glenn Knowles, Interim Associate Dean Anne Hlavacka, SBDC Director