Page 1
7.1A Average rates against sterling(13.1)
Broad Exchange ratesSter ling Ster lingeffective effective
exchange exchange Monthlyrate index rate index Hong average
Januar y Januar y Australian Canadian Czech Cypriot Danish Estonian Kong Hungarian Indian2007= 1001 2007= 1002 Euro3 dollar dollar Koruna Pound kroner Kroon dollar Forint rupee
BK67 BK82 THAP AJFP AJFB BK25 BK22 AJFK BK28 AJFU BK33 BK972005 100.3883 100.3167 1.4629 2.3851 2.2048 43.5537 0.8437 10.9013 22.8867 14.1477 362.8009 ..2006 101.1883 100.9817 1.4670 2.4460 2.0900 41.5666 0.8446 10.9427 22.9524 14.3182 387.5955 ..2007 103.5792 103.1775 1.4619 2.3899 2.1467 40.6006 0.8517 10.8921 22.8759 15.6201 367.3316 ..2008 90.7792 90.4392 1.2588 2.1881 1.9621 31.3855 0.7367 9.3853 19.7029 14.4304 316.5264 ..2009 80.1404 80.1263 1.1233 1.9905 1.7800 29.7000 0.6580 8.3644 17.5760 12.1432 314.8780 ..
2006 Jan 99.0600 98.8700 1.4582 2.3566 2.0469 41.8419 0.8365 10.8799 22.8155 13.7079 365.5479 ..Feb 98.9300 98.7200 1.4637 2.3562 2.0079 41.5988 0.8406 10.9256 22.9015 13.5566 368.3035 ..Mar 98.3600 98.1900 1.4500 2.4009 2.0184 41.5328 0.8340 10.8189 22.6880 13.5288 378.3270 ..Apr 98.3600 98.1800 1.4402 2.3995 2.0232 41.0494 0.8300 10.7464 22.5340 13.7172 382.0883 ..May 101.2100 101.0000 1.4637 2.4479 2.0764 41.3623 0.8416 10.9144 22.9024 14.5016 383.9396 ..Jun 100.8700 100.7300 1.4560 2.4916 2.0533 41.3264 0.8371 10.8570 22.7817 14.3075 396.8696 ..
Jul 100.8600 100.7100 1.4540 2.4513 2.0819 41.3643 0.8359 10.8477 22.7505 14.3403 403.0065 ..Aug 102.8600 102.6800 1.4785 2.4818 2.1200 41.6899 0.8513 11.0312 23.1336 14.7318 405.4426 ..Sep 102.9200 102.7400 1.4811 2.4951 2.1037 42.0352 0.8537 11.0495 23.1745 14.6679 406.3963 ..Oct 103.0600 102.8200 1.4869 2.4886 2.1164 42.0482 0.8573 11.0857 23.2652 14.6027 396.6763 ..Nov 103.3700 103.0800 1.4834 2.4750 2.1731 41.5653 0.8569 11.0610 23.2107 14.8788 383.9409 ..Dec 104.4000 104.0600 1.4860 2.4981 2.2636 41.2701 0.8589 11.0778 23.2503 15.2611 377.2499 ..
2007 Jan 105.4500 105.1200 1.5079 2.5022 2.3038 41.9983 0.8721 11.2397 23.5936 15.2780 382.8367 ..Feb 104.9100 104.5700 1.4969 2.5017 2.2931 42.2740 0.8670 11.1580 23.4213 15.2958 379.2024 ..Mar 103.4400 103.0700 1.4703 2.4555 2.2746 41.2448 0.8525 10.9532 23.0055 15.2139 366.8674 ..Apr 104.1300 103.7100 1.4713 2.4034 2.2553 41.2100 0.8554 10.9661 23.0211 15.5602 361.7697 ..May 103.7700 103.3600 1.4677 2.4034 2.1717 41.4427 0.8557 10.9369 22.9639 15.5105 364.8435 ..Jun 104.3800 104.0000 1.4805 2.3580 2.1156 42.2782 0.8640 11.0222 23.1650 15.5216 370.1210 ..
Jul 105.0900 104.6700 1.4821 2.3451 2.1365 42.0009 0.8658 11.0284 23.1901 15.9039 366.0522 ..Aug 104.4100 104.0500 1.4762 2.4286 2.1284 41.1191 0.8625 10.9872 23.0970 15.7186 376.7223 ..Sep 103.1700 102.8000 1.4515 2.3859 2.0723 40.0153 0.8481 10.8150 22.7115 15.7091 367.7689 ..Oct 102.6700 102.2300 1.4370 2.2746 1.9953 39.2714 0.8396 10.7107 22.4839 15.8555 360.5674 ..Nov 101.7400 101.2800 1.4106 2.3127 2.0010 37.6704 0.8242 10.5151 22.0710 16.1011 358.6825 ..Dec 99.7900 99.2700 1.3863 2.3134 2.0245 36.4765 0.8111 10.3416 21.6907 15.7402 351.0004 ..
2008 Jan 96.4800 95.9900 1.3383 2.2347 1.9929 34.8639 0.7833 9.9708 20.9404 15.3738 342.6374 ..Feb 95.9900 95.4800 1.3316 2.1512 1.9625 33.7860 0.7794 9.9259 20.8355 15.3121 349.1247 ..Mar 94.5300 94.1100 1.2897 2.1672 2.0047 32.4593 0.7549 9.6163 20.1793 15.5885 335.3933 ..Apr 92.7400 92.3300 1.2580 2.1300 2.0113 31.5177 0.7363 9.3855 19.6832 15.4403 318.7565 ..May 92.6900 92.3100 1.2633 2.0697 1.9626 31.7115 0.7394 9.4255 19.7661 15.3190 312.8188 ..Jun 92.8100 92.3900 1.2636 2.0669 1.9976 30.7086 0.7396 9.4244 19.7702 15.3478 306.5536 ..
Jul 92.9400 92.4800 1.2615 2.0662 2.0141 29.7090 0.7384 9.4109 19.7382 15.5067 292.5144 ..Aug 91.3600 90.9600 1.2614 2.1400 1.9905 30.6396 0.7383 9.4095 19.7369 14.7490 297.5536 ..Sep 89.6300 89.3200 1.2531 2.1987 1.9037 30.6338 0.7334 9.3458 19.6063 14.0060 301.6305 ..Oct 89.0600 88.8900 1.2718 2.4675 1.9915 31.4969 0.7444 9.4809 19.8995 13.1129 331.4457 ..Nov 83.2200 83.1300 1.2041 2.3319 1.8681 30.3210 0.7048 8.9687 18.8402 11.8885 318.9225 ..Dec 77.9000 77.8800 1.1043 2.2151 1.8376 28.8236 0.6463 8.2267 17.2778 11.5169 292.0228 ..
2009 Jan 76.7400 76.7600 1.0919 2.1431 1.7708 29.7032 0.6391 8.1367 17.0832 11.2095 306.1506 ..Feb 78.5600 78.6900 1.1264 2.2175 1.7953 32.0536 0.6593 8.3931 17.6239 11.1736 335.5791 ..Mar 76.6400 76.7800 1.0867 2.1283 1.7920 29.5869 0.6360 8.0964 17.0024 10.9894 330.8110 ..Apr 78.6000 78.6300 1.1157 2.0597 1.8025 29.8434 0.6530 8.3107 17.4565 11.4041 328.7061 73.5393May 80.1600 80.1200 1.1295 2.0149 1.7764 30.2187 0.6611 8.4111 17.6730 11.9591 318.4920 74.7523Jun 83.6600 83.6300 1.1682 2.0401 1.8436 30.9716 0.6837 8.6978 18.2779 12.6848 327.5753 78.0402
Jul 83.2400 83.1800 1.1622 2.0339 1.8374 29.9972 0.6802 8.6530 18.1837 12.6836 316.4926 79.1530Aug 83.3750 83.3961 1.1597 1.9808 1.7978 29.7604 0.6788 8.6326 18.1452 12.8190 313.0952 79.7535Sep 80.8586 80.7752 1.1212 1.8949 1.7663 28.4208 0.6562 8.3445 17.5422 12.6550 304.6233 78.8814Oct 79.1104 79.0116 1.0928 1.7870 1.7075 28.2981 0.6396 8.1345 17.0984 12.5543 293.4307 75.6072Nov 80.6685 80.5758 1.1126 1.8044 1.7560 28.7420 0.6512 8.2792 17.4082 12.8631 301.3483 77.2414Dec 80.0717 79.9671 1.1127 1.7988 1.7120 29.0234 0.6513 8.2806 17.4101 12.5894 304.1298 75.5713
2010 Jan 80.6288 80.4542 1.1327 1.7691 1.6853 29.5959 0.6630 8.4301 17.7227 12.5452 305.2952 74.1788
1 The methodology for this series accounts for changing trade flows overtime. An article in the Winter 2004 edition of the Bank of England Quarter lyBulletin (pages 429-441) provides further infor mation on the calculation ofthis index.
2 This series is a broad measure of the sterling exchange rate index cover inga wider set of countries. An article in the Winter 2004 edition of the Bank ofEngland Quarter ly Bulletin (pages 429-441) provides further infor mation onthe calculation of this index.
3 Prior to the Januar y 1999, a synthetic Euro has been calculated bygeometr ically averaging the bilateral exchange rates of the 11 Euro-area countries using "internal weights"based on each country’s share ofthe extra Euro - area trade.
Source: Bank of England
134
Page 2
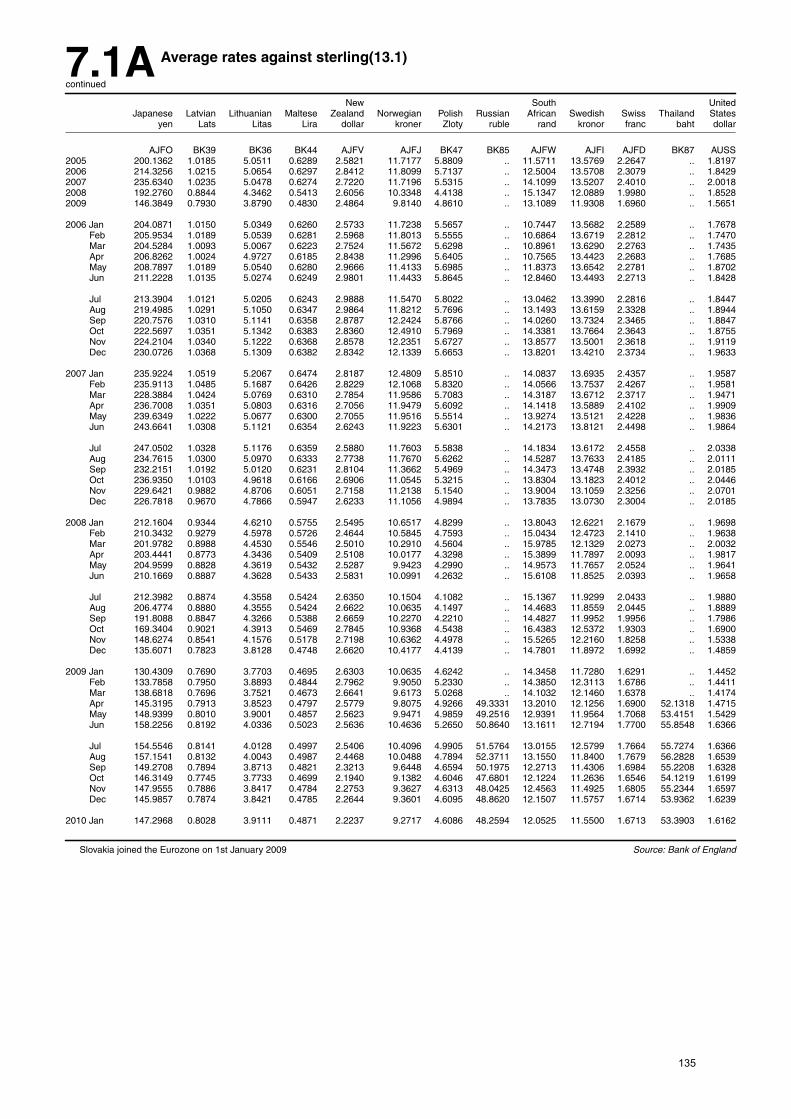
7.1A Average rates against sterling(13.1)
continued
New South UnitedJapanese Latvian Lithuanian Maltese Zealand Norwegian Polish Russian Afr ican Swedish Swiss Thailand States
yen Lats Litas Lira dollar kroner Zloty ruble rand kronor franc baht dollar
AJFO BK39 BK36 BK44 AJFV AJFJ BK47 BK85 AJFW AJFI AJFD BK87 AUSS2005 200.1362 1.0185 5.0511 0.6289 2.5821 11.7177 5.8809 .. 11.5711 13.5769 2.2647 .. 1.81972006 214.3256 1.0215 5.0654 0.6297 2.8412 11.8099 5.7137 .. 12.5004 13.5708 2.3079 .. 1.84292007 235.6340 1.0235 5.0478 0.6274 2.7220 11.7196 5.5315 .. 14.1099 13.5207 2.4010 .. 2.00182008 192.2760 0.8844 4.3462 0.5413 2.6056 10.3348 4.4138 .. 15.1347 12.0889 1.9980 .. 1.85282009 146.3849 0.7930 3.8790 0.4830 2.4864 9.8140 4.8610 .. 13.1089 11.9308 1.6960 .. 1.5651
2006 Jan 204.0871 1.0150 5.0349 0.6260 2.5733 11.7238 5.5657 .. 10.7447 13.5682 2.2589 .. 1.7678Feb 205.9534 1.0189 5.0539 0.6281 2.5968 11.8013 5.5555 .. 10.6864 13.6719 2.2812 .. 1.7470Mar 204.5284 1.0093 5.0067 0.6223 2.7524 11.5672 5.6298 .. 10.8961 13.6290 2.2763 .. 1.7435Apr 206.8262 1.0024 4.9727 0.6185 2.8438 11.2996 5.6405 .. 10.7565 13.4423 2.2683 .. 1.7685May 208.7897 1.0189 5.0540 0.6280 2.9666 11.4133 5.6985 .. 11.8373 13.6542 2.2781 .. 1.8702Jun 211.2228 1.0135 5.0274 0.6249 2.9801 11.4433 5.8645 .. 12.8460 13.4493 2.2713 .. 1.8428
Jul 213.3904 1.0121 5.0205 0.6243 2.9888 11.5470 5.8022 .. 13.0462 13.3990 2.2816 .. 1.8447Aug 219.4985 1.0291 5.1050 0.6347 2.9864 11.8212 5.7696 .. 13.1493 13.6159 2.3328 .. 1.8944Sep 220.7576 1.0310 5.1141 0.6358 2.8787 12.2424 5.8766 .. 14.0260 13.7324 2.3465 .. 1.8847Oct 222.5697 1.0351 5.1342 0.6383 2.8360 12.4910 5.7969 .. 14.3381 13.7664 2.3643 .. 1.8755Nov 224.2104 1.0340 5.1222 0.6368 2.8578 12.2351 5.6727 .. 13.8577 13.5001 2.3618 .. 1.9119Dec 230.0726 1.0368 5.1309 0.6382 2.8342 12.1339 5.6653 .. 13.8201 13.4210 2.3734 .. 1.9633
2007 Jan 235.9224 1.0519 5.2067 0.6474 2.8187 12.4809 5.8510 .. 14.0837 13.6935 2.4357 .. 1.9587Feb 235.9113 1.0485 5.1687 0.6426 2.8229 12.1068 5.8320 .. 14.0566 13.7537 2.4267 .. 1.9581Mar 228.3884 1.0424 5.0769 0.6310 2.7854 11.9586 5.7083 .. 14.3187 13.6712 2.3717 .. 1.9471Apr 236.7008 1.0351 5.0803 0.6316 2.7056 11.9479 5.6092 .. 14.1418 13.5889 2.4102 .. 1.9909May 239.6349 1.0222 5.0677 0.6300 2.7055 11.9516 5.5514 .. 13.9274 13.5121 2.4228 .. 1.9836Jun 243.6641 1.0308 5.1121 0.6354 2.6243 11.9223 5.6301 .. 14.2173 13.8121 2.4498 .. 1.9864
Jul 247.0502 1.0328 5.1176 0.6359 2.5880 11.7603 5.5838 .. 14.1834 13.6172 2.4558 .. 2.0338Aug 234.7615 1.0300 5.0970 0.6333 2.7738 11.7670 5.6262 .. 14.5287 13.7633 2.4185 .. 2.0111Sep 232.2151 1.0192 5.0120 0.6231 2.8104 11.3662 5.4969 .. 14.3473 13.4748 2.3932 .. 2.0185Oct 236.9350 1.0103 4.9618 0.6166 2.6906 11.0545 5.3215 .. 13.8304 13.1823 2.4012 .. 2.0446Nov 229.6421 0.9882 4.8706 0.6051 2.7158 11.2138 5.1540 .. 13.9004 13.1059 2.3256 .. 2.0701Dec 226.7818 0.9670 4.7866 0.5947 2.6233 11.1056 4.9894 .. 13.7835 13.0730 2.3004 .. 2.0185
2008 Jan 212.1604 0.9344 4.6210 0.5755 2.5495 10.6517 4.8299 .. 13.8043 12.6221 2.1679 .. 1.9698Feb 210.3432 0.9279 4.5978 0.5726 2.4644 10.5845 4.7593 .. 15.0434 12.4723 2.1410 .. 1.9638Mar 201.9782 0.8988 4.4530 0.5546 2.5010 10.2910 4.5604 .. 15.9785 12.1329 2.0273 .. 2.0032Apr 203.4441 0.8773 4.3436 0.5409 2.5108 10.0177 4.3298 .. 15.3899 11.7897 2.0093 .. 1.9817May 204.9599 0.8828 4.3619 0.5432 2.5287 9.9423 4.2990 .. 14.9573 11.7657 2.0524 .. 1.9641Jun 210.1669 0.8887 4.3628 0.5433 2.5831 10.0991 4.2632 .. 15.6108 11.8525 2.0393 .. 1.9658
Jul 212.3982 0.8874 4.3558 0.5424 2.6350 10.1504 4.1082 .. 15.1367 11.9299 2.0433 .. 1.9880Aug 206.4774 0.8880 4.3555 0.5424 2.6622 10.0635 4.1497 .. 14.4683 11.8559 2.0445 .. 1.8889Sep 191.8088 0.8847 4.3266 0.5388 2.6659 10.2270 4.2210 .. 14.4827 11.9952 1.9956 .. 1.7986Oct 169.3404 0.9021 4.3913 0.5469 2.7845 10.9368 4.5438 .. 16.4383 12.5372 1.9303 .. 1.6900Nov 148.6274 0.8541 4.1576 0.5178 2.7198 10.6362 4.4978 .. 15.5265 12.2160 1.8258 .. 1.5338Dec 135.6071 0.7823 3.8128 0.4748 2.6620 10.4177 4.4139 .. 14.7801 11.8972 1.6992 .. 1.4859
2009 Jan 130.4309 0.7690 3.7703 0.4695 2.6303 10.0635 4.6242 .. 14.3458 11.7280 1.6291 .. 1.4452Feb 133.7858 0.7950 3.8893 0.4844 2.7962 9.9050 5.2330 .. 14.3850 12.3113 1.6786 .. 1.4411Mar 138.6818 0.7696 3.7521 0.4673 2.6641 9.6173 5.0268 .. 14.1032 12.1460 1.6378 .. 1.4174Apr 145.3195 0.7913 3.8523 0.4797 2.5779 9.8075 4.9266 49.3331 13.2010 12.1256 1.6900 52.1318 1.4715May 148.9399 0.8010 3.9001 0.4857 2.5623 9.9471 4.9859 49.2516 12.9391 11.9564 1.7068 53.4151 1.5429Jun 158.2256 0.8192 4.0336 0.5023 2.5636 10.4636 5.2650 50.8640 13.1611 12.7194 1.7700 55.8548 1.6366
Jul 154.5546 0.8141 4.0128 0.4997 2.5406 10.4096 4.9905 51.5764 13.0155 12.5799 1.7664 55.7274 1.6366Aug 157.1541 0.8132 4.0043 0.4987 2.4468 10.0488 4.7894 52.3711 13.1550 11.8400 1.7679 56.2828 1.6539Sep 149.2708 0.7894 3.8713 0.4821 2.3213 9.6448 4.6594 50.1975 12.2713 11.4306 1.6984 55.2208 1.6328Oct 146.3149 0.7745 3.7733 0.4699 2.1940 9.1382 4.6046 47.6801 12.1224 11.2636 1.6546 54.1219 1.6199Nov 147.9555 0.7886 3.8417 0.4784 2.2753 9.3627 4.6313 48.0425 12.4563 11.4925 1.6805 55.2344 1.6597Dec 145.9857 0.7874 3.8421 0.4785 2.2644 9.3601 4.6095 48.8620 12.1507 11.5757 1.6714 53.9362 1.6239
2010 Jan 147.2968 0.8028 3.9111 0.4871 2.2237 9.2717 4.6086 48.2594 12.0525 11.5500 1.6713 53.3903 1.6162
Slovakia joined the Eurozone on 1st Januar y 2009 Source: Bank of England
135
Page 3
7.1B End month rates and forward margins against sterling (13.2)
Percentage per annum
Canadian dollar Danish kroner
3 months forward1 3 months forward1
Spot (cents) percent Spot (ore) percent
AJGD AJGE AJGF AJHE AJHF AJHG2006 Feb 1.9928 −0.3025 −0.6030 10.9597 −4.7799 −1.7445
Mar 2.0231 −0.3050 −0.6139 10.6955 −4.3235 −1.6150Apr 2.0368 −0.2226 −0.4314 10.7664 −4.5492 −1.6899May 2.0604 −0.1624 −0.3107 10.8664 −4.6215 −1.7001Jun 2.0565 −0.1223 −0.2372 10.7885 −4.1744 −1.5475
Jul 2.1104 −0.2104 −0.3981 10.9182 −3.9951 −1.4652Aug 2.1106 −0.3255 −0.6256 11.0833 −4.2329 −1.5271Sep 2.0842 −0.3657 −0.7115 10.9987 −4.1120 −1.4945Oct 2.1369 −0.4572 −0.8598 11.1373 −4.1392 −1.4865Nov 2.2461 −0.5130 −0.9067 11.0630 −3.9574 −1.4322Dec 2.2770 −0.5428 −0.9474 11.0636 −3.7999 −1.3743
2007 Jan 2.3105 −0.6735 −1.1602 11.2314 −4.2629 −1.5174Feb 2.2983 −0.6719 −1.1652 11.0556 −4.1311 −1.4937Mar 2.2622 −0.7058 −1.2566 10.9779 −3.9065 −1.4244Apr 2.2095 −0.7387 −1.3394 10.9194 −3.8705 −1.4176May 2.1149 −0.7314 −1.3839 10.9518 −3.9195 −1.4320Jun 2.1346 −0.7181 −1.3521 11.0561 −4.3110 −1.5588
Jul 2.1704 −0.6857 −1.2719 11.0446 −4.2684 −1.5471Aug 2.1341 −0.7352 −1.3897 11.0220 −5.8978 −2.1416Sep 2.0248 −0.6158 −1.2277 10.6769 −4.1419 −1.5506Oct 1.9735 −0.6909 −1.4010 10.7014 −4.2236 −1.5776Nov 2.0553 −0.7065 −1.3786 10.4448 −4.5734 −1.7510Dec 1.9650 −0.6227 −1.2589 10.1533 −3.1692 −1.2493
2008 Jan 2.0045 −0.7591 −1.5200 10.0104 −2.7207 −1.0869Feb 1.9432 −0.9200 −1.9000 9.7635 −3.0800 −1.2600Mar 2.0390 −1.0871 −2.1373 9.3534 −2.6216 −1.1209Apr 1.9946 −1.1664 −2.3518 9.4910 −2.2077 −0.9315May 1.9643 −1.1954 −2.4490 9.4850 −2.3231 −0.9779Jun 2.0192 −1.1828 −2.3366 9.4205 −1.8634 −0.7898
Jul 2.0321 −1.1732 −2.3054 9.4726 −1.4259 −0.6000Aug 1.9324 −1.0511 −2.1762 9.2382 −4.3853 −1.9004Sep 1.8947 −0.1295 −0.2751 9.4638 −1.1617 −0.4905Oct 1.9637 −1.0399 −2.1224 9.4911 −0.6299 −0.2655Nov 1.9045 −0.0879 −0.1848 9.0100 3.5610 1.5809Dec 1.7744 −0.3761 −0.8478 7.6976 2.8152 1.4612
2009 Jan 1.7874 −0.0664 −0.1477 8.3859 2.7462 1.3098Feb 1.8094 −0.1038 −0.2300 8.3624 2.0706 0.9907Mar 1.8033 −0.1378 −0.3062 8.0395 1.8862 0.9383Apr 1.7606 −0.1334 0.3031 8.3307 1.6821 2.8869May 1.7668 −0.1731 −0.3919 8.4817 1.5887 0.7181Jun 1.9126 −0.1361 4.0000 8.7421 1.0760 0.4923
Jul 1.7934 −0.1042 −0.2324 8.7075 1.2508 −0.5746Aug 1.7670 −0.0271 −0.0613 8.4455 1.3591 0.6437Sep 1.7168 −0.0589 −0.1372 8.1449 0.8076 0.3966Oct 1.7744 −0.0861 −0.1939 8.3118 0.9553 0.4596Nov 1.7302 −0.0920 −0.2127 8.1349 0.7182 0.3530Dec 1.6931 −0.0944 −0.2221 8.3749 0.4649 0.2221
2010 Jan 1.7071 −0.0879 −0.2062 8.5816 0.4446 0.2074
136
Page 4
7.1B End month rates and forward margins against sterling (13.2)
continued Percentage per annum
Japanese yen Norwegian kroner
3 months forward1 3 months forward1
Spot (yen) percent Spot (ore) percent
AJHQ AJHR AJHS AJHB AJHC AJHD2006 Feb 202.8124 −2.2448 −4.4179 11.8184 −5.8052 −1.9662
Mar 204.6190 −2.2907 −4.4766 11.3825 −5.2341 −1.8383Apr 207.6224 −2.3562 −4.5468 11.2305 −5.1978 −1.8522May 209.7802 −2.3774 −4.5381 11.3621 −4.9556 −1.7465Jun 211.4049 −2.2878 −4.3291 11.5070 −4.9124 −1.7075
Jul 213.6896 −2.3192 −4.3427 11.5157 −4.8321 −1.6771Aug 223.0811 −2.5102 −4.5006 11.9914 −5.0427 −1.6814Sep 220.6157 −2.5702 −4.6596 12.1769 −5.0676 −1.6650Oct 223.4402 −2.6363 −4.7261 12.4765 −5.2268 −1.6763Nov 227.4836 −2.6370 −4.6422 12.1159 −4.7502 −1.5677Dec 233.1961 −2.6848 −4.5969 12.1871 −4.2968 −1.4110
2007 Jan 236.7475 −2.8768 −4.8659 12.2588 −4.3010 −1.4029Feb 232.2012 −2.8280 −4.8751 12.0400 −3.7473 −1.2458Mar 231.5511 −2.7960 −4.8400 11.9698 −3.3810 −1.1295Apr 238.9841 −2.9690 −4.9711 11.8921 −3.5206 −1.1842May 240.9645 −3.0416 −5.0465 11.9405 −3.4290 −1.1491Jun 247.8105 −3.2088 −5.1800 11.8506 −3.3479 −1.1000
Jul 241.9741 −3.1474 −5.2073 11.8318 −3.1873 −1.0786Aug 233.8222 −3.3223 −5.6796 11.7415 −3.8281 −1.3049Sep 234.3417 −3.0392 −5.1890 11.0450 −1.4110 −0.5109Oct 239.5034 −3.2230 −5.3779 11.1922 −1.4754 −0.5290Nov 227.9804 −3.1125 −5.4566 11.4017 −1.8763 −0.6596Dec 222.3835 −2.7121 −4.8745 10.8122 0.1442 0.0518
2008 Jan 211.3854 −2.4528 −4.6360 10.8145 0.5424 0.1998Feb 207.0757 −2.4300 −4.6900 10.3769 0.6800 0.2600Mar 197.7960 −2.3949 −4.8332 10.0987 1.1260 0.4475Apr 206.9612 −2.4644 −4.7545 10.1155 2.1103 0.8340May 208.6274 −2.5081 −4.8123 10.0790 1.7584 0.6984Jun 210.9705 −2.5104 −4.7590 10.1463 2.2331 0.8788
Jul 214.0867 −2.5848 −4.8204 10.1682 2.0783 0.8181Aug 197.9079 −2.2861 −4.6284 9.8593 2.4266 0.9858Sep 189.2056 −2.0335 −4.2915 10.5341 8.8532 3.3618Oct 158.9301 −1.3775 −3.4732 10.8778 1.9943 0.7316Nov 146.1611 −0.5210 1.4258 10.7452 0.6380 0.2375Dec 130.1747 −0.4711 −1.4473 10.0832 3.9423 1.5638
2009 Jan 129.4701 −0.3491 −1.0782 9.9585 3.6455 1.4644Feb 139.4709 −0.2904 −0.8317 10.0498 2.9947 1.1920Mar 141.5473 −0.1656 −0.4691 9.6848 3.2410 1.3386Apr 145.7251 −0.2075 −0.5696 9.7400 3.2883 1.3504May 153.9293 −0.2056 −0.5343 10.1441 2.6200 1.0331Jun 158.9162 −0.1970 −0.4959 10.5971 2.2781 0.8599
Jul 157.7989 −0.1742 −0.4416 10.2048 2.2212 0.8706Aug 152.4589 −0.0990 −0.2597 9.7751 2.8188 1.1535Sep 143.2013 −0.1237 −0.3455 9.2873 2.7037 1.1645Oct 149.1424 −0.1547 −0.3326 9.3895 2.9798 1.2694Nov 141.3808 −0.1474 −0.4159 9.3205 2.9827 1.2801Dec 150.3217 −0.1564 −0.4151 9.3271 3.4464 1.4779
2010 Jan 145.2373 −0.1512 −0.4159 9.4362 3.5880 1.5210
137
Page 5
7.1B End month rates and forward margins against sterling (13.2)
continued
Swedish kronor Swiss franc US dollar
3 months forward1 3 months forward1 3 months forward1
Spot (ore) percent Spot (centimes) percent Spot (cents) percent
AJGY AJGZ AJHA AJGJ AJGK AJGL LUSS AJGB AJGC2006 Feb 13.8654 −8.3464 −2.4081 2.2969 −1.9326 −3.3565 1.7511 0.1500 0.3429
Mar 13.5168 −7.9227 −2.3432 2.2663 −1.8832 −3.3128 1.7345 0.2000 0.4624Apr 13.4254 −8.2028 −2.4423 2.2609 −1.8494 −3.2743 1.8179 0.2400 0.5275May 13.5036 −8.1039 −2.4000 2.2733 −1.8999 −3.3480 1.8712 0.2950 0.6417Jun 13.3205 −7.4119 −2.2257 2.2657 −1.7832 −3.1474 1.8494 0.3900 0.8437
Jul 13.4827 −7.5021 −2.2255 2.2990 −1.8203 −3.1652 1.8671 0.3600 0.7701Aug 13.7625 −7.5133 −2.1831 2.3453 −1.8870 −3.2170 1.9018 0.2300 0.4842Sep 13.6929 −7.5622 −2.2089 2.3427 −1.8749 −3.1966 1.8682 0.1750 0.3850Oct 13.7779 −7.5305 −2.1858 2.3727 −1.9501 −3.2911 1.9073 0.1200 0.2513Nov 13.4559 −7.1226 −2.1159 2.3569 −1.8857 −3.1899 1.9670 0.0850 0.1827Dec 13.3937 −6.8078 −2.0344 2.3895 −1.8414 −3.0795 1.9570 0.0550 0.1224
2007 Jan 13.6385 −7.1254 −2.0909 2.4426 −1.9596 −3.2131 1.9574 −0.0650 −0.1429Feb 13.7501 −7.4006 −2.1527 2.3934 −1.9874 −3.3305 1.9600 −0.0550 −0.1224Mar 13.7602 −7.3501 −2.1366 2.3946 −1.9172 −3.2134 1.9613 −0.0850 −0.1837Apr 13.4166 −7.1406 −2.1282 2.4132 −1.9814 −3.2863 1.9997 −0.1350 −0.2800May 13.6788 −7.5640 −2.2105 2.4245 −1.9956 −3.3058 1.9782 −0.1850 −0.3838Jun 13.7578 −7.7472 −2.2529 2.4596 −1.9740 −3.2000 2.0064 −0.2700 −0.5373
Jul 13.6841 −7.4583 −2.1813 2.4453 −2.0248 −3.2980 2.0322 −0.3000 −0.5911Aug 13.8919 −8.6733 −2.4968 2.4375 −2.3052 −3.7869 2.0171 −0.4000 −0.7921Sep 13.1792 −6.0800 −1.8452 2.3801 −2.0301 −3.4118 2.0374 −0.4150 −0.8235Oct 13.2104 −5.8198 −1.7623 2.4077 −2.0879 −3.4689 2.0774 −0.6400 −1.2308Nov 13.1320 −5.6032 −1.7060 2.3211 −2.1722 −3.7414 2.0561 −0.6350 −1.2427Dec 12.8672 −3.8123 −1.1841 2.2543 −1.7067 −3.0400 1.9909 −0.4900 −0.9849
2008 Jan 12.7247 −3.1769 −1.0000 2.1562 −1.5284 −2.8333 1.9882 −1.1450 −2.3116Feb 12.2743 −2.9000 −0.9500 2.0765 −1.4900 −2.8700 1.9892 −1.3100 −2.6300Mar 11.7844 −2.5195 −0.8557 1.9656 −1.3896 −2.8223 1.9875 −1.4250 −2.8744Apr 11.8728 −1.9296 −0.6504 2.0631 −1.5059 −2.9320 1.9803 −1.2850 −2.6061May 11.8653 −2.2837 −0.7683 2.0645 −1.5999 −3.1068 1.9762 −1.4000 −2.8283Jun 11.9700 −2.2430 −0.7485 2.0273 −1.5639 −3.0739 1.9901 −1.3800 −2.7739
Jul 11.9878 −1.8124 0.6038 2.0761 −1.5667 −3.0192 1.9810 −1.3450 −2.7273Aug 11.7168 −1.2033 −0.4096 2.0030 −1.4772 −2.9600 1.8237 −1.1800 −2.5934Sep 12.4271 2.7273 0.8785 1.9977 −1.0567 −2.1200 1.7821 0.5000 1.1236Oct 12.5964 −3.5917 −1.1397 1.8861 −1.1738 −2.4762 1.6158 −0.7300 −1.8025Nov 12.4295 1.2750 0.4103 1.8643 0.9040 1.9399 1.5345 0.0900 0.2345Dec 11.3810 −0.8126 −0.2857 1.5298 −0.4007 −1.0484 1.4376 −0.2350 −0.6537
2009 Jan 11.9552 −0.0297 −0.0100 1.6723 −0.3393 −0.8110 1.4416 −0.1000 −0.2774Feb 12.8237 0.9638 0.3007 1.6606 −0.3796 −0.9151 1.4255 −0.0200 −0.0561Mar 11.8477 −0.4396 −0.1485 1.6296 −0.2800 −0.6871 1.4331 0.0500 0.1396Apr 11.9373 −0.2519 −0.0844 1.6881 −0.2667 −0.6320 1.4820 − −May 12.2239 −0.2469 −0.0808 1.7196 −0.2440 −0.5676 1.6125 −0.0550 −0.1364Jun 12.7595 0.0286 0.0090 1.7906 −0.2412 0.5388 1.6468 −0.0250 −0.0607
Jul 12.0788 −0.7716 −0.2555 1.7842 −0.2034 −0.4560 1.6579 −0.0350 −0.0849Aug 11.5076 −0.0535 −0.0186 1.7213 −0.0141 −0.0328 1.6311 −0.0100 −0.0245Sep 11.1786 −1.0151 −0.3632 1.6596 −0.1694 −0.4083 1.5993 −0.0400 −0.1000Oct 11.6236 −1.1407 −0.3926 1.6872 −0.1807 −0.4292 1.6478 −0.0800 −0.1942Nov 11.4696 −1.1010 −0.3840 1.6480 −0.1938 −0.4709 1.6411 −0.0950 −0.2316Dec 11.5305 −1.2014 −0.4166 1.6691 −0.1898 −0.4554 1.6148 −0.0900 −0.2229
2010 Jan 11.7597 −0.9228 −0.3139 1.6887 −0.1987 −0.4713 1.6020 −0.1050 −0.2622
1 Forward margins: foreign currency at a premium-/discount+;ster ling at a discount-/premium+.
2 Discontinued series due to the introduction of the Euro.
Source: Bank of England
138
Page 6
7.1C Interest rate differentials and exchang e rates(13.3)Last working day
Percent per annum Exchange rates against
Ster ling 3 month sterling LIBOR London goldInterest Interbank and interest differentials price per
Interest on on US $ offered between the UK and fine troy Special Drawing Rights of EuroUS Treasur y deposits in rate in oz. (p.m.
bills London London fixing)(3 months) (3 months) (3 months) Ger many Japan US US $ £ Ster ling US $ Yen £ ster ling US $
LUST AJIB AJWR AJHZ AJIW AFBI AJIF AJIG AJIH DEPL THAO THAT2005 3.92 4.51 4.58 2.10 4.52 0.09 513.0000 0.8301 1.4293 168.0390 1.4552 0.84772006 4.89 5.34 5.28 1.57 4.72 −0.05 635.7000 0.7664 1.5044 178.8130 1.4841 0.75842007 3.29 4.77 5.95 1.27 5.06 1.18 833.7500 0.7888 1.5803 177.2250 1.3619 0.68402008 0.11 1.41 2.83 0.01 2.07 1.49 869.7500 1.0566 1.5403 139.3020 1.0342 0.71942009 0.05 0.48 0.63 0.05 0.42 0.22 1 087.5000 0.9680 1.5677 144.8860 1.1255 0.6970
2006 Jan 4.37 4.69 4.53 1.99 4.47 −0.15 568.7500 0.8160 1.4454 169.2850 1.4639 0.8236Feb 4.51 4.81 4.52 1.87 4.44 −0.28 556.0000 0.8217 1.4350 166.9080 1.4688 0.8388Mar 4.52 4.98 4.55 1.74 4.45 −0.42 582.0000 0.8305 1.4409 169.6310 1.4332 0.8263Apr 4.66 5.10 4.62 1.78 4.52 −0.47 644.0000 0.8134 1.4711 167.9510 1.4432 0.7939May 4.74 5.22 4.67 1.75 4.38 −0.54 653.0000 0.7948 1.4942 167.2440 1.4571 0.7787Jun 4.88 5.46 4.72 1.67 4.38 −0.73 613.5000 0.8065 1.4794 169.5650 1.4463 0.7820
Jul 4.97 5.43 4.74 1.58 4.33 −0.69 632.5000 0.7959 1.4839 169.8290 1.4631 0.7836Aug 4.92 5.37 4.95 1.69 4.55 −0.42 623.5000 0.7803 1.4885 174.3500 1.4858 0.7813Sep 4.77 5.33 5.04 1.63 4.62 −0.28 599.2500 0.7894 1.4764 174.1540 1.4749 0.7895Oct 4.95 5.35 5.15 1.59 4.72 −0.19 603.7500 0.7795 1.4800 174.4670 1.4943 0.7835Nov 4.90 5.33 5.21 1.58 4.71 −0.11 646.7000 0.7707 1.5077 175.2590 1.4840 0.7544Dec 4.89 5.34 5.28 1.57 4.72 −0.05 635.7000 0.7664 1.5044 178.8130 1.4841 0.7584
2007 Jan 4.99 5.32 5.55 1.77 5.03 0.23 650.5000 0.7632 1.4902 181.0830 1.5063 0.7695Feb 5.01 5.30 5.49 1.65 4.79 0.20 664.2000 0.7690 1.5047 178.4000 1.4836 0.7569Mar 4.91 5.31 5.57 1.65 4.91 0.27 661.7500 0.7713 1.5102 178.2780 1.4733 0.7512Apr 4.79 5.33 5.68 1.68 5.03 0.37 677.0000 0.7642 1.5242 182.2310 1.4654 0.7328May 4.60 5.34 5.77 1.66 5.09 0.44 659.1000 0.7651 1.5129 184.0230 1.4702 0.7432Jun 4.68 5.35 5.96 1.81 5.22 0.64 650.5000 0.7559 1.5156 187.0210 1.4857 0.7405
Jul 4.82 5.33 6.01 1.76 5.24 0.69 665.5000 0.7538 1.5312 182.7370 1.4843 0.7304Aug 3.91 5.61 6.60 1.91 5.68 1.04 672.0000 0.7588 1.5326 178.5210 1.4795 0.7335Sep 3.62 5.33 6.23 1.49 5.25 0.95 743.0000 0.7663 1.5567 179.4660 1.4324 0.7030Oct 3.84 4.85 6.21 1.65 5.35 1.40 789.5000 0.7580 1.5719 180.9720 1.4358 0.6911Nov 2.92 5.23 6.56 1.77 5.59 1.36 783.5000 0.7695 1.5902 175.9850 1.4006 0.6812Dec 3.29 4.77 5.95 1.27 5.06 1.18 833.7500 0.7888 1.5803 177.2250 1.3619 0.6840
2008 Jan 1.92 3.06 5.54 1.20 4.71 2.53 923.2500 0.8000 1.5953 169.4020 1.3428 0.6754Feb 1.81 2.96 5.70 1.33 4.76 2.76 971.5000 0.8120 1.6106 167.8680 1.3104 0.6588Mar 1.36 3.00 5.99 1.29 5.11 3.03 933.5000 0.8270 1.6445 163.8740 1.2543 0.6311Apr 1.44 3.06 5.80 0.98 4.92 2.79 871.0000 0.8256 1.6238 169.1170 1.2718 0.6422May 1.85 2.98 5.84 1.01 4.95 2.90 885.7500 0.8212 1.6207 170.9830 1.2716 0.6435Jun 1.87 2.99 5.91 0.99 5.01 2.95 930.2500 0.8202 1.6336 172.2980 1.2632 0.6347
Jul 1.67 2.86 5.77 0.83 4.89 2.93 918.0000 0.8200 1.6200 175.4500 1.2696 0.6409Aug 1.69 2.99 5.73 0.79 4.87 2.77 832.5000 0.8584 1.5699 170.7560 1.2388 0.6793Sep 0.90 5.32 6.23 1.03 5.29 0.98 884.5000 0.8652 1.5572 163.6480 1.2684 0.7117Oct 0.44 2.85 5.93 1.23 5.06 3.15 730.7500 0.9202 1.4883 145.1990 1.2745 0.7888Nov 0.01 3.78 3.98 0.25 3.17 0.33 814.5000 0.9702 1.4880 141.7890 1.2095 0.7882Dec 0.11 1.41 2.83 0.01 2.07 1.49 869.7500 1.0566 1.5403 139.3020 1.0342 0.7194
2009 Jan 0.24 1.58 2.13 0.16 1.58 0.68 919.5000 1.0432 1.4919 133.7800 1.1249 0.7803Feb 0.26 1.60 2.05 0.32 1.51 0.56 952.0000 1.0337 1.4674 143.3330 1.1224 0.7874Mar 0.13 1.16 1.65 0.19 1.10 0.54 916.5000 1.0426 1.4951 147.1300 1.0794 0.7532Apr 0.14 1.35 1.38 0.09 0.90 0.10 883.2500 1.0104 1.4978 147.0270 1.1184 0.7547May 0.14 0.77 1.23 0.03 0.78 0.53 975.5000 0.9584 1.5481 148.2880 1.1392 0.7065Jun 0.20 0.92 1.18 0.11 0.75 0.28 934.5000 0.9373 1.5522 148.9670 1.1739 0.7129
Jul 0.18 0.66 0.90 0.04 0.49 0.24 939.0000 0.9377 1.5533 148.6070 1.1694 0.7054Aug 0.15 0.36 0.70 −0.10 0.31 0.34 955.5000 0.9580 1.5639 146.8210 1.1348 0.6957Sep 0.14 0.58 0.58 −0.11 0.25 0.02 995.7500 0.9833 1.5844 141.7850 1.0941 0.6841Oct 0.07 0.51 0.60 0.03 0.37 0.19 1 040.0000 0.9624 1.5899 145.0300 1.1168 0.6778Nov 0.06 0.28 0.60 0.02 0.40 0.42 1 175.7500 0.9775 1.6102 139.0710 1.0931 0.6661Dec 0.05 0.48 0.63 0.05 0.42 0.22 1 087.5000 0.9680 1.5677 144.8860 1.1255 0.6970
2010 Jan 0.08 0.46 0.60 0.09 0.45 0.24 1 078.5000 0.9631 1.5542 140.2500 1.1525 0.7194
Source: Bank of England
139
Page 7
7.1D British government securities:clean prices and yields 1
Last working Friday of the period
Pr incipal Pr incipal Pr incipalStr ip Str ip Str ip
7 June 2021 7 March 2025 7 June 2032
Gross redemption Gross redemption Gross redemptionPr ice £ yield % per annum Price £ yield % per annum Price £ yield % per annum
Clean prices and yields1
GPVK GPVL OEVO OEVP GPVN GPVO2008 Feb 54.35 4.650 46.46 4.557 34.660 4.415
Mar 53.85 4.750 45.88 4.654 34.420 4.459Apr 52.15 5.029 44.39 4.875 33.140 4.633May 51.60 5.148 43.92 4.969 33.130 4.653Jun 51.76 5.156 43.98 4.983 33.280 4.649
Jul 51.88 5.169 44.01 5.001 33.180 4.677Aug 55.08 4.727 46.41 4.703 34.070 4.487Sep 54.75 4.805 45.77 4.810 33.500 4.670Oct 54.52 4.876 44.29 5.045 91.760 4.839Nov 59.15 4.239 47.14 4.677 34.680 4.554Dec 63.05 3.735 50.22 4.295 37.920 4.176
2009 Jan 59.50 4.250 47.04 4.742 33.240 4.774Feb 61.39 4.017 47.26 4.735 33.790 4.718Mar 64.52 3.628 51.75 4.178 37.810 4.239Apr 62.47 3.926 49.05 4.545 35.540 4.529May 61.37 4.105 48.68 4.619 34.730 4.648Jun 62.26 4.010 49.82 4.492 35.510 4.565
Jul 61.80 4.105 48.58 4.682 34.330 4.735Aug 63.68 3.873 53.13 4.117 38.990 4.180Sep 62.68 4.036 53.14 4.137 39.230 4.166Oct 62.84 4.046 52.18 4.284 38.520 4.267Nov 63.62 3.960 52.09 4.320 38.590 4.273Dec 62.16 4.192 50.95 4.484 37.586 4.404
2010 Jan 61.44 4.340 50.19 4.620 36.720 4.534
5.75% Treasur y 6.25% Treasur y 9% Conversion 5% Treasur yStock 2009 Stock 2010 Loan 2011 Stock 2012
Gross redemption Gross redemption Gross redemption Gross redemptionClean yield % per Clean yield % per Clean yield % per Clean yield % per
pr ice £ annum price £ annum price £ annum price £ annum
Clean prices and yields1
IDZQ IDKW IDKX IDKY IDKZ IDOJ GPVQ GPVR2008 Feb 102.85 4.054 105.76 3.997 115.120 4.131 104.22 4.158
Mar 102.82 3.999 105.70 3.961 115.090 4.042 103.58 4.007Apr 93.12 4.477 104.26 4.478 112.800 4.652 101.65 4.528May 101.09 4.994 102.93 4.978 111.090 5.095 100.19 4.941Jun 100.92 5.075 102.67 5.053 110.640 5.164 99.72 5.082
Jul 93.53 4.980 102.95 4.888 110.800 5.022 100.20 4.937Aug 101.39 4.632 103.84 4.420 111.940 4.502 101.87 4.420Sep 101.90 4.090 104.25 4.164 112.200 4.300 102.16 4.317Oct 103.32 2.645 106.75 2.851 114.410 3.350 104.34 3.609Nov 104.04 1.724 107.94 2.140 115.700 2.740 106.04 3.041Dec 104.91 0.606 109.54 1.221 117.180 2.066 107.70 2.486
2009 Jan 104.47 0.894 109.28 1.057 117.750 1.563 109.37 2.320Feb 103.94 0.589 109.03 0.978 117.470 1.456 109.06 1.893Mar 99.69 0.458 108.77 0.881 117.480 1.209 108.48 2.007Apr 99.73 0.452 108.45 0.809 116.650 1.294 108.43 1.945May 99.71 0.563 108.03 0.786 115.980 1.307 108.24 1.926Jun 102.23 0.601 107.27 1.005 114.800 1.565 107.15 2.240
Jul 101.85 0.366 107.04 0.833 114.330 1.480 107.11 2.167Aug 101.43 0.345 106.90 0.614 114.460 1.127 107.94 1.760Sep 101.04 0.304 106.51 0.598 114.170 0.984 108.31 1.520Oct 99.96 0.451 105.87 0.695 113.210 1.101 107.76 1.614Nov 100.00 − 105.50 0.646 112.930 0.923 108.02 1.394Dec .. .. 105.32 0.497 112.650 0.821 107.98 1.323
2010 Jan .. .. 104.58 0.588 111.570 0.919 107.21 1.489
Nominal amount outstanding at end of year: £ million
IDLF IDLG IDLH GPVS2008 14 096 6 111 6 650 24 4332009 .. 6 720 7 312 26 867
1 Clean price excludes accrued interest.2 Data from November 1998 have been supplied by the UK Debt Manage-
ment Office(DMO), whilst earlier data were provided by the Bank of Eng-land.
Source: UK Debt Management Office
140
Page 8
7.1D British government securities:clean prices and yields 1
Last working Friday of the periodcontinued
8% Treasur y 8.75% Treasur y 8% Treasur y 6% Treasur y 4.25% Treasur y 4.75% Treasur y 4.25% Treasur yStock 2015 Stock 2017 Stock 2021 Stock 2028 Stock 2032 Stock 2038 Gilt 2055
Gross Gross Gross Gross Gross Gross Grossredempti- redempti- redempti- redempti- redempti- redempti- redempti-
on yield on yield on yield on yield on yield on yield on yieldClean % per Clean % per Clean % per Clean % per Clean % per Clean % per Clean % per
pr ice £ annum. price £ annum. price £ annum. price £ annum. price £ annum. price £ annum price £ annum
Clean prices and yields1
IDWZ IDZC AJRG AJRH IDZD IHZG IHZH IHZI IHZJ BMCY A5FN A5FO E7S4 E7S52008 Feb 122.98 4.463 132.290 4.524 133.730 4.578 119.480 4.540 96.97 4.455 106.14 4.384 100.12 4.244
Mar 124.02 4.296 132.680 4.457 133.030 4.625 118.410 4.609 96.49 4.489 106.03 4.390 100.79 4.211Apr 120.56 4.748 128.760 4.874 129.230 4.950 115.240 4.824 93.50 4.703 103.06 4.563 98.61 4.319May 118.39 5.030 126.560 5.104 127.290 5.104 113.600 4.938 92.36 4.789 102.71 4.584 15.91 3.906Jun 117.20 5.183 125.480 5.213 126.770 5.141 113.180 4.966 92.06 4.812 102.25 4.612 98.57 4.321
Jul 117.80 5.071 126.370 5.086 126.850 5.123 113.390 4.948 92.03 4.815 102.10 4.620 98.08 4.345Aug 121.13 4.550 130.350 4.588 131.940 4.652 117.610 4.648 95.50 4.562 106.15 4.381 100.97 4.202Sep 120.83 4.566 129.850 4.622 130.990 4.724 116.300 4.737 93.67 4.695 103.56 4.532 96.76 4.414Oct 121.46 4.439 129.880 4.587 131.070 4.702 114.290 4.876 91.76 4.839 103.88 4.513 98.73 4.313Nov 125.90 3.765 135.870 3.869 138.400 4.057 119.940 4.481 97.27 4.438 110.82 4.119 105.21 4.003Dec 128.95 3.308 140.190 3.368 144.560 3.544 126.260 4.066 103.12 4.043 116.43 3.824 111.05 3.748
2009 Jan 127.07 3.514 135.360 3.860 138.630 4.002 119.310 4.516 95.69 4.551 105.83 4.379 98.74 4.313Feb 129.51 3.126 138.570 3.465 141.660 3.735 120.460 4.434 96.74 4.477 106.95 4.332 98.93 4.303Mar 133.00 2.590 143.520 2.881 146.100 3.358 127.860 3.950 103.43 4.021 109.88 4.167 98.57 4.321Apr 131.59 2.736 140.380 3.186 142.390 3.638 122.860 4.267 99.27 4.230 106.62 4.350 98.16 4.342May 131.47 2.700 138.940 3.308 140.190 3.802 121.580 4.348 97.66 4.413 102.98 4.565 93.98 4.563Jun 129.48 2.938 139.280 3.230 140.400 3.766 123.110 4.242 98.79 4.334 105.84 4.394 98.19 4.341
Jul 127.39 3.195 136.710 3.486 139.040 3.861 120.000 4.447 96.26 4.514 103.99 4.503 96.48 4.430Aug 129.35 2.850 138.710 3.212 141.630 3.622 129.240 3.838 103.82 3.993 110.55 4.125 103.48 4.082Sep 128.97 2.859 137.670 3.298 140.080 3.736 128.030 3.906 103.42 4.019 110.80 4.111 103.75 4.069Oct 127.91 2.961 137.740 3.242 139.540 3.761 125.660 4.056 101.96 4.116 110.32 4.137 103.31 4.090Nov 128.00 2.897 138.000 3.171 140.270 3.680 125.760 4.045 102.15 4.103 110.71 4.114 104.40 4.039Dec 127.58 2.925 136.050 3.380 137.720 3.889 123.430 4.196 100.17 4.238 108.87 4.217 103.32 4.089
2010 Jan 125.91 3.116 134.270 3.804 135.710 4.044 121.420 4.326 98.11 4.383 106.05 4.378 99.57 4.271
Nominal amount outstanding at end of year: £ million
IDLI AJPS IDLJ IDLK IDLL A5FP E7S62008 9 092 9 551 20 631 14 489 20 342 17 561 17 4132009 9 998 10 502 22 686 16 932 24 618 20 227 20 147
2.5% Consolidated 2.5% Treasur y2 2.5% Treasur y2 2.5% Treasur y2 2% Treasur y2 1.25% Treasur yStock 3.5% War Loan Index-linked 2011 Index-linked 2016 Index-linked 2024 Index-linked 2035 Index-linked 2055
Gross Gross Gross Gross Gross Gross Grossredempti- redempti- redempti- redempti- redempti- redempti- redempti-
on yield on yield on yield on yield on yield on yield Real on yieldClean % per Clean % per Clean % per Clean % per Clean % per Clean % per clean % per
pr ice £ annum. price £ annum. price £ annum. price £ annum. price £ annum. price £ annum price £ annum
Clean prices1 and yields2
AJLE AJLF AJLG AJLH HRZR HSEU AJLS AJLT AJOO AJOP A5FQ A5FR E7RZ E7S22008 Feb 55.24 4.526 78.72 4.446 290.75 1.023 277.53 1.267 256.12 1.086 153.80 0.785 125.69 0.626
Mar 55.15 4.533 78.59 4.453 294.31 0.843 285.22 0.993 258.18 1.076 155.34 0.770 127.54 0.587Apr 53.04 4.713 75.53 4.634 288.69 1.507 275.17 1.500 252.26 1.264 152.88 0.856 128.93 0.557May 52.58 4.755 74.87 4.675 289.46 1.692 275.00 1.624 254.01 1.275 156.61 0.784 135.42 0.425Jun 52.30 4.780 74.47 4.699 291.86 1.564 280.37 1.420 262.60 1.061 163.42 0.607 138.53 0.364
Jul 52.19 4.790 74.30 4.710 290.16 2.000 273.99 1.833 256.89 1.275 53.07 4.710 132.40 0.483Aug 55.02 4.544 78.41 4.463 294.48 1.436 286.74 1.179 273.40 0.798 170.12 0.444 139.91 0.335Sep 53.20 4.699 75.77 4.619 292.47 1.761 280.35 1.525 259.07 1.216 157.59 0.812 127.34 0.586Oct 52.59 4.754 74.88 4.674 286.96 2.657 256.61 2.860 253.10 1.991 145.22 1.224 117.77 0.796Nov 56.81 4.401 81.01 4.320 271.50 4.656 245.46 3.460 229.53 2.148 146.35 1.169 113.98 0.886Dec 61.38 4.072 87.65 3.993 281.88 2.894 268.90 2.012 242.78 1.649 155.76 0.830 125.20 0.629
2009 Jan 53.79 4.648 76.62 4.568 290.65 1.121 276.44 1.406 247.12 1.405 155.04 0.784 124.15 0.650Feb 54.79 4.563 78.07 4.483 288.63 0.818 277.33 1.152 240.60 1.504 140.65 1.184 106.81 1.065Mar 56.86 4.397 81.07 4.317 290.42 0.757 280.46 1.061 248.80 1.287 146.70 1.008 118.68 0.772Apr 54.38 4.597 77.48 4.517 291.16 0.562 279.67 1.080 246.41 1.352 144.93 1.062 118.39 0.778May 52.29 4.781 74.45 4.701 292.68 0.297 281.39 0.986 251.50 1.195 149.26 0.922 117.02 0.810Jun 54.44 4.592 77.56 4.512 292.91 0.467 280.26 1.125 253.78 1.166 155.76 0.743 124.51 0.639
Jul 52.87 4.729 75.29 4.648 296.29 − 277.96 1.283 248.62 1.344 153.92 0.811 126.48 0.595Aug 57.51 4.347 82.02 4.267 299.51 − 284.91 0.881 258.59 1.028 159.19 0.645 131.09 0.496Sep 57.30 4.363 81.72 4.283 300.21 − 287.18 0.808 257.36 1.094 157.16 0.725 134.27 0.430Oct 55.77 4.483 79.49 4.403 302.16 − 292.00 0.593 264.29 0.911 163.08 0.565 137.76 0.360Nov 56.10 4.463 79.84 4.384 303.03 −1.124 293.81 0.521 266.89 0.850 164.79 0.525 136.72 0.379Dec 54.62 4.577 77.82 4.497 304.45 −1.405 295.13 0.466 267.00 0.858 164.91 0.529 140.71 0.300
2010 Jan 52.73 4.741 75.08 4.661 306.83 −1.709 295.32 0.544 261.03 1.088 157.00 0.799 132.76 0.457
Nominal amount outstanding at end of year: £ million
AJJK AJJL HKUN AJIX AJOT A5FS E7S32008 186 1 939 4 803 7 982 6 827 9 738 6 4342009 181 17 13 626 20 684 14 784 11 864 7 233
1 Clean price excludes accrued interest.2 These yields assume a constant annual rate of inflation of 3% from the pub-
lished RPI for the eighth month prior to the dividend date.3 Data from November 1998 have been supplied by the UK Debt Manage-
ment Office(DMO), whilst earlier data were provided by the Bank of Eng-land.
Source: UK Debt Management Office
141
Page 9
7.1E British government securities:yield curve dataLast working day
Nominal Zero Coupon Yields Nominal Forward Rates
5 years 10 years 20 years 5 years 10 years 20 years1
SNZC MNZC LNZC AJRM AJRN AJRO2002 4.17 4.40 4.48 4.59 4.63 4.392003 4.61 4.77 4.69 4.93 4.87 4.362004 4.43 4.49 4.41 4.52 4.54 4.082005 4.10 4.05 3.96 4.07 3.98 3.722006 4.91 4.63 4.25 4.60 4.19 3.52
2007 4.41 4.52 4.39 4.66 4.51 4.002008 2.71 3.41 4.07 3.94 4.35 4.322009 2.98 4.20 4.59 4.86 5.58 4.38
2007 Feb 4.97 4.68 4.31 4.62 4.21 3.60Mar 5.13 4.85 4.47 4.84 4.37 3.76Apr 5.19 4.93 4.55 4.89 4.48 3.84May 5.45 5.13 4.70 5.09 4.59 3.89Jun 5.63 5.36 4.89 5.40 4.81 4.02
Jul 5.35 5.12 4.66 5.14 4.63 3.77Aug 5.12 4.93 4.55 4.96 4.54 3.80Sep 4.98 4.95 4.64 5.04 4.74 4.00Oct 4.94 4.87 4.59 4.87 4.68 3.99Nov 4.57 4.64 4.52 4.75 4.63 4.14Dec 4.41 4.52 4.39 4.66 4.51 4.00
2008 Jan 4.30 4.49 4.42 4.57 4.66 4.05Feb 4.20 4.53 4.50 4.69 4.85 4.09Mar 3.95 4.42 4.60 4.43 5.21 4.09Apr 4.44 4.73 4.71 4.74 5.18 4.03May 4.94 5.00 4.83 4.93 5.15 3.94Jun 5.17 5.17 4.90 5.19 5.11 3.99
Jul 4.77 4.84 4.74 4.80 5.03 3.99Aug 4.41 4.52 4.60 4.45 4.81 4.22Sep 4.21 4.51 4.69 4.55 5.04 4.45Oct 3.97 4.71 4.93 5.16 5.51 4.47Nov 3.37 4.03 4.57 4.36 5.00 4.49Dec 2.71 3.41 4.07 3.94 4.35 4.32
2009 Jan 2.88 4.09 4.70 4.78 5.43 4.95Feb 2.62 3.82 4.72 4.29 5.49 5.05Mar 2.45 3.31 4.26 3.57 4.83 5.10Apr 2.59 3.64 4.58 3.93 5.39 5.07May 2.72 3.81 4.71 4.08 5.63 5.28Jun 2.97 3.70 4.57 3.91 5.13 5.12
Jul 3.08 3.91 4.74 4.27 5.28 5.21Aug 2.69 3.63 4.11 4.02 4.88 4.48Sep 2.68 3.71 4.15 4.17 5.00 4.27Oct 2.77 3.77 4.28 4.25 5.07 4.35Nov 2.66 3.70 4.24 4.28 5.00 4.33Dec 2.98 4.20 4.59 4.86 5.58 4.38
2010 Jan 2.94 4.11 4.53 4.77 5.44 4.43
The model used to derive these estimates is spline-based technique,known as the "Var iable Roughness Penalty" (VRP) model which replacesthe for merly used Svensson method.
1 Data are missing for October 85 to May 86, and August 91 to Januar y 92 asyields can only be calculated for maturities where gilts exist.
Source: Bank of England
142
Page 10
7.1F Cer tificates of tax deposit (13.6)Rate of interest (gross) per cent at date of chang e
When applied in payment When applied in paymentof a scheduled liability of a scheduled liability
Deposits Deposits When Deposits Deposits Whenof £100,000 under withdrawn of £100,000 under withdrawn
and over1 £100,000 for cash and over1 £100,000 for cash
Ser ies 6 Ser ies 6 Aug 8 4.50-6.00 4.50 2.25-3.001988 Jan 7 7.5-8.75 7.5 5.0
Jan 25 7.5-8.75 7.5 5.0 Nov 7 4.00-6.50 4.00 2.00-3.25Jan 26 7.5-8.5 7.5 5.0Mar 14 7.5-8.5 7.5 5.0 1998 Jun 5 4.00-6.50 4.00 2.00-3.25Mar 22 7.0-8.0 7.0 5.0 Oct 9 3.75-6.25 3.75 2.00-3.25Apr 11 6.5-7.5 6.5 5.0 Nov 6 3.25-5.75 3.25 1.75-3.00Apr 20 6.5-7.5 6.5 5.0May 18 6.0-7.0 6.0 5.0 Dec 11 3.00-5.25 3.25 1.75-2.75Jun 7 6.0-7.5 6.0 5.0Jun 23 6.0-8.0 6.0 5.0 1999 Jan 8 2.50-5.00 2.50 1.25-2.50Jun 29 6.5-8.5 6.5 5.0 Feb 5 1.75-4.50 1.75 1.00-2.25Jul 5 7.0-9.0 7.0 5.0 Apr 9 1.75-4.25 1.75 1.00-2.25Jul 20 7.5-9.5 7.0 5.0 Jun 11 1.50-4.00 1.50 0.75-2.00Aug 9 8.0-9.5 8.0 5.0 Sep 9 1.75-4.50 1.75 1.00-2.25Aug 30 9.0-10.5 9.0 5.0 Nov 4 2.00-5.00 2.00 1.00-2.50Nov 8 8.5-10.0 8.5 5.0Dec 1 9.5-11.0 9.5 5.0 2000 Jan 14 2.25-5.25 2.25 1.25-2.75
Feb 11 2.50-5.25 2.50 1.25-2.751989 May 25 10.5-12.0 10.5 5.0
Oct 9 11.5-13.0 11.5 5.0 2001 Feb 9 2.25-4.75 2.25 1.25-2.50Apr 6 2.00-4.25 2.00 1.00-2.25
1990 Oct 8 10.5-12.0 10.5 5.0 May 11 2.00-4.00 2.00 1.00-2.00Aug 3 1.50-4.00 1.50 0.75-2.00
1991 Feb 14 10.0-12.0 10.0 5.0 Sep 19 1.25-3.50 1.25 0.75-1.75Feb 28 9.5-11.5 9.5 5.0 Oct 5 1.00-3.25 1.00 0.50-1.50Mar 25 9.0-11.0 9.0 5.0 Nov 9 0.50-2.75 0.50 0.25-1.50Apr 15 8.5-11.0 8.5 5.0May 28 8.0-10.5 8.0 5.0 2003 Feb 7 0.25-2.75 0.25 0.00-1.25Jul 15 7.5-10.0 7.5 5.0 Jul 11 0.00-2.50 0.00 0.00-1.25Sep 5 7.0-9.5 7.0 5.0 Nov 7 0.25-3.00 0.25 0.00-1.50
1992 May 6 6.5-9.0 7.0 5.0 2004 Feb 6 0.50-3.00 0.50 0.25-1.50Sep 23 5.5-7.5 5.5 5.0 May 7 0.75-3.25 0.75 0.25-1.5Oct 20 4.75-7.0 4.75 4.0 Jun 11 1.00-3.75 1.00 0.50-1.75Nov 16 3.5-6.0 3.5 1.75-3.0 Aug 6 1.25-3.75 1.25 0.50-1.75
1993 Jan 27 2.75-5.25 2.75 1.25-2.5 2005 Aug 5 1.00-3.50 1.00 0.50-1.75
Ser ies 7 Ser ies 7 2006 Aug 4 1.75-4.25 1.75 0.75-2.00Nov 10 1.50-4.00 1.50 0.75-2.00
1993 Nov 24 1.75-4.25 1.75 1.00-2.252007 Jan 12 1.50-4.25 1.50 0.75-2.00
1994 Feb 9 1.50-4.00 1.50 0.75-2.00Sep 13 2.00-5.50 2.00 1.00-2.75 May 11 2.00-4.75 2.00 1.00-2.25Dec 8 2.50-6.00 2.50 1.25-3.00
July 6 2.25-5.00 2.25 1.10-2.501995 Feb 3 3.00-6.25 3.00 1.50-3.25
Dec 14 2.50-5.50 2.50 1.25-2.50 December 7 3.00-5.50 3.00 1.50-2.75
1996 Jan 19 2.75-4.75 2.75 1.50-2.75 2008 Febr uary 8 2.00-4.50 2.00 1.00-2.25Mar 11 2.50-5.00 2.50 1.25-2.50Jun 7 2.25-4.75 2.25 1.25-2.50 October 9 2.50-5.25 2.50 2.50-1.25Oct 31 2.50-5.00 2.50 1.25-2.75 November 7 1.75-4.50 1.75 2.25-0.75
December 5 0.00-2.50 0.00 1.25-0.001997 May 7 2.75-5.50 2.75 1.50-2.75
Jun 9 3.00-5.50 3.00 1.50-2.75 2009 Januar y 9 0.00-1.50 0.00 0.00-0.75Jul 11 3.25-6.00 3.25 1.75-3.00 Febr uary 6 0.00-1.00 0.00 0.00-0.50
March 6 0.00-0.75 0.00 0.00-0.25
1 Rate depends on length of time for which deposits held Source: Board of Inland Revenue
143
Page 11
7.1G Company security prices and gross yields
Last wor king day - Price indices
FTSE 250:FT 30 FTSE 100: 31 December FTSE 350: FTSE All-share:
1 July 1935=100 1 Januar y 1984=1000 1985=1412.60 31 December 1985=682.94 10 April 1962=100 FTSE FTSEEurotop 100 Eurotop 300
Dividend Dividend Dividend Dividend Dividend 2 Jan 1990 31 Dec 1985Index yield Index yield Index yield Index yield Index yield =1000 =307.32
HSEF A5GC HSEG A5FW HSEJ A5FX HSEK A5FY HSEL A5FZ ZPVF ZPVG2005 2 389.6 3.1 5 618.8 3.1 8 794.3 2.3 2 896.7 3.0 2 847.0 3.0 2 751.4 1 275.52006 2 859.6 2.8 6 220.8 3.1 11 177.8 2.0 3 272.7 2.9 3 221.4 2.9 3 092.8 1 483.52007 2 741.6 3.1 6 456.9 3.1 10 657.9 2.5 3 356.0 3.0 3 286.7 3.0 3 167.4 1 506.62008 1 635.2 4.1 4 434.2 4.4 6 360.9 4.8 2 268.1 4.5 2 209.3 4.5 1 798.7 832.02009 1 938.5 3.1 5 412.9 3.3 9 306.9 2.5 2 823.7 3.2 2 760.8 3.2 2 232.4 1 045.2
2007 Apr 3 049.6 2.8 6 449.2 3.0 11 929.4 1.9 3 408.1 2.8 3 355.6 2.8 3 244.1 1 570.2May 3 175.6 2.9 6 621.5 2.9 12 111.1 1.9 3 493.1 2.8 3 438.7 2.7 3 323.0 1 611.4Jun 3 093.1 3.0 6 607.9 2.9 11 527.6 2.0 3 461.5 2.8 3 404.1 2.8 3 328.8 1 605.3
Jul 2 890.7 3.2 6 360.1 3.0 11 337.5 2.1 3 342.2 2.9 3 289.1 2.9 3 211.8 1 549.9Aug 2 919.5 3.2 6 303.3 3.1 11 309.2 2.1 3 315.5 3.0 3 260.5 2.9 3 191.3 1 535.3Sep 2 865.4 3.1 6 466.8 3.0 11 037.4 2.2 3 377.0 2.9 3 316.9 2.9 3 248.6 1 550.9Oct 2 979.7 3.0 6 721.6 3.0 11 666.0 2.0 3 518.4 2.8 3 454.1 2.8 3 335.9 1 595.7Nov 2 740.5 3.2 6 432.5 3.2 10 748.8 2.3 3 349.1 3.0 3 280.9 3.0 3 209.5 1 526.6Dec 2 741.6 3.1 6 456.9 3.1 10 657.9 2.5 3 356.0 3.0 3 286.7 3.0 3 167.4 1 506.6
2008 Jan 2 560.1 3.3 5 879.8 3.5 9 881.8 2.7 3 063.3 3.4 3 000.1 3.3 2 791.9 1 329.5Feb 2 492.2 3.3 5 884.3 3.7 10 067.9 2.8 3 073.0 3.6 3 013.0 3.6 2 757.2 1 315.3Mar 2 434.8 3.4 5 702.1 3.9 10 013.2 3.0 2 988.3 3.8 2 927.1 3.8 2 636.4 1 262.1Apr 2 516.7 3.1 6 089.4 3.7 10 007.4 3.1 3 163.6 3.6 3 095.7 3.6 2 806.8 1 337.7May 2 493.0 3.2 6 053.5 3.9 10 049.3 3.1 3 148.9 3.8 3 082.3 3.7 2 783.4 1 334.4Jun 2 203.9 3.5 5 625.9 4.2 9 145.8 3.6 2 918.8 4.1 2 855.7 4.1 2 522.4 1 201.4
Jul 2 162.6 3.5 5 411.9 4.3 8 856.7 3.9 2 810.1 4.3 2 749.2 4.3 2 493.4 1 180.0Aug 2 295.8 3.3 5 636.6 4.1 9 381.8 3.6 2 933.0 4.0 2 868.7 4.0 2 515.4 1 194.7Sep 1 955.4 3.8 4 902.5 4.7 7 888.2 4.2 2 540.4 4.6 2 483.7 4.6 2 268.8 1 063.7Oct 1 626.6 4.3 4 377.3 5.3 6 282.6 5.1 2 238.9 5.3 2 183.7 5.3 2 008.1 928.8Nov 1 589.3 4.3 4 288.0 4.6 6 093.3 5.1 2 191.0 4.7 2 134.0 4.7 1 868.2 862.1Dec 1 635.2 4.1 4 434.2 4.4 6 360.9 4.8 2 268.1 4.5 2 209.3 4.5 1 798.7 832.0
2009 Jan 1 357.3 4.6 4 149.6 4.8 6 250.8 4.9 2 133.3 4.8 2 078.9 4.8 1 717.6 796.8Feb 1 257.3 4.9 3 915.6 5.2 6 123.8 4.7 2 021.0 5.2 1 970.2 5.2 1 577.6 732.5Mar 1 363.4 4.7 3 926.1 5.2 6 373.9 4.2 2 034.8 5.1 1 984.2 5.1 1 580.2 733.7Apr 1 558.7 4.1 4 243.7 5.0 7 529.0 3.4 2 222.1 4.8 2 173.1 4.8 1 771.3 828.6May 1 584.6 4.1 4 417.9 4.8 7 572.0 3.4 2 303.8 4.6 2 252.6 4.6 1 846.9 862.2Jun 1 549.6 4.1 4 249.2 4.7 7 414.6 3.5 2 220.5 4.6 2 172.1 4.6 1 821.2 850.2
Jul 1 701.2 3.8 4 608.4 4.3 8 000.0 3.1 2 406.7 4.1 2 353.5 4.1 1 988.4 928.8Aug 1 798.4 3.7 4 908.9 3.6 8 817.5 2.7 2 574.4 3.5 2 520.7 3.5 2 084.6 978.3Sep 1 892.2 3.3 5 133.9 3.4 9 142.3 2.6 2 689.6 3.3 2 634.8 3.3 2 119.8 997.6Oct 1 827.0 3.3 5 044.6 3.5 8 885.8 2.7 2 639.3 3.4 2 584.6 3.4 2 081.9 976.5Nov 1 895.5 3.2 5 190.7 3.5 8 918.4 2.7 2 707.6 3.4 2 648.4 3.4 2 099.6 985.3Dec 1 938.5 3.1 5 412.9 3.3 9 306.9 2.5 2 823.7 3.2 2 760.8 3.2 2 232.4 1 045.2
Source: FTSE Group
144
Page 12
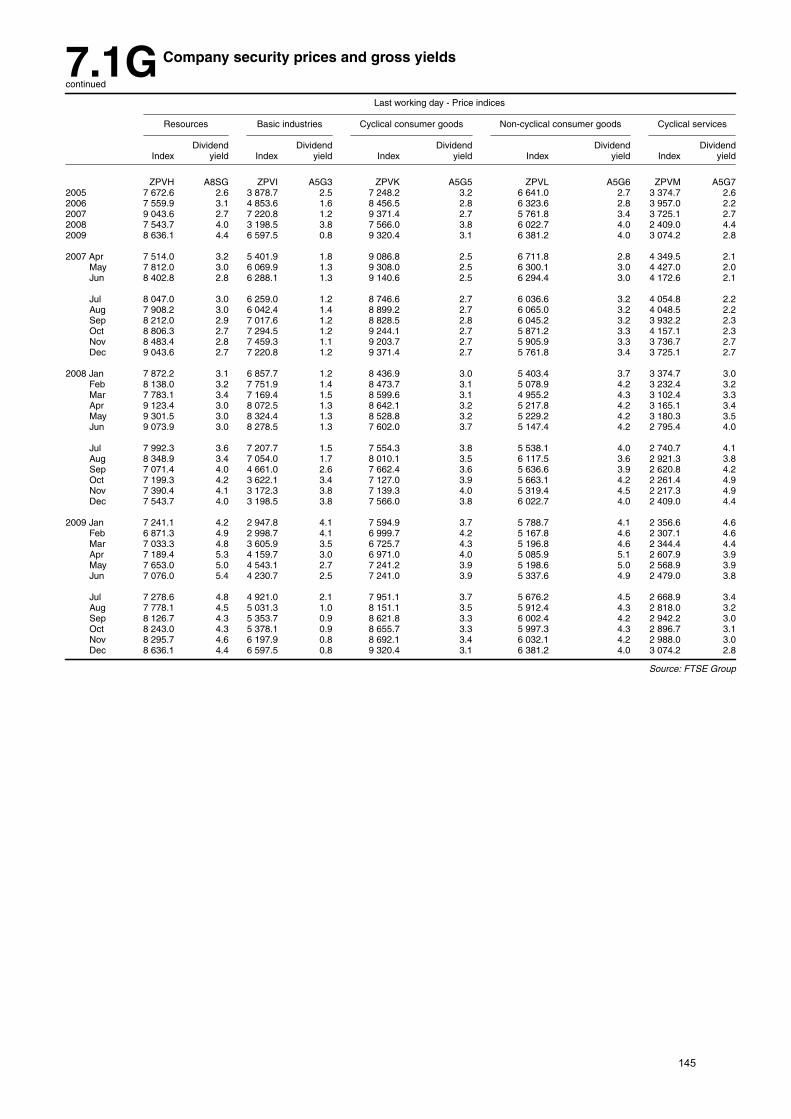
7.1G Company security prices and gross yields
continued
Last wor king day - Price indices
Resources Basic industr ies Cyclical consumer goods Non-cyclical consumer goods Cyclical services
Dividend Dividend Dividend Dividend DividendIndex yield Index yield Index yield Index yield Index yield
ZPVH A8SG ZPVI A5G3 ZPVK A5G5 ZPVL A5G6 ZPVM A5G72005 7 672.6 2.6 3 878.7 2.5 7 248.2 3.2 6 641.0 2.7 3 374.7 2.62006 7 559.9 3.1 4 853.6 1.6 8 456.5 2.8 6 323.6 2.8 3 957.0 2.22007 9 043.6 2.7 7 220.8 1.2 9 371.4 2.7 5 761.8 3.4 3 725.1 2.72008 7 543.7 4.0 3 198.5 3.8 7 566.0 3.8 6 022.7 4.0 2 409.0 4.42009 8 636.1 4.4 6 597.5 0.8 9 320.4 3.1 6 381.2 4.0 3 074.2 2.8
2007 Apr 7 514.0 3.2 5 401.9 1.8 9 086.8 2.5 6 711.8 2.8 4 349.5 2.1May 7 812.0 3.0 6 069.9 1.3 9 308.0 2.5 6 300.1 3.0 4 427.0 2.0Jun 8 402.8 2.8 6 288.1 1.3 9 140.6 2.5 6 294.4 3.0 4 172.6 2.1
Jul 8 047.0 3.0 6 259.0 1.2 8 746.6 2.7 6 036.6 3.2 4 054.8 2.2Aug 7 908.2 3.0 6 042.4 1.4 8 899.2 2.7 6 065.0 3.2 4 048.5 2.2Sep 8 212.0 2.9 7 017.6 1.2 8 828.5 2.8 6 045.2 3.2 3 932.2 2.3Oct 8 806.3 2.7 7 294.5 1.2 9 244.1 2.7 5 871.2 3.3 4 157.1 2.3Nov 8 483.4 2.8 7 459.3 1.1 9 203.7 2.7 5 905.9 3.3 3 736.7 2.7Dec 9 043.6 2.7 7 220.8 1.2 9 371.4 2.7 5 761.8 3.4 3 725.1 2.7
2008 Jan 7 872.2 3.1 6 857.7 1.2 8 436.9 3.0 5 403.4 3.7 3 374.7 3.0Feb 8 138.0 3.2 7 751.9 1.4 8 473.7 3.1 5 078.9 4.2 3 232.4 3.2Mar 7 783.1 3.4 7 169.4 1.5 8 599.6 3.1 4 955.2 4.3 3 102.4 3.3Apr 9 123.4 3.0 8 072.5 1.3 8 642.1 3.2 5 217.8 4.2 3 165.1 3.4May 9 301.5 3.0 8 324.4 1.3 8 528.8 3.2 5 229.2 4.2 3 180.3 3.5Jun 9 073.9 3.0 8 278.5 1.3 7 602.0 3.7 5 147.4 4.2 2 795.4 4.0
Jul 7 992.3 3.6 7 207.7 1.5 7 554.3 3.8 5 538.1 4.0 2 740.7 4.1Aug 8 348.9 3.4 7 054.0 1.7 8 010.1 3.5 6 117.5 3.6 2 921.3 3.8Sep 7 071.4 4.0 4 661.0 2.6 7 662.4 3.6 5 636.6 3.9 2 620.8 4.2Oct 7 199.3 4.2 3 622.1 3.4 7 127.0 3.9 5 663.1 4.2 2 261.4 4.9Nov 7 390.4 4.1 3 172.3 3.8 7 139.3 4.0 5 319.4 4.5 2 217.3 4.9Dec 7 543.7 4.0 3 198.5 3.8 7 566.0 3.8 6 022.7 4.0 2 409.0 4.4
2009 Jan 7 241.1 4.2 2 947.8 4.1 7 594.9 3.7 5 788.7 4.1 2 356.6 4.6Feb 6 871.3 4.9 2 998.7 4.1 6 999.7 4.2 5 167.8 4.6 2 307.1 4.6Mar 7 033.3 4.8 3 605.9 3.5 6 725.7 4.3 5 196.8 4.6 2 344.4 4.4Apr 7 189.4 5.3 4 159.7 3.0 6 971.0 4.0 5 085.9 5.1 2 607.9 3.9May 7 653.0 5.0 4 543.1 2.7 7 241.2 3.9 5 198.6 5.0 2 568.9 3.9Jun 7 076.0 5.4 4 230.7 2.5 7 241.0 3.9 5 337.6 4.9 2 479.0 3.8
Jul 7 278.6 4.8 4 921.0 2.1 7 951.1 3.7 5 676.2 4.5 2 668.9 3.4Aug 7 778.1 4.5 5 031.3 1.0 8 151.1 3.5 5 912.4 4.3 2 818.0 3.2Sep 8 126.7 4.3 5 353.7 0.9 8 621.8 3.3 6 002.4 4.2 2 942.2 3.0Oct 8 243.0 4.3 5 378.1 0.9 8 655.7 3.3 5 997.3 4.3 2 896.7 3.1Nov 8 295.7 4.6 6 197.9 0.8 8 692.1 3.4 6 032.1 4.2 2 988.0 3.0Dec 8 636.1 4.4 6 597.5 0.8 9 320.4 3.1 6 381.2 4.0 3 074.2 2.8
Source: FTSE Group
145
Page 13
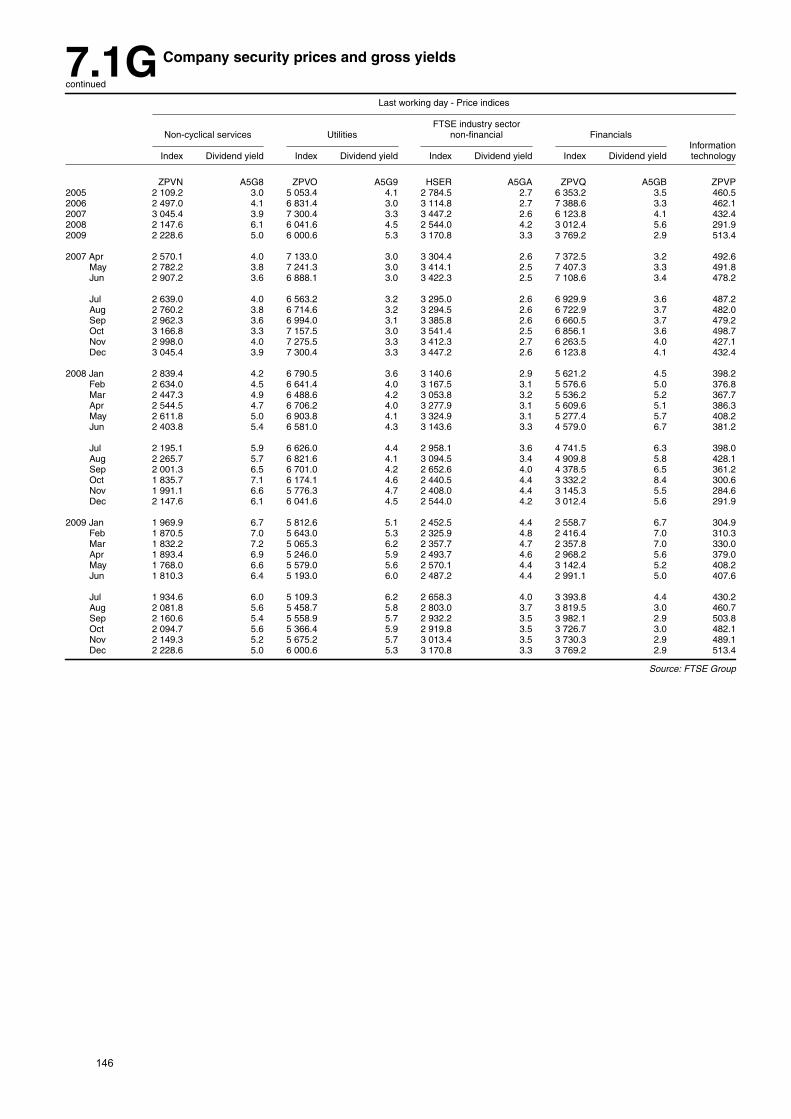
7.1G Company security prices and gross yields
continued
Last wor king day - Price indices
FTSE industry sectorNon-cyclical services Utilities non-financial Financials
Infor mationIndex Dividend yield Index Dividend yield Index Dividend yield Index Dividend yield technology
ZPVN A5G8 ZPVO A5G9 HSER A5GA ZPVQ A5GB ZPVP2005 2 109.2 3.0 5 053.4 4.1 2 784.5 2.7 6 353.2 3.5 460.52006 2 497.0 4.1 6 831.4 3.0 3 114.8 2.7 7 388.6 3.3 462.12007 3 045.4 3.9 7 300.4 3.3 3 447.2 2.6 6 123.8 4.1 432.42008 2 147.6 6.1 6 041.6 4.5 2 544.0 4.2 3 012.4 5.6 291.92009 2 228.6 5.0 6 000.6 5.3 3 170.8 3.3 3 769.2 2.9 513.4
2007 Apr 2 570.1 4.0 7 133.0 3.0 3 304.4 2.6 7 372.5 3.2 492.6May 2 782.2 3.8 7 241.3 3.0 3 414.1 2.5 7 407.3 3.3 491.8Jun 2 907.2 3.6 6 888.1 3.0 3 422.3 2.5 7 108.6 3.4 478.2
Jul 2 639.0 4.0 6 563.2 3.2 3 295.0 2.6 6 929.9 3.6 487.2Aug 2 760.2 3.8 6 714.6 3.2 3 294.5 2.6 6 722.9 3.7 482.0Sep 2 962.3 3.6 6 994.0 3.1 3 385.8 2.6 6 660.5 3.7 479.2Oct 3 166.8 3.3 7 157.5 3.0 3 541.4 2.5 6 856.1 3.6 498.7Nov 2 998.0 4.0 7 275.5 3.3 3 412.3 2.7 6 263.5 4.0 427.1Dec 3 045.4 3.9 7 300.4 3.3 3 447.2 2.6 6 123.8 4.1 432.4
2008 Jan 2 839.4 4.2 6 790.5 3.6 3 140.6 2.9 5 621.2 4.5 398.2Feb 2 634.0 4.5 6 641.4 4.0 3 167.5 3.1 5 576.6 5.0 376.8Mar 2 447.3 4.9 6 488.6 4.2 3 053.8 3.2 5 536.2 5.2 367.7Apr 2 544.5 4.7 6 706.2 4.0 3 277.9 3.1 5 609.6 5.1 386.3May 2 611.8 5.0 6 903.8 4.1 3 324.9 3.1 5 277.4 5.7 408.2Jun 2 403.8 5.4 6 581.0 4.3 3 143.6 3.3 4 579.0 6.7 381.2
Jul 2 195.1 5.9 6 626.0 4.4 2 958.1 3.6 4 741.5 6.3 398.0Aug 2 265.7 5.7 6 821.6 4.1 3 094.5 3.4 4 909.8 5.8 428.1Sep 2 001.3 6.5 6 701.0 4.2 2 652.6 4.0 4 378.5 6.5 361.2Oct 1 835.7 7.1 6 174.1 4.6 2 440.5 4.4 3 332.2 8.4 300.6Nov 1 991.1 6.6 5 776.3 4.7 2 408.0 4.4 3 145.3 5.5 284.6Dec 2 147.6 6.1 6 041.6 4.5 2 544.0 4.2 3 012.4 5.6 291.9
2009 Jan 1 969.9 6.7 5 812.6 5.1 2 452.5 4.4 2 558.7 6.7 304.9Feb 1 870.5 7.0 5 643.0 5.3 2 325.9 4.8 2 416.4 7.0 310.3Mar 1 832.2 7.2 5 065.3 6.2 2 357.7 4.7 2 357.8 7.0 330.0Apr 1 893.4 6.9 5 246.0 5.9 2 493.7 4.6 2 968.2 5.6 379.0May 1 768.0 6.6 5 579.0 5.6 2 570.1 4.4 3 142.4 5.2 408.2Jun 1 810.3 6.4 5 193.0 6.0 2 487.2 4.4 2 991.1 5.0 407.6
Jul 1 934.6 6.0 5 109.3 6.2 2 658.3 4.0 3 393.8 4.4 430.2Aug 2 081.8 5.6 5 458.7 5.8 2 803.0 3.7 3 819.5 3.0 460.7Sep 2 160.6 5.4 5 558.9 5.7 2 932.2 3.5 3 982.1 2.9 503.8Oct 2 094.7 5.6 5 366.4 5.9 2 919.8 3.5 3 726.7 3.0 482.1Nov 2 149.3 5.2 5 675.2 5.7 3 013.4 3.5 3 730.3 2.9 489.1Dec 2 228.6 5.0 6 000.6 5.3 3 170.8 3.3 3 769.2 2.9 513.4
Source: FTSE Group
146
Page 14
7.1H Shor t-term sterling money rates (13.8)Last Friday of the period
Per cent per annum
Treasur y bills1 Eligible bills2 Commercial paper Cer tificates of deposit
3 months 1 month 3 month 1 month 3 month 1 month 3 month
Av eragerate of
discount Yield Bid Offer Bid Offer Bid Offer Bid Offer Bid Offer Bid Offer
AJNB AJRP AJRQ AJRR AJRS AJRT AJRU AJRV AJRW AJRX AJRZ AJTJ HSAL HSAM2004 4.69 4.75 4.75 4.75 4.76 4.76 4.78 4.82 4.80 4.84 4.77 4.81 4.78 4.822005 4.43 4.48 .. .. .. .. 4.57 4.60 4.56 4.59 4.59 4.63 4.57 4.612006 5.11 5.17 .. .. .. .. 5.18 5.20 5.26 5.29 5.21 5.24 5.26 5.292007 5.24 5.31 .. .. .. .. 6.43 6.50 5.96 6.32 5.90 6.00 5.90 6.002008 1.24 1.25 .. .. .. .. 1.63 2.19 2.03 3.15 2.00 2.25 2.65 2.90
2009 0.49 0.49 .. .. .. .. 0.41 0.65 0.50 0.82 0.37 0.62 0.45 0.70
2007 May 25 5.59 5.67 .. .. .. .. 5.62 5.64 5.76 5.78 5.61 5.64 5.89 5.92Jun 29 5.77 5.79 .. .. .. .. 5.81 5.84 5.93 5.96 5.81 5.84 6.06 6.09
Jul 27 5.75 5.83 .. .. .. .. 5.86 5.89 6.01 6.04 5.85 5.88 6.09 6.12Aug 31 5.77 5.83 .. .. .. .. 6.51 6.57 6.58 6.64 6.45 6.55 6.49 6.59Sep 28 5.61 5.72 .. .. .. .. 6.08 6.20 6.20 6.31 6.03 6.13 6.18 6.28Oct 26 5.57 5.65 .. .. .. .. 5.92 5.98 6.16 6.22 5.94 6.01 6.15 6.25Nov 30 5.44 5.51 .. .. .. .. 6.05 6.14 6.55 6.67 5.99 6.09 6.50 6.60Dec 28 5.24 5.31 .. .. .. .. 6.43 6.50 5.96 6.32 5.90 6.00 5.90 6.00
2008 Jan 25 5.01 5.07 .. .. .. .. 5.40 5.55 5.47 5.58 5.49 5.57 5.50 5.58Feb 29 4.98 5.43 .. .. .. .. 5.45 5.56 5.65 5.73 5.50 5.58 5.64 5.72Mar 28 4.77 4.83 .. .. .. .. 5.64 5.80 5.78 6.03 5.70 5.78 5.94 6.02Apr 25 4.90 4.61 .. .. .. .. 5.33 5.52 5.52 5.81 5.40 5.48 5.76 5.84May 30 5.04 5.06 .. .. .. .. 5.34 5.49 5.70 5.87 5.38 5.46 5.79 5.87Jun 27 5.10 5.24 .. .. .. .. 5.42 5.52 5.83 5.91 5.43 5.51 5.87 5.95
Jul 25 5.09 5.15 .. .. .. .. 5.28 5.44 5.67 5.88 5.32 5.40 5.72 5.80Aug 29 4.94 4.99 .. .. .. .. 5.21 5.40 5.53 5.74 5.30 5.38 5.69 5.77Sep 26 4.51 4.56 .. .. .. .. 5.45 6.13 5.55 6.40 5.85 6.10 6.10 6.35Oct 31 3.54 3.51 .. .. .. .. 5.33 5.65 5.49 5.88 5.55 5.75 5.85 6.05Nov 28 1.68 1.69 .. .. .. .. 2.78 3.27 3.06 3.87 3.05 3.30 3.85 4.10Dec 19 1.24 1.25 .. .. .. .. 1.63 2.19 2.03 3.15 2.00 2.25 2.65 2.90
2009 Jan 30 0.91 0.91 .. .. .. .. 1.48 1.64 1.58 1.92 1.50 1.75 2.00 2.25Feb 27 0.66 0.66 .. .. .. .. 1.16 1.59 1.66 2.28 1.25 1.50 1.90 2.15Mar 27 0.62 0.62 .. .. .. .. 0.85 1.17 1.17 1.81 0.80 1.05 1.45 1.70Apr 24 0.57 0.57 .. .. .. .. 0.65 0.95 1.13 1.52 0.60 0.85 1.20 1.45May 29 0.52 0.52 .. .. .. .. 0.52 0.86 0.87 1.36 0.45 0.70 1.10 1.35Jun 26 0.49 0.49 .. .. .. .. 0.48 0.80 0.85 1.23 0.40 0.65 0.95 1.20
Jul 31 0.43 0.43 .. .. .. .. 0.44 0.74 0.66 1.07 0.40 0.65 0.65 0.90Aug 28 0.37 0.38 .. .. .. .. 0.42 0.66 0.64 1.08 0.40 0.65 0.45 0.70Sep 25 0.39 0.39 .. .. .. .. 0.46 0.74 0.42 0.72 0.35 0.60 0.35 0.60Oct 30 0.46 0.46 .. .. .. .. 0.50 0.63 0.53 0.63 0.37 0.62 0.45 0.70Nov 27 0.46 0.46 .. .. .. .. 0.49 0.69 0.60 0.83 0.37 0.62 0.45 0.70Dec 18 0.49 0.49 .. .. .. .. 0.41 0.65 0.50 0.82 0.37 0.62 0.45 0.70
2010 Jan 0.49 0.49 .. .. .. .. 0.48 0.61 0.53 0.72 0.37 0.62 0.45 0.70
147
Page 15
7.1H Shor t-term sterling money rates (13.8)Last Friday of the period
continued Per cent per annum
Interbank rates
Over night 1 week 1 month 3 month 6 month 1 year
OfferBid Offer Bid Offer Bid Offer Bid Offer Bid Offer Bid rate rate
HSAD HSAE HSAF HSAG HSAH HSAI HSAJ HSAK AJTK AJTL AJTM AJTN2004 4.75 4.82 4.73 4.78 4.78 4.81 4.81 4.84 4.83 4.87 4.85 4.892005 4.80 4.80 4.70 4.73 4.59 4.62 4.57 4.59 4.52 4.54 4.48 4.522006 5.32 5.35 5.21 5.25 5.22 5.22 5.26 5.29 5.37 5.40 5.53 5.552007 5.80 6.00 5.75 5.85 5.90 5.95 5.95 5.95 5.85 5.87 5.65 5.672008 1.50 2.00 1.50 2.00 2.05 2.25 2.75 2.90 2.90 3.10 3.00 3.20
2009 0.45 0.50 0.45 0.55 0.46 0.60 0.55 0.70 0.75 0.90 1.30 1.45
2007 May 25 5.57 5.59 5.56 5.58 5.62 5.64 5.76 5.78 5.89 5.92 6.09 6.12Jun 29 6.00 6.30 5.90 6.10 5.80 5.85 5.93 5.98 6.05 6.10 6.25 6.29
Jul 27 5.78 5.82 5.80 5.83 5.85 5.88 6.00 6.02 6.09 6.12 6.23 6.26Aug 31 6.15 6.25 6.15 6.25 6.45 6.55 6.55 6.65 6.49 6.59 6.44 6.54Sep 28 5.80 6.00 5.90 6.00 6.03 6.13 6.18 6.28 6.20 6.30 6.09 6.19Oct 26 5.82 5.87 5.80 5.85 5.97 5.98 6.17 6.25 6.14 6.20 6.01 6.11Nov 30 5.95 6.00 5.90 6.00 6.02 6.09 6.53 6.58 6.27 6.33 5.94 6.00Dec 28 5.80 6.00 5.75 5.85 5.90 5.95 5.95 5.95 5.85 5.87 5.65 5.67
2008 Jan 25 5.50 5.53 5.51 5.54 5.50 5.57 5.50 5.58 5.46 5.53 5.28 5.37Feb 29 5.29 5.30 5.30 5.33 5.53 5.58 5.68 5.72 5.62 5.68 5.48 5.56Mar 28 5.45 5.50 5.45 5.50 5.72 5.78 5.95 6.02 5.93 5.98 5.75 5.84Apr 25 5.05 5.10 5.08 5.10 5.42 5.47 5.76 5.84 5.80 5.84 5.77 5.82May 30 5.05 5.10 5.07 5.10 5.38 5.45 5.80 5.87 5.91 5.99 6.10 6.12Jun 27 5.20 5.30 5.08 5.18 5.43 5.50 5.88 5.94 6.07 6.15 6.38 6.43
Jul 25 5.00 5.03 5.04 5.07 5.33 5.38 5.75 5.79 5.91 5.98 6.10 6.18Aug 29 5.00 5.02 5.03 5.07 5.31 5.36 5.70 5.75 5.84 5.89 5.95 6.00Sep 26 6.50 7.00 5.50 6.20 6.00 6.10 6.15 6.30 6.25 6.40 6.35 6.50Oct 31 4.10 4.50 4.25 4.80 5.55 5.70 5.85 6.00 5.95 6.00 5.95 6.00Nov 28 2.50 3.00 2.60 3.10 3.05 3.25 3.85 4.10 4.00 4.20 4.00 4.25Dec 19 1.50 2.00 1.50 2.00 2.05 2.25 2.75 2.90 2.90 3.10 3.00 3.20
2009 Jan 30 1.25 1.60 1.30 1.75 1.50 1.70 2.00 2.25 2.15 2.40 2.30 2.50Feb 27 0.80 1.00 0.80 1.20 1.30 1.50 1.95 2.15 2.10 2.30 2.25 2.45Mar 27 0.50 0.75 0.50 0.80 0.95 1.05 1.60 1.70 1.80 1.90 2.00 2.10Apr 24 0.40 0.55 0.40 0.60 0.70 0.85 1.30 1.45 1.55 1.70 1.80 1.95May 29 0.40 0.55 0.45 0.65 0.55 0.70 1.15 1.30 1.40 1.50 1.75 1.80Jun 26 0.40 0.50 0.45 0.60 0.55 0.65 1.15 1.20 1.40 1.45 1.70 1.80
Jul 31 0.40 0.50 0.45 0.60 0.50 0.65 0.90 0.90 1.10 1.20 1.45 1.80Aug 28 0.40 0.50 0.45 0.60 0.45 0.65 0.70 0.70 0.90 0.95 1.20 1.25Sep 25 0.40 0.50 0.45 0.58 0.45 0.60 0.55 0.60 0.75 0.75 1.10 1.20Oct 30 0.45 0.50 0.45 0.55 0.45 0.60 0.50 0.70 0.75 0.90 1.20 1.25Nov 27 0.45 0.50 0.45 0.55 0.45 0.62 0.50 0.70 0.75 0.90 1.20 1.30Dec 18 0.45 0.50 0.45 0.55 0.46 0.60 0.55 0.70 0.75 0.90 1.30 1.45
2010 Jan 0.45 0.50 0.45 0.55 0.45 0.60 0.50 0.70 0.75 0.94 1.25 1.35
See table 7.1O for certain average rates.1 Treasur y bills were not tendered in September,October 1989 and August
1992.2 Discount rates
Source: Bank of England
148
Page 16
7.1I National Savings and InvestmentsRate of interest on Investment Account
Per cent per annum
Date of change New Rate Date of change New Rate
2001 Feb 6 Nov 22Under £500 £500-£2,499 £2,500-£4,999 Under £500 £500-£4,999
4.25 4.35 4.45 3.30 3.35£5,000-£9,999 £10,000-24,999 £25,000-£49,999 £5,000-£9,999 £10, 000-£24,999 £25,000-£49,999
4.55 4.75 5.05 3.45 3.65 3.85May 1 2007 Jan 24
Under £500 £500-£2,499 £2,500-£4,999 Under £500 £500-£4,9994.00 4.10 4.20 3.55 3.60
£5,000-£9,999 £10,000-£24,999 £25,000-£49,999 £5,000-£9,999 £10,000-£24,999 £25,000-£49,0004.30 4.50 4.80 3.70 3.90 4.10
Jun 7 May 23Under £500 £500-£2,499 £2,500-£4,999 Under £500 £500-£4,999
3.75 3.85 3.95 3.70 3.75£5,000-£9,999 £10,000-£24,999 £25,000-£49,000 £5,000-£9,999 £10,000-£24,999 £25,000-£49,000
4.05 4.25 4.55 3.85 4.05 4.25Dec 14 Jul 25
Under £500 £500-£4,999 Under £500 £500-£4,9992.60 2.70 3.95 4.00
£5,000-£9,999 £10,000-£24,999 £25,000-£49,000 £5,000-£9,999 £10,000-£24,999 £25,000-£49,0002.80 3.00 3.20 4.10 4.30 4.50
2003 Mar 3 Dec 20Under £500 £500-£4,999 Under £500 £500-£4,999
2.20 2.30 3.70 3.75£5,000-£9,999 £10,000-£24,999 £25,000-£49,000 £5,000-£9,999 £10,000-£24,999 £25,000-£49,999
2.40 2.60 2.80 3.85 4.05 4.25Aug 3 2008 Feb 22
Under £500 £500-£4,999 Under £500 £500-£4,9992.00 2.05 3.45 3.50
£5,000-£9,999 £10,000-£24,999 £25,000-£49,999 £5,000-£9,999 £10,000-£24,999 £25,000-£49,9992.15 2.35 2.55 3.60 3.80 4.00
Dec 4 Apr 23Under £500 £500-£4,999 Under £500 £500-£4,999
2.25 2.30 3.20 3.25£5,000-£9,999 £10,000-£24,999 £25,000-£49,999 £5,000-£9,999 £10,000-£24,999 £25,000-£49,999
2.40 2.60 2.80 3.35 3.55 3.752004 Mar 4 Oct 7
Under £500 £500-£4,999 Under £500 £500-£4,9992.50 2.55 3.00 3.05
£5,000-£9,999 £10,000-£24,999 £25,000-£49,999 £5,000-£9,999 £10,000-£24,999 £25,000-£49,9992.65 2.85 3.05 3.15 3.35 3.55
Jun 1 Oct 22Under £500 £500-£4,999 Under £500 £500-£4,999
2.75 2.80 2.50 2.55£5,000-£9,999 £10,000-£24,999 £25,000-£49,999 £5,000-£9,999 £10,000-£24,999 £25,000-£49,999
2.90 3.10 3.30 2.65 2.85 3.05Jul 4 Nov 19
Under £500 £500-£4,999 Under £500 £500-£4,9993.00 3.05 1.00 1.05
£5,000-£9,999 £10, 000-£24,999 £25,000-£49,999 £5,000-£9,999 £10,000-£24,999 £25,000-£49,9993.15 3.35 3.55 1.15 1.35 1.55
Sep 1 2009 Jan 21Under £500 £500-£4,999 Under £500 £500-£4,999
3.25 3.30 0.35 0.35£5,000-£9,999 £10, 000-£24,999 £25,000-£49,999 £5,000-£9,999 £10,000-£24,999 £25,000-£49,999
3.40 3.60 3.80 0.35 0.35 0.552005 Sep 1 Feb 19
Under £500 £500-£4,999 Under £500 £500-£4,9992.95 3.00 0.30 0.30
£5,000-£9,999 £10, 000-£24,999 £25,000-£49,999 £5,000-£9,999 £10,000-£24,999 £25,000-£49,9993.10 3.30 3.50 0.30 0.40 0.40
2006 Jun 1 Mar 18Under £500 £500-£4,999 Under £500 £500-£4,999
2.90 2.95 0.20 0.20£5,000-£9,999 £10, 000-£24,999 £25,000-£49,999 £5,000-£9,999 £10,000-£24,999 £25,000-£49,999
3.05 3.25 3.45 0.20 0.20 0.30Aug 17
Under £500 £500-£4,9993.15 3.20
£5,000-£9,999 £10, 000-£24,999 £25,000-£49,9993.30 3.50 3.70
149
Page 17
7.1J Selected retail banks: interest rates (13.10)
Per cent per annum
Base rates Base rates Base rates
Date of change New rate Date of change New rate Date of change New rate
1985 Jan 11 10.50 Jul 5 10.00Jan 141 12.00 Jul 18 10.00-10.50 1998 Jun 4 7.50Jan 28 14.00 Jul 19 10.50 Oct 8 7.25Mar 20 13.50-14.00 Aug 8 10.50-11.00 Nov 5 6.75Mar 21 13.50 Aug 9 11.00 Dec 10 6.25Mar 29 13.00-13.50 Aug 25 11.00-12.00
Apr 3 13.00-13.25 Aug 26 12.00 1999 Jan 7 6.00Apr 12 12.75-13.00 Nov 25 13.00 Feb 4 5.50Apr 19 12.50-12.75 Apr 8 5.25Jun 12 12.50 1989 May 24 14.00 Jun 10 5.00Jul 15 12.00-12.50 Oct 5 15.00 Sep 8 5-5.25Jul 16 12.00 Sep 10 5.25Jul 29 11.50-12.00 1990 Oct 8 14.00 Nov 4 5.50Jul 30 11.50
1991 Feb 13 13.50 2000 Jan 13 5.751986 Jan 9 12.50 Feb 27 13.00 Feb 10 6.00
Mar 19 11.50 Mar 22 12.50Apr 8 11.00-11.50 Apr 12 12.00 2001 Feb 8 5.75Apr 9 11.00 May 24 11.50 Apr 5 5.5
Apr 21 10.50 Jul 12 11.00 May 10 5.25May 23 10.00-10.50 Sep 4 10.50 Aug 2 5.00May 27 10.00 Sep 18 4.75Oct 14 10.00-11.00 1992 May 5 10.00 Oct 4 4.50Oct 15 11.00 Sep 161 12.00 Nov 8 4.0
Sep 171 10.00-12.001987 Mar 10 10.50 Sep 18 10.00 2003 Feb 6 3.75
Mar 18 10.00-10.50 Sep 22 9.00 Jul 10 3.5Mar 19 10.00 Oct 16 8.00-9.00 Nov 6 3.75Apr 28 9.50-10.00 Oct 19 8.00Apr 29 9.50 Nov 13 7.00 2004 Feb 5 4.0
May 11 9.00 May 6 4.25Aug 6 9.00-10.00 1993 Jan 26 6.00 Jun 10 4.5Aug 7 10.00 Nov 23 5.50 Aug 5 4.75
Oct 23 9.50-10.00Oct 29 9.50 1994 Feb 8 5.25 2005 Aug 4 4.5Nov 4 9.00-9.50 Sep 12 5.75Nov 5 9.00 Dec 7 6.25 2006 Aug 3 4.75Dec 4 8.50 Nov 9 5.0
1995 Feb 21 6.25-6.751988 Feb 2 9.00 Feb 3 6.75 2007 Jan 11 5.25
Mar 17 8.50-9.00 Dec 13 6.50 May 10 5.5Mar 18 8.50 Jul 5 5.75Apr 11 8.00 1996 Jan 18 6.25 Dec 6 5.5
May 17 7.50-8.00 Mar 8 6.00May 18 7.50 Jun 6 5.75 2008 Feb 7 5.25
Jun 2 7.50-8.00 Oct 30 5.75-6.00 Apr 10 5.0Jun 3 8.00 Oct 31 6.00 Oct 8 4.5Jun 6 8.00-8.50 Nov 7 3.0Jun 7 8.50 1997 May 6 6.25 Dec 4 2.0
Jun 22 8.50-9.00 Jun 6 6.25-6.50Jun 23 9.00 Jun 9 6.50 2009 Jan 8 1.5Jun 28 9.00-9.50 Jul 10 6.75 Feb 5 1.0Jun 29 9.50 Aug 7 7.00 Mar 5 0.5
Jul 4 9.50-10.00 Nov 6 7.25
150
Page 18
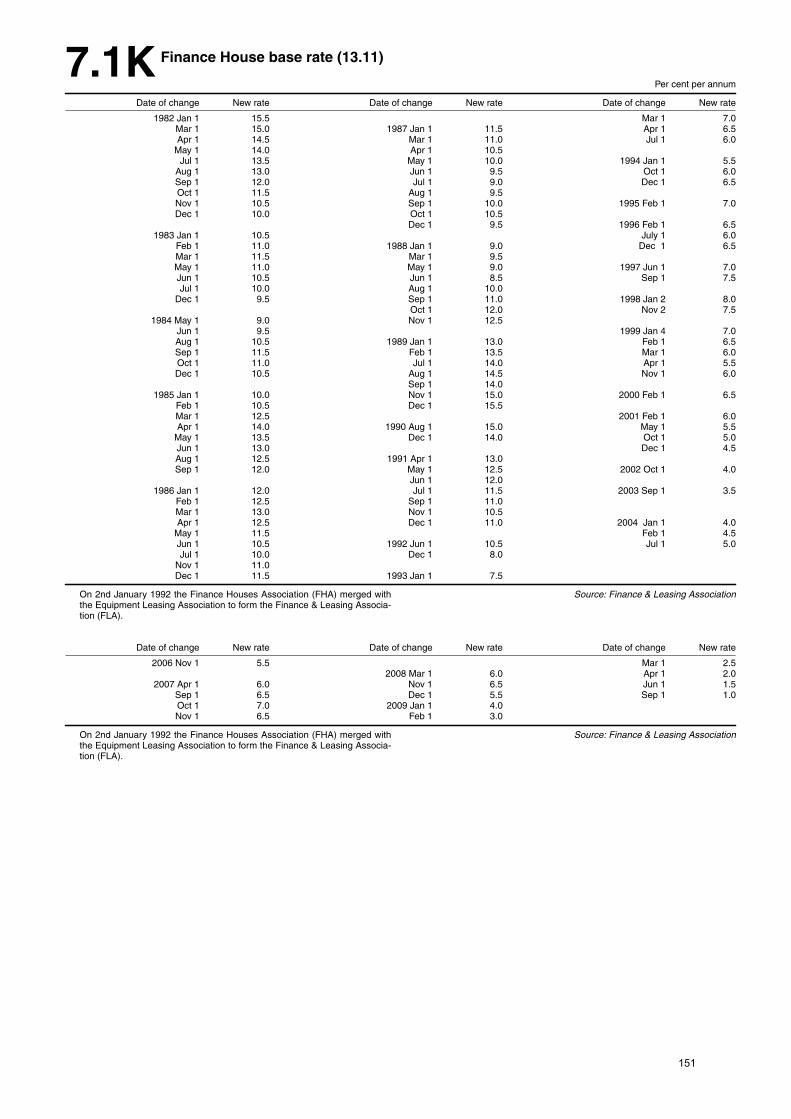
7.1K Finance House base rate (13.11)
Per cent per annum
Date of change New rate Date of change New rate Date of change New rate
1982 Jan 1 15.5 Mar 1 7.0Mar 1 15.0 1987 Jan 1 11.5 Apr 1 6.5Apr 1 14.5 Mar 1 11.0 Jul 1 6.0
May 1 14.0 Apr 1 10.5Jul 1 13.5 May 1 10.0 1994 Jan 1 5.5
Aug 1 13.0 Jun 1 9.5 Oct 1 6.0Sep 1 12.0 Jul 1 9.0 Dec 1 6.5Oct 1 11.5 Aug 1 9.5Nov 1 10.5 Sep 1 10.0 1995 Feb 1 7.0Dec 1 10.0 Oct 1 10.5
Dec 1 9.5 1996 Feb 1 6.51983 Jan 1 10.5 July 1 6.0
Feb 1 11.0 1988 Jan 1 9.0 Dec 1 6.5Mar 1 11.5 Mar 1 9.5May 1 11.0 May 1 9.0 1997 Jun 1 7.0Jun 1 10.5 Jun 1 8.5 Sep 1 7.5Jul 1 10.0 Aug 1 10.0
Dec 1 9.5 Sep 1 11.0 1998 Jan 2 8.0Oct 1 12.0 Nov 2 7.5
1984 May 1 9.0 Nov 1 12.5Jun 1 9.5 1999 Jan 4 7.0Aug 1 10.5 1989 Jan 1 13.0 Feb 1 6.5Sep 1 11.5 Feb 1 13.5 Mar 1 6.0Oct 1 11.0 Jul 1 14.0 Apr 1 5.5Dec 1 10.5 Aug 1 14.5 Nov 1 6.0
Sep 1 14.01985 Jan 1 10.0 Nov 1 15.0 2000 Feb 1 6.5
Feb 1 10.5 Dec 1 15.5Mar 1 12.5 2001 Feb 1 6.0Apr 1 14.0 1990 Aug 1 15.0 May 1 5.5
May 1 13.5 Dec 1 14.0 Oct 1 5.0Jun 1 13.0 Dec 1 4.5Aug 1 12.5 1991 Apr 1 13.0Sep 1 12.0 May 1 12.5 2002 Oct 1 4.0
Jun 1 12.01986 Jan 1 12.0 Jul 1 11.5 2003 Sep 1 3.5
Feb 1 12.5 Sep 1 11.0Mar 1 13.0 Nov 1 10.5Apr 1 12.5 Dec 1 11.0 2004 Jan 1 4.0
May 1 11.5 Feb 1 4.5Jun 1 10.5 1992 Jun 1 10.5 Jul 1 5.0Jul 1 10.0 Dec 1 8.0
Nov 1 11.0Dec 1 11.5 1993 Jan 1 7.5
On 2nd Januar y 1992 the Finance Houses Association (FHA) merged withthe Equipment Leasing Association to for m the Finance & Leasing Associa-tion (FLA).
Source: Finance & Leasing Association
Date of change New rate Date of change New rate Date of change New rate
2006 Nov 1 5.5 Mar 1 2.52008 Mar 1 6.0 Apr 1 2.0
2007 Apr 1 6.0 Nov 1 6.5 Jun 1 1.5Sep 1 6.5 Dec 1 5.5 Sep 1 1.0Oct 1 7.0 2009 Jan 1 4.0Nov 1 6.5 Feb 1 3.0
On 2nd Januar y 1992 the Finance Houses Association (FHA) merged withthe Equipment Leasing Association to for m the Finance & Leasing Associa-tion (FLA).
Source: Finance & Leasing Association
151
Page 19
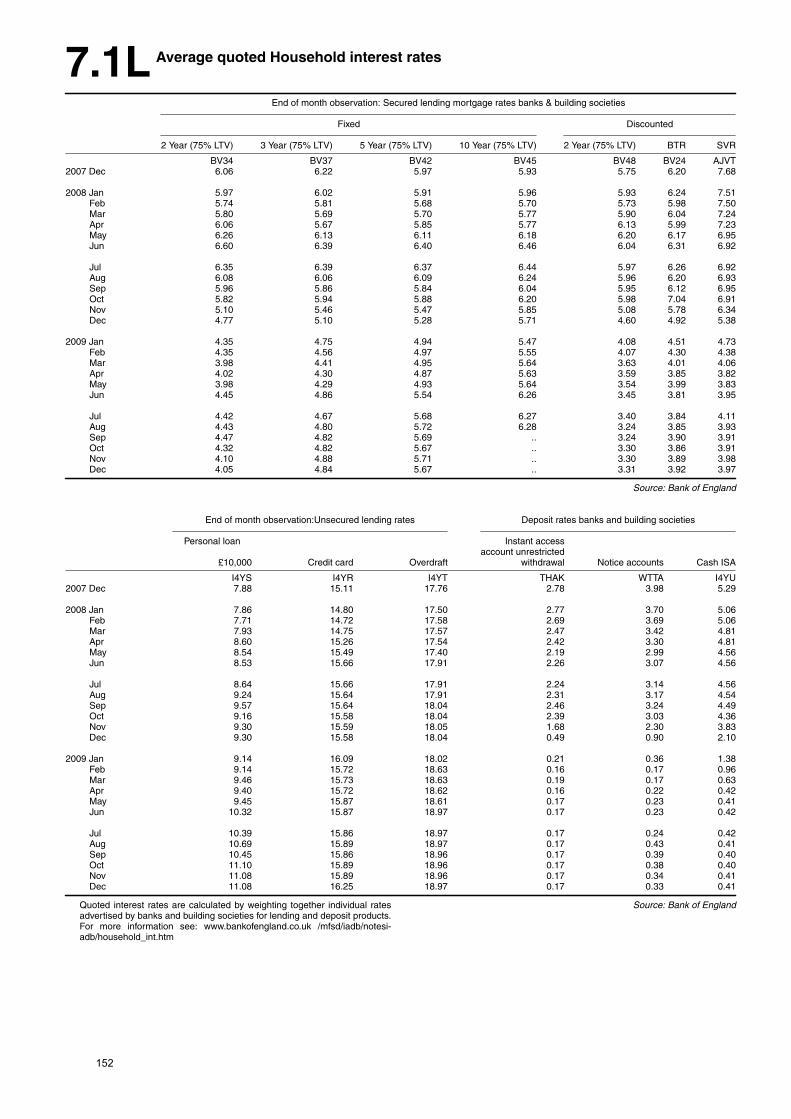
7.1L Average quoted Household interest rates
End of month observation: Secured lending mortgage rates banks & building societies
Fixed Discounted
2 Year (75% LTV) 3 Year (75% LTV) 5 Year (75% LTV) 10 Year (75% LTV) 2 Year (75% LTV) BTR SVR
BV34 BV37 BV42 BV45 BV48 BV24 AJVT2007 Dec 6.06 6.22 5.97 5.93 5.75 6.20 7.68
2008 Jan 5.97 6.02 5.91 5.96 5.93 6.24 7.51Feb 5.74 5.81 5.68 5.70 5.73 5.98 7.50Mar 5.80 5.69 5.70 5.77 5.90 6.04 7.24Apr 6.06 5.67 5.85 5.77 6.13 5.99 7.23May 6.26 6.13 6.11 6.18 6.20 6.17 6.95Jun 6.60 6.39 6.40 6.46 6.04 6.31 6.92
Jul 6.35 6.39 6.37 6.44 5.97 6.26 6.92Aug 6.08 6.06 6.09 6.24 5.96 6.20 6.93Sep 5.96 5.86 5.84 6.04 5.95 6.12 6.95Oct 5.82 5.94 5.88 6.20 5.98 7.04 6.91Nov 5.10 5.46 5.47 5.85 5.08 5.78 6.34Dec 4.77 5.10 5.28 5.71 4.60 4.92 5.38
2009 Jan 4.35 4.75 4.94 5.47 4.08 4.51 4.73Feb 4.35 4.56 4.97 5.55 4.07 4.30 4.38Mar 3.98 4.41 4.95 5.64 3.63 4.01 4.06Apr 4.02 4.30 4.87 5.63 3.59 3.85 3.82May 3.98 4.29 4.93 5.64 3.54 3.99 3.83Jun 4.45 4.86 5.54 6.26 3.45 3.81 3.95
Jul 4.42 4.67 5.68 6.27 3.40 3.84 4.11Aug 4.43 4.80 5.72 6.28 3.24 3.85 3.93Sep 4.47 4.82 5.69 .. 3.24 3.90 3.91Oct 4.32 4.82 5.67 .. 3.30 3.86 3.91Nov 4.10 4.88 5.71 .. 3.30 3.89 3.98Dec 4.05 4.84 5.67 .. 3.31 3.92 3.97
Source: Bank of England
End of month observation:Unsecured lending rates Deposit rates banks and building societies
Personal loan Instant accessaccount unrestricted
£10,000 Credit card Overdraft withdraw al Notice accounts Cash ISA
I4YS I4YR I4YT THAK WTTA I4YU2007 Dec 7.88 15.11 17.76 2.78 3.98 5.29
2008 Jan 7.86 14.80 17.50 2.77 3.70 5.06Feb 7.71 14.72 17.58 2.69 3.69 5.06Mar 7.93 14.75 17.57 2.47 3.42 4.81Apr 8.60 15.26 17.54 2.42 3.30 4.81May 8.54 15.49 17.40 2.19 2.99 4.56Jun 8.53 15.66 17.91 2.26 3.07 4.56
Jul 8.64 15.66 17.91 2.24 3.14 4.56Aug 9.24 15.64 17.91 2.31 3.17 4.54Sep 9.57 15.64 18.04 2.46 3.24 4.49Oct 9.16 15.58 18.04 2.39 3.03 4.36Nov 9.30 15.59 18.05 1.68 2.30 3.83Dec 9.30 15.58 18.04 0.49 0.90 2.10
2009 Jan 9.14 16.09 18.02 0.21 0.36 1.38Feb 9.14 15.72 18.63 0.16 0.17 0.96Mar 9.46 15.73 18.63 0.19 0.17 0.63Apr 9.40 15.72 18.62 0.16 0.22 0.42May 9.45 15.87 18.61 0.17 0.23 0.41Jun 10.32 15.87 18.97 0.17 0.23 0.42
Jul 10.39 15.86 18.97 0.17 0.24 0.42Aug 10.69 15.89 18.97 0.17 0.43 0.41Sep 10.45 15.86 18.96 0.17 0.39 0.40Oct 11.10 15.89 18.96 0.17 0.38 0.40Nov 11.08 15.89 18.96 0.17 0.34 0.41Dec 11.08 16.25 18.97 0.17 0.33 0.41
Quoted interest rates are calculated by weighting together individual ratesadver tised by banks and building societies for lending and deposit products.For more infor mation see: www.bankofengland.co.uk /mfsd/iadb/notesi-adb/household_int.htm
Source: Bank of England
152
Page 20
7.1M Local authorities interest rates: Public Works Loan BoardInterest rates for fixed rate loans
Per cent per annum
Over 1 1/2 Over 4 1/2 Over 9 1/2 Over 14 1/2 Over 19 1/2 Over 24 1/2 Over 29 1/2 Over 34 1/2 Over 39 1/2 Over 44 1/2 Over 49 1/2years but years but years but years but years but years but years but years but years but years but years but
not over 2 not over 5 not over 10 not over 15 not over 20 not over 25 not over 30 not over 35 not over 40 not over 45 not over 50
Repayable by equal half-yearly instalments (Annuity)
September 1 0.99 1.87 2.89 3.5 3.84 3.99 4.07 4.13 4.19 4.24 4.29September 8 0.97 1.9 2.96 3.58 3.93 4.1 4.18 4.23 4.26 4.28 4.32September 15 0.98 1.9 2.95 3.56 3.91 4.07 4.14 4.17 4.2 4.21 4.25September 22 0.97 1.92 3.04 3.7 4.03 4.16 4.2 4.23 4.26 4.28 4.32September 29 0.92 1.81 2.91 3.59 3.95 4.09 4.15 4.18 4.22 4.24 4.28
October 6 0.90 1.74 2.74 3.36 3.73 3.93 4.02 4.07 4.1 4.12 4.16October 13 0.92 1.72 2.71 3.34 3.72 3.91 4.00 4.06 4.1 4.13 4.18October 20 1.04 1.9 2.94 3.58 3.94 4.12 4.21 4.26 4.29 4.3 4.34October 27 1.07 1.97 3.05 3.68 4.04 4.22 4.29 4.32 4.32 4.32 4.33
November 3 1.09 1.99 3.05 3.66 4.02 4.2 4.28 4.31 4.32 4.31 4.33November 10 0.98 1.96 3.15 3.83 4.2 4.37 4.44 4.46 4.46 4.44 4.45November 17 1.03 1.92 3.06 3.75 4.13 4.31 4.38 4.4 4.4 4.39 4.4November 24 0.96 1.85 2.99 3.67 4.04 4.21 4.28 4.29 4.28 4.27 4.27
December 1 0.93 1.8 2.89 3.54 3.91 4.11 4.21 4.24 4.24 4.22 4.23December 8 0.94 1.81 2.96 3.69 4.09 4.29 4.36 4.38 4.38 4.37 4.37December 15 0.97 1.86 3.06 3.82 4.24 4.42 4.49 4.5 4.49 4.47 4.47December 22 0.97 1.87 3.08 3.86 4.26 4.43 4.48 4.48 4.46 4.42 4.42
Januar y 5 1.06 2.01 3.23 3.97 4.34 4.5 4.54 4.55 4.53 4.5 4.49Januar y 12 1.0 1.97 3.24 4.0 4.37 4.51 4.56 4.56 4.56 4.54 4.55Januar y 19 1.03 1.98 3.22 3.96 4.32 4.47 4.51 4.52 4.51 4.5 4.5Januar y 26 1.04 1.98 3.2 3.94 4.31 4.47 4.53 4.54 4.53 4.51 4.52
Repayable by equal half-yearly instalments of principal and interest on the balance (EIP)
September 1 0.99 1.85 2.83 3.4 3.73 3.92 4.01 4.06 4.11 4.15 4.19September 8 0.97 1.88 2.89 3.47 3.82 4.02 4.12 4.18 4.21 4.24 4.26September 15 0.98 1.88 2.88 3.46 3.8 3.99 4.09 4.13 4.16 4.18 4.2September 22 0.97 1.9 2.96 3.59 3.93 4.1 4.17 4.2 4.22 4.24 4.26September 29 0.91 1.79 2.84 3.47 3.84 4.02 4.1 4.14 4.17 4.19 4.22
October 6 0.90 1.72 2.67 3.25 3.62 3.83 3.95 4.01 4.05 4.08 4.1October 13 0.91 1.7 2.65 3.23 3.6 3.82 3.93 4.00 4.04 4.07 4.1October 20 1.03 1.88 2.87 3.47 3.83 4.03 4.14 4.2 4.24 4.26 4.28October 27 1.07 1.95 2.97 3.57 3.92 4.12 4.23 4.28 4.31 4.32 4.32
November 3 1.08 1.97 2.98 3.56 3.9 4.1 4.22 4.28 4.3 4.32 4.32November 10 0.98 1.94 3.07 3.71 4.07 4.27 4.38 4.43 4.46 4.46 4.46November 17 1.03 1.9 2.98 3.63 4.0 4.21 4.32 4.37 4.4 4.4 4.4November 24 0.96 1.83 2.91 3.55 3.92 4.12 4.23 4.27 4.29 4.29 4.28
December 1 0.93 1.78 2.82 3.43 3.79 4.01 4.13 4.2 4.23 4.24 4.24December 8 0.94 1.79 2.88 3.57 3.96 4.18 4.3 4.35 4.37 4.38 4.38December 15 0.97 1.84 2.97 3.69 4.1 4.32 4.43 4.48 4.5 4.5 4.49December 22 0.97 1.85 2.99 3.72 4.13 4.34 4.44 4.47 4.48 4.47 4.46
Januar y 5 1.06 1.99 3.14 3.83 4.22 4.41 4.51 4.54 4.55 4.54 4.53Januar y 12 1.0 1.95 3.14 3.86 4.25 4.44 4.52 4.55 4.56 4.56 4.56Januar y 19 1.03 1.96 3.13 3.83 4.2 4.39 4.47 4.5 4.52 4.52 4.51Januar y 26 1.04 1.96 3.11 3.8 4.18 4.38 4.48 4.52 4.54 4.54 4.53
Principal repayable at maturity
September 1 1.45 2.76 3.71 4.0 4.1 4.19 4.24 4.29 4.31 4.3 4.27September 8 1.46 2.81 3.79 4.11 4.21 4.26 4.29 4.32 4.35 4.35 4.35September 15 1.46 2.8 3.78 4.08 4.15 4.19 4.22 4.25 4.27 4.27 4.26September 22 1.46 2.88 3.91 4.17 4.22 4.26 4.29 4.32 4.34 4.33 4.32September 29 1.38 2.76 3.81 4.1 4.16 4.21 4.25 4.28 4.3 4.3 4.28
October 6 1.34 2.6 3.59 3.94 4.05 4.1 4.12 4.16 4.18 4.19 4.19October 13 1.33 2.57 3.57 3.92 4.04 4.1 4.14 4.18 4.22 4.23 4.24October 20 1.48 2.8 3.8 4.13 4.23 4.28 4.3 4.33 4.35 4.36 4.36October 27 1.54 2.9 3.9 4.22 4.31 4.32 4.31 4.33 4.33 4.34 4.34
November 3 1.56 2.9 3.87 4.21 4.3 4.32 4.31 4.32 4.33 4.34 4.34November 10 1.48 2.98 4.05 4.37 4.46 4.46 4.44 4.44 4.45 4.44 4.45November 17 1.49 2.89 3.97 4.31 4.4 4.4 4.39 4.39 4.4 4.39 4.4November 24 1.41 2.82 3.89 4.22 4.29 4.29 4.26 4.26 4.25 4.25 4.25
December 1 1.37 2.74 3.77 4.12 4.23 4.24 4.22 4.22 4.22 4.21 4.22December 8 1.38 2.8 3.93 4.29 4.37 4.38 4.36 4.37 4.37 4.36 4.37December 15 1.42 2.88 4.07 4.42 4.5 4.49 4.47 4.46 4.46 4.45 4.45December 22 1.43 2.9 4.1 4.43 4.48 4.46 4.42 4.4 4.39 4.38 4.38
Januar y 5 1.55 3.05 4.19 4.5 4.55 4.53 4.49 4.48 4.47 4.47 4.47Januar y 12 1.5 3.05 4.22 4.52 4.56 4.56 4.54 4.54 4.53 4.52 4.51Januar y 19 1.52 3.04 4.18 4.47 4.51 4.52 4.5 4.5 4.49 4.47 4.46Januar y 26 1.52 3.02 4.16 4.47 4.54 4.53 4.51 4.51 4.5 4.49 4.48
Source: HM Treasur y153
Page 21
7.1O Average money rates and yields (13.15)
Per cent per annum
1 2 Selected retail banks - gross interest Br itish government securities
Instant access accounts 90 day accounts Nominal zero coupon yields3
3 monthBase low medium medium high Sterling Short dated Medium dated Long dated 3.5% War Loan
rate balance balance balance balance Interbank 5 years 10 years 20 years Flat yield
AMIH AJOU AJNU AJOV AJTQ AMIJ AJTS AJTT AJTU AMIL2005 4.65 .. .. .. .. 4.69 4.33 4.37 4.33 4.382006 4.64 .. .. .. .. 4.80 4.57 4.43 4.17 4.172007 5.51 .. .. .. .. 5.96 5.11 4.92 4.56 4.542008 4.68 .. .. .. .. 5.50 4.28 4.59 4.66 4.502009 0.64 .. .. .. .. 1.19 2.76 3.75 4.45 4.45
2000 Q3 6.00 .. .. .. .. 6.12 5.63 5.17 4.50 4.88Q4 6.00 .. .. .. .. 5.99 5.32 4.96 4.44 4.73
2001 Q1 5.86 .. .. .. .. 5.64 4.99 4.76 4.40 4.66Q2 5.36 .. .. .. .. 5.23 5.12 5.02 4.87 5.10Q3 5.05 .. .. .. .. 4.93 5.07 4.96 4.82 5.04Q4 4.23 .. .. .. .. 4.10 4.72 4.72 4.70 4.80
2002 Q1 4.00 .. .. .. .. 4.01 5.02 4.97 4.80 5.03Q2 4.00 .. .. .. .. 4.10 5.16 5.16 5.02 5.23Q3 4.00 .. .. .. .. 3.95 4.58 4.70 4.60 4.77Q4 4.00 .. .. .. .. 3.92 4.36 4.59 4.58 4.67
2003 Q1 3.85 .. .. .. .. 3.73 4.00 4.34 4.47 4.50Q2 3.75 .. .. .. .. 3.57 3.89 4.28 4.54 4.51Q3 3.53 .. .. .. .. 3.50 4.26 4.57 4.72 4.72Q4 3.65 .. .. .. .. 3.86 4.78 4.92 4.82 4.86
2004 Q1 3.91 .. .. .. .. 4.11 4.60 4.73 4.68 4.68Q2 4.22 .. .. .. .. 4.51 4.99 5.04 4.87 4.87Q3 4.65 .. .. .. .. 4.85 4.95 4.95 4.72 4.73Q4 4.75 .. .. .. .. 4.82 4.56 4.62 4.50 4.52
2005 Q1 4.75 .. .. .. .. 4.85 4.57 4.60 4.51 4.56Q2 4.75 .. .. .. .. 4.83 4.34 4.40 4.39 4.44Q3 4.59 .. .. .. .. 4.55 4.17 4.24 4.27 4.32Q4 4.50 .. .. .. .. 4.56 4.26 4.25 4.18 4.23
2006 Q1 4.50 .. .. .. .. 4.53 4.21 4.13 3.94 3.96Q2 4.50 .. .. .. .. 4.64 4.62 4.55 4.31 4.31Q3 4.66 .. .. .. .. 4.85 4.70 4.55 4.27 4.26Q4 4.89 .. .. .. .. 5.17 4.76 4.50 4.16 4.15
2007 Q1 5.22 .. .. .. .. 5.49 5.05 4.76 4.36 4.37Q2 5.40 .. .. .. .. 5.72 5.38 5.10 4.69 4.69Q3 5.74 .. .. .. .. 6.29 5.28 5.09 4.67 4.63Q4 5.69 .. .. .. .. 6.30 4.73 4.74 4.54 4.50
2008 Q1 5.35 .. .. .. .. 5.68 4.24 4.51 4.50 4.45Q2 5.03 .. .. .. .. 5.86 4.69 4.87 4.79 4.64Q3 5.00 .. .. .. .. 5.81 4.63 4.75 4.72 4.58Q4 3.37 .. .. .. .. 4.65 3.57 4.22 4.63 4.34
2009 Q1 1.07 .. .. .. .. 2.06 2.62 3.63 4.42 4.28Q2 0.50 .. .. .. .. 1.33 2.74 3.68 4.62 4.59Q3 0.50 .. .. .. .. 0.82 2.91 3.83 4.42 4.45Q4 0.50 .. .. .. .. 0.59 2.75 3.85 4.35 4.49
1 The monthly rates are now shown in Table 7.1J Par t 2.2 Ceased to be compiled as from Q2 1999.3 The model used to derive these estimates is a spline-based technique,
known as the "Var iable Roughness Penalty" (VRP) model which replacesthe for merly used Svensson method. For further infor mation see "Supple-mentar y Infor mation".
Source: Bank of England
154
Page 22
7.2A Consumer Price index, Retail Prices Index and other selected indices
Consumer prices index All items(CPI)1,2 retail prices index (RPI) All items RPI excluding
mor tgage interest mortgage interest paymentspayments (RPIX) and indirect taxes (RPIY)3
Percentage Percentage Percentage Percentagechange Index change Index change Index change
Index over (Jan 13, over (Jan 13, over (Jan 13, over(2005=100) 12 months 1987=100) 12 months 1987=100) 12 months 1987=100) 12 months
D7BT D7G7 CHAW CZBH CHMK CDKQ CBZW CBZX2005 100.0 2.1 192.0 2.8 188.2 2.3 179.4 2.22006 102.3 2.3 198.1 3.2 193.7 2.9 184.8 3.02007 104.7 2.3 206.6 4.3 199.9 3.2 190.8 3.22008 108.5 3.6 214.8 4.0 208.5 4.3 199.2 4.42009 110.8 2.2 213.7 −0.5 212.6 2.0 204.8 2.8
2006 Q2 102.1 2.3 197.6 3.0 193.4 2.8 184.3 2.8Q3 102.8 2.4 199.3 3.5 194.8 3.2 185.9 3.3Q4 103.6 2.7 201.4 4.0 196.4 3.5 187.6 3.6
2007 Q1 103.7 2.9 203.0 4.5 197.2 3.7 188.4 3.9Q2 104.8 2.6 206.3 4.4 200.0 3.4 190.7 3.5Q3 104.6 1.8 207.1 3.9 200.1 2.7 190.9 2.7Q4 105.7 2.1 209.8 4.2 202.5 3.1 193.3 3.0
2008 Q1 106.2 2.4 211.1 4.0 204.1 3.5 195.0 3.5Q2 108.3 3.4 215.3 4.4 208.8 4.4 199.1 4.4Q3 109.7 4.8 217.4 5.0 210.8 5.3 201.3 5.4Q4 109.8 3.9 215.5 2.7 210.2 3.8 201.5 4.2
2009 Q1 109.4 3.0 210.9 −0.1 209.0 2.4 201.5 3.3Q2 110.6 2.1 212.6 −1.3 211.8 1.4 203.9 2.4Q3 111.3 1.5 214.4 −1.4 213.6 1.3 205.7 2.2Q4 112.1 2.1 216.9 0.6 216.0 2.8 208.2 3.3
2007 Jan 103.2 2.7 201.6 4.2 196.1 3.5 187.3 3.7Feb 103.7 2.8 203.1 4.6 197.1 3.7 188.4 3.9Mar 104.2 3.1 204.4 4.8 198.3 3.9 189.5 4.0Apr 104.5 2.8 205.4 4.5 199.3 3.6 190.0 3.7May 104.8 2.5 206.2 4.3 200.0 3.3 190.7 3.4Jun 105.0 2.4 207.3 4.4 200.7 3.3 191.4 3.3
Jul 104.4 1.9 206.1 3.8 199.4 2.7 190.1 2.6Aug 104.7 1.8 207.3 4.1 200.1 2.7 190.9 2.6Sep 104.8 1.8 208.0 3.9 200.8 2.8 191.6 2.8Oct 105.3 2.1 208.9 4.2 201.6 3.1 192.3 3.0Nov 105.6 2.1 209.7 4.3 202.4 3.2 193.2 3.0Dec 106.2 2.1 210.9 4.0 203.5 3.1 194.4 3.1
2008 Jan 105.5 2.2 209.8 4.1 202.7 3.4 193.5 3.3Feb 106.3 2.5 211.4 4.1 204.3 3.7 195.2 3.6Mar 106.7 2.5 212.1 3.8 205.3 3.5 196.3 3.6Apr 107.6 3.0 214.0 4.2 207.2 4.0 197.5 3.9May 108.3 3.3 215.1 4.3 208.7 4.4 199.0 4.4Jun 109.0 3.8 216.8 4.6 210.4 4.8 200.8 4.9
Jul 109.0 4.4 216.5 5.0 210.0 5.3 200.4 5.4Aug 109.7 4.7 217.2 4.8 210.6 5.2 201.2 5.4Sep 110.3 5.2 218.4 5.0 211.8 5.5 202.4 5.6Oct 110.0 4.5 217.7 4.2 211.1 4.7 201.7 4.9Nov 109.9 4.1 216.0 3.0 210.2 3.9 200.8 3.9Dec 109.5 3.1 212.9 0.9 209.2 2.8 201.9 3.9
2009 Jan 108.7 3.0 210.1 0.1 207.5 2.4 200.0 3.4Feb 109.6 3.2 211.4 − 209.5 2.5 202.1 3.5Mar 109.8 2.9 211.3 −0.4 209.9 2.2 202.5 3.2Apr 110.1 2.3 211.5 −1.2 210.7 1.7 202.9 2.7May 110.7 2.2 212.8 −1.1 212.0 1.6 204.1 2.6Jun 111.0 1.8 213.4 −1.6 212.6 1.0 204.7 1.9
Jul 110.9 1.8 213.4 −1.4 212.6 1.2 204.7 2.1Aug 111.4 1.6 214.4 −1.3 213.6 1.4 205.8 2.3Sep 111.5 1.1 215.3 −1.4 214.5 1.3 206.5 2.0Oct 111.7 1.5 216.0 −0.8 215.1 1.9 207.3 2.8Nov 112.0 1.9 216.6 0.3 215.8 2.7 207.9 3.5Dec 112.6 2.9 218.0 2.4 217.2 3.8 209.5 3.8
1 Prior to 10 December 2003, the consumer prices index (CPI) was publishedin the UK as the harmonised index of consumer prices (HICP).
2 Inflation rates prior to 1997 and index lev els prior to 1996 are estimated.Fur ther details are given in Economic Trends No. 541 December 1998.These details are also available on the National Statistics website:http://www.statistics.gov.uk/cci/ar ticle.asp?ID=31&Pos=3&Col-Rank=2&Rank=720
3 The taxes excluded are council tax, VAT, duties, vehicle excise duty, insurancetax and air passenger duty.
Source: National Statistics
155